Weak response of saltmarsh infauna to ecosystem-wide nutrient
10
Weak response of saltmarsh infauna to ecosystem-wide nutrient enrichment and fish predator reduction: A four-year study David Samuel Johnson ⁎, John W. Fleeger Department of Biological Sciences, Louisiana State University, Baton Rouge, LA, 70803, USA abstract article info Article history: Received 23 July 2008 Received in revised form 9 January 2009 Accepted 5 March 2009 Keywords: Bottom-up Ecosystem experiments Multiple stressors Salt marsh Top–down We examined the effect of whole-ecosystem manipulations of predator removal and nutrient enrichment on saltmarsh macroinfauna in the Plum Island Estuary, Massachusetts. Nitrate and phosphate loading rates were increased 10× above background levels in experimental creeks, and we significantly reduced (by 60%) the abundance of the killifish, Fundulus heteroclitus, a key predator in this system. Two creek pairs were manipulated; Creek Pair 1 for three growing seasons and Creek Pair 2 for one. Infaunal responses were examined in four habitats along the inundation gradient: mudflat, creek wall, Spartina alterniflora, and S. patens habitats. Although benthic microalgae increased synergistically in our treatments, we detected no long-term, population-level numerical response by any taxon. Similarly, no long-term species diversity or community responses were observed. However, nutrient enrichment increased the population biomass of the polychaete Manayunkia aestuarina in the creek wall habitat and the oligochaete Cernosvitoviella immota in the S. alterniflora habitat. No numerical or biomass responses of infauna were detected in predator removal treatments although indirect effects associated with killifish reduction may have contributed to an ephemeral interaction between nutrient addition and predator reduction in S. patens habitat. Our data suggest that population and community responses between benthic microalgae and macroinfauna are not tightly coupled even though some species benefit from increased benthic algae biomass by achieving larger body size. © 2009 Elsevier B.V. All rights reserved. 1. Introduction As prey for higher tropic levels and consumers of primary producers that respond to nutrient enrichment, saltmarsh benthic invertebrates may be key indicators for examining the effect of anthropogenic activities (Posey et al., 1999, 2002; Sardá et al., 1998; Fleeger et al., 2008). Examinations of saltmarsh invertebrates have focused on spatial and temporal distributions (Kneib, 1984; Rader, 1984; Johnson et al., 2007), patterns of succession in created marshes (Craft and Sacco, 2003), changes in benthic community structure associated with invasive macrophytes (Fell et al., 1998), the effects of contaminated sediment (Carman et al., 1997), long-term nutrient enrichment (Sardá et al., 1995), predator additions (Kneib and Stiven, 1982), and the effect of simultaneous short-term predator removal and nutrient enrichment (Posey et al., 1999, 2002). However, little work has examined the long-term effect of simultaneous alterations of trophic structure and nutrient levels on saltmarsh invertebrates. Experimental manipulations of nutrients and predators have been used to test the relative importance of top–down (consumer) and bottom–up (resource) controls on benthic food webs (Posey et al., 1999; Deegan et al., 2007). Although short-term and small spatial- scale (e.g., 1 m 2 ) studies have demonstrated the potential importance of top–down and bottom–up factors on saltmarsh infauna (e.g., Posey et al., 2002), long-term, ecosystem-level experiments may be useful in observing complex food web dynamics such as behavior and feedbacks. For instance, in a four-year, kilometer-scale fertilization of a tundra river, Peterson et al. (1993) found that nutrients increased algal biomass, insect abundances, and fish biomass. In later years, however, insects began exerting strong top–down grazing pressure on epilithic algae (Peterson et al., 1993). Small-scale caging experiments suggest top–down and bottom–up effects operate independently for saltmarsh infauna (i.e., no interaction; Foreman et al., 1995; Posey et al., 1999, 2002; Fleeger et al., 2008). However, scale may affect trophic interactions (Van de Koppel et al., 2006) and processes may operate at different spatial and temporal scales, making the detection of interactive effects problematic (Posey et al., 1999). Increased resources (light, nutrients) stimulate benthic microalgae (BMA) biomass and saltmarsh infauna may respond with increased or decreased numbers and/or biomass (Sardá et al., 1996; Posey et al., 2002; Deegan et al., 2007) or remain unchanged (Wiltse et al., 1984). Excessive organic matter in estuaries leads to high decomposition rates, hypoxia and reduced invertebrate densities (Diaz and Rosen- berg, 1995; Kemp et al., 2005). Removal of predators typically results in increased infauna numbers (Wiltse et al., 1984; Foreman et al., Journal of Experimental Marine Biology and Ecology 373 (2009) 35–44 ⁎ Corresponding author. Tel.: +1225 578 1738; fax: +1 225 578 2597. E-mail address: [email protected] (D.S. Johnson). 0022-0981/$ – see front matter © 2009 Elsevier B.V. All rights reserved. doi:10.1016/j.jembe.2009.03.003 Contents lists available at ScienceDirect Journal of Experimental Marine Biology and Ecology journal homepage: www.elsevier.com/locate/jembe
Transcript of Weak response of saltmarsh infauna to ecosystem-wide nutrient

Journal of Experimental Marine Biology and Ecology 373 (2009) 35–44
Contents lists available at ScienceDirect
Journal of Experimental Marine Biology and Ecology
j ourna l homepage: www.e lsev ie r.com/ locate / jembe
Weak response of saltmarsh infauna to ecosystem-wide nutrient enrichment and fishpredator reduction: A four-year study
David Samuel Johnson ⁎, John W. FleegerDepartment of Biological Sciences, Louisiana State University, Baton Rouge, LA, 70803, USA
⁎ Corresponding author. Tel.: +1 225 578 1738; fax: +E-mail address: [email protected] (D.S. Johnson).
0022-0981/$ – see front matter © 2009 Elsevier B.V. Adoi:10.1016/j.jembe.2009.03.003
a b s t r a c t
a r t i c l e i n f oArticle history:Received 23 July 2008Received in revised form 9 January 2009Accepted 5 March 2009
Keywords:Bottom-upEcosystem experimentsMultiple stressorsSalt marshTop–down
We examined the effect of whole-ecosystem manipulations of predator removal and nutrient enrichment onsaltmarsh macroinfauna in the Plum Island Estuary, Massachusetts. Nitrate and phosphate loading rates wereincreased 10× above background levels in experimental creeks, and we significantly reduced (by 60%) theabundance of the killifish, Fundulus heteroclitus, a key predator in this system. Two creek pairs weremanipulated; Creek Pair 1 for three growing seasons and Creek Pair 2 for one. Infaunal responses wereexamined in four habitats along the inundation gradient: mudflat, creek wall, Spartina alterniflora, andS. patens habitats. Although benthic microalgae increased synergistically in our treatments, we detected nolong-term, population-level numerical response by any taxon. Similarly, no long-term species diversity orcommunity responses were observed. However, nutrient enrichment increased the population biomass ofthe polychaete Manayunkia aestuarina in the creek wall habitat and the oligochaete Cernosvitoviella immotain the S. alterniflora habitat. No numerical or biomass responses of infauna were detected in predator removaltreatments although indirect effects associated with killifish reduction may have contributed to anephemeral interaction between nutrient addition and predator reduction in S. patens habitat. Our datasuggest that population and community responses between benthic microalgae and macroinfauna are nottightly coupled even though some species benefit from increased benthic algae biomass by achieving largerbody size.
© 2009 Elsevier B.V. All rights reserved.
1. Introduction
As prey for higher tropic levels and consumers of primaryproducers that respond to nutrient enrichment, saltmarsh benthicinvertebrates may be key indicators for examining the effect ofanthropogenic activities (Posey et al., 1999, 2002; Sardá et al., 1998;Fleeger et al., 2008). Examinations of saltmarsh invertebrates havefocused on spatial and temporal distributions (Kneib, 1984; Rader,1984; Johnson et al., 2007), patterns of succession in created marshes(Craft and Sacco, 2003), changes in benthic community structureassociated with invasive macrophytes (Fell et al., 1998), the effects ofcontaminated sediment (Carman et al., 1997), long-term nutrientenrichment (Sardá et al., 1995), predator additions (Kneib and Stiven,1982), and the effect of simultaneous short-term predator removaland nutrient enrichment (Posey et al., 1999, 2002). However, littlework has examined the long-term effect of simultaneous alterations oftrophic structure and nutrient levels on saltmarsh invertebrates.
Experimental manipulations of nutrients and predators have beenused to test the relative importance of top–down (consumer) andbottom–up (resource) controls on benthic food webs (Posey et al.,
1 225 578 2597.
ll rights reserved.
1999; Deegan et al., 2007). Although short-term and small spatial-scale (e.g., 1 m2) studies have demonstrated the potential importanceof top–down and bottom–up factors on saltmarsh infauna (e.g., Poseyet al., 2002), long-term, ecosystem-level experiments may be useful inobserving complex food web dynamics such as behavior andfeedbacks. For instance, in a four-year, kilometer-scale fertilizationof a tundra river, Peterson et al. (1993) found that nutrients increasedalgal biomass, insect abundances, and fish biomass. In later years,however, insects began exerting strong top–down grazing pressure onepilithic algae (Peterson et al., 1993). Small-scale caging experimentssuggest top–down and bottom–up effects operate independently forsaltmarsh infauna (i.e., no interaction; Foreman et al., 1995; Poseyet al., 1999, 2002; Fleeger et al., 2008). However, scale may affecttrophic interactions (Van de Koppel et al., 2006) and processes mayoperate at different spatial and temporal scales, making the detectionof interactive effects problematic (Posey et al., 1999).
Increased resources (light, nutrients) stimulate benthic microalgae(BMA) biomass and saltmarsh infauna may respond with increased ordecreased numbers and/or biomass (Sardá et al., 1996; Posey et al.,2002; Deegan et al., 2007) or remain unchanged (Wiltse et al., 1984).Excessive organic matter in estuaries leads to high decompositionrates, hypoxia and reduced invertebrate densities (Diaz and Rosen-berg, 1995; Kemp et al., 2005). Removal of predators typically resultsin increased infauna numbers (Wiltse et al., 1984; Foreman et al.,

Fig. 1. Upper figure is a satellite photograph (MassGIS Orthophoto 2002) of the Rowley River region salt marshes of the Plum Island Estuary, MA. SW=Sweeney Creek, WE=WestCreek, CL=Clubhead Creek, NE=Nelson Creek. Lower figure is a profile of sampled salt marsh habitats (not drawn to scale) with size ranges of each habitat. MF=mudflat;CW=creek wall; TSA=Tall-form Spartina alterniflora; SP=Spartina patens; SSA=Short-form S. alterniflora.
36 D.S. Johnson, J.W. Fleeger / Journal of Experimental Marine Biology and Ecology 373 (2009) 35–44
1995; Posey et al., 1999; Posey et al., 2002). Infaunal responses areoften taxon- and habitat-specific (e.g., Posey et al., 2006; Fleeger et al.,2008) and the magnitude of consumer and nutrient effects vary alongenvironmental gradients like salinity (Deegan et al., 2007; Fleegeret al., 2008).
The purpose of this paper was to examine top–down and bottom–
up effects on saltmarsh infauna at relatively large spatial and long-term temporal scales. As part of a larger, multi-disciplinary studyexamining the effect of ecosystem-wide manipulations of trophicstructure and nutrient availability on a Massachusetts salt marsh, weexamined the response of the macroinfaunal community during threeyears of manipulation. We examined population-level (density and
biomass of selected taxa) and community-level (similarity anddiversity indices) responses of macroinfauna. Initial responses ofmacroinfauna to one summer season of treatments are described inFleeger et al. (2008). Here, we examine the effect of two additionalfield seasons ofmanipulation onmacroinfauna and add a second creekpair to examine replication of short-term responses. We predicted (i)nutrient additionswould stimulate infauna abundance and biomass astheir food source, benthic microalgae, became more abundant ornitrogen-enriched; (ii) predator removal would elicit increasedinfauna abundances and biomass as predation pressure was reducedon the community; and (iii) the effect of combined treatments wouldbe additive (i.e., no interactions).

37D.S. Johnson, J.W. Fleeger / Journal of Experimental Marine Biology and Ecology 373 (2009) 35–44
2. Methods
2.1. Study site
Our study is part of the TIDE (Trophic cascades and Interactingcontrol processes in a Detritus-based Ecosystem, http://ecosystems.mbl.edu/Tide/) project. TIDE is a multi-institutional, multi-disciplinaryproject using ecosystem-wide manipulations to examine the effect ofnutrient addition and the reduction of a key predator (the killifishFundulus heteroclitus) on saltmarsh ecosystems. These manipulationswere conducted in four intertidal saltmarsh creeks—Sweeney, West,Clubhead, and Nelson—in the Plum Island Estuary (PIE), Massachusetts,USA (Fig. 1). These creeks are relatively pristine (background nutrients:b5 µM NO3
−; ~1 µM PO4−3). The four intertidal creeks exhibit similar
physical dimensions, water chemistry, plant and infaunal communities(details in Deegan et al., 2007 and Johnson et al., 2007). We examinedmacroinfauna in four habitats along an inundation gradient: two creekhabitats and twomarsh platformhabitats (Fig.1). Themudflat habitat isa creek habitat of poorly consolidated sediments without macrophytesbut with abundant migrating diatoms, chlorophytes and cyanobacteria(Galván, 2008). The creek-wall habitat is a steep, almost vertical wallabout 1.5 m in height, with cohesive sediments and an approximately30-cmwide band of macroalgae and filamentous algae. The creek-bankhabitat is dominated by a zone of tall-form Spartina alterniflora(N130 cm height in late summer). The marsh platform habitat consistsof an expansive area dominated by a dense canopy of S. patens. PIE has amean tidal amplitude of ~3 m during spring tides, and mudflat, creekwall and creek-bank S. alterniflora habitats are inundated twice dailywhile the S. patens habitat is infrequently flooded, inundated onlyduring spring tides.
2.2. Experimental design
A matched-pair design was used to pair Sweeney and West Creeks(Pair 1) and Clubhead and Nelson Creeks (Pair 2). Pair 1 creeks weremanipulated for three years (2004–2006) and Pair 2 creeks weremanipulated for 1 year (2005). In Sweeney and Clubhead Creeks,nutrient enrichment of 70 µM NO3− and 4 µM PO4
−3 (15×overbackground) was achieved by pumping a concentrated solution ofnutrients to the water of every flooding tide during the growing season(mid-May–Oct.; ~150 d). The pump rate was adjusted, based on ahydrologic model, every 10 min throughout each incoming tide tomaintain constant N and P concentrations in incoming waters (Deeganet al., 2007). Watershed nutrient loading averaged 30 g N m−2 y−1 in2004 (~10×background loading) but spatial variation across thelandscapewas significant. Creek-bankS. alterniflora experienced a highernutrient loading than the less frequently flooded S. patens (Deegan et al.,2007). Fertilizer was not added to reference creeks (West and Nelson).
A branch of each creek was selected for large-scale removal of thekillifish, F. heteroclitus. This was achieved by stretching a Vexar (6.35-mm mesh) block net across the entrance of the branch from June–September 2004, coupled with continuous fish trapping and removal.This method of exclusion is expected to produce fewer artifacts thantraditional small-scale exclusions (Virnstein,1978). A 60% reduction inkillifish density was achieved (Deegan et al., 2007). Reduction of largekillifish [N40 mm total length (TL)] was greater than small killifish(b40 mm TL); although a 40% reduction of small killifish wasobserved. A full factorial design was employed with four treatments:(1) ambient nutrients/ambient fish (control) (2) ambient nutrients/low fish, (3) nutrient additions/ambient fish, and (4) nutrientadditions/low fish.
2.3. Benthic sampling
Macroinfauna were sampled by hand coring at low tide. Pre-treatment collections were taken in June (17–19), July (9–10), and
August (4–5) 2003 and post-treatment collections were taken in June(14–15), July (12–13) August (2–3) 2004; June (26–28), July (28–31)and September (12–15) 2005; and August (15–16) 2006. In each creekbranch, three transects were selected at ~50, 100, and 150 m from theconfluence of the two branches. Each transect (50 m in length and20 m in width) was stratified along an inundation gradient into thefour habitat zones discussed above.
In 2003 collections, a single macroinfauna sample was taken ateach sampling site (habitat within a transect within a branch within acreek), whereas two samples were taken at each site in 2004–2006.Macroinfauna cores (6.6-cm inner diameter) were taken to a depth of5 cm. This method inadequately samples larger, more mobile infauna.For instance, the relatively large polychaete Nereis diversicolor canreach up to 30 cm in body length and large size classes may not besampled by the corer. Cores were placed on ice in the field, and thentransported to the laboratory where they were fixed in a 10% formalinand Rose Bengal solution. After a minimum of two days, cores weresieved through a 1-mm sieve stacked on top of a 500-µm sieve. Largedebris and roots retained on the 1-mm sieve were discarded aftervisual inspection and removal of large invertebrates. Animals weresorted to the lowest possible taxon. Annelids constituted 94% of theinfauna community and are the focus of this study, although thetanaid crustacean Leptochelia savignyi and greenhead fly larvae Taba-nus sp.—low density, but large prey items for killifish—were alsoincluded in biomass analyses. Species diversity—estimated as rich-ness, Shannon's value (loge), and Pielou's evenness—of annelids wascalculated for each sample using PRIMER (v. 6.1.6).
2.4. Population analysis
We used a before–after, control–impact (BACI) experimentaldesign which pairs experimental units and accounts for variabilitythat may contribute to error in a completely randomized design(Underwood, 1994). The BACI design is a powerful method fordetecting impacts because it incorporates both temporal and spatialvariation by observing reference and impact sites over time (Parkerand Wiens, 2005). We used a BACI-type ANOVA to analyze changes inannelid densities and diversities for each creek pair separately.Previous analysis (Johnson et al., 2007) suggested that varianceassociated with transects for macroinfauna populations did notcontribute significantly to spatial variation in PIE (i.e., no spatialautocorrelation within branches). Transects were therefore consid-ered replicates and pooled;
n= branch = 3 in 2003 and n = branch = 6 in 2004–2006:
To detect interactions between fertilization and predator removal,we performed analyses directly on abundance values instead of thedifferences between the control and treatment values. Data wereanalyzed as generalized linear mixed models (GLMMs) using ProcGLIMMIX (SAS v. 9.1.3). All data were loge-transformed and errorswere assumed to have a Poisson distribution (Littell et al., 1996).Period, nutrient level, fish level and all possible interactions were setas fixed factors, whereas month within period was defined as arandom factor. Only significant period⁎ treatment interactions were ofinterest because they suggest that change over time occurred due totreatment effects. One assumption using this type of analysis is thatalthough response variables at different sites may differ spatially,those differences track each other over time.
2.5. Biomass analysis
Two levels of infauna biomass were analyzed for treatment effects:population biomass (mg dry weight m−2 of a selected population) andcommunity biomass (mg dry weight m−2 of all species combined).Population biomass was determined for most individual species from
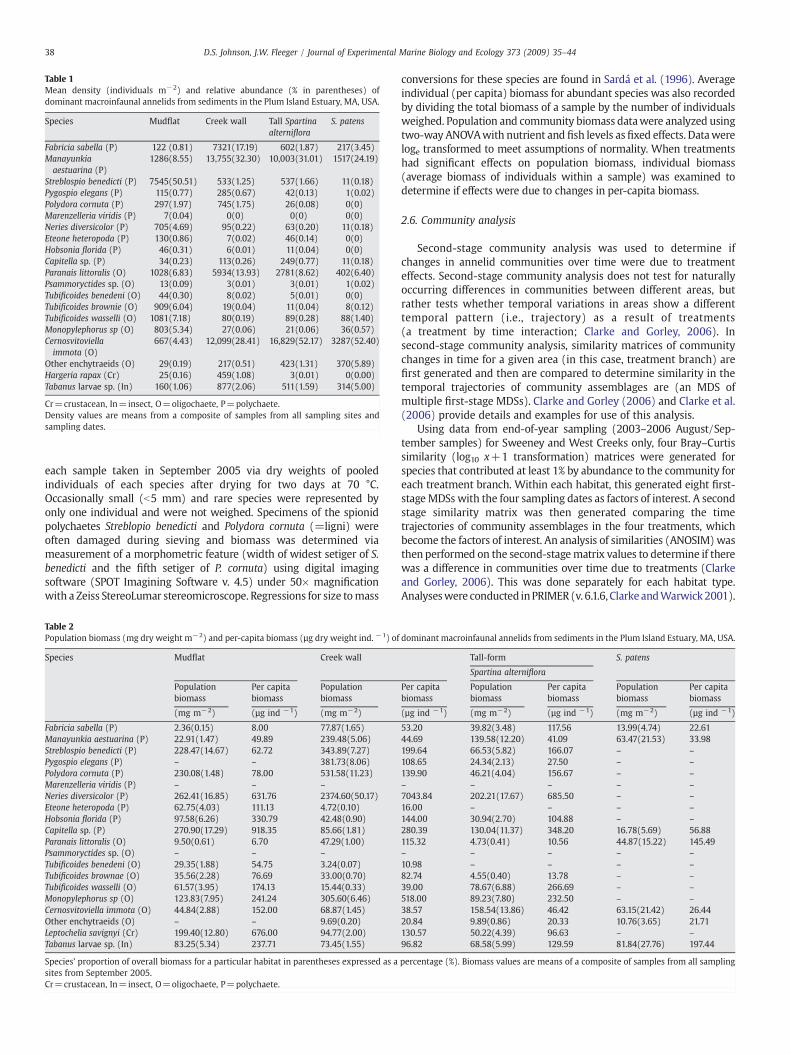
Table 1Mean density (individuals m−2) and relative abundance (% in parentheses) ofdominant macroinfaunal annelids from sediments in the Plum Island Estuary, MA, USA.
Species Mudflat Creek wall Tall Spartinaalterniflora
S. patens
Fabricia sabella (P) 122 (0.81) 7321(17.19) 602(1.87) 217(3.45)Manayunkiaaestuarina (P)
1286(8.55) 13,755(32.30) 10,003(31.01) 1517(24.19)
Streblospio benedicti (P) 7545(50.51) 533(1.25) 537(1.66) 11(0.18)Pygospio elegans (P) 115(0.77) 285(0.67) 42(0.13) 1(0.02)Polydora cornuta (P) 297(1.97) 745(1.75) 26(0.08) 0(0)Marenzelleria viridis (P) 7(0.04) 0(0) 0(0) 0(0)Neries diversicolor (P) 705(4.69) 95(0.22) 63(0.20) 11(0.18)Eteone heteropoda (P) 130(0.86) 7(0.02) 46(0.14) 0(0)Hobsonia florida (P) 46(0.31) 6(0.01) 11(0.04) 0(0)Capitella sp. (P) 34(0.23) 113(0.26) 249(0.77) 11(0.18)Paranais littoralis (O) 1028(6.83) 5934(13.93) 2781(8.62) 402(6.40)Psammoryctides sp. (O) 13(0.09) 3(0.01) 3(0.01) 1(0.02)Tubificoides benedeni (O) 44(0.30) 8(0.02) 5(0.01) 0(0)Tubificoides brownie (O) 909(6.04) 19(0.04) 11(0.04) 8(0.12)Tubificoides wasselli (O) 1081(7.18) 80(0.19) 89(0.28) 88(1.40)Monopylephorus sp (O) 803(5.34) 27(0.06) 21(0.06) 36(0.57)Cernosvitoviellaimmota (O)
667(4.43) 12,099(28.41) 16,829(52.17) 3287(52.40)
Other enchytraeids (O) 29(0.19) 217(0.51) 423(1.31) 370(5.89)Hargeria rapax (Cr) 25(0.16) 459(1.08) 3(0.01) 0(0.00)Tabanus larvae sp. (In) 160(1.06) 877(2.06) 511(1.59) 314(5.00)
Cr=crustacean, In=insect, O=oligochaete, P=polychaete.Density values are means from a composite of samples from all sampling sites andsampling dates.
38 D.S. Johnson, J.W. Fleeger / Journal of Experimental Marine Biology and Ecology 373 (2009) 35–44
each sample taken in September 2005 via dry weights of pooledindividuals of each species after drying for two days at 70 °C.Occasionally small (b5 mm) and rare species were represented byonly one individual and were not weighed. Specimens of the spionidpolychaetes Streblopio benedicti and Polydora cornuta (=ligni) wereoften damaged during sieving and biomass was determined viameasurement of a morphometric feature (width of widest setiger of S.benedicti and the fifth setiger of P. cornuta) using digital imagingsoftware (SPOT Imagining Software v. 4.5) under 50× magnificationwith a Zeiss StereoLumar stereomicroscope. Regressions for size tomass
Table 2Population biomass (mg dry weight m−2) and per-capita biomass (µg dry weight ind. −1) of
Species Mudflat Creek wall
Populationbiomass
Per capitabiomass
Populationbiomass
(mg m−2) (µg ind −1) (mg m−2)
Fabricia sabella (P) 2.36(0.15) 8.00 77.87(1.65)Manayunkia aestuarina (P) 22.91(1.47) 49.89 239.48(5.06)Streblospio benedicti (P) 228.47(14.67) 62.72 343.89(7.27)Pygospio elegans (P) – – 381.73(8.06)Polydora cornuta (P) 230.08(1.48) 78.00 531.58(11.23)Marenzelleria viridis (P) – – –
Neries diversicolor (P) 262.41(16.85) 631.76 2374.60(50.17)Eteone heteropoda (P) 62.75(4.03) 111.13 4.72(0.10)Hobsonia florida (P) 97.58(6.26) 330.79 42.48(0.90)Capitella sp. (P) 270.90(17.29) 918.35 85.66(1.81)Paranais littoralis (O) 9.50(0.61) 6.70 47.29(1.00)Psammoryctides sp. (O) – – –
Tubificoides benedeni (O) 29.35(1.88) 54.75 3.24(0.07)Tubificoides brownae (O) 35.56(2.28) 76.69 33.00(0.70)Tubificoides wasselli (O) 61.57(3.95) 174.13 15.44(0.33)Monopylephorus sp (O) 123.83(7.95) 241.24 305.60(6.46)Cernosvitoviella immota (O) 44.84(2.88) 152.00 68.87(1.45)Other enchytraeids (O) – – 9.69(0.20)Leptochelia savignyi (Cr) 199.40(12.80) 676.00 94.77(2.00)Tabanus larvae sp. (In) 83.25(5.34) 237.71 73.45(1.55)
Species' proportion of overall biomass for a particular habitat in parentheses expressed as asites from September 2005.Cr=crustacean, In=insect, O=oligochaete, P=polychaete.
conversions for these species are found in Sardá et al. (1996). Averageindividual (per capita) biomass for abundant species was also recordedby dividing the total biomass of a sample by the number of individualsweighed. Population and community biomass datawere analyzed usingtwo-way ANOVAwith nutrient and fish levels asfixed effects. Datawereloge transformed to meet assumptions of normality. When treatmentshad significant effects on population biomass, individual biomass(average biomass of individuals within a sample) was examined todetermine if effects were due to changes in per-capita biomass.
2.6. Community analysis
Second-stage community analysis was used to determine ifchanges in annelid communities over time were due to treatmenteffects. Second-stage community analysis does not test for naturallyoccurring differences in communities between different areas, butrather tests whether temporal variations in areas show a differenttemporal pattern (i.e., trajectory) as a result of treatments(a treatment by time interaction; Clarke and Gorley, 2006). Insecond-stage community analysis, similarity matrices of communitychanges in time for a given area (in this case, treatment branch) arefirst generated and then are compared to determine similarity in thetemporal trajectories of community assemblages are (an MDS ofmultiple first-stage MDSs). Clarke and Gorley (2006) and Clarke et al.(2006) provide details and examples for use of this analysis.
Using data from end-of-year sampling (2003–2006 August/Sep-tember samples) for Sweeney and West Creeks only, four Bray–Curtissimilarity (log10 x+1 transformation) matrices were generated forspecies that contributed at least 1% by abundance to the community foreach treatment branch. Within each habitat, this generated eight first-stageMDSs with the four sampling dates as factors of interest. A secondstage similarity matrix was then generated comparing the timetrajectories of community assemblages in the four treatments, whichbecome the factors of interest. An analysis of similarities (ANOSIM)wasthen performed on the second-stagematrix values to determine if therewas a difference in communities over time due to treatments (Clarkeand Gorley, 2006). This was done separately for each habitat type.Analyseswere conducted inPRIMER (v. 6.1.6, ClarkeandWarwick2001).
dominant macroinfaunal annelids from sediments in the Plum Island Estuary, MA, USA.
Tall-form S. patens
Spartina alterniflora
Per capitabiomass
Populationbiomass
Per capitabiomass
Populationbiomass
Per capitabiomass
(µg ind −1) (mg m−2) (µg ind −1) (mg m−2) (µg ind −1)
53.20 39.82(3.48) 117.56 13.99(4.74) 22.6144.69 139.58(12.20) 41.09 63.47(21.53) 33.98199.64 66.53(5.82) 166.07 – –
108.65 24.34(2.13) 27.50 – –
139.90 46.21(4.04) 156.67 – –
– – – – –
7043.84 202.21(17.67) 685.50 – –
16.00 – – – –
144.00 30.94(2.70) 104.88 – –
280.39 130.04(11.37) 348.20 16.78(5.69) 56.88115.32 4.73(0.41) 10.56 44.87(15.22) 145.49– – – – –
10.98 – – – –
82.74 4.55(0.40) 13.78 – –
39.00 78.67(6.88) 266.69 – –
518.00 89.23(7.80) 232.50 – –
38.57 158.54(13.86) 46.42 63.15(21.42) 26.4420.84 9.89(0.86) 20.33 10.76(3.65) 21.71130.57 50.22(4.39) 96.63 – –
96.82 68.58(5.99) 129.59 81.84(27.76) 197.44
percentage (%). Biomass values are means of a composite of samples from all sampling

39D.S. Johnson, J.W. Fleeger / Journal of Experimental Marine Biology and Ecology 373 (2009) 35–44
3. Results
3.1. General trends for macroinfauna
A total of 105,958 macroinfauna individuals were collectedrepresenting at least 30 species. Annelids numerically constituted93.8% of the overall invertebrate community representing at least 10polychaete and 8 oligochaete species. Total annelid density rangedfrom 300–200,000 individuals m−2 across the landscape and across
Fig. 2. Mean (S.E.) density of total annelids in experimental Creek Pair 1 (Sweeney andWest Creeks) for all four habitats. No significant treatment effects were detected for anytaxa in any habitat in Creek Pair 1. The dashed line represents start of treatments.
the years of study. Highest densities were consistently observed on thecreek wall and lowest densities on the marsh platform (i.e., Spartinapatens) (Table 1). In September 2005, average per-capita biomassranged from 7–7000 µg DW individual−1 across all species and habitats(Table 2). Population biomass ranged from 3×10⁻⁴–2.7 g DW m−2
across all species and habitats (Table 2). Community biomass rangedfrom 6.8×10⁻²–77.7 g DWm−2 and was highest in the creek wall andlowest in the S. patens sediments.
Average species richness for annelids ranged from 2.5 (S. patens) to4.8 (mudflat) across time and treatments. Average evenness(Pielou's J') for annelids ranged from 0.6 (S. alterniflora) to 0.8(S. patens). Average species diversity (H') for annelids ranged from 0.7(S. patens) to 1.0 (mudflat).
3.2. Density responses
After three growing seasons of predator removal and nutrientaddition, no annelid taxon (individual species or total annelids)density in any habitat responded to either treatment in Creek Pair 1(see Fig. 2 for total annelids; Table 3 for statistical summary forabundant taxa). Significant short-term (first year of manipulation)interactive effects (period⁎nutrient⁎fish, p≤0.046) were detectedunder S. patens canopy for Manayunkia aestuarina, Cernosvitoviellaimmota, and total annelids in Creek Pair 2. Similar results were seenfor C. immota and total annelids in Creek Pair 1 (Fleeger et al., 2008).M. aestuarina and C. immota numerically constitute 80% of theannelids in S. patens. Annelid densities in both creek pairs were verylow before treatments were initiated (2003) but increased sharplyafter treatments began. In Creek Pair 2, nutrient enrichment appearedto contribute to numerical increase. However in both creek pairs,increases in annelid abundance were much less when fish abundancewas reduced in nutrient enrichment creeks. This similarity in responsein two creek pairs suggests the interactive effect was repeatable eventhough it was not sustained in subsequent years of manipulation.Additionally, after one season of treatment application in Creek Pair 2,nutrient additions significantly increased S. benedicti abundance(period⁎nutrient, p=0.0134) in the mudflat and total annelidabundances (period⁎nutrient, p=0.0303) in the creek wall (Fig. 3).However, S. benedicti abundance did not vary similarly in the short-term in Creek Pair 1(Fleeger et al., 2008).
3.3. Biomass responses
Treatment effects onpopulation biomasswere examined only on thelast collection date in 2005. Effects were detected in three habitats andon three species. Nutrients significantly lowered N. diversicolor popula-tion biomass (a 99% reduction, p=0.008, Table 4A, Fig. 4) in mudflatsediments. However, coring does not adequately sample largerN. diversicolor, and estimates may therefore have been unreliable forthe population as a whole (e.g., higher growth may have occurred innutrient additions and more individuals grew out of the size range wecould sample). In the creek wall, M. aestuarina population biomassincreased by 22-fold when nutrients were added without fish removal(nutrient⁎fish pb0.001, Table 4A, Fig. 4). M. aestuarina individualbiomass in this habitat also increasedwith nutrients independent offishlevel (data not shown). C. immota population biomass was significantlyhigher in nutrient treatments in S. alterniflora sediments (p=0.002,Table 4A, Fig. 4). No effects were detected in the S. patens sediments. Noeffect of treatmentswas detected formacroinfauna community biomassfor any habitat (Table 4B).
3.4. Community and species diversity responses
First-stage MDS plots indicated that macroinfauna communitypatterns changed over time (i.e., inter-annual variability) becausepoints (i.e., years) were not tightly grouped (Fig. 5). However, in all

Table 3Summary table of p-values for abundant macroinfauna species from generalized linear mixed models.
Creek Pair 1 Creek Pair 2Habitat Taxon Nutrient Fish Nutrient⁎Fish Nutrient Fish Nutrient⁎Fish
MFStreblospio benedicti 0.095 0.162 0.607 0.013 0.690 0.469Paranais litoralis 0.884 0.598 0.373 0.982 0.989 0.986Total tubificids 0.736 0.666 0.292 0.731 0.055 0.261Total annelids 0.691 0.938 0.421 0.105 0.089 0.325
CWManayunkia aestuarina 0.926 0.626 0.770 0.051 0.161 0.460Fabricia sabella 0.795 0.110 0.361 0.074 0.694 0.665Paranais litoralis 0.666 0.660 0.475 0.166 0.304 0.664C immota 0.651 0.769 0.075 0.581 0.586 0.401Total annelids 0.843 0.256 0.474 0.030 0.136 0.761
TSAManayunkia aestuarina 0.565 0.557 0.408 0.701 0.292 0.986Paranais litoralis 0.522 0.842 0.841 0.268 0.944 0.964Cernosvitoviella immota 0.277 0.444 0.251 0.640 0.791 0.285Total annelids 0.441 0.804 0.458 0.718 0.467 0.650
SPManayunkia aestuarina 0.421 0.340 0.952 0.650 0.409 0.046Paranais litoralis 0.936 0.070 0.215 0.312 0.545 0.644Cernosvitoviella immota 0.998 0.590 0.407 0.895 0.682 0.011Other enchytraieds 0.306 0.604 0.470 0.999 0.983 0.999Total annelids 0.999 0.638 0.484 0.181 0.333 0.028
In this BACI-type design, only Period⁎Treatment interactions are of interest and are listed below (e.g., ‘Nutrient’= ‘Period⁎Nutrient’). Creek pair 1 represents Sweeney and WestCreeks for 2003–2006. Creek pair 2 represents Clubhead and Neslon Creeks for 2003 and 2005. MF=mudflat, CW=creek wall, TSA=tall-form Spartina alterniflora, SP=S. patens.Significant (p≤0.05) and marginally significant values (p=0.051) are in bold.
40 D.S. Johnson, J.W. Fleeger / Journal of Experimental Marine Biology and Ecology 373 (2009) 35–44
habitats along the inundation gradient, second-stage communityanalysis revealed no changes in community patterns over time as aresult of local (i.e., treatment) effects (ANOSIM pN0.05) becausereplicate time trajectories for each treatment (represented by A,B,C,D)did not tightly cluster to each other. No treatment effects weredetected for any annelid diversity indices (data not shown).
3.5. Response of other trophic levels
Here we summarize the responses of other trophic levels from theTIDE project that may be relevant to understanding the lack of effectson infauna. The effect of treatments on other taxa (e.g., killifish andbenthic microalgae) relevant to explaining potential top-down andbottom-up effects on infauna are detailed for the first two years ofexperimental treatments in Deegan et al. (2007). Killifish abundancevaried temporally and spatially in experimental creeks. Despite thevariation, fish removal did lead to significant reductions in killifishabundance (see Deegan et al., 2007, Fig. 4). Killifish reduction did notlead to increased grass shrimp density (another potential predator ofinfauna) (Deegan et al., 2007), but did lead to enhanced growth ofshrimp (Johnson, 2008), possibly due to increased carnivory byshrimp (Galván, 2008). Prior to treatments, within-habitat benthicmicroalgae (BMA) biomass was similar among creeks, although inter-habitat differences occurred. Significant effects of treatments on BMAbiomass were detected only in the second year of treatments inSweeney and West Creeks in which biomass increased synergistically(Deegan et al., 2007; Fig. 7). In isotopic studies, Galván (2008) foundthat after one year of fertilization, the annelids M. aestuarina andC. immota shifted their diet to consumemore BMA. Treatments did notalter the abundance or distribution of S. alterniflora or S. patens overthe course of manipulations (Miller, 2006).
4. Discussion
Nutrient additions and fish reductions had few detectible effectson macroinfaunal abundance, species diversity or community struc-ture after three consecutive growing seasons of manipulation.Significant effects of nutrients on population biomass occurred inthree species for the single time-point examined, and these effects
were modified by fish reduction for one species. No effects oncommunity biomass were observed. Short-term effects interactiveeffects were found in replicate creek pairs in S. patens habitat thatsuggest fish reduction initiated an indirect effect mediated by changesin shrimp behavior, which in turn influenced annelid abundance.Below we discuss possible explanations for these relatively mild andlimited responses.
4.1. Nutrient (bottom–up) effects
No effects of nutrient enrichment on infauna density, diversity andcommunity structure were observed after three years of summernutrient enrichment in Creek Pair 1, and no repeatable effects wereobserved over the short-term in our replicate creek pairs. However,nutrients stimulated increases in benthic algal biomass (up to 4-fold;L.A. Deegan unpublished data) over the same time period. Given thatinfauna may selectively consume a variety of food sources such asphytoplankton, BMA, and detritus (Galván et al., 2008), our datasuggest that annelid abundance was not tightly linked to BMAbiomass.
On the one collection examined (September 2005), fertilizationsignificantly increased the population biomass of the small polychaete(~5mm),M. aestuarina (a surface feeder with a diet composedmostlyof phytoplankton, Galván et al., 2008), in the creek wall. Increasedpopulation biomass for this polychaete may be a function of per-capitabiomass, which also increasedwith nutrient additions. The populationbiomass of the enchytraied oligochaete C. immota also increased withnutrient additions in the S. alterniflora habitat. This typically subsur-face-feeding oligochaete consumes mostly Spartina detritus in sedi-ments under the vegetation canopy in PIE (Galván, 2008). Galván(2008) found that after one year of fertilization M. aestuarina andC. immota both altered their diet to consumemore benthic microalgae.Thus, both annelids may be responding to increased food supply inthese habitats (BMA increased with fertilization) with increasedgrowth and adult body size but without a numerical response (Poseyet al., 2006).
Several studies have demonstrated that despite stimulation ofbenthic algae, effects on infauna abundance/biomass remain minimalor are slow to develop. For instance, nutrients had no appreciable effects

Fig. 3.Mean (S.E.) density of taxa inwhich treatment effects were detected in experimental Creek Pair 2 (Clubhead and Nelson Creeks). Note the different habitats for each taxa. Thedashed line represents start of treatments.
41D.S. Johnson, J.W. Fleeger / Journal of Experimental Marine Biology and Ecology 373 (2009) 35–44
on macroinfauna density after 4-weeks (Posey et al., 2002), two years(Foreman et al., 1995), three years (this study), and five years (Wiltse etal., 1984) of nutrient enrichment. Macroinfauna density and populationbiomassdid increase after 15 years of highnutrient loading in a southernNew England salt marsh (Sardá et al., 1996). Additionally, thecommunity shifted from a S. benedicti (a surface-feeding polychaete)dominated community to one dominated by subsurface-deposit-feeding oligochaetes (e.g., P. litoralis, Sardá et al., 1996). Thus, longertime frames (N5 years) and/or higher nutrient loadings [(TIDEnutrient-loading rates were ~10×less than previous dry-fertilizer plot-levelexperiments (e.g., Sardá et al., 1996)] may be needed to elicit impacts ofnutrients on saltmarsh macroinfauna.
It is uncertain why macroinfauna are slow to respond to increasesin BMA with numerical responses. Nutrients can stimulate benthicmicroalgal food resources, particularly Chlorophyta and certainbenthic diatoms (Posey et al., 2002), and benthic infauna (e.g.,S. benedicti) may respond with increased reproductive output (Levin,1986) and/or increased growth (Posey et al., 2006). Both M.aestuarina, an intratubular brooder, and the oligochaete C. immota,an asexually reproducing species, have low reproductive outputcompared to species that broadcast larvae. It is unclear why thesespecies respond with growth (growth should increase fecundity andtherefore increase population size) but not abundance. Perhaps thesespecies do not have the same capacity to increase output as broadcastspawners or survivorship of juveniles is reduced. Alternatively,
although studies in this system (e.g., Galván et al., 2008) highlightthe importance of algal food resources to infauna, detritus may still beimportant and likely not affected by our nutrient additions and in turnnot impacting infauna.
4.2. Predation (top–down) effects
In contrast to other studies that observed strong predation effectson infauna densities in a relatively short timeframe (e.g., within agrowing season; Posey et al., 2002), we observed no effect of killifishremoval on the density of infauna after three growing seasons. Killifishwere reduced by60% in a size-specific fashion and althoughkillifish arepredators, a full reduction of predators may be needed to elicit anumerical response. Alternatively, this disparity may be due to thepresence of other epibenthic predators that were not excluded by thefish reduction treatment such as grass shrimp (Palaeomonetes pugio)or small killifish. In the Great Sippewissett Marsh (Massachusetts,USA), Sardá et al. (1998) observed decreased numbers of small infaunain predator exclusion cages which they attributed to the presence ofsmall epibenthic predators such as P. pugio, which were permeable tothe largemesh size of their cages. Beseres and Feller (2007) found thatwhite shrimp predation contributed to seasonal declines in macro-infaunal abundance. Densities of surface-feeding annelids such as M.aestuarina and S. benedicti significantly increased when all predatorswere removed in caging experiment conducted by Johnson (2008),

Table 4Mean (S.E.) (A) population biomass (mg dry weight m−2) and (B) mean (S.E.) community biomass (mg dry weight m−2) of selected abundant taxa.
Taxa Ambientnutrients/ambient fish
Ambientnutrients/low fish
Nutrientadditions/ambient fish
Nutrientadditions/low fish
Nutrientmain effect
Fishmain effect
Nut⁎Fisheffect
MudflatStreblospio benedicti 0.246(0.096) 0.106(0.047) 0.333(0.109) 0.193(0.029) 0.093 0.284 0.318Manayunkia aestuarina 0.057(0.054) 0.030(0.016) 0.015 (0.006) 0.014(0.006) 0.579 0.471 0.936Nereis diversicolor 0.169(0.031) 0.529(0.281) 0.016(0.004) 0.015(0.006) 0.008 0.939 0.767
Creek wallCernosvitoviella immota 0.043(0.015) 0.079(0.016) 0.080(0.025) 0.069(0.019) 0.112 0.182 0.083Fabricia sabella 0.055(0.023) 0.077(0.025) 0.080(0.024) 0.106(0.039) 0.248 0.943 0.493Manayunkia aestuarina 0.029(0.014) 0.141(0.048) 0.712(0.398) 0.067(0.019) 0.003 0.779 b0.001Tabanus sp. Larvae 0.133(0.092) 0.064(0.040) 0.037(0.017) 0.053(0.018) 0.862 0.876 0.454
Spartina alterniflora habitatCernosvitoviella immota 0.140(0.036) 0.091(0.032) 0.201(0.023) 0.200 (0.046) 0.002 0.254 0.603Manayunkia aestuarina 0.125(0.051) 0.068(0.027) 0.322(0.240) 0.041(0.009) 0.498 0.327 0.273Capitella sp. 0.084(0.060) 0.203(0.122) 0.064(0.021) 0.166(0.071) 0.235 0.198 0.718Tabanus sp. Larvae 0.077(0.022) 0.105(0.030) 0.078(0.043) 0.031(0.019) 0.360 0.620 0.053
S. patens habitatCernosvitoviella immota 0.055(0.015) 0.064(0.019) 0.089(0.037) 0.044(0.017) 0.676 0.383 0.503Manayunkia aestuarina 0.037(0.017) 0.092(0.034) 0.054(0.018) 0.069(0.020) 0.765 0.173 0.337
B)Mudflat 134.57(28.45) 133.00(42.31) 105.33(30.91) 75.66(18.09) 0.772 0.981 0.709Creek Wall 146.72(70.91) 132.21(26.62) 365.03(131.59) 223.91(79.61) 0.147 0.457 0.886Spartina alterniflora 97.00(19.39) 97.74(22.19) 160.20(65.12) 160.20(65.12) 0.949 0.251 0.680S. patens 54.26(13.96) 64.14(15.78) 64.82(17.04) 49.18(11.35) 0.734 0.631 0.453
P-values based on two-way ANOVAs. Data from specimens collected in Clubhead, Nelson, West, and Sweeney Creeks in the Plum Island Estuary, MA, in September 2005. Boldindicates significant effects.
42 D.S. Johnson, J.W. Fleeger / Journal of Experimental Marine Biology and Ecology 373 (2009) 35–44
suggesting large killifish removal alone may not be enough to elicit anumerical response from annelids. Grass shrimp are prey for largekillifish and their impact on infauna may be enhanced by the removalof large killifish (N40 mm) via increased foraging (Kneib and Stiven,1982; Posey and Hines, 1991). Isotope and caging experiments in PIEsuggest that with the removal of large killifish, grass shrimp, but notsmall killifish, consume more infauna thereby compensating forreductions in consumption by killifish (Galván, 2008; Johnson,
Fig. 4. Mean (S.E.) population biomass (mg DW m−2) of selected macroin
2008). Thus, indirect effects may be important in structuring theseinfauna communities (Kneib, 1988).
4.3. Interactive effects
Short-term interactive effects were noted only in marsh platformhabitats. Top–down and bottom–up treatments interacted onM. aestuarina, C. immota, and total annelid densities in the S. patens
fauna for September 2005 in the Plum Island Estuary, Massachusetts.

Fig. 5. Second-stage community analysis of Plum Island Estuary infauna by habitat type. Stage 1: First-stage similarities among years (2003–2006) for end of the season samples. Eachfirst-stage MDS are based on Bray–Curtis similarities calculated from Log (x+1) transformed abundances and are averages of all replicates within each area. Stress values are all 0.Stage 2: Second-stage MDS ordination. Labels represent data from two sites within each treatment. ANOSIM p-values are listed in the top left corner. A=ambient fish/ambientnutrients, B=fish removal/ambient nutrients, C=ambient fish/nutrient additions, D=fish removal/nutrient additions.
43D.S. Johnson, J.W. Fleeger / Journal of Experimental Marine Biology and Ecology 373 (2009) 35–44
habitat in Creek Pair 2 (this study) and for C. immota densities in CreekPair 1 in the first year of treatments (Fleeger et al., 2008). Becausedensities of these taxa responded to nutrient additions (as noted above,both species also responded to fertilization with increased biomass andwith a diet shift to utilize BMA in parts of the PIE landscape) in ambientfish levels but not when fish were reduced, possible indirect effectsinitiatedbykillifishon infaunamayexplain this trend. Similarly, nutrientsincreasedM. aestuarina population biomass in the ambientfish levels butnot in the fish reduction areas in the S. alterniflora habitats. Thisobservationmay result fromgrass shrimpaltering their foragingbehaviorwith the reduction of large killifish (Galván, 2008; Johnson, 2008).
5. Conclusions
The results of our large-scale study confirms the historical findingsof small-scale studies that infauna respond weakly, if at all, to top–down and bottom–up field manipulations and responses are limitedto a few taxa (Kneib and Stiven, 1982; Wiltse et al., 1984; Posey et al.,2002). Our results also corroborate the notion that predators havelittle impact on subsurface-dwelling infauna such as oligochaetes(Posey et al., 2002). We observed no effects of nutrient additions andkillifish removal on annelid density, diversity, or community structureafter three consecutive seasons of whole-ecosystem manipulation.Effects on population biomass were examined as a snapshot in timeand three species in two different habitats responded. Increasedgrowth occurred in two species—M. aestuarina and C. immota—thataltered their diet to take advantage of rapidly responding benthicalgae (Galván, 2008), and these species may have had increased ratesof secondary production that were not manifested by numericalincreases. Indirect effects detected after one season in S. patens did notpersist perhaps because nutrient-induced alterations of basal
resources (e.g., Spartina spp. or benthic algae), which exhibit a timelag after nutrient additions begin. Predation effects are probably notcumulative and interactions with nutrient effects may vary over time.
It is difficult to quantify the relative strength of top–down andbottom–up controls because faunal responses to both treatmentswere few and mild. Some infauna responded to nutrients but in waysthat are difficult to interpret (i.e., increased body size but no density orcommunity change). Top–down control may be obscured due tocompensatory predation by other epibenthic predators. Few interac-tions occurred in this study, a result that corresponds to other studiesthat suggest no interactions between trophic manipulations andnutrient additions on infauna (Foreman et al., 1995, Posey et al., 1999,2002); however, interactions could vary temporally as strongernutrient effects manifest over time (Sardá et al., 1996). Workcontinues to examine potential cumulative responses, feedbacks andinteractions over longer time periods. As estuarine systems continueto be chronically impacted by multiple human activities, long-termmultistressor studies are important in understanding the effects ofthese activities.
Acknowledgements
We thank E. Brumfield, B. Carlin, R. Del Rio, A. Cleland, J. Gurney,S. McCormick, J. Mairo, R. Mannino, S. Quasi, J. Seal and C. Sutera formany hours of sample sorting. L. Deegan, B. Keeler, J.M. Johnson,L. Lemay, C. Picard and all scientists at the Marshview research stationcontributed to the field work necessary to conduct this study. Thisresearch was supported by the National Science Foundation undergrants no. 0213767 and 9726921. Any opinions, findings, andconclusions or recommendations expressed in this material arethose of the authors and do not necessarily reflect the views of the

44 D.S. Johnson, J.W. Fleeger / Journal of Experimental Marine Biology and Ecology 373 (2009) 35–44
funding agency. All experiments conducted comply with the currentU.S. law. [SS]
References
Beseres, J.J., Feller, R.J., 2007. Importance of predation by white shrimp Litopenaeussetiferus on estuarine subtidal macrobenthos. J. Exp. Mar. Biol. Ecol. 344, 193–205.
Carman, K.R., Fleeger, J.W., Pomarico, S.W., 1997. Response of a benthic food web tohydrocarbon contamination. Limnol. Oceanogr. 42, 561–571.
Clarke, K.R., Gorley, R.N., 2006. PRIMER v6: User Manual/Tutorial. PRIMER-E, Plymouth.Clarke, K.R., Warwick, R.M., 2001. Change in Marine Communities: An Approach to
Statistical Analysis and Interpretation, 2nd ed. PRIMER-E, Plymouth.Clarke, K.R., Somerfield, P.J., Airoldi, L., Warwick, R.M., 2006. Exploring interactions by
second-stage community analyses. J. Exp. Mar. Biol. Ecol. 338, 179–192.Craft, C., Sacco, J., 2003. Long-termsuccessionofbenthic infaunacommunitiesonconstructed
Spartina alterniflora marshes. Mar. Ecol. Prog. Ser. 257, 45–58.Deegan, L.A., Bowen, J.L., Drake, D., Fleeger, J.W., Friedrichs, C.T., Galván, K.A., Hobbie, J.E.,
Hopkinson, C., Johnson, J.M., Johnson,D.S., Lemay, L.E.,Miller, E., Peterson, B.J., Picard, C.,Sheldon, S., Vallino, J., Warren, R.S., 2007. Susceptibility of salt marshes to nutrientenrichment and predator removal. Ecol. Appl. 17, S42–S63.
Diaz, R.J., Rosenberg, R., 1995. Marine benthic hypoxia: a review of its ecological effectsand the behavioural response of benthic macrofauna. Oceanogr. Mar. Biol. 33,245–303.
Fell, P.E., Weissbach, S.P., Jones, D.A., Fallon, M.A., Zeppieri, J.A., Faison, E.K., Lennon, K.A.,Newberry, K.J., Reddington, L.K., 1998. Does invasion of oligohaline tidal marshes byreed grass, Phragmites australis (Cav) Trin ex Steud, affect the availability of preyresources for the mummichog, Fundulus heteroclitus L? J. Exp. Mar. Biol. Ecol. 222,59–77.
Fleeger, J.W., Johnson, D.S., Galván, K.A., Deegan, L.A., 2008. Top–down and bottom–upcontrol of infauna varies across the saltmarsh landscape. J. Exp. Mar. Biol. Ecol. 357,20–34.
Foreman, K., Valiela, I., Sardá, R., 1995. Controls of benthic marine food webs. Sci. Mar.59, 119–128.
Galván, K., 2008. The diet of saltmarsh consumers. Ph.D., Dissertation, Louisiana StateUniversity, Baton Rouge, LA.
Galván, K., Fleeger, J.W., Fry, B., 2008. Stable isotope addition reveals dietary importanceof phytoplankton andmicrophytobenthos to saltmarsh infauna. Mar. Ecol. Prog. Ser.359, 37–49.
Johnson, D.S., 2008. Trophic control of saltmarsh invertebrates. Ph.D., Dissertation.,Louisiana State University, Baton Rouge, LA.
Johnson, D.S., Fleeger, J.W., Galván, K.A., Moser, E.B., 2007. Worm holes and their space-time continuum: spatial and temporal variability of macroinfaunal annelids in anorthern New England salt marsh. Estuaries Coasts 30, 226–237.
Kemp, W.M., Boynton, W.R., Adolf, J.E., Boesch, D.F., Boicourt, W.C., Brush, G., Cornwell, J.C.,Fisher, T.R., Glibert, P.M.,Hagy, J.D., Harding, L.W., Houde, E.D., Kimmel, D.G.,Miller,W.D.,Newell, R.I.E., Roman, M.R., Smith, E.M., Stevenson, J.C., 2005. Eutrophication ofChesapeake Bay: historical trends and ecological interactions. Mar. Ecol. Prog. Ser. 303,1–29.
Kneib, R.T., 1984. Patterns of invertebrate distribution and abundance in the intertidalsalt marsh: causes and questions. Estuaries 7, 392–412.
Kneib, R.T., 1988. Testing for indirect effects of predation in an intertidal soft-bottomcommunity. Ecology 69, 1795–1805.
Kneib, R.T., Stiven, A.E., 1982. Benthic invertebrate responses to size and densitymanipulations of the common mummuchog Fundulus heteroclitus in an intertidalsalt marsh. Ecology 63, 1518–1532.
Levin, L., 1986. Effects of enrichment on reproduction in the opportunistic polychaeteStreblospio benedicti (Webster): a mesocosm study. Biol. Bull. 171, 143–160.
Littell, R.C., Milliken, G.A., Stroup, W.W., Wolfinger, R.D., 1996. SAS System for MixedModels. SAS Institute Inc, Cary North Carolina.
Miller, E.E., 2006. Experimental nutrient enrichment of a New England salt marsh: plantproductivity and community composition responses. MS thesis, ConnecticutCollege, New London, CT.
Parker, K.R., Wiens, J.A., 2005. Assessing recovery following environmental accidents:Environmental variation, ecological assumptions, and strategies. Ecol. Appl. 15,2037–2051.
Peterson, B.J., Deegan, L., Helfrich, J., Hobbie, J.E., Hullar,M.,Moller, B., Ford, T.E., Hershey, A.,Hiltner, A., Kipphut, G., Lock, M.A., Fiebig, D.M., McKinley, V., Miller, M.C., Vestal, J.R.,Ventullo, R., Volk, G.,1993. Biological response of a tundra river to fertilization. Ecology74, 653–672.
Posey, M.H., Hines, A.H., 1991. Complex predator–prey interactions within an estuarinebenthic community. Ecology 72, 2155–2169.
Posey, M.H., Alphin, T.D., Cahoon, L., Lindquist, D., Becker, M.E.,1999. Interactive effects ofnutrient additions and predation on infaunal communities. Estuaries 22, 785–792.
Posey, M.H., Alphin, T.D., Cahoon, L.B., Lindquist, D.G., Mallin, M.A., Nevers, M.B., 2002.Top–down versus bottom–up limitation in benthic infaunal communities: directand indirect effects. Estuaries 25, 999–1014.
Posey, M.H., Alphin, T.D., Cahoon, L., 2006. Benthic community responses to nutrientenrichment and predator exclusion: influence of background nutrient concentra-tions and interactive effects. J. Exp. Mar. Biol. Ecol. 330, 105–118.
Rader, D.N., 1984. Saltmarsh benthic invertebrates—small-scale patterns of distributionand abundance. Estuaries 7, 413–420.
Sardá, R., Foreman, K., Valiela, I., 1995. Macroinfauna of a southern New England saltmarsh: seasonal dynamics and production. Mar. Biol. 121, 431–445.
Sardá, R., Valiela, I., Foreman, K., 1996. Decadal shifts in a salt marsh macroinfaunalcommunity in response to sustained long-term experimental nutrient enrichment.J. Exp. Mar. Biol. Ecol. 205, 63–81.
Sardá, R., Foreman, K., Werme, C.E., Valiela, I., 1998. The impact of epifaunal predationon the structure of macroinfaunal invertebrate communities of tidal saltmarshcreeks. Estuar. Coast. Shelf Sci. 46, 657–669.
Underwood, A.J., 1994. On beyond BACI—sampling designs that might reliably detectenvironmental disturbances. Ecol. Appl. 4, 3–15.
VandeKoppel, J., Altieri, A.H., Silliman, B.R., Bruno, J.F., Bertness,M.D., 2006. Scale-dependentinteractions and community structure on cobble beaches. Ecol. Lett. 9, 45–50.
Virnstein, R.W., 1978. Predator caging experiments in soft sediments: caution advised.In:Wiley,M.L. (Ed.), Estuarine Interactions. Academic Press, NewYork, pp. 261–273.
Wiltse, W.I., Foreman, K.H., Teal, J.M., Valiela, I., 1984. Effects of predators and foodresources on the macrobenthos of salt marsh creeks. J. Mar. Res. 42, 923–942.