”We were or was we?” A Study of Was/Were Variation Based ...
97
”We were or was we?” A Study of Was/Were Variation Based on the Spoken Corpus of the Survey of English Dialects Johanna Jyrkinen University of Tampere School of Modern Languages and Translation Studies English Philology MA Thesis January 2007
Transcript of ”We were or was we?” A Study of Was/Were Variation Based ...
”We were or was we?” A Study of Was/Were Variation Based on the
Spoken Corpus of the Survey of English Dialects
Johanna Jyrkinen University of Tampere
School of Modern Languages and Translation Studies English Philology
MA Thesis January 2007
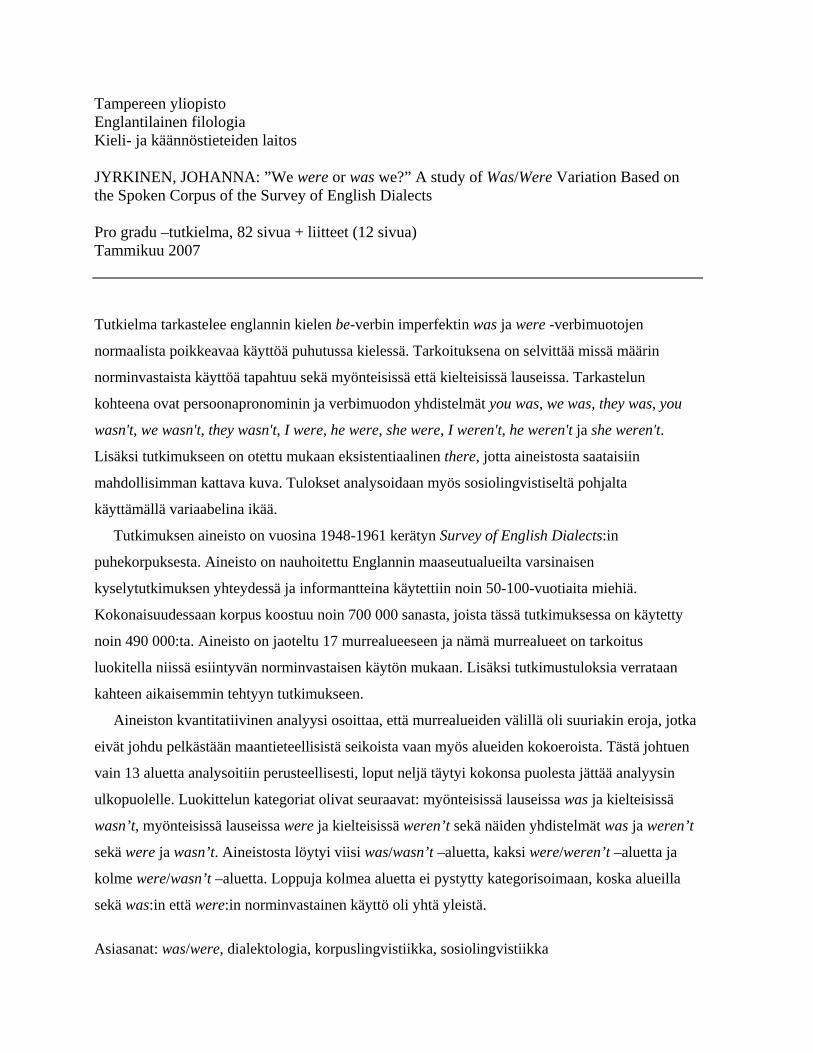
Tampereen yliopisto Englantilainen filologia Kieli- ja käännöstieteiden laitos JYRKINEN, JOHANNA: ”We were or was we?” A study of Was/Were Variation Based on the Spoken Corpus of the Survey of English Dialects Pro gradu –tutkielma, 82 sivua + liitteet (12 sivua) Tammikuu 2007 Tutkielma tarkastelee englannin kielen be-verbin imperfektin was ja were -verbimuotojen
normaalista poikkeavaa käyttöä puhutussa kielessä. Tarkoituksena on selvittää missä määrin
norminvastaista käyttöä tapahtuu sekä myönteisissä että kielteisissä lauseissa. Tarkastelun
kohteena ovat persoonapronominin ja verbimuodon yhdistelmät you was, we was, they was, you
wasn't, we wasn't, they wasn't, I were, he were, she were, I weren't, he weren't ja she weren't.
Lisäksi tutkimukseen on otettu mukaan eksistentiaalinen there, jotta aineistosta saataisiin
mahdollisimman kattava kuva. Tulokset analysoidaan myös sosiolingvistiseltä pohjalta
käyttämällä variaabelina ikää.
Tutkimuksen aineisto on vuosina 1948-1961 kerätyn Survey of English Dialects:in
puhekorpuksesta. Aineisto on nauhoitettu Englannin maaseutualueilta varsinaisen
kyselytutkimuksen yhteydessä ja informantteina käytettiin noin 50-100-vuotiaita miehiä.
Kokonaisuudessaan korpus koostuu noin 700 000 sanasta, joista tässä tutkimuksessa on käytetty
noin 490 000:ta. Aineisto on jaoteltu 17 murrealueeseen ja nämä murrealueet on tarkoitus
luokitella niissä esiintyvän norminvastaisen käytön mukaan. Lisäksi tutkimustuloksia verrataan
kahteen aikaisemmin tehtyyn tutkimukseen.
Aineiston kvantitatiivinen analyysi osoittaa, että murrealueiden välillä oli suuriakin eroja, jotka
eivät johdu pelkästään maantieteellisistä seikoista vaan myös alueiden kokoeroista. Tästä johtuen
vain 13 aluetta analysoitiin perusteellisesti, loput neljä täytyi kokonsa puolesta jättää analyysin
ulkopuolelle. Luokittelun kategoriat olivat seuraavat: myönteisissä lauseissa was ja kielteisissä
wasn’t, myönteisissä lauseissa were ja kielteisissä weren’t sekä näiden yhdistelmät was ja weren’t
sekä were ja wasn’t. Aineistosta löytyi viisi was/wasn’t –aluetta, kaksi were/weren’t –aluetta ja
kolme were/wasn’t –aluetta. Loppuja kolmea aluetta ei pystytty kategorisoimaan, koska alueilla
sekä was:in että were:in norminvastainen käyttö oli yhtä yleistä.
Asiasanat: was/were, dialektologia, korpuslingvistiikka, sosiolingvistiikka
Contents page 1. Introduction...................................................................................................................1 2. Theoretical Background................................................................................................4 2.1. Dialectology....................................................................................................4 2.2. Corpus Linguistics..........................................................................................7 2.3. Sociolinguistics..............................................................................................10 2.4. Previous Research…......................................................................................12 2.4.1. “Was/Were-variation in non-standard British English” by Lieselotte Anderwald..................................................... 13 2.4.2. “Vernacular universals? A case of plural was in Early Modern English” by Terttu Nevalainen................................15 3. The Corpus and the Methods.......................................................................................18 3.1. The Survey of English Dialects....................................................................18 3.2. Methodology.................................................................................................19 4. Results and Analysis...................................................................................................22 4.1. Lower Southwest England............................................................................22 4.2. Central Southwest England...........................................................................25 4.3. Upper Southwest England.............................................................................29 4.4. Home Counties..............................................................................................31 4.5. East Anglia....................................................................................................35 4.6. South Midlands.............................................................................................38 4.7. Midlands........................................................................................................41 4.8. Northwest Midlands......................................................................................44 4.9. Northeast Midlands.......................................................................................47 4.10. Central Midlands...........................................................................................50 4.11. Northern England..........................................................................................53 4.12. Central Northern England.............................................................................57 4.13. Northeast England.........................................................................................60 5. Discussion………………………………………………………............................... 63 6. Conclusion....................................................................................................................77 References..........................................................................................................................81 Appendices……………………………………………………………………………….83
1
1. Introduction
The verb be is a special case in the English language. It has been described by Pyles and Algeo as
“a badly mixed up verb” (1993, 127) it being “a collection of semantically related paradigms of
various historical origins” (Lass 1992, 139). Because of its special status, there have been and
will be a great deal of research on its use, from both a quantitative and a qualitative point of view.
The past tense paradigm of be is the only case in the English language that has two separate
forms, was and were, that vary according to person (was with I, he and she, and were with you,
we and they). This study focuses on the non-standard or generalised use of was and were, in other
words, the cases where was occurs with you, we and they, and were with I, he and she in positive
and negative contexts, singular and plural.
This is a quantitative, corpus-based study based on the materials from The Survey of English
Dialects, the tape-recordings made in the 1950s. The data is analysed according to 17 dialect
areas. My research questions are:
1. To what extent do the generalised forms occur in the data and how are they distributed according to grammatical person and number? 2. Does age as an extralinguistic factor affect the frequency of use?
The aim of this study is to contribute to the study of language change, in other words, to show
how language was used at a certain time and by means of comparison to find evidence of
variation. The informants of this study are all relatively old, none younger than fifty, and non-
mobile (also known as NORMs, non-mobile, older, rural, males), so the language they are
speaking is actually older than that of the 1950s when the data was gathered. I am assuming that
people who live in rural communities and move relatively little, speak a form of language, even
when they are older, that is very close to what they learnt as a child. This assumption is supported
by the apparent-time hypothesis, which states that people do not significantly alter the way they
2
speak over their adult lifetimes, so that each generation of speakers reflects the state of language
as they acquired it as children (Boberg 2004, 250-251). Therefore, the language that I am dealing
with here is closer to the language spoken in the later half of the 19th and early 20th century. To
further illustrate the aspect of language development and language change, I will compare this
study to two similar studies made with material from different times; Terttu Nevalainen’s study
with data from the Early Modern English period, and Lieselotte Anderwald’s study of language
in the 1990s. This will show, at least to some extent, how language is changing.
I chose age as an extralinguistic variable in order to have a sociolinguistic analysis of the data
as well. Age seemed to be the only option for the variable, because of the uniformity of the
informants. They are all males, have similar occupations and are of the same social class, thus
age was the factor that in my opinion would yield the most variation. The informants are divided
into two age groups, under 76, and 76 and over.
The study will proceed as follows: First, in sections 2.1., 2.2., and 2.3. I will discuss some
background reading on the research fields I am employing: dialectology, corpus linguistics, and
sociolinguistics. I will introduce some of the basic features of the three fields, discussing the
advantages of this approach. Section 2.4. is reserved for contemporary studies on the subject. I
will introduce the two studies that I will compare the results of my own study with, discussing
their similarities and differences.
Chapter 3. introduces the corpus, The Survey of English Dialects Spoken Corpus, and the
methods. As well as discussing the history of the corpus, I will also introduce some background
information on the informants. I will explain the division into dialect areas and how the data was
gathered from the corpus with a concordancing programme, the ways in which the study in
general was conducted. Chapter 4. is for analysing the results. I will go through them region at a
time, and illustrate the numbers of cases found in the corpus with tables. In each section I will
3
introduce the overall view of the dialect region, that is to say, how many generalised cases were
found of all the cases with was/were/wasn’t/weren’t with a personal pronoun or there. Tables for
the results according to grammatical person and number, and age are also included.
In chapter 5. I will compare my results to those of Lieselotte Anderwald and Terttu
Nevalainen. In this chapter I will show the course of language development, if it is possible to
determine that from the three studies. Chapter 6. will conclude the discussion. I will assess how
my study succeeded in establishing language change and whether my study yielded anything new
to the linguistic field.
4
2. Theoretical Background
This study is a combination of dialectology, corpus linguistics, and sociolinguistics; corpus data
is analysed according to dialect areas and a sociolinguistic variable is also used in the analysis.
Before introducing the study itself, I will explain some of the basic ideas and principles of the
research fields. This is to illustrate better the background for this study, the theories that lie
behind these fields of research, the similarities and the differences. In addition, I will introduce
two pieces of contemporary research in order to show how this kind of studies are conducted.
These two studies are the ones with which I will compare my own study later on. The methods
they employ are very similar to those of my research, especially in Lieselotte Anderwald’s study.
What combines these three research fields is that they are all empirical fields closely related to
studying language variation and change. Dialectology, corpus linguistics, and sociolinguistics
share in common the idea of authentic data; dialectology and sociolinguistics in social,
communicative situations. Corpus linguistics is a good tool to study these situations, there are
plenty of corpora designed for such use, fieldwork is not needed. Moreover, because of the
regional and variational aspects of this study dialectology and sociolinguistics are a very good
theoretical basis from which to continue.
2.1. Dialectology
Dialectology is an empirical field that studies varieties within a language, dialects and accents,
linguistic variation and change both regionally and within regions. The difference between a
dialect and an accent is that accents refer only to differences in pronunciation whereas in dialects
there are differences also in grammar and vocabulary as well as in pronunciation. In defining a
dialect it is problematic to distinguish between a dialect and another language. There is no easy
way to determine the relationship between dialects and languages. Because the change from one
5
dialect to another is often gradual, the dialect does not change immediately outside a town or city.
Dialect boundaries do not always follow geographical lines, except in cases of something
dividing the two boundaries, e.g. a river, and they can be political and social as well (Francis
1983, 1-2). The graduality of the change can lead to the formation of a dialect continuum such as
in Scandinavia, as stated by Chambers and Trudgill (1998, 6). The language spoken gradually
changes so that to a very large extent people can understand each other, but a person from
northern Sweden or Norway and a person from southern Denmark, even northern Germany
cannot. Even though Swedish, Norwegian, and Danish are closely related, they are regarded as
separate languages.
Dialectology studies variation on different levels of language such as grammar, lexicon,
semantics, and phonology, but it also incorporates sociolinguistics and studies variation within
communities socially and according to variables such as sex, age, and occupation. The most
important focus of dialectology has been regional variation, but the social aspects of language are
now becoming more and more important.
Dialectology is an interesting field because it can produce evidence of language change, when
it has happened and even why. Historical (or diachronic) linguistics is especially interested with
this aspect of dialectology. Language has changed throughout history, and in order to find out
when a change which resulted in dialect differences occurred, different varieties must be studied.
A dialectologist can help a historical linguist in establishing why language changes or why it
does not (Francis 1983, 9).
Why does language change and why is dialectology needed? Milroy (1992, 1) states that there
is no such thing as a perfectly stable human language. Language is changing continuously.
Change can be slow or rapid, but it is constantly occurring. Old varieties die out and new ones are
born. Some features change while some remain stable. Variation can be geographical and social,
6
even situational, and in the study of linguistic change, this heterogeneity of language is of crucial
importance, as change in progress can be detected in the study of variation. The history of any
language is therefore not the history of one variety, but it is a multidimensional history (Milroy
1992, 1-2).
As mentioned, language variation can be social as well as regional. Milroy (1992, 4) focuses
on this social nature of language in examining the extent to which the origins of linguistic change
can be shown to be social. He states that rather than explain change from within language
systems, one must look at language change as a product of speaker-activity in social contexts.
Moreover, language is a social phenomenon, and as a means of communication it does not need
the knowledge of grammar for the purpose of communicating and interacting with others. Milroy
(1992, 4; 223) also states that languages that have no speakers do not change. Languages such as
Latin which is used for ritual purposes would display changes only if it had speakers or writers.
William Labov is a pioneer in the field of sociolinguistics and dialectology. His study on the
social aspects of language in New York City (Labov, 1966) was one of the first wide studies
related to the social aspects of language, such as social class, and how it affects how people
speak. His study consisted of a large number of phonological and morphological features of
language, such as the use of /r/ in post-vocalic positions.
For this thesis studies on vernacular universals are worth mentioning. This term was first
introduced by J. K. Chambers (1995, 242), a sociolinguist who argued that these patterns belong
to the language faculty, the innate set of rules and representations that are the natural inheritance
of every human being, not merely English speakers. Counterparts of these patterns are found in
other languages as well, therefore they are primitive features, not learnt ones. Vernacular
universals arise in the context of sociolinguistic dialectology as generalisations about
intralinguistic variation. According to Chambers (2004, 129) was used instead of were in plural
7
contexts such as They was the last ones, is a vernacular universal. Other examples are walkin’
instead of walking, and multiple negation as in He didn’t see nothing.
Chambers (2004, 131) calls the above mentioned grammatical phenomenon “default
singulars”. This means that the subject of a sentence is plural, but the verb is singular, i.e. there is
no subject-verb concord. Britain (2002, 17-19) identifies two dominant patterns of past be in
varieties of English: 1. Was occurs variably for standard were throughout the paradigm, both
affirmative and negative; and 2. Was occurs variably for standard were in affirmatives, and
weren’t in negatives. Britain (2002, 19-20) also discusses constraints which mean that concord
occurs more frequently with certain types of subjects than others. The two of these constraints
that are named are the existential constraint and the Northern Subject Rule. The existential
constraint means that was is more frequent after there. On the other hand, the Northern Subject
Rule suggests that was is more frequent after nonpronominal plural nouns than after pronouns. It
will be interesting to see which of the patterns is more dominant in my own study and also if the
existential constraint applies.
2.2. Corpus Linguistics
Corpus linguistics is an empirical approach to the description of language use (Tognini-Bonelli
2001, 2). It is said that corpus linguistics is somewhere between theory and methodology. This
means that unlike a methodology, which can be defined as the use of a given set of rules or pieces
of knowledge in a certain situation, corpus linguistics is in a position to define its own sets of
rules and pieces of knowledge before they are applied (Tognini-Bonelli 2001, 1). Before moving
any further, I must first define the word corpus. A corpus is a collection of texts assumed to be
representative of a given language put together so that it can be used for linguistic analysis.
According to the general consensus, a corpus consists of naturally occurring data.
8
The early years of corpus linguistics were rather difficult. In the early 1960s, when corpus
linguistics started being called that, the field was dominated by generative¹ linguistics. When the
first computer corpus, the Brown Corpus, was being created, it was thought that the only source
of grammatical knowledge was the intuitions of a native speaker, and that could not be obtained
from a corpus (Meyer 2002, 1). Noam Chomsky suggested that language competence was the key
factor in how to model language compared to language performance. There cannot be language
performance without competence (Chomsky 1964, 4). After all, language performance can be
affected by extralinguistic factors not related to one’s competence. The differences in approach
are obvious when looking at the different attitudes towards the gathering of linguistic data. For
example, the rationalist² theory is based on artificial behavioural data e.g. that of a native speaker.
On the other, empiricism is based on observations of naturally occurring data e.g. a corpus
(McEnery & Wilson 2001, 5). Needless to say that despite the opposition, corpus linguistics has
gained ground as a generally accepted methodology.
Today corpus linguistics is used in pursuing various research agendas and the interest is not
restricted only to certain disciplines. Very commonly corpora are used to study a specific
linguistic construction e.g. frequency of use and whether it occurs more in certain contexts. Many
different kinds of linguistic phenomena have been studies, was/were variation as one of them.
According to Tognini-Bonelli (2001, 2-3) the process of searching a corpus for data and
analysing it proceeds as follows: first, the observation of language facts leads to the formulation
of a hypothesis to account for these facts; second, a generalisation is made based on the evidence
__________________________ ¹ The grammatical explanation of a linguistic construction should be in terms of an ordered set of processes by which more complex structures can be derived form simpler ones according to established rules (Francis 1983, 172). ² The rationalist theory is based on the development of a theory of mind and the goal is cognitive plausibility. The aim is to develop a theory of language that emulates the external effects of human language and seeks to make the claim that it represents how the processing is actually undertaken (McEnery & Wilson 2001, 5). An approach based on introspection.
9
of the repeated patterns in the concordance; and third, the observations are unified in a theoretical
statement.
According to Tognini-Bonelli (2001, 2-3) comparing a corpus and a text as linguistic evidence
is problematic. Corpus data and text are similar, to a certain extent, as linguistic evidence, but can
they be evaluated in the same way? Despite their similarities, they are fundamentally and
qualitatively different. For example, a text has to be read as a whole, when a corpus is
fragmented. Moreover, a text is a coherent communicative event, when a corpus is not. A text can
be seen as a specific context of situation and culture, but a corpus is more formal because of the
purpose it was compiled for. Corpus information is evaluated as meaningful in that it can be
generalised to the language as a whole, but with no direct connection with a specific instance.
In studying a linguistic construction it is more profitable to choose a construction that occurs
relatively frequently because it will be more difficult to make strong assumptions of an
infrequently occurring construction (Meyer 2002, 12). For this reason, to study an infrequent
phenomenon one often finds it necessary to have a larger corpus. However, for more frequent
constructions a relatively small corpus should be enough to provide reliable and valid
information (Meyer 2002, 12).
Much of the current work in historical linguistics is nowadays based on corpora. These
corpora contain texts from earlier periods of English and enable historical linguists to investigate
on issues such as how gender affected language usage (Meyer 2002, 11). They can be used to
study how language has changed over the years. The Helsinki Corpus was a pioneer in the field.
It is a 1.5-million-word corpus with texts from the Old English period to the early Modern
English period. Moreover, the corpus represents various dialect regions in England and also
different genres, in addition to containing sociolinguistic information on the authors. Since the
10
Helsinki Corpus many other historical corpora have been created (Meyer 2002, 20-21). The
definite advantage of historical corpora is that it enhances the linguist’s ability to study the
linguistic development of English and shows how sociolinguistic variables such as gender
affected language usage and maybe even help determine when it was that women came to
generally promote linguistic change (Meyer 2002, 21-22).
Other fields where corpora are considered useful sources of information and which have
benefited from the input of corpus linguistics are e.g. studying language acquisition, lexicology,
creating dictionaries and reference grammars, studying language variation and change, gender
studies, and improving foreign- and second language instruction. All in all, corpus linguistics has
numerous uses, not all practical, but some enhancing the theoretical aspects of linguistics as well
(Meyer 2002, 28). Corpus linguistics has become a new research enterprise and a new
philosophical approach to linguistic enquiry, and a corpus can be used to validate, exemplify of
build up a language theory (Tognini-Bonelli 2001; 1, 65).
2.3. Sociolinguistics
There are no single-style speakers (Labov 2003, 234).
How people speak is not determined merely by what they know and are capable of, but facts that
have nothing to do with language are to a large extent also involved in the communication
process. Facts of this kind are the relationship between the speakers or speaker and audience; the
social context in which the interaction takes place, e.g. school or work; and the topic which is
being discussed (Labov 2003, 234). Objectively definable variables, such as age, sex, social class,
and ethnic background are seen as key factors in communication, moreover, the speaker’s
subjective attitudes, perception in situations, cognitive and affective dispositions, for example,
are nowadays also noted as being important parts of interaction (Thakerar et al. 1982, 206).
11
Sociolinguistics is an empirical field of research that, like corpus linguistics, is based on
studying language performance. It is concerned with investigating the relationship between
language and society in trying to understand the structure of language and how it functions in
communication. Peter Trudgill (1978, 11) talks about studies which combine linguistic and social
matters which have a linguistic intent. This kind of studies are based on empirical work on
language as it is spoken in social contexts, and are of such topics that are linguistically
interesting. Studies in language variation and change belong to this category. The basic intent is
not to study a particular society, but to learn more about language and to investigate topics such
as the mechanisms of linguistic change, the nature of linguistic variability, and the structure of
linguistic systems (Trudgill 1978, 11). Sociolinguistics is concerned with quite a number of
different areas of study. In addition to language variation it deals with things such as pidgins and
creoles, code switching, accommodation theory, multilingualism, diglossia, and language and
gender. Culture, community and region are important as representatives of society, in other words
sociolinguistics deals with both smaller and larger units of language users. The difference
between sociolinguistics and sociology of language is that sociolinguistics investigates the
relationship between language and society, trying to better understand how language is structured
and how it functions in society; sociology of language is trying to discover how social structure
can be better understood through the study of language (Wardhaugh 1998, 12).
Section 2.2. introduced the conflict between language competence and performance.
Wardhaugh (1998, 371) states that people are aware of language variation and its many forms.
Variation is seen as something inherent to language. The fact that people know how to act in
different social situations suggests language usage and understanding are far more complicated
than linguistic competence can explain. Instead of linguistic competence a more extensive term,
communicative competence, is often used. However, as well as language itself, communicative
12
competence and what it actually is has not yet been successfully determined. As Wardhaugh
(1998, 372) states, because there are problems in trying to determine what the term means and if
it even exists, it is even more difficult to try to explain how it develops in people. How do people
learn to use language in the same way as certain other people, but in a different way from some
others? And what are the social factors that bring about this learning in the individual’s
community? These are some of the questions sociolinguists aim to answer.
Dialectology, corpus linguistics, and sociolinguistics are quite similar in many ways. They are
empirical fields where language performance is important. They are all focusing on naturally
produced speech and the importance of social interaction and communication are the key factors.
Rather than focusing on theories of language, the aim is to study different varieties with authentic
data and see if the results are similar to those suggested by the different theories. Dialectology
and sociolinguistics similarly deal with regional variation and corpus linguistics provides a means
to study the different phenomena in establishing linguistic variation and language development.
2.4. Previous Research
Was/were variation has been widely studied over the years. The research extends from Scotland
(e.g. Smith and Tagliamonte, 1998) and England (e.g. Britain, 2002) to New Zealand (e.g. Hay &
Schreier, 2004) and from York (e.g. Tagliamonte, 1998) to the South Atlantic (e.g. Schreier,
2002) and the United States (e.g. Wolfram & Schilling-Estes, 2003). Because be is one of the
most common verbs in the English language, its past tense is an ideal subject of research; it is
used frequently enough to make assumptions of the usage even in smaller data samples.
In order to explain the basis for my research, I will introduce two studies made in the recent
years on this subject. The first one is a study by Lieselotte Anderwald (2001) on was/were
variation based on the British National Corpus (BNC). The second study is a piece of research on
13
the case of plural was in Early Modern English by Terttu Nevalainen (2006). She uses the data
from the Corpus of Early Modern English Correspondence (CEEC), from the early 15th and late
17th centuries. The emphasis will be on Anderwald’s study because I am following her methods
very closely, I will, however, compare the results of these two studies to those of my own.
2.4.1. “Was/Were-variation in non-standard British English” by Lieselotte Anderwald
Anderwald studies the combinations of a pronoun or the existential there with
was/were/wasn’t/weren’t in different dialect regions. She divides Great Britain into 20 dialect
regions (she also studies Scotland, Wales, and Northern Ireland which are not included in my
study) which are based on the regional division in Peter Trudgill’s book “Dialects of England”
(1990, 63) (see map in Appendix 1). Her aim is to determine what kind of generalization is used
in which dialect region. In other words, she introduces four different types of generalization: was-
generalization, were-generalization and two mixed types. In was-generalization was is
generalised in both positive and negative contexts, therefore it is used instead of the standard
form, in were-generalization were is generalised in the same manner. The mixed types are
combinations of the two previous systems. The more common of these two is the generalization
of was in the positive and weren’t in negative contexts. On the other hand, the generalization of
were in the positive and wasn’t in negative contexts is rare. It does not occur in Anderwald’s
sample, and she says it is not mentioned in the literature for any variety of English either. “Any
combined system must therefore consist of was generalised in positive clauses and weren’t
generalised in negative clauses” (Anderwald 2001, 9).
Anderwald’s study is based on the British National Corpus (BNC). The corpus is a relatively
new resource, it was compiled in the 1990s. It consists of a written corpus (90%) and a spoken
corpus (10%). The BNC is a 100-million-word corpus, therefore the spoken sub-corpus consists
14
of 10 million words. In her study, Anderwald uses a subsample of the spoken corpus, the
subsample, roughly 5 million words, consists of spontaneous speech recorded in everyday
situations. Anderwald states that the advantages of the BNC recordings are that no fieldworkers
were needed, because the informants recorded their speech by themselves (2001, 3). The
informants were chosen to cover the regions of Great Britain, but they were also chosen
according to age, gender, socio-economic status and educational levels. There were 1281
informants altogether (Anderwald 2001, 4).
The results of Anderwald’s study are as follows: Was-generalization was more common in
three dialect areas (north-west Midlands, Scotland and Northern Ireland), were-generalization
more common in four dialect regions (London, south Midlands, central northern England and
north-east England) and finally, the rest of the areas (with the exception of three regions,
Humberside, Lancashire and Northern England, which were omitted because there were not
enough cases to determine the generalization type) are of the mixed type, was generalised in the
positive and weren’t in the negative clauses (Anderwald 2001, 11-12).
Anderwald combines the idea of dialect region and age groups, but she can only perform this
comparison in one dialect region, London. It is the only area where there were enough informants
of each age group in order to receive valid results (although her age group 60+ still lacks proper
representation) (2001, 13-14). Her results show that under 35-year-olds favour the mixed type,
whereas speakers from 35 to 59 favour were-generalization. The 60+ group would indicate a
preference towards the mixed type, but nothing definite can be stated because of the poor
representation of this particular age group (Anderwald 2001, 14).
With regard to my own study, I will compare Anderwald’s results to mine, especially her
results of regional variation. The comparison between the analyses of age groups is difficult
because my informants are almost all over 60 years old, and there are only few under that (see
15
Appendix 2). But from a regional perspective it will be interesting to see to if language has
changed.
2.4.2. “Vernacular universals? The case of plural was in Early Modern English” by Terttu Nevalainen
Terttu Nevalainen studies the variation between the singular and plural past-tense forms of be
with plural subjects in Northern England, East Anglia and London. The data is from the regional
component of the Corpus of Early Modern English Correspondence (CEEC) and dates to the
early 15th and late 17th centuries (subperiods 1440-1519; 1520-1579; 1580-1639; 1640-1681).
Nevalainen’s aim is to find out whether variation is more likely to correlate with language-
internal factors than with the external variable of region (Nevalainen 2006, 351). She used the
multivariate (VARBRUL) analyses to assess the degree of change in the weighting of the
linguistic and language-external factors across time (Nevalainen 2006, 353).
In her research, Nevalainen (2006, 357) concentrated on four geographical areas: London, the
Court, East Anglia, and the North. London referred to people who lived in the City and in
Southwark. The Court meant people who resided in Westminster and were courtiers, diplomats
and high-ranking government officials however are also included in this category. East Anglia
counted for Norfolk and Suffolk, and the North included people who lived north of the Chester-
Humber line. Because the aim of her study was to study instances of was and were used in the
indicative plural, Nevalainen imposed a fixed quota of fifty instances on writers with a larger
number of instances of the was/were variable in their letters. The purpose of this was to avoid
bias in the data; possible structures were in the subjunctive could have skewed the results in
favour of were.
16
Nevalainen (2006, 357-358) also excluded invariable context from her analysis, in other words
cases which never admit the plural in the data. Examples of this are instances with sums of
money which do not occur with the plural verb. Also nouns with equivocal number such as news,
which can occur with both, a singular and a plural verb, were excluded. Cases with the collectives
such as squadron and fleet where the plural use is semantically rather than socially determined,
were also excluded.
The results of Nevalainen’s study are very interesting. She found 1 821 cases of the was/were
variable with plural subjects in the data (2006, 358-359). Nevalainen found that the general
frequency of was had declined when moving on from the 15th to the 17th century. However,
regional variation shows some differing results. There was a peak of was in the plural in the
North in the 15th and 16th centuries (over 40 per cent of the cases). The same pattern is seen in
London, however, in a smaller scale (over 10 per cent of the cases). The Court and East Anglia
remain under 10 per cent, with the exception of the Court 13 per cent between 1440 and 1519.
Nevalainen (2006, 360) found no significant indication of weren’t generalization, which
suggests that the phenomenon is more recent, even with the northern dialects where it occurs
today (see Britain 2002). The pronoun we was the only one to occur with any frequency with
was. There were a few instances with you, and even fewer with they, none in the London or
northern data.
Nevalainen (2006, 362) carried out the multivariate analyses with the GOLDVARB
programme. In the analysis the factors are presented in the order of significance calculated by the
regression analysis, factor weights varying between 1 and zero; the higher the weight, the more
the factor favours the use of was, and the lower the weight, the more it favours were.
The analysis shows that in 1440-1519 the North significantly favours the use of was, East
Anglia distinctly disfavours it. Moreover, was is most commonly used with the existential there,
17
with also plural NP subjects favouring it. In the next period, 1520-1579, the same factors still
favour the use of was (the North and existential there), the only difference is that plural NP
subjects no longer favour it. In the next subperiod, 1580-1639, the factor weight of plural NP
subjects is even lower. Existential there still favours the use of was but only just; regional
levelling is taking place. The last period, 1640-1681, shows that region is no longer a significant
factor, existential there still promotes the use of was, and plural NP subjects and pronouns
disfavour it. The analysis showed that regionally there was gradual levelling and that the
frequency of use of the existential there is stable (Nevalainen 2006, 362-363).
18
3. The Corpus and the Methods
This chapter is an introduction of the corpus and the methodology used in this study. I will first
discuss the Survey of English Dialects, explain some of its history, the compilation, and the
informants. Second, I will introduce the methods employed and the basic aims of my research
explaining some of my choices in managing the data and conducting this research.
3.1. The Survey of English Dialects
The data used in this study is based on the Survey of English Dialect (later SED) tape recordings,
which were recorded in England between 1948 and 1961 and compiled to a spoken corpus in the
University of Leeds. The SED was a questionnaire-based survey the fieldwork of which was
conducted in the 1950s in 313 localities in rural England. Just under 300 SED localities were
recorded which resulted in ca. 60 hours of tape and material worth about 700 000 words. The
results were published between 1962 and 1971 (Klemola & Jones 1999, 17-18). Because tape
was very expensive in the 1950s not all the tape-recordings have survived. Harold Orton, who
was one of the initiators of the survey, said “We ourselves felt unable, because of the high cost of
tapes and of the lack of the appropriate storage, to preserve the tape-recordings intact. So it was
decided to excerpt the best parts only and to re-record these on double sided 12 inch disks”
(1962, 20). Moreover, the individual tape-recordings that survived are relatively short, only 8 to
10 minutes on average (Klemola & Jones 1999, 19).
The topics of conversation were spontaneous, most commonly they would be closely related
to the speaker’s occupation, such as farming, baking or mining, or to their personal opinions and
reminiscences of their childhood or other.
The SED tape-recordings are the only systematically collected corpus of traditional dialect
speech in the mid 20th century England (Klemola & Jones 1999, 19). The aim was in fact to
19
compile a linguistic atlas. The informants were mainly non-mobile, older, rural males i.e.
NORMs, which can be seen as both a strength and a weakness for the tape-recordings. A strength
in the sense that with informants almost all of whom were over 60 years of age, the result is the
oldest possible form of that dialect. A weakness because they were mainly male and there was no
possibility to make a comparison between male and female informants for example.
3.2. Methodology
This is an empirical, quantitative analysis of the corpus material. I will concentrate on the use of
generalised forms i.e. non-standard use of was/were with personal pronouns and the existential
there both in the singular and in the plural. The forms searched for are was with 2nd person
singular and plural, 1st person plural, and 3rd person plural, and were with 1st person singular and
3rd person singular, and, as mentioned, was/were with there. Both positive and negative cases will
be investigated. My research questions are:
1. To what extent do the generalised forms occur in the data and how are they distributed according to grammatical person and number? 2. Does age as an extralinguistic factor affect the frequency of use?
I chose age as an extralinguistic factor because I thought I needed to have one other factor to
study, and because gender and occupation would not have been relevant in this case. The
informants are all male and their occupations are quite similar, almost all of them are either
farmers, miners or craftsmen. In other words, I do not believe that to study the data according to
the informants’ profession would result in occupation having an effect on the use of the
generalised forms. The informants are split into two age groups: ages under 76, and 76 and over.
The number of generalised forms is then compared to the number of all the cases, standard and
non-standard, found in the data according to each age group. There are 285 informants and they
20
are aged roughly between 50 and 100 years, hence the age grouping. I will also study how the
results are distributed according to grammatical person and number. Only pronouns and the
existential there that are directly adjacent to the verb are included in the study.
There were some fifteen women interviewed in the original data, but they are not included. I
decided to exclude the women because there were not enough of them to make a comparison
between the genders, and by not including them my results are more unified with having a clear
group of informants.
The corpus analysis is conducted with the WordSmith Tools 4 concordancing programme,
which retrieves the desired cases from the corpus material. The data was orthographically
transcribed by applying the CHAT (Codes for the Human Analysis of Transcripts) system of
orthographic transcription in the University of Leeds and was given to me by Professor Juhani
Klemola of the University of Tampere, School of Modern Languages and Translation Studies. I
searched for all the cases of each verb form and then resorted them into alphabetical order
according to the words directly in front of and behind the verb. Where there were two informants
interview in the same locality simultaneously, and if the other was a woman or a man of the
different age group, I needed to separate the two or remove the speech of the female speaker.
The data is discussed according to dialect areas. There are 17 different areas (see maps in
Appendix 1 and 2) and the division was made following the modern dialect areas in Peter
Trudgill’s book “The Dialects of England” (1990, 63). Note that how I made the division of the
data to dialect areas was subjective. I found it problematic, because the dialect boundaries do not
follow geographical county lines. Therefore, I decided which informant locality belongs to which
dialect area using the SED locality map (Appendix 2). The division was made as accurately as
possible. There are a few informants whose age was not mentioned in the data. These informants
21
are included in the overall analysis and the discussion according to grammatical person and
number, but excluded from the analysis according to age.
The dialect areas are grouped according the type of generalization that they find more
common. The types are the same as introduced in discussing in Anderwald’s study in section
2.4.1.: was-generalization, were-generalization and the two mixed types (Anderwald 2001: 10-
12). My aim is to compare the results to those of Anderwald, so I am using similar methods and
attempting to reach the same dialect areas as her for more valid comparison between the studies.
22
4. Results and Analysis
In this chapter I will analyse the data of one dialect area at a time. Only 13 dialect areas are
separately analysed, because Humberside, Central Lancashire, London, and Merseyside are
poorly represented in the data (see Appendix 4). South Midlands, Northwest Midlands, and
Northern England have informants whose age is not known. These informants are included in the
general analysis, but excluded from the analysis according to age. Therefore there are some
discrepancies between the different tables in those sections.
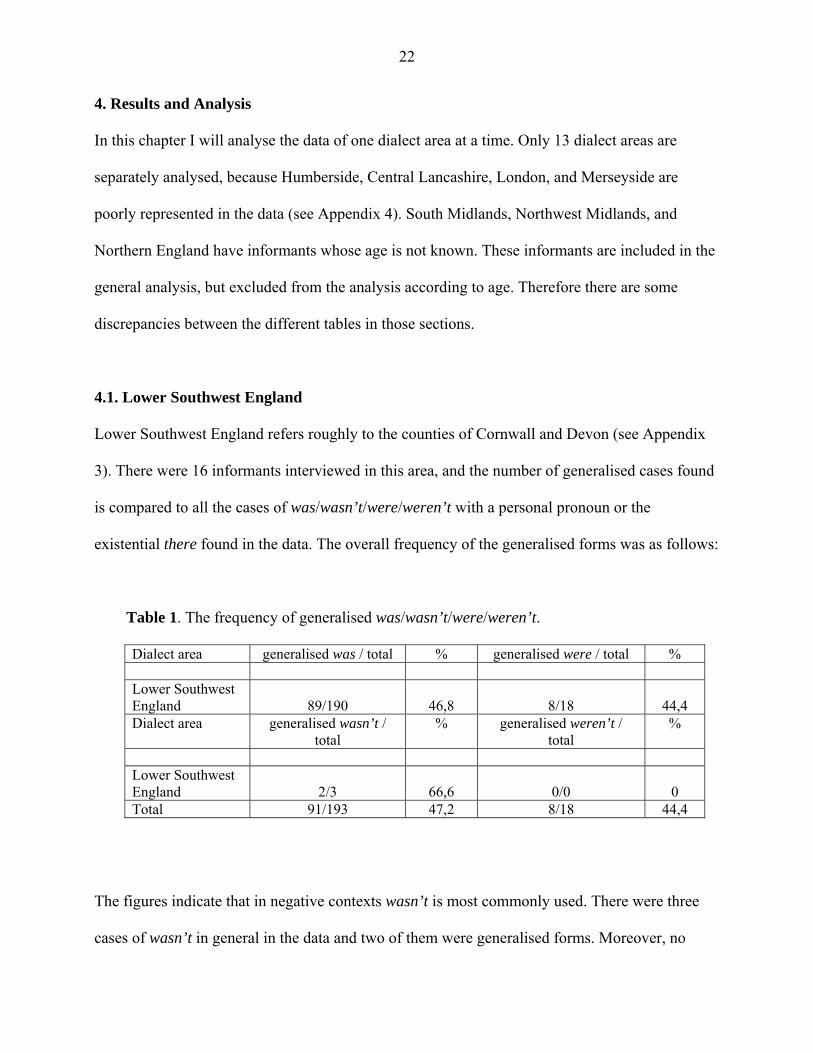
4.1. Lower Southwest England
Lower Southwest England refers roughly to the counties of Cornwall and Devon (see Appendix
3). There were 16 informants interviewed in this area, and the number of generalised cases found
is compared to all the cases of was/wasn’t/were/weren’t with a personal pronoun or the
existential there found in the data. The overall frequency of the generalised forms was as follows:
Table 1. The frequency of generalised was/wasn’t/were/weren’t.
Dialect area generalised was / total % generalised were / total % Lower Southwest England
89/190
46,8
8/18
44,4
Dialect area generalised wasn’t / total
% generalised weren’t / total
%
Lower Southwest England
2/3
66,6
0/0
0
Total 91/193 47,2 8/18 44,4
The figures indicate that in negative contexts wasn’t is most commonly used. There were three
cases of wasn’t in general in the data and two of them were generalised forms. Moreover, no
23
cases with weren’t were found. One must, however, be skeptical, because of the low occurrence
of cases. In positive contexts the frequencies are much closer to each other. Was was generalised
in 46,8 percent of the overall cases, were with 44,4 percent. Primarily, this would indicate that
Lower Southwest England is a was-generalisation area, but because of the almost equally high
percentage of generalised were, definite assumptions are difficult to make. The following
examples of generalisation usage are taken from the data. In the first one the informant uses the
generalised pattern of they was. The second informant uses the pattern I were.
(1) ... Well ,no. No. # They was all good fellows, you see... (informant D6)
(2) ... But anyhow, I were three year with a plaster of Paris jacket... (informant Co5)
In the following table the results are analysed according to grammatical person and number.
Table 2. Distribution according to grammatical person and number.
Pattern Cases/ Total
% Pattern Cases/ Total
%
you was 10/190 5,3% you wasn’t 0/3 0% we was 5/190 2,6% we wasn’t 1/3 33,3% they was 22/190 11,6% they wasn’t 0/3 0% there was 52/190 27,3% there wasn’t 1/3 33,3% I were 3/18 16,6% I weren’t 0/0 0% s/he were 0/18 0% s/he weren’t 0/0 0% there were 5/18 27,8% there weren’t 0/0 0%
The analysis shows that was in positive contexts most commonly occurs with the existential
there, in 27,3% of the cases. This seems to agree with the existential constraint which suggests
that was occurs more frequently with there as mentioned earlier in section 2.2. (Britain 2002, 19).
Moreover, with pronouns was seems to occur most frequently with they, secondly with you, and
24
the least with we. The situation seems to be similar with were in positive contexts. There were is
the most common patter, followed by I were. No cases of s/he were were found. In negative
contexts no cases of weren’t were found. Of the two cases of wasn’t found, one occurred with
there and one with we. There were no cases with you or they. This is rather interesting, because of
the pattern found in positive contexts. The pronoun, we, that had the least occurrences with was,
now occurs with wasn’t, albeit only once, while the two most frequent pronouns with was, you
and they, do not. If we consider the high frequencies of both was and were in positive contexts, it
would seem that both of the frequencies are due to the existential there. Therefore, the existential
constraint applies.
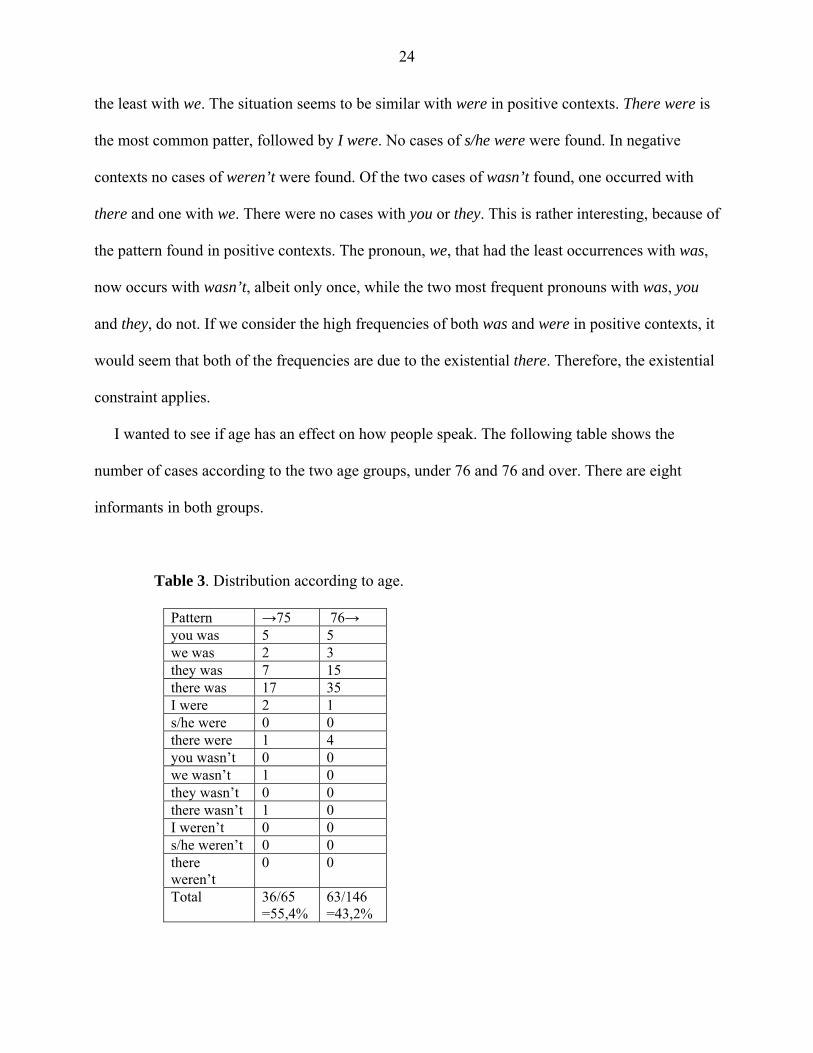
I wanted to see if age has an effect on how people speak. The following table shows the
number of cases according to the two age groups, under 76 and 76 and over. There are eight
informants in both groups.
Table 3. Distribution according to age.
Pattern →75 76→ you was 5 5 we was 2 3 they was 7 15 there was 17 35 I were 2 1 s/he were 0 0 there were 1 4 you wasn’t 0 0 we wasn’t 1 0 they wasn’t 0 0 there wasn’t 1 0 I weren’t 0 0 s/he weren’t 0 0 there weren’t
0 0
Total 36/65 =55,4%
63/146 =43,2%
25
Table 3. indicates a higher percentage of generalised usage among the younger informants in the
data. 55,4% of the cases in the under 76 –group are generalised cases, in the older group 43,2%
are generalised. Interestingly, the older group has a higher or equal amount of cases with all the
patterns according to person and number in positive contexts except with I were. On the other
hand, in negative contexts all the generalised cases occur in the younger group. At this stage it is
too early to say if this is due to language change or something else.
All in all, Lower Southwest England would seem to be a dialect area where was-generalisation
is more common and where the generalisation patterns are most frequently used by the younger
population of the area, indicating that this phenomenon is of more recent origin.
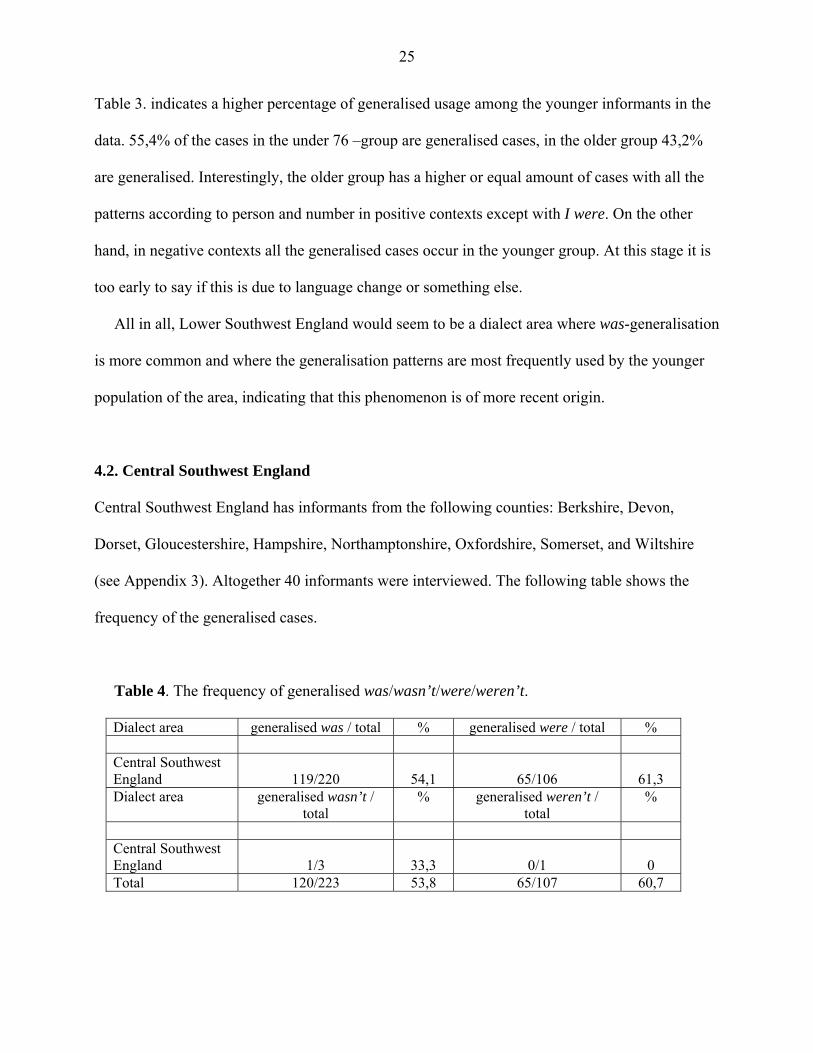
4.2. Central Southwest England
Central Southwest England has informants from the following counties: Berkshire, Devon,
Dorset, Gloucestershire, Hampshire, Northamptonshire, Oxfordshire, Somerset, and Wiltshire
(see Appendix 3). Altogether 40 informants were interviewed. The following table shows the
frequency of the generalised cases.
Table 4. The frequency of generalised was/wasn’t/were/weren’t.
Dialect area generalised was / total % generalised were / total % Central Southwest England
119/220
54,1
65/106
61,3
Dialect area generalised wasn’t / total
% generalised weren’t / total
%
Central Southwest England
1/3
33,3
0/1
0
Total 120/223 53,8 65/107 60,7
26
61,3 % of were occurrences in positive contexts are generalised. With was the frequency is 54,1
percent. Again the frequencies are both very high, but the distinction is now clearer. In negative
contexts there were no cases of weren’t and only one case of wasn’t. Because of the one case of
generalised wasn’t and the higher percentage of were generalised in positive contexts, it would
seem that Central Southwest England uses a mixed type generalisation. However, this is a mixed
type where were is generalised in positive and wasn’t in the negative clauses. According to
Anderwald (2001, 9) there is no evidence of a mixed type occurring in this way. The only mixed
type she has encountered and that has been found in other varieties is that of was generalised in
positive and weren’t in negative clauses. However, these results must be interpreted with caution.
After all, only one case of generalised wasn’t was found. Analysing the remainder of the dialect
areas will show if evidence of this type of generalisation is found anywhere else in England. The
following examples of generalisation usage are taken from the data. In the first one the informant
uses generalised was with you. In the second one the informant uses the pattern I were.
(3) ...Well, I had to walk from there, # up to # the upper uh end of Inkpen here. Where you was yesterday, near Clark's. Kill another there... (informant Brk4) (4) ...I were getting on in age like. I were forty year old... (informant Do1) The distribution of the generalised cases according to grammatical person and number is
shown in table 5. on the following page.
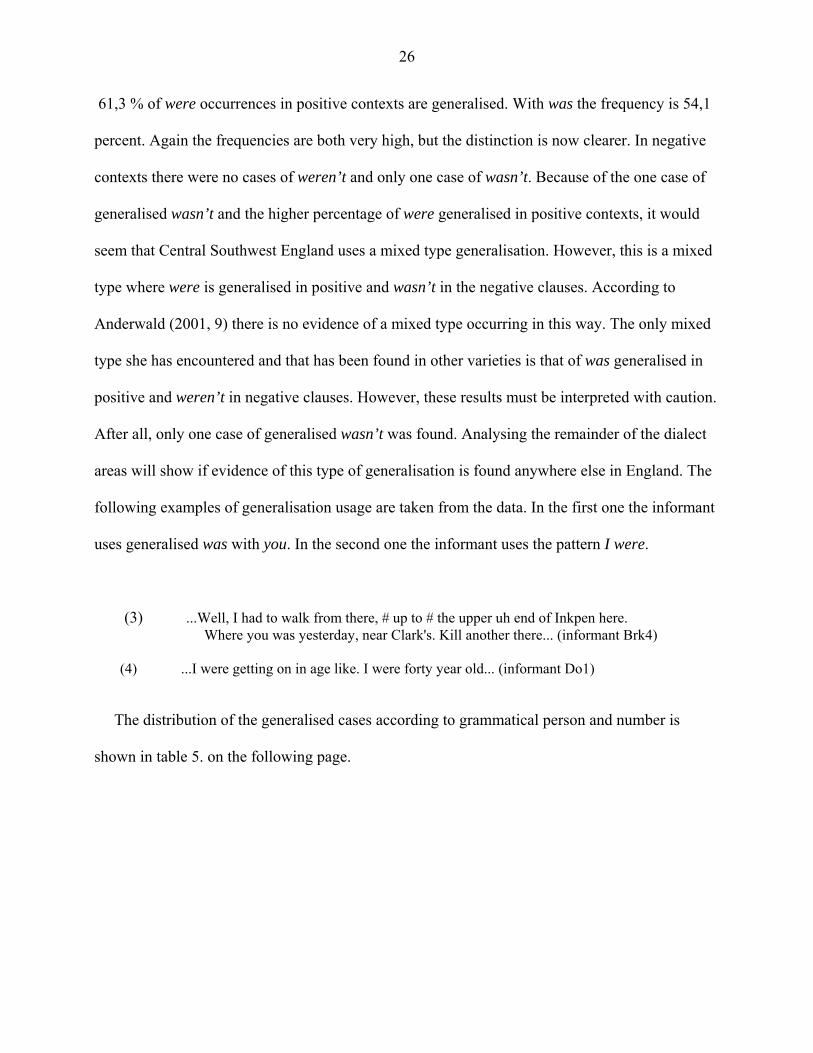
27
Table 5. Distribution according to grammatical person and number.
Pattern Cases/ Total
% Pattern Cases/ Total
%
you was 11/220 5,0% you wasn’t 0/3 0% we was 14/220 6,4% we wasn’t 0/3 0% they was 15/220 6,8% they wasn’t 1/3 33,3% there was 79/220 35,9% there wasn’t 0/3 0% I were 29/106 27,4% I weren’t 0/1 0% s/he were 10/106 9,4% s/he weren’t 0/1 0% there were 26/106 24,5% there weren’t 0/1 0%
The results indicate the same pattern as in the previous dialect area. The existential there occurs
most frequently with was (35,9%). In comparison with the personal pronouns, there is more
frequent than all the pronouns together. The most common personal pronoun is they (6,8%),
followed by we (6,4%) and you (5,0%). In negative contexts, wasn’t was rare, but the one case
that I found, was generalised. No cases of weren’t were found.
The results concerning were in positive contexts seem different than in the previous dialect
area. The existential there is common, but not the most common in occurrence with were. Pattern
I were occurs in 27,4 percent of the cases, while there were occurs in 24,5%. S/he were is the
least frequent at 9,4%. It seems that the high frequency of were generalisation is not simply due
to the existential there, but is more commonly used with the personal pronouns. This further
strengthens the position of Central Southwest England as a were/wasn’t mixed type
generalisation dialect area.
The following table shows the generalised cases according to the age groups. There are 19
informants in the under 76 -group and 21 informants in the 76 and over –group.
28
Table 6. Distribution according to age.
Pattern →75 76→ you was 3 8 we was 9 5 they was 5 10 there was 37 42 I were 9 20 s/he were 5 5 there were 10 16 you wasn’t 0 0 we wasn’t 0 0 they wasn’t 0 1 there wasn’t 0 0 I weren’t 0 0 s/he weren’t 0 0 there weren’t
0 0
Total
78/140 =55,7%
107/190 =56,3%
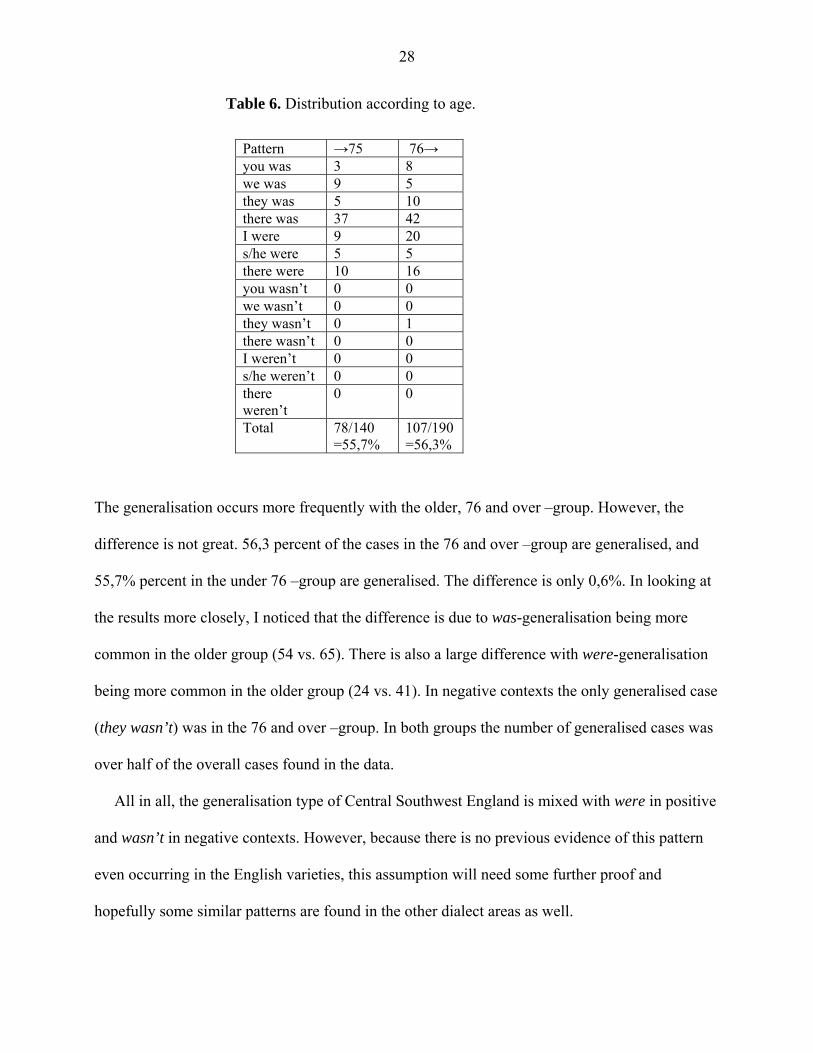
The generalisation occurs more frequently with the older, 76 and over –group. However, the
difference is not great. 56,3 percent of the cases in the 76 and over –group are generalised, and
55,7% percent in the under 76 –group are generalised. The difference is only 0,6%. In looking at
the results more closely, I noticed that the difference is due to was-generalisation being more
common in the older group (54 vs. 65). There is also a large difference with were-generalisation
being more common in the older group (24 vs. 41). In negative contexts the only generalised case
(they wasn’t) was in the 76 and over –group. In both groups the number of generalised cases was
over half of the overall cases found in the data.
All in all, the generalisation type of Central Southwest England is mixed with were in positive
and wasn’t in negative contexts. However, because there is no previous evidence of this pattern
even occurring in the English varieties, this assumption will need some further proof and
hopefully some similar patterns are found in the other dialect areas as well.
29
4.3. Upper Southwest England
Upper Southwest England has informants from the following counties: Gloucestershire,
Herefordshire, Monmouthshire, Shropshire, Warwickshire, and Worcestershire; 30 informants
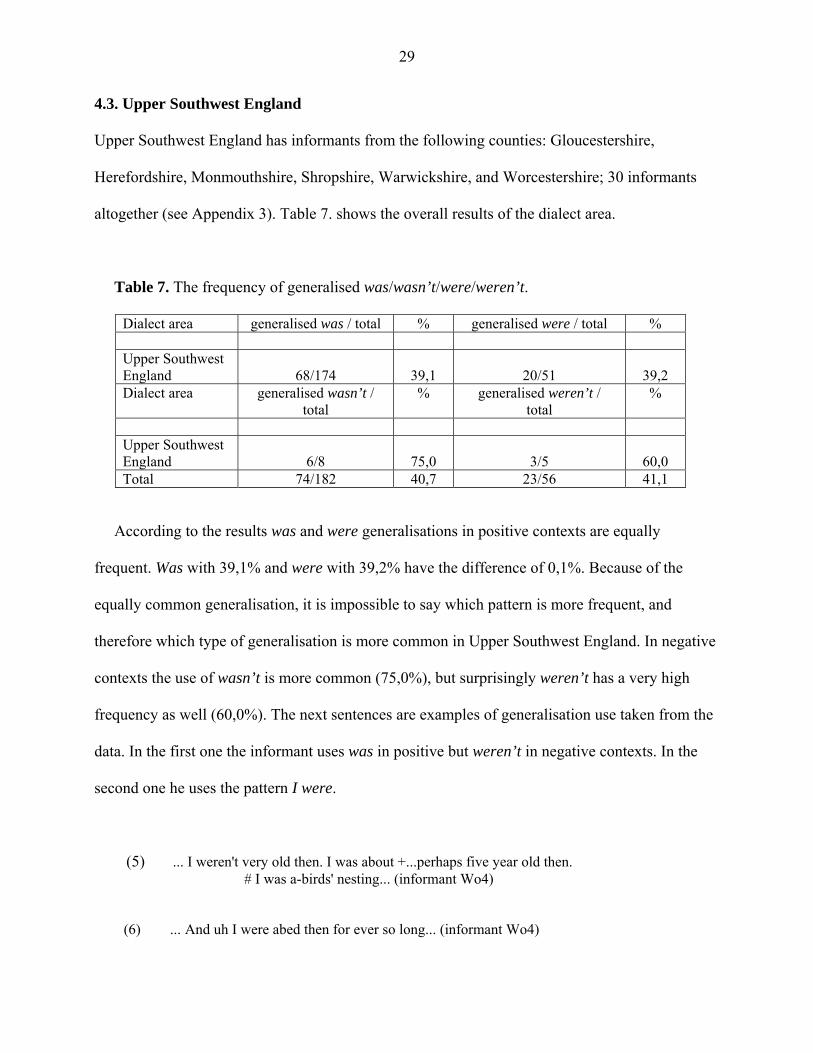
altogether (see Appendix 3). Table 7. shows the overall results of the dialect area.
Table 7. The frequency of generalised was/wasn’t/were/weren’t.
Dialect area generalised was / total % generalised were / total % Upper Southwest England
68/174
39,1
20/51
39,2
Dialect area generalised wasn’t / total
% generalised weren’t / total
%
Upper Southwest England
6/8
75,0
3/5
60,0
Total 74/182 40,7 23/56 41,1
According to the results was and were generalisations in positive contexts are equally
frequent. Was with 39,1% and were with 39,2% have the difference of 0,1%. Because of the
equally common generalisation, it is impossible to say which pattern is more frequent, and
therefore which type of generalisation is more common in Upper Southwest England. In negative
contexts the use of wasn’t is more common (75,0%), but surprisingly weren’t has a very high
frequency as well (60,0%). The next sentences are examples of generalisation use taken from the
data. In the first one the informant uses was in positive but weren’t in negative contexts. In the
second one he uses the pattern I were.
(5) ... I weren't very old then. I was about +...perhaps five year old then. # I was a-birds' nesting... (informant Wo4) (6) ... And uh I were abed then for ever so long... (informant Wo4)
30
In the following table the results are distributed according to grammatical person and number.
Table 8. Distribution according to grammatical person and number.
Pattern Cases/ Total
% Pattern Cases/ Total
%
you was 4/174 2,3% you wasn’t 0/8 0% we was 9/174 5,2% we wasn’t 0/8 0% they was 9/174 5,2% they wasn’t 1/8 12,5% there was 46/174 26,4% there wasn’t 5/8 62,5% I were 2/51 3,9% I weren’t 2/5 40,0% s/he were 5/51 9,8% s/he weren’t 0/5 0% there were 13/51 25,5% there weren’t 1/5 20,0%
The existential constraint applies here as well. The most common pattern with was in positive
contexts is there was, and again the frequency of there is higher than that of the personal
pronouns together. They and we are equally common with was (5,2%), while you is the least
common (2,3%). In the case of were, the results seem very similar. There were is the most
common pattern, and it is more so than I and s/he were combined. Interestingly however, s/he
were is more frequent in comparison to I were. Rather surprisingly so, because of the high
frequency of I were in the previous dialect area.
The number of cases of wasn’t and weren’t in Upper Southwest England was larger than in
any of the previous areas. With wasn’t, there is again the most frequent counterpart. With the
exception of one, all the cases found were with there. Three cases of generalised weren’t were
found, two of which were with I, and one with there.
Using the generalised forms is more common among the older informants in Upper Southwest
England, as it has been with the previous dialect areas as well. Here the difference between the
two groups is very clear. The results distributed according to age group are presented in table 9.
The under 76 –group has 13 and the 76 and over –group 17 informants.
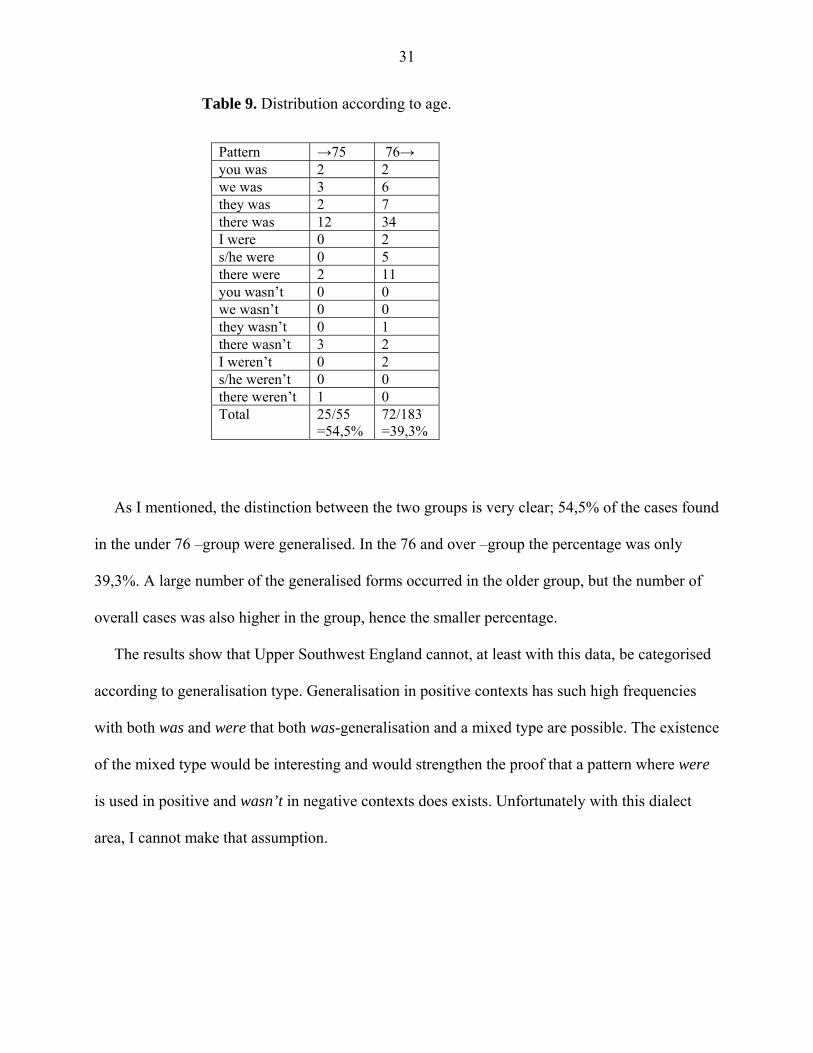
31
Table 9. Distribution according to age.
Pattern →75 76→ you was 2 2 we was 3 6 they was 2 7 there was 12 34 I were 0 2 s/he were 0 5 there were 2 11 you wasn’t 0 0 we wasn’t 0 0 they wasn’t 0 1 there wasn’t 3 2 I weren’t 0 2 s/he weren’t 0 0 there weren’t 1 0 Total
25/55 =54,5%
72/183 =39,3%
As I mentioned, the distinction between the two groups is very clear; 54,5% of the cases found
in the under 76 –group were generalised. In the 76 and over –group the percentage was only
39,3%. A large number of the generalised forms occurred in the older group, but the number of
overall cases was also higher in the group, hence the smaller percentage.
The results show that Upper Southwest England cannot, at least with this data, be categorised
according to generalisation type. Generalisation in positive contexts has such high frequencies
with both was and were that both was-generalisation and a mixed type are possible. The existence
of the mixed type would be interesting and would strengthen the proof that a pattern where were
is used in positive and wasn’t in negative contexts does exists. Unfortunately with this dialect
area, I cannot make that assumption.
32
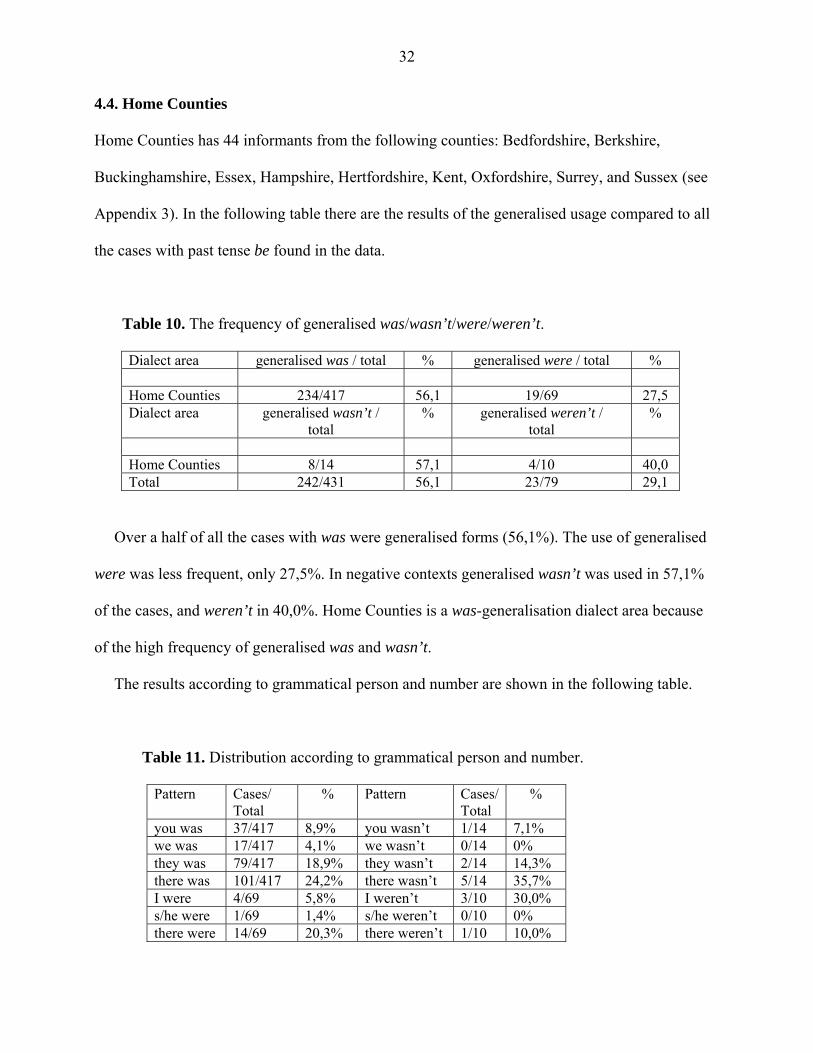
4.4. Home Counties
Home Counties has 44 informants from the following counties: Bedfordshire, Berkshire,
Buckinghamshire, Essex, Hampshire, Hertfordshire, Kent, Oxfordshire, Surrey, and Sussex (see
Appendix 3). In the following table there are the results of the generalised usage compared to all
the cases with past tense be found in the data.
Table 10. The frequency of generalised was/wasn’t/were/weren’t.
Dialect area generalised was / total % generalised were / total % Home Counties 234/417 56,1 19/69 27,5 Dialect area generalised wasn’t /
total % generalised weren’t /
total %
Home Counties 8/14 57,1 4/10 40,0 Total 242/431 56,1 23/79 29,1
Over a half of all the cases with was were generalised forms (56,1%). The use of generalised
were was less frequent, only 27,5%. In negative contexts generalised wasn’t was used in 57,1%
of the cases, and weren’t in 40,0%. Home Counties is a was-generalisation dialect area because
of the high frequency of generalised was and wasn’t.
The results according to grammatical person and number are shown in the following table.
Table 11. Distribution according to grammatical person and number.
Pattern Cases/ Total
% Pattern Cases/ Total
%
you was 37/417 8,9% you wasn’t 1/14 7,1% we was 17/417 4,1% we wasn’t 0/14 0% they was 79/417 18,9% they wasn’t 2/14 14,3% there was 101/417 24,2% there wasn’t 5/14 35,7% I were 4/69 5,8% I weren’t 3/10 30,0% s/he were 1/69 1,4% s/he weren’t 0/10 0% there were 14/69 20,3% there weren’t 1/10 10,0%
33
As such, the existential there is most commonly used with was (24,2%). However, there were
many cases of personal pronoun use with was in the data. So much so that together the pronouns
you, we, and they are more common than there. Of the patterns with a pronoun, they was (18,9%)
is the most frequent, followed by you was (8,9%), and we was (4,1%). There were not many
cases of generalised were found in the data, but of the cases I did find, there was the most
commonly used (20,3%), followed by I were (5,8%), and s/he were (1,4%). In negative contexts
there is also most commonly used with wasn’t. Interestingly with weren’t, there were more cases
of I weren’t than there were of there weren’t. All in all, the representation of the negative forms
was quite poor in the Home Counties. The following sentences are examples of usage taken from
the data. In the first one the informant uses both wasn’t and weren’t in referring to the same
subject. In the second one the informant uses the pattern they was.
(7) ...They weren't no more exp- +... They wasn't so good experienced as the shepherd was perhaps at shearing 'em, but # that 's what they used to do... (informant Bk5) (8) ... They was wheelwrights,you see. They made carts, wagons... (informant Bk3)
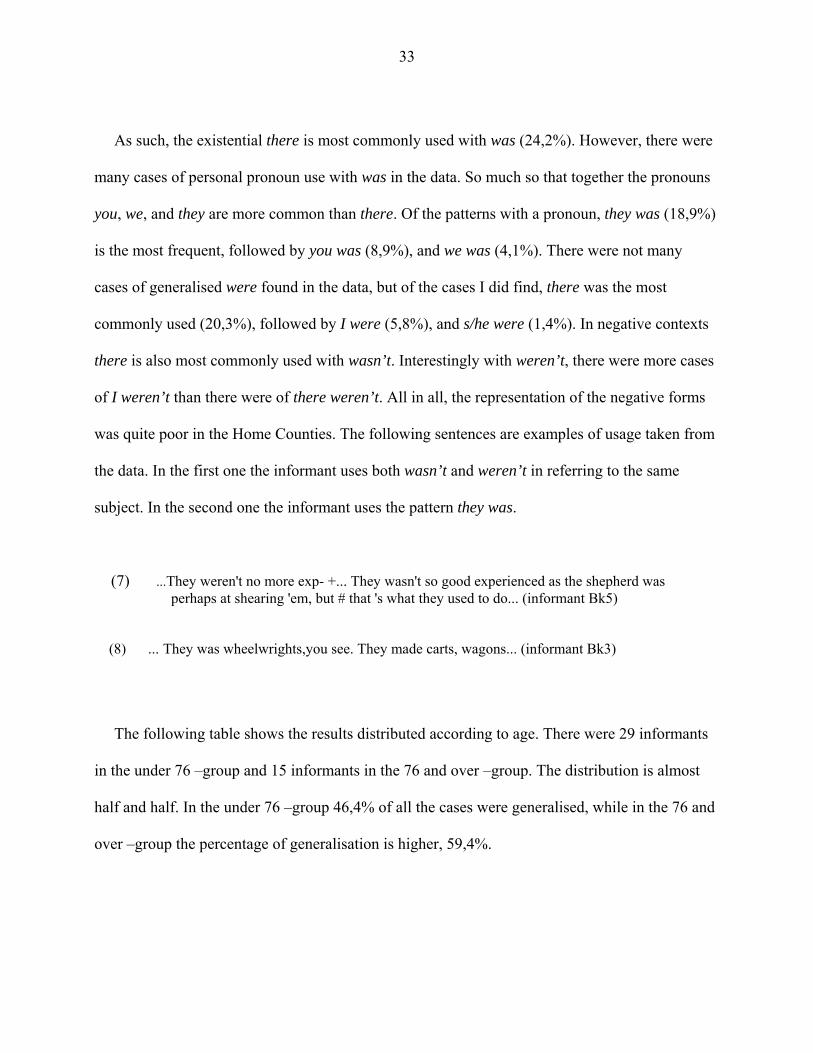
The following table shows the results distributed according to age. There were 29 informants
in the under 76 –group and 15 informants in the 76 and over –group. The distribution is almost
half and half. In the under 76 –group 46,4% of all the cases were generalised, while in the 76 and
over –group the percentage of generalisation is higher, 59,4%.
34
Table 12. Distribution according to age.
Pattern →75 76→ you was 18 19 we was 17 0 they was 35 44 there was 51 50 I were 3 1 s/he were 0 1 there were 5 9 you wasn’t 0 1 we wasn’t 0 0 they wasn’t 0 2 there wasn’t 3 2 I weren’t 2 1 s/he weren’t 0 0 there weren’t 1 0 Total
135/291 =46,4%
130/219 =59,4%
There are more generalised cases in the under 76 –group, but the total number of cases in that
group was higher, therefore the percentage was smaller. So far, there have been two areas where
generalisation is more common in the younger group, and one where it has been more common in
the older group. Home Counties is the second dialect area where generalisation is more frequent
in the 76 and over –group. The under 76 –group has almost twice the number of informants than
the 76 and over group. Interestingly, this does not affect the results. The cases seem to be quite
equally distributed between the two groups, but there is one pattern that has a large number of
cases and they are all found in one group; we was has 17 cases found in the data and they are all
found among the under 76 –group.
In general, Home Counties is a was-generalisation area, where the frequency of generalisation
seems to be higher among the 76 and over –age group.

35
4.5. East Anglia
East Anglia has informants from Essex, Norfolk, and Suffolk (see Appendix 3). Altogether 19
informants were interviewed. The overall results of East Anglia are as follows:
Table 13. The frequency of generalised was/wasn’t/were/weren’t.
Dialect area generalised was / total % generalised were / total % East Anglia 57/113 50,4 7/14 50,0 Dialect area generalised wasn’t /
total % generalised weren’t /
total %
East Anglia 2/3 66,6 4/7 57,1 Total 59/116 50,9 11/21 52,4
East Anglia seems to be as difficult to categorise as Upper Southwest England. In positive
contexts, the percentages are relatively high, but also very close to each other. Was is generalised
in 50,4% of all the cases with was in the data, and were in 50,0% of the cases. Generalisation in
negative contexts seems to have high frequencies as well. Wasn’t is generalised in 66,6% of the
cases and weren’t in 57,1%. Even though the representation in this area is not very high, the
results can be considered valid. There were only a few negative cases found, but a very large part
of the ones that were used in the data were generalised forms.
The next table will give a more detailed analysis of the overall results as they are distributed
according to grammatical person and number. As in the other dialect areas, the existential
constraint applies in East Anglia as well.
36
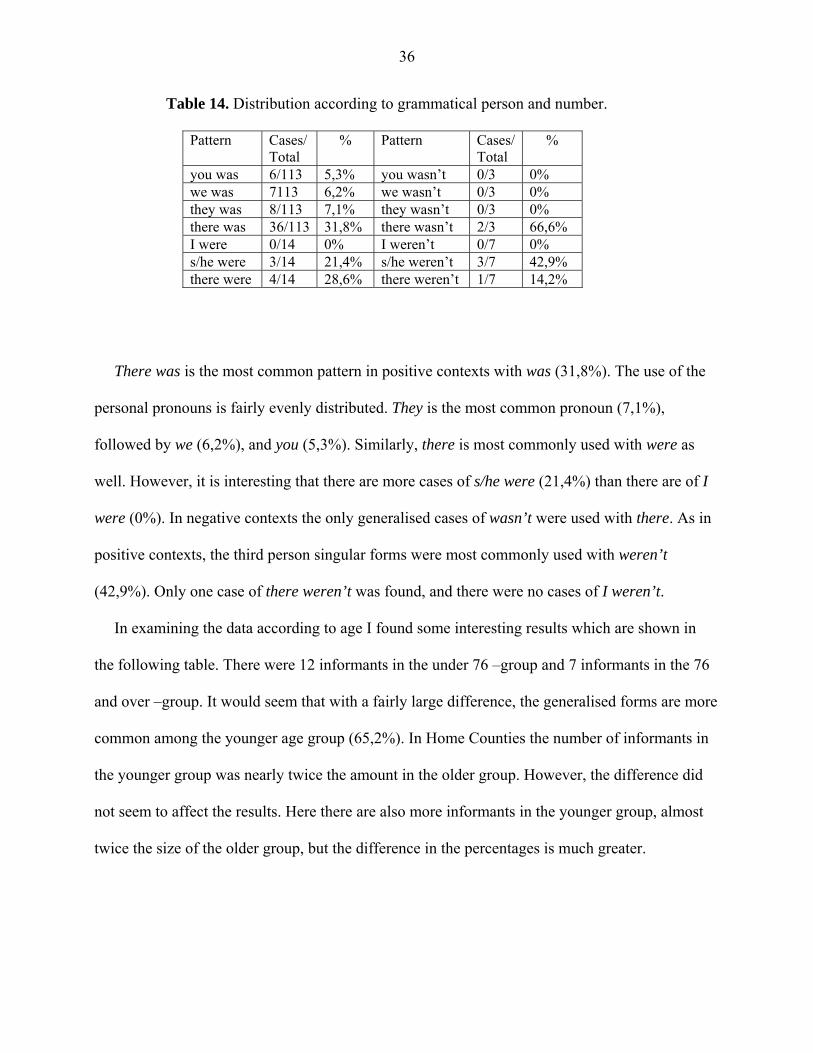
Table 14. Distribution according to grammatical person and number.
Pattern Cases/ Total
% Pattern Cases/ Total
%
you was 6/113 5,3% you wasn’t 0/3 0% we was 7113 6,2% we wasn’t 0/3 0% they was 8/113 7,1% they wasn’t 0/3 0% there was 36/113 31,8% there wasn’t 2/3 66,6% I were 0/14 0% I weren’t 0/7 0% s/he were 3/14 21,4% s/he weren’t 3/7 42,9% there were 4/14 28,6% there weren’t 1/7 14,2%
There was is the most common pattern in positive contexts with was (31,8%). The use of the
personal pronouns is fairly evenly distributed. They is the most common pronoun (7,1%),
followed by we (6,2%), and you (5,3%). Similarly, there is most commonly used with were as
well. However, it is interesting that there are more cases of s/he were (21,4%) than there are of I
were (0%). In negative contexts the only generalised cases of wasn’t were used with there. As in
positive contexts, the third person singular forms were most commonly used with weren’t
(42,9%). Only one case of there weren’t was found, and there were no cases of I weren’t.
In examining the data according to age I found some interesting results which are shown in
the following table. There were 12 informants in the under 76 –group and 7 informants in the 76
and over –group. It would seem that with a fairly large difference, the generalised forms are more
common among the younger age group (65,2%). In Home Counties the number of informants in
the younger group was nearly twice the amount in the older group. However, the difference did
not seem to affect the results. Here there are also more informants in the younger group, almost
twice the size of the older group, but the difference in the percentages is much greater.
37
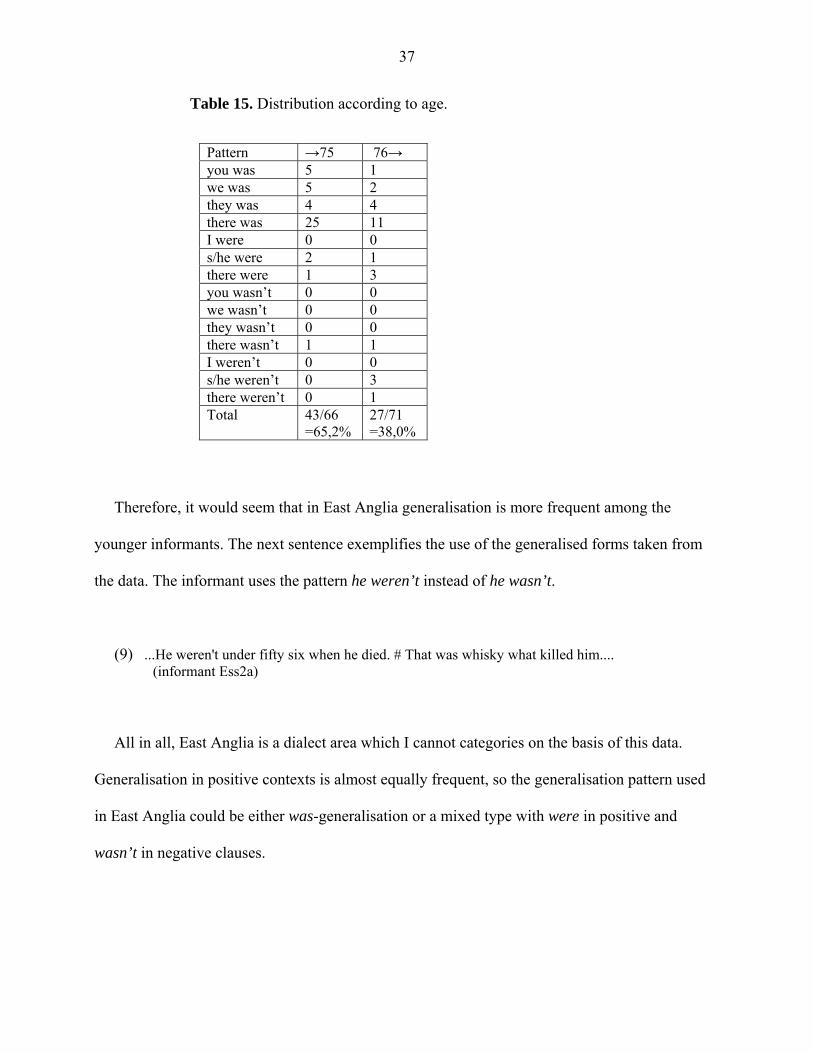
Table 15. Distribution according to age.
Pattern →75 76→ you was 5 1 we was 5 2 they was 4 4 there was 25 11 I were 0 0 s/he were 2 1 there were 1 3 you wasn’t 0 0 we wasn’t 0 0 they wasn’t 0 0 there wasn’t 1 1 I weren’t 0 0 s/he weren’t 0 3 there weren’t 0 1 Total
43/66 =65,2%
27/71 =38,0%
Therefore, it would seem that in East Anglia generalisation is more frequent among the
younger informants. The next sentence exemplifies the use of the generalised forms taken from
the data. The informant uses the pattern he weren’t instead of he wasn’t.
(9) ...He weren't under fifty six when he died. # That was whisky what killed him.... (informant Ess2a)
All in all, East Anglia is a dialect area which I cannot categories on the basis of this data.
Generalisation in positive contexts is almost equally frequent, so the generalisation pattern used
in East Anglia could be either was-generalisation or a mixed type with were in positive and
wasn’t in negative clauses.
38
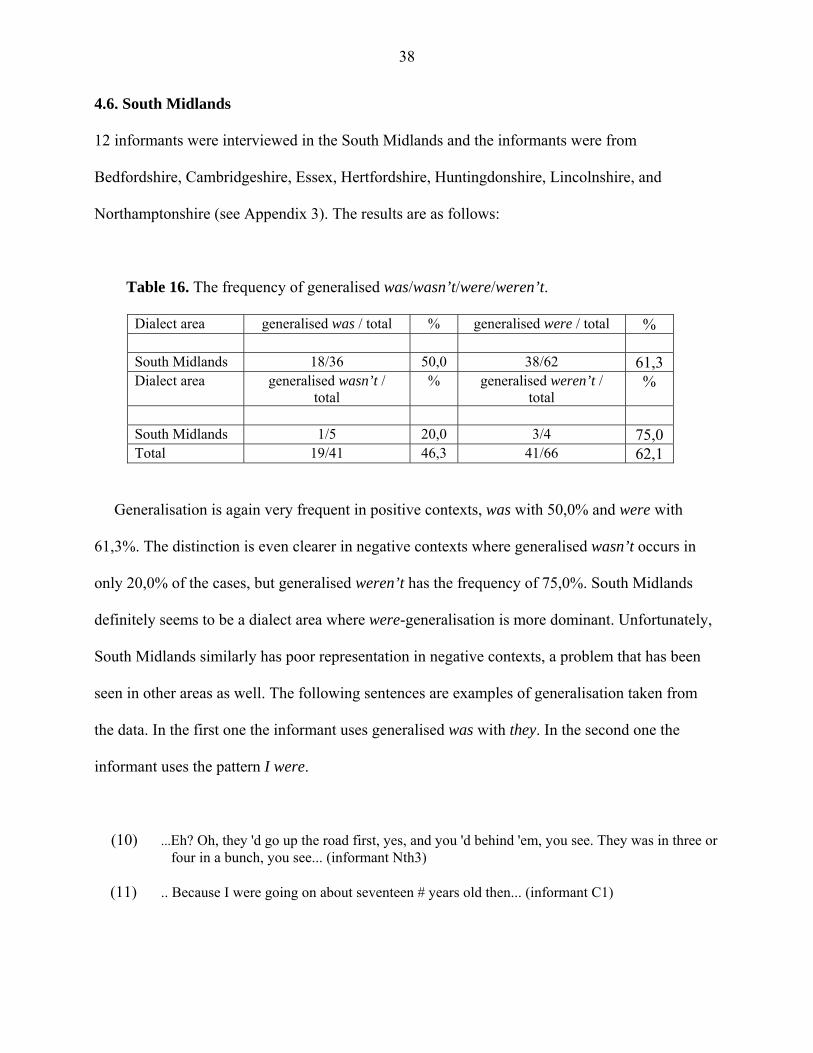
4.6. South Midlands
12 informants were interviewed in the South Midlands and the informants were from
Bedfordshire, Cambridgeshire, Essex, Hertfordshire, Huntingdonshire, Lincolnshire, and
Northamptonshire (see Appendix 3). The results are as follows:
Table 16. The frequency of generalised was/wasn’t/were/weren’t.
Dialect area generalised was / total % generalised were / total % South Midlands 18/36 50,0 38/62 61,3 Dialect area generalised wasn’t /
total % generalised weren’t /
total %
South Midlands 1/5 20,0 3/4 75,0 Total 19/41 46,3 41/66 62,1
Generalisation is again very frequent in positive contexts, was with 50,0% and were with
61,3%. The distinction is even clearer in negative contexts where generalised wasn’t occurs in
only 20,0% of the cases, but generalised weren’t has the frequency of 75,0%. South Midlands
definitely seems to be a dialect area where were-generalisation is more dominant. Unfortunately,
South Midlands similarly has poor representation in negative contexts, a problem that has been
seen in other areas as well. The following sentences are examples of generalisation taken from
the data. In the first one the informant uses generalised was with they. In the second one the
informant uses the pattern I were.
(10) ...Eh? Oh, they 'd go up the road first, yes, and you 'd behind 'em, you see. They was in three or four in a bunch, you see... (informant Nth3) (11) .. Because I were going on about seventeen # years old then... (informant C1)
39
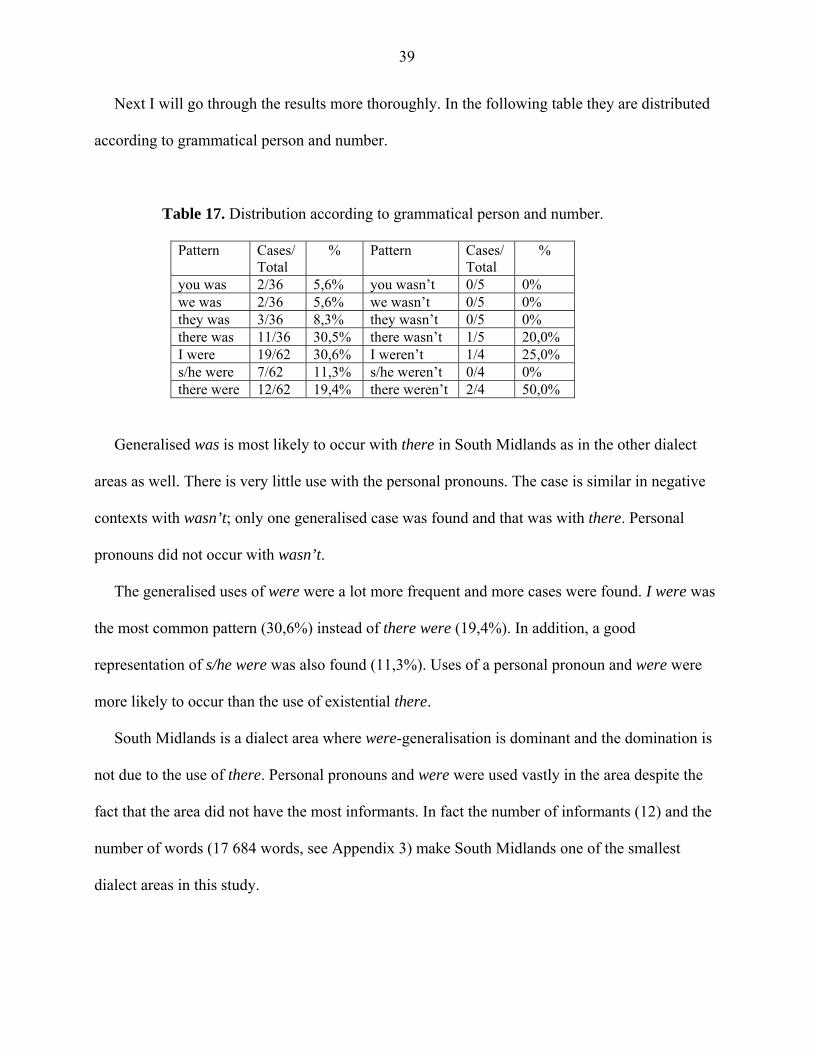
Next I will go through the results more thoroughly. In the following table they are distributed
according to grammatical person and number.
Table 17. Distribution according to grammatical person and number.
Pattern Cases/ Total
% Pattern Cases/ Total
%
you was 2/36 5,6% you wasn’t 0/5 0% we was 2/36 5,6% we wasn’t 0/5 0% they was 3/36 8,3% they wasn’t 0/5 0% there was 11/36 30,5% there wasn’t 1/5 20,0% I were 19/62 30,6% I weren’t 1/4 25,0% s/he were 7/62 11,3% s/he weren’t 0/4 0% there were 12/62 19,4% there weren’t 2/4 50,0%
Generalised was is most likely to occur with there in South Midlands as in the other dialect
areas as well. There is very little use with the personal pronouns. The case is similar in negative
contexts with wasn’t; only one generalised case was found and that was with there. Personal
pronouns did not occur with wasn’t.
The generalised uses of were were a lot more frequent and more cases were found. I were was
the most common pattern (30,6%) instead of there were (19,4%). In addition, a good
representation of s/he were was also found (11,3%). Uses of a personal pronoun and were were
more likely to occur than the use of existential there.
South Midlands is a dialect area where were-generalisation is dominant and the domination is
not due to the use of there. Personal pronouns and were were used vastly in the area despite the
fact that the area did not have the most informants. In fact the number of informants (12) and the
number of words (17 684 words, see Appendix 3) make South Midlands one of the smallest
dialect areas in this study.
40
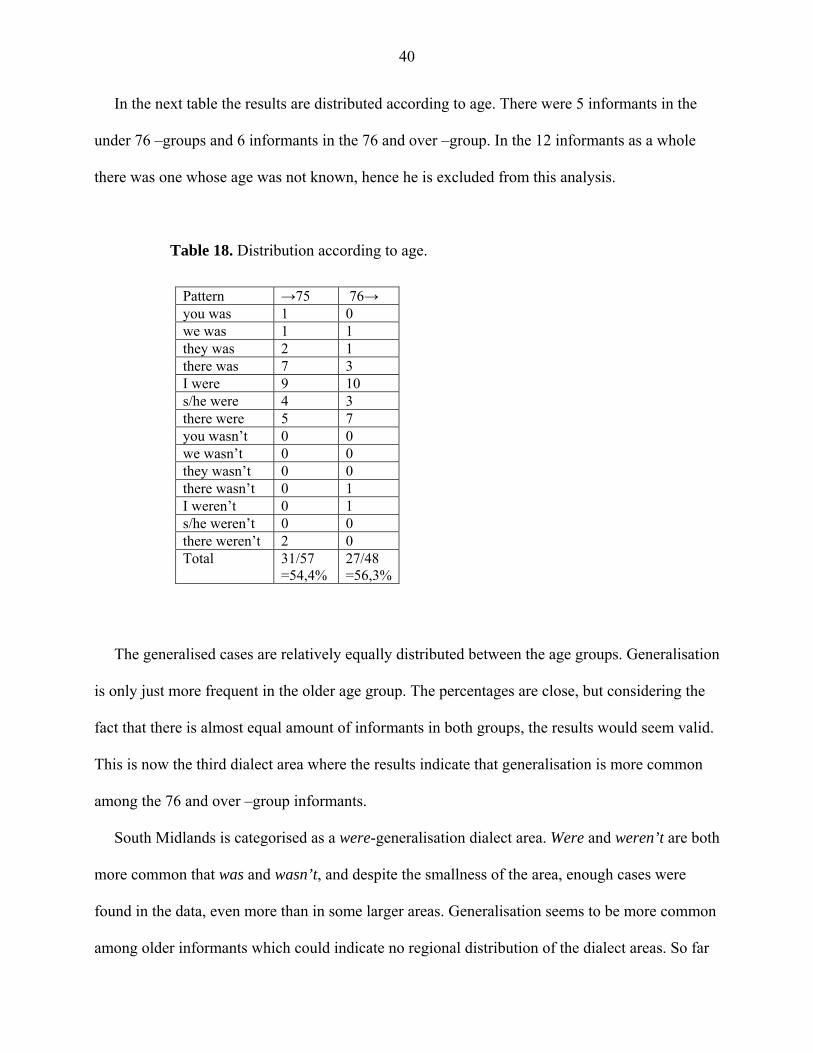
In the next table the results are distributed according to age. There were 5 informants in the
under 76 –groups and 6 informants in the 76 and over –group. In the 12 informants as a whole
there was one whose age was not known, hence he is excluded from this analysis.
Table 18. Distribution according to age.
Pattern →75 76→ you was 1 0 we was 1 1 they was 2 1 there was 7 3 I were 9 10 s/he were 4 3 there were 5 7 you wasn’t 0 0 we wasn’t 0 0 they wasn’t 0 0 there wasn’t 0 1 I weren’t 0 1 s/he weren’t 0 0 there weren’t 2 0 Total
31/57 =54,4%
27/48 =56,3%
The generalised cases are relatively equally distributed between the age groups. Generalisation
is only just more frequent in the older age group. The percentages are close, but considering the
fact that there is almost equal amount of informants in both groups, the results would seem valid.
This is now the third dialect area where the results indicate that generalisation is more common
among the 76 and over –group informants.
South Midlands is categorised as a were-generalisation dialect area. Were and weren’t are both
more common that was and wasn’t, and despite the smallness of the area, enough cases were
found in the data, even more than in some larger areas. Generalisation seems to be more common
among older informants which could indicate no regional distribution of the dialect areas. So far
41
there have been three dialect areas where generalisation is more common in the under 76 –group
and three where it is more common in the 76 and over –group as well.
4.7. Midlands
Midlands consists of informants from the following counties: Lincolnshire, Leicestershire,
Rutland, Shropshire, Staffordshire, Warwickshire, and Worcestershire. There were altogether 17
interviewees. In the following table are the overall results of the dialect area.
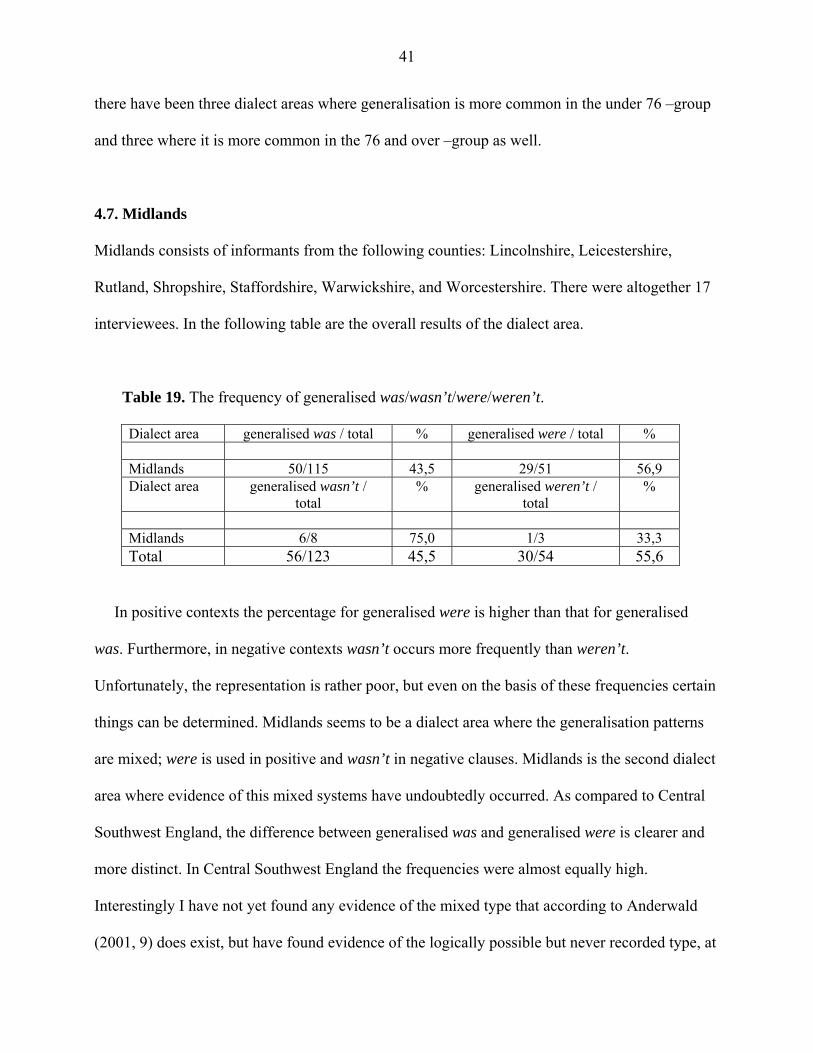
Table 19. The frequency of generalised was/wasn’t/were/weren’t.
Dialect area generalised was / total % generalised were / total % Midlands 50/115 43,5 29/51 56,9 Dialect area generalised wasn’t /
total % generalised weren’t /
total %
Midlands 6/8 75,0 1/3 33,3 Total 56/123 45,5 30/54 55,6
In positive contexts the percentage for generalised were is higher than that for generalised
was. Furthermore, in negative contexts wasn’t occurs more frequently than weren’t.
Unfortunately, the representation is rather poor, but even on the basis of these frequencies certain
things can be determined. Midlands seems to be a dialect area where the generalisation patterns
are mixed; were is used in positive and wasn’t in negative clauses. Midlands is the second dialect
area where evidence of this mixed systems have undoubtedly occurred. As compared to Central
Southwest England, the difference between generalised was and generalised were is clearer and
more distinct. In Central Southwest England the frequencies were almost equally high.
Interestingly I have not yet found any evidence of the mixed type that according to Anderwald
(2001, 9) does exist, but have found evidence of the logically possible but never recorded type, at
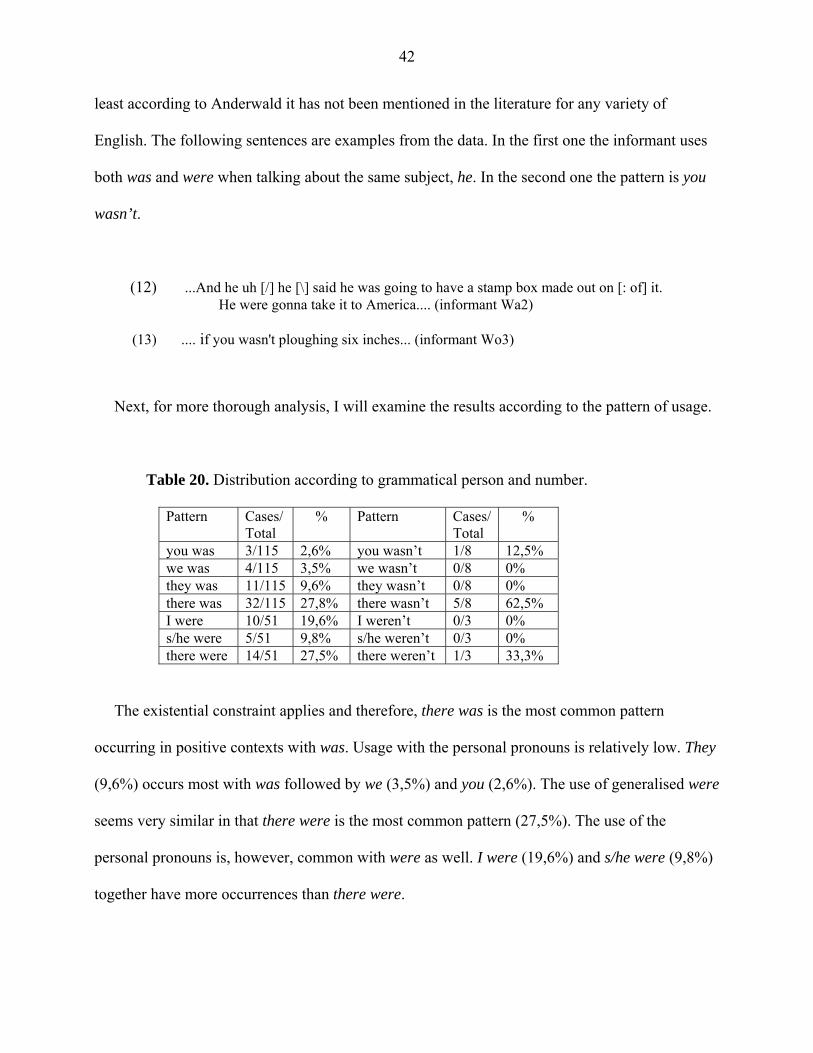
42
least according to Anderwald it has not been mentioned in the literature for any variety of
English. The following sentences are examples from the data. In the first one the informant uses
both was and were when talking about the same subject, he. In the second one the pattern is you
wasn’t.
(12) ...And he uh [/] he [\] said he was going to have a stamp box made out on [: of] it. He were gonna take it to America.... (informant Wa2)
(13) .... if you wasn't ploughing six inches... (informant Wo3)
Next, for more thorough analysis, I will examine the results according to the pattern of usage.
Table 20. Distribution according to grammatical person and number.
Pattern Cases/ Total
% Pattern Cases/ Total
%
you was 3/115 2,6% you wasn’t 1/8 12,5% we was 4/115 3,5% we wasn’t 0/8 0% they was 11/115 9,6% they wasn’t 0/8 0% there was 32/115 27,8% there wasn’t 5/8 62,5% I were 10/51 19,6% I weren’t 0/3 0% s/he were 5/51 9,8% s/he weren’t 0/3 0% there were 14/51 27,5% there weren’t 1/3 33,3%
The existential constraint applies and therefore, there was is the most common pattern
occurring in positive contexts with was. Usage with the personal pronouns is relatively low. They
(9,6%) occurs most with was followed by we (3,5%) and you (2,6%). The use of generalised were
seems very similar in that there were is the most common pattern (27,5%). The use of the
personal pronouns is, however, common with were as well. I were (19,6%) and s/he were (9,8%)
together have more occurrences than there were.
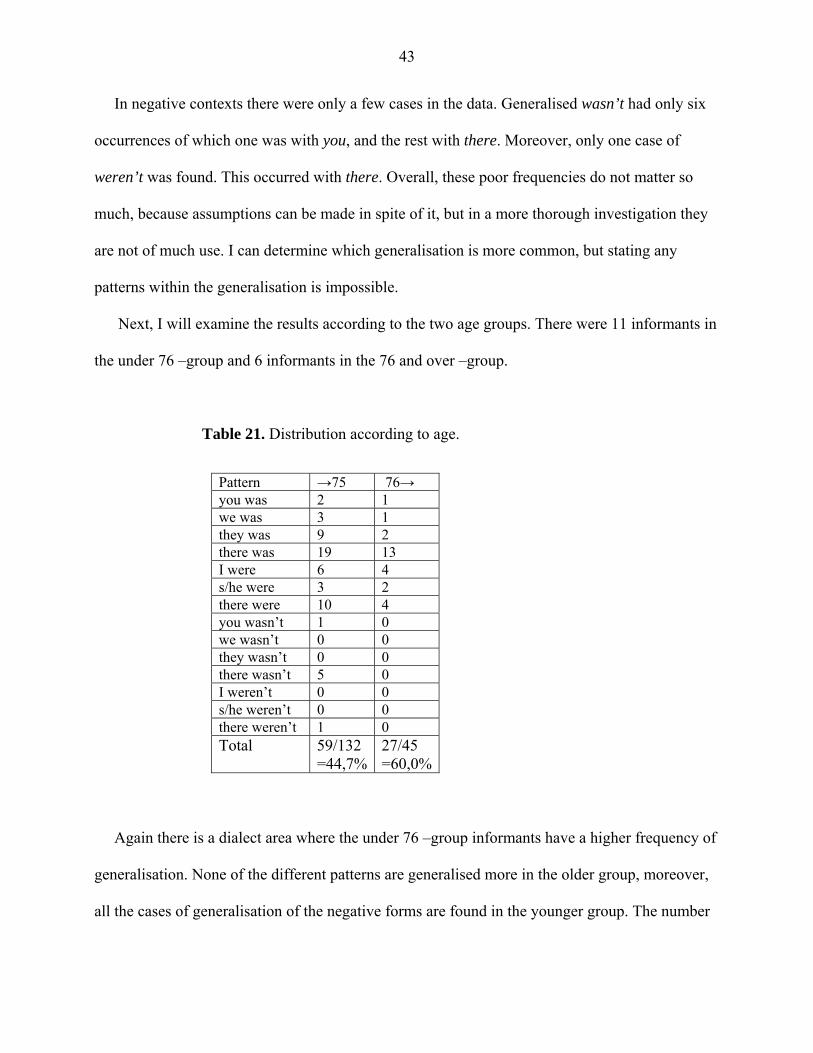
43
In negative contexts there were only a few cases in the data. Generalised wasn’t had only six
occurrences of which one was with you, and the rest with there. Moreover, only one case of
weren’t was found. This occurred with there. Overall, these poor frequencies do not matter so
much, because assumptions can be made in spite of it, but in a more thorough investigation they
are not of much use. I can determine which generalisation is more common, but stating any
patterns within the generalisation is impossible.
Next, I will examine the results according to the two age groups. There were 11 informants in
the under 76 –group and 6 informants in the 76 and over –group.
Table 21. Distribution according to age.
Pattern →75 76→ you was 2 1 we was 3 1 they was 9 2 there was 19 13 I were 6 4 s/he were 3 2 there were 10 4 you wasn’t 1 0 we wasn’t 0 0 they wasn’t 0 0 there wasn’t 5 0 I weren’t 0 0 s/he weren’t 0 0 there weren’t 1 0 Total 59/132
=44,7%27/45 =60,0%
Again there is a dialect area where the under 76 –group informants have a higher frequency of
generalisation. None of the different patterns are generalised more in the older group, moreover,
all the cases of generalisation of the negative forms are found in the younger group. The number
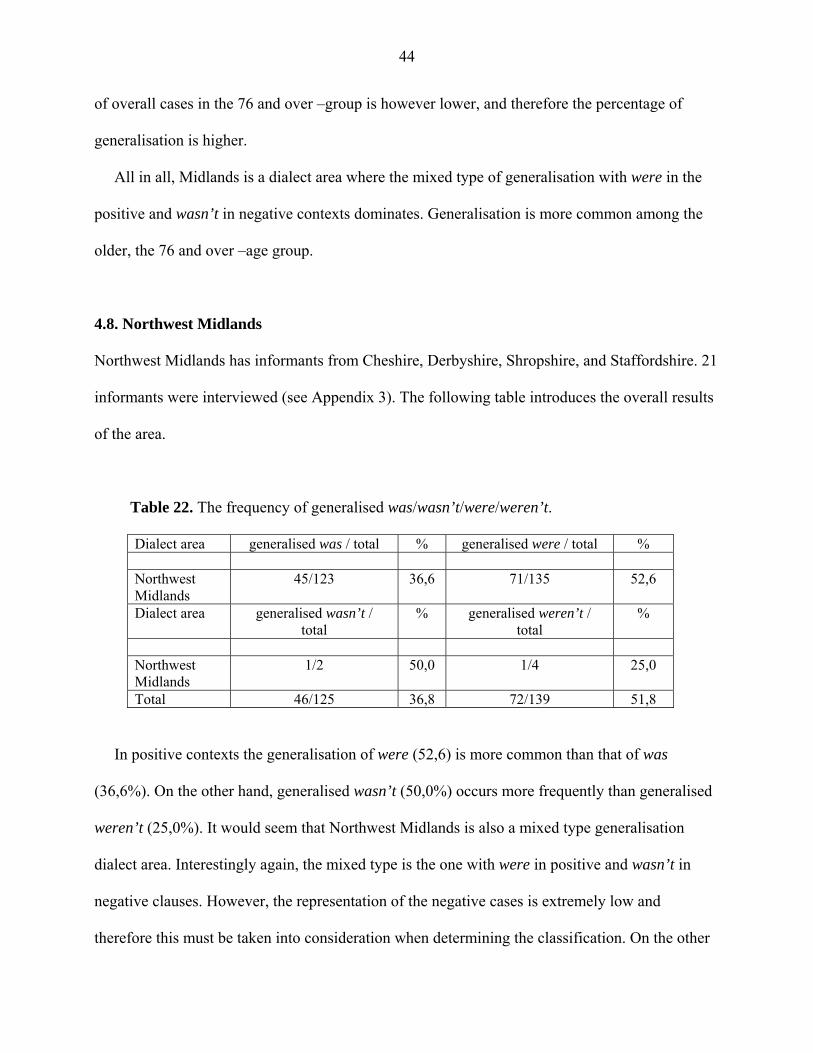
44
of overall cases in the 76 and over –group is however lower, and therefore the percentage of
generalisation is higher.
All in all, Midlands is a dialect area where the mixed type of generalisation with were in the
positive and wasn’t in negative contexts dominates. Generalisation is more common among the
older, the 76 and over –age group.
4.8. Northwest Midlands
Northwest Midlands has informants from Cheshire, Derbyshire, Shropshire, and Staffordshire. 21
informants were interviewed (see Appendix 3). The following table introduces the overall results
of the area.
Table 22. The frequency of generalised was/wasn’t/were/weren’t.
Dialect area generalised was / total % generalised were / total % Northwest Midlands
45/123 36,6 71/135 52,6
Dialect area generalised wasn’t / total
% generalised weren’t / total
%
Northwest Midlands
1/2 50,0 1/4 25,0
Total 46/125 36,8 72/139 51,8
In positive contexts the generalisation of were (52,6) is more common than that of was
(36,6%). On the other hand, generalised wasn’t (50,0%) occurs more frequently than generalised
weren’t (25,0%). It would seem that Northwest Midlands is also a mixed type generalisation
dialect area. Interestingly again, the mixed type is the one with were in positive and wasn’t in
negative clauses. However, the representation of the negative cases is extremely low and
therefore this must be taken into consideration when determining the classification. On the other
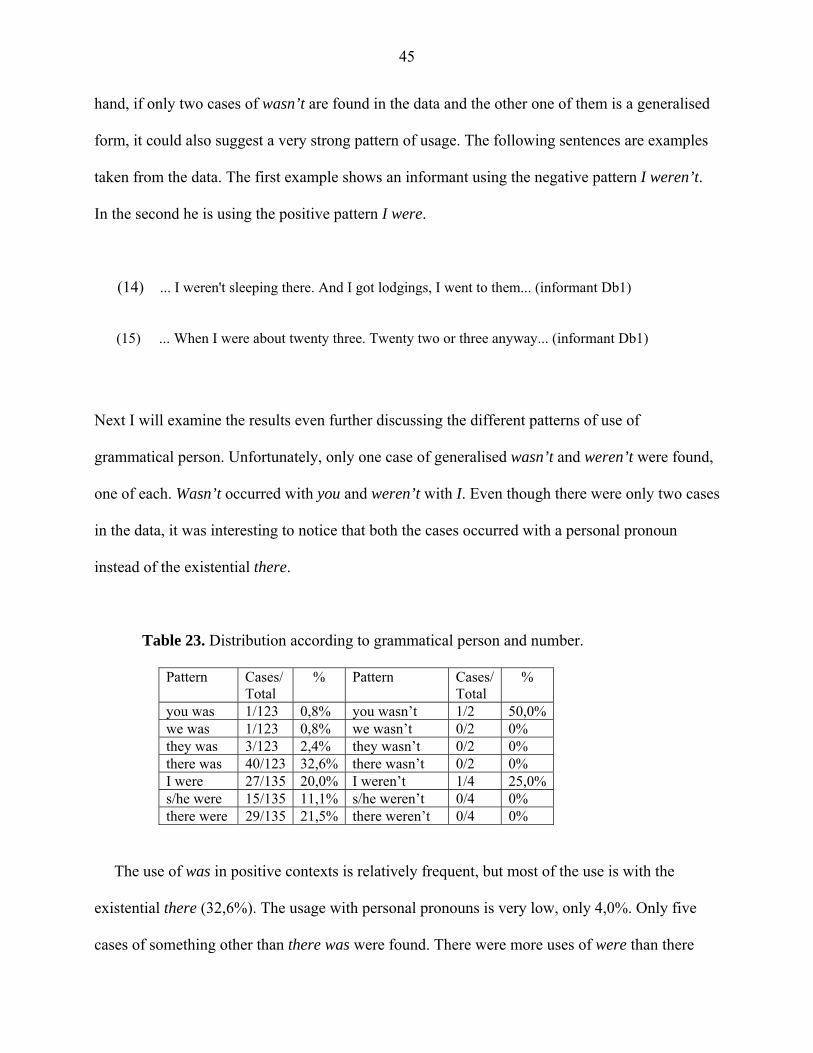
45
hand, if only two cases of wasn’t are found in the data and the other one of them is a generalised
form, it could also suggest a very strong pattern of usage. The following sentences are examples
taken from the data. The first example shows an informant using the negative pattern I weren’t.
In the second he is using the positive pattern I were.
(14) ... I weren't sleeping there. And I got lodgings, I went to them... (informant Db1) (15) ... When I were about twenty three. Twenty two or three anyway... (informant Db1) Next I will examine the results even further discussing the different patterns of use of
grammatical person. Unfortunately, only one case of generalised wasn’t and weren’t were found,
one of each. Wasn’t occurred with you and weren’t with I. Even though there were only two cases
in the data, it was interesting to notice that both the cases occurred with a personal pronoun
instead of the existential there.
Table 23. Distribution according to grammatical person and number.
Pattern Cases/ Total
% Pattern Cases/ Total
%
you was 1/123 0,8% you wasn’t 1/2 50,0%we was 1/123 0,8% we wasn’t 0/2 0% they was 3/123 2,4% they wasn’t 0/2 0% there was 40/123 32,6% there wasn’t 0/2 0% I were 27/135 20,0% I weren’t 1/4 25,0%s/he were 15/135 11,1% s/he weren’t 0/4 0% there were 29/135 21,5% there weren’t 0/4 0%
The use of was in positive contexts is relatively frequent, but most of the use is with the
existential there (32,6%). The usage with personal pronouns is very low, only 4,0%. Only five
cases of something other than there was were found. There were more uses of were than there
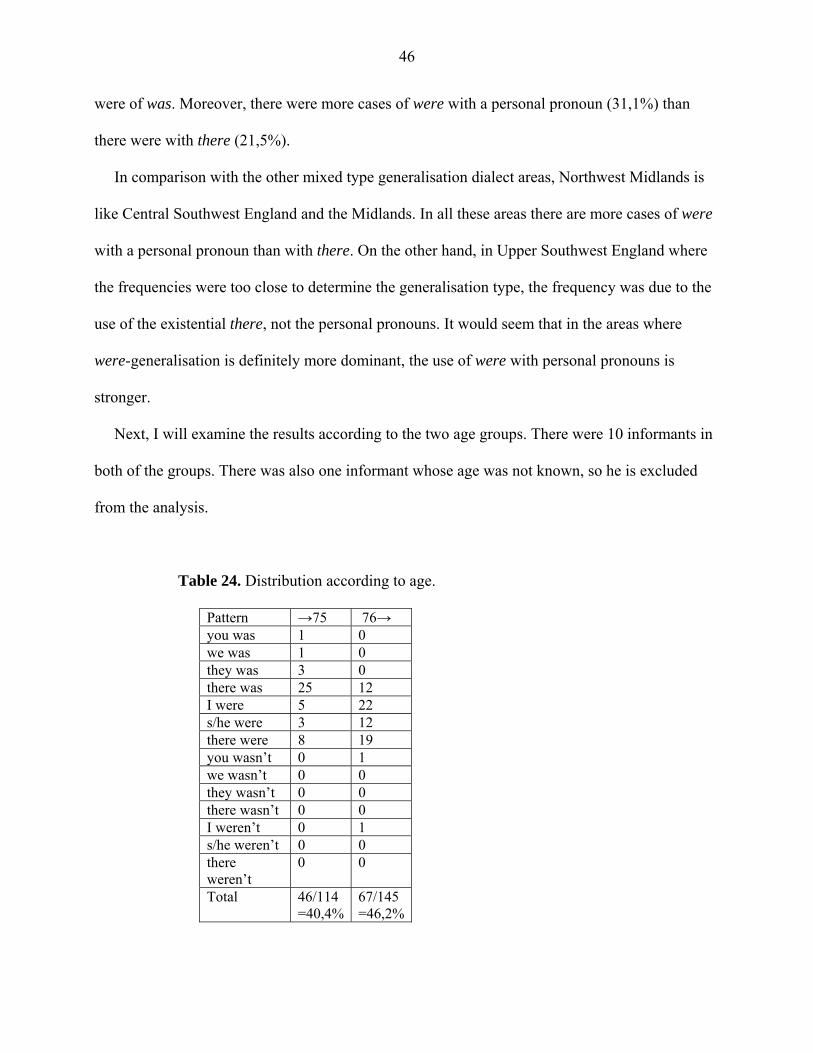
46
were of was. Moreover, there were more cases of were with a personal pronoun (31,1%) than
there were with there (21,5%).
In comparison with the other mixed type generalisation dialect areas, Northwest Midlands is
like Central Southwest England and the Midlands. In all these areas there are more cases of were
with a personal pronoun than with there. On the other hand, in Upper Southwest England where
the frequencies were too close to determine the generalisation type, the frequency was due to the
use of the existential there, not the personal pronouns. It would seem that in the areas where
were-generalisation is definitely more dominant, the use of were with personal pronouns is
stronger.
Next, I will examine the results according to the two age groups. There were 10 informants in
both of the groups. There was also one informant whose age was not known, so he is excluded
from the analysis.
Table 24. Distribution according to age.
Pattern →75 76→ you was 1 0 we was 1 0 they was 3 0 there was 25 12 I were 5 22 s/he were 3 12 there were 8 19 you wasn’t 0 1 we wasn’t 0 0 they wasn’t 0 0 there wasn’t 0 0 I weren’t 0 1 s/he weren’t 0 0 there weren’t
0 0
Total
46/114 =40,4%
67/145 =46,2%
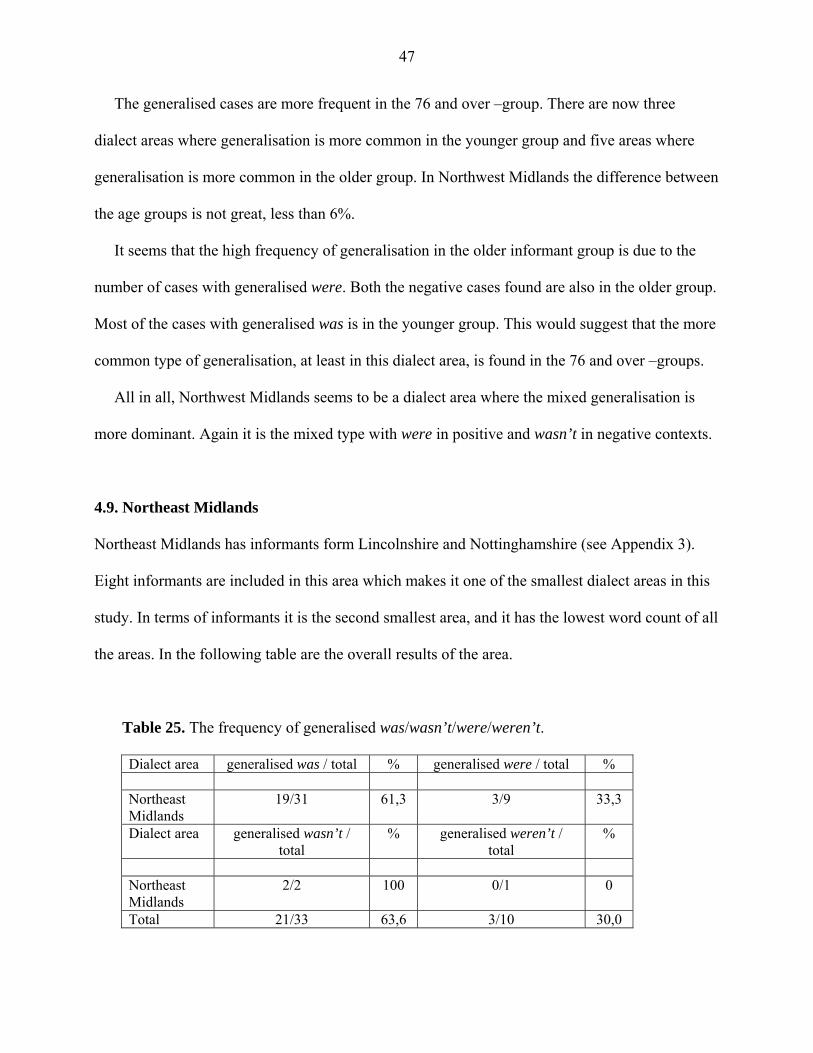
47
The generalised cases are more frequent in the 76 and over –group. There are now three
dialect areas where generalisation is more common in the younger group and five areas where
generalisation is more common in the older group. In Northwest Midlands the difference between
the age groups is not great, less than 6%.
It seems that the high frequency of generalisation in the older informant group is due to the
number of cases with generalised were. Both the negative cases found are also in the older group.
Most of the cases with generalised was is in the younger group. This would suggest that the more
common type of generalisation, at least in this dialect area, is found in the 76 and over –groups.
All in all, Northwest Midlands seems to be a dialect area where the mixed generalisation is
more dominant. Again it is the mixed type with were in positive and wasn’t in negative contexts.
4.9. Northeast Midlands
Northeast Midlands has informants form Lincolnshire and Nottinghamshire (see Appendix 3).
Eight informants are included in this area which makes it one of the smallest dialect areas in this
study. In terms of informants it is the second smallest area, and it has the lowest word count of all
the areas. In the following table are the overall results of the area.
Table 25. The frequency of generalised was/wasn’t/were/weren’t.
Dialect area generalised was / total % generalised were / total % Northeast Midlands
19/31 61,3 3/9 33,3
Dialect area generalised wasn’t / total
% generalised weren’t / total
%
Northeast Midlands
2/2 100 0/1 0
Total 21/33 63,6 3/10 30,0
48
The use of generalised was (61,3%) is more common than that of generalised were (33,3%) of
all the cases with was/were with a personal pronoun or there found in the data. Moreover, the use
of generalised wasn’t (100%) was more common than the use of generalised weren’t (0%).
However, these percentages do not give an accurate picture of the usage because the cases found
in the data were so few. This has been the problem with most of the dialect areas so far. It does,
however, indicate at least a relatively high frequency of use if both the cases found in the data are
generalised as the case was with was. On the other hand, not much can be said about the
generalised use of weren’t because only one case of weren’t was found altogether. Even though it
was not generalised, it does not mean that the people of this dialect area would not generalise the
use of weren’t. After all, this is a very small dialect area at least when the number of informants
is concerned. According to the results Northeast Midlands can be categorised as a was-
generalisation dialect area. The following sentences are examples taken from the data. The first
informant uses the generalised pattern we wasn’t instead of we weren’t. In the second sentence
the informant uses the pattern you was.
(16) .. So they come [: came] to the conclusion at the meeting, we wasn't represented, only with the captain... (informant L11)
(17) ... Uh and if you was going to have your stack ten yards by seven... (informant L10)
Next, I will look at the results more thoroughly in analysing their distribution according to
grammatical person and number. The following table has the results.
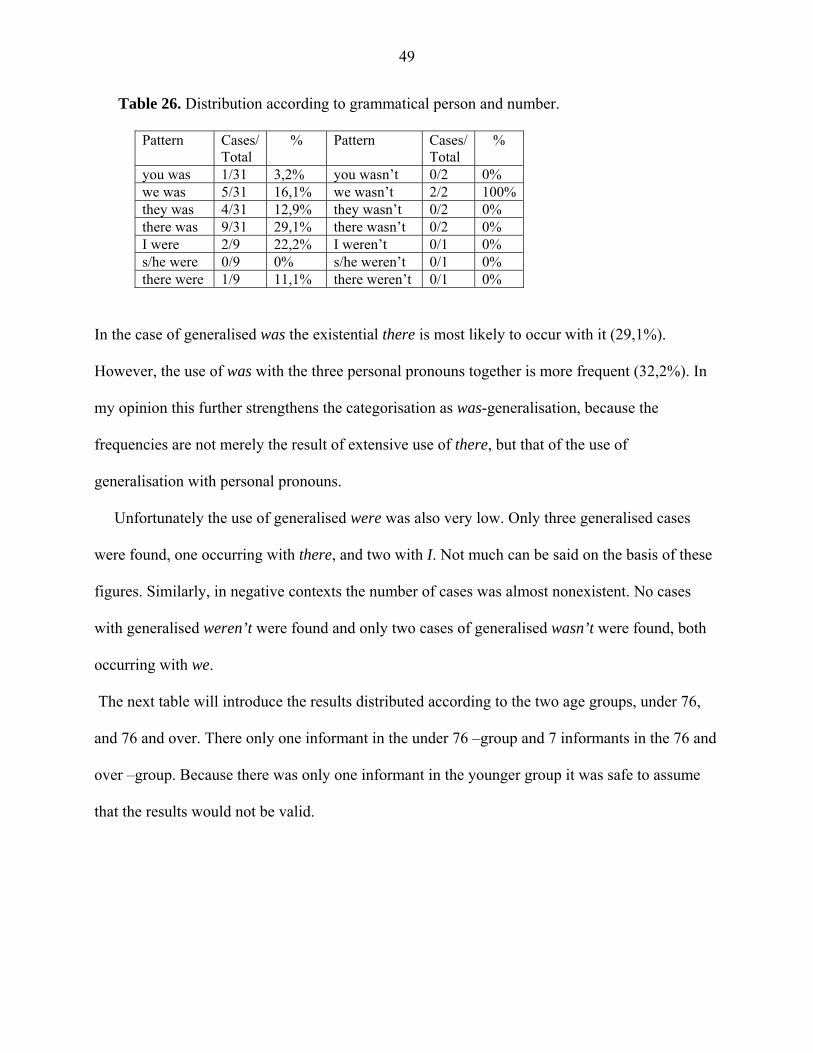
49
Table 26. Distribution according to grammatical person and number.
Pattern Cases/ Total
% Pattern Cases/ Total
%
you was 1/31 3,2% you wasn’t 0/2 0% we was 5/31 16,1% we wasn’t 2/2 100%they was 4/31 12,9% they wasn’t 0/2 0% there was 9/31 29,1% there wasn’t 0/2 0% I were 2/9 22,2% I weren’t 0/1 0% s/he were 0/9 0% s/he weren’t 0/1 0% there were 1/9 11,1% there weren’t 0/1 0%
In the case of generalised was the existential there is most likely to occur with it (29,1%).
However, the use of was with the three personal pronouns together is more frequent (32,2%). In
my opinion this further strengthens the categorisation as was-generalisation, because the
frequencies are not merely the result of extensive use of there, but that of the use of
generalisation with personal pronouns.
Unfortunately the use of generalised were was also very low. Only three generalised cases
were found, one occurring with there, and two with I. Not much can be said on the basis of these
figures. Similarly, in negative contexts the number of cases was almost nonexistent. No cases
with generalised weren’t were found and only two cases of generalised wasn’t were found, both
occurring with we.
The next table will introduce the results distributed according to the two age groups, under 76,
and 76 and over. There only one informant in the under 76 –group and 7 informants in the 76 and
over –group. Because there was only one informant in the younger group it was safe to assume
that the results would not be valid.
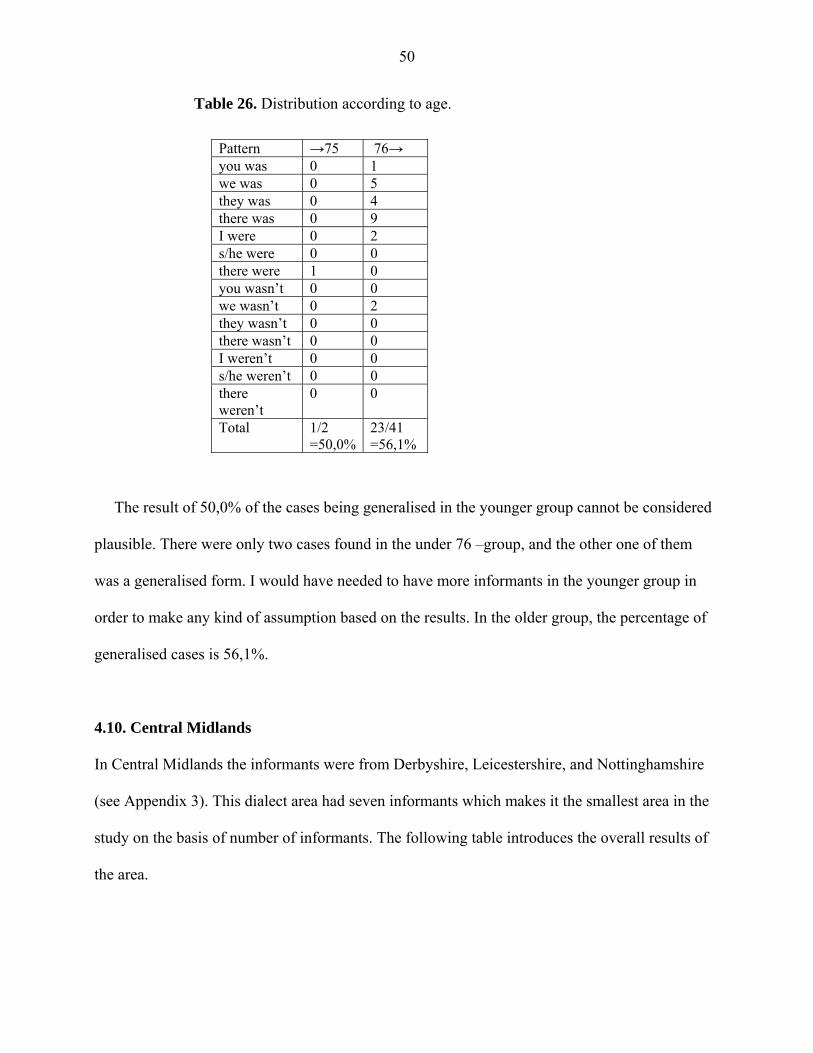
50
Table 26. Distribution according to age.
Pattern →75 76→ you was 0 1 we was 0 5 they was 0 4 there was 0 9 I were 0 2 s/he were 0 0 there were 1 0 you wasn’t 0 0 we wasn’t 0 2 they wasn’t 0 0 there wasn’t 0 0 I weren’t 0 0 s/he weren’t 0 0 there weren’t
0 0
Total
1/2 =50,0%
23/41 =56,1%
The result of 50,0% of the cases being generalised in the younger group cannot be considered
plausible. There were only two cases found in the under 76 –group, and the other one of them
was a generalised form. I would have needed to have more informants in the younger group in
order to make any kind of assumption based on the results. In the older group, the percentage of
generalised cases is 56,1%.
4.10. Central Midlands
In Central Midlands the informants were from Derbyshire, Leicestershire, and Nottinghamshire
(see Appendix 3). This dialect area had seven informants which makes it the smallest area in the
study on the basis of number of informants. The following table introduces the overall results of
the area.
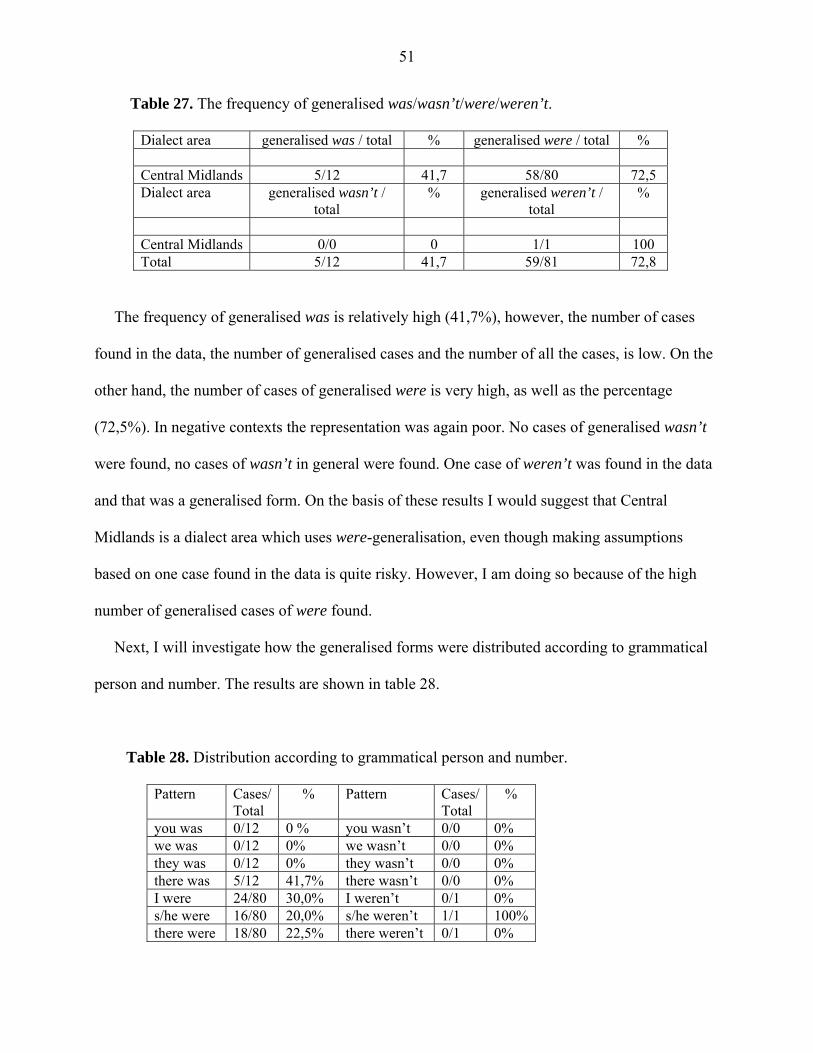
51
Table 27. The frequency of generalised was/wasn’t/were/weren’t.
Dialect area generalised was / total % generalised were / total % Central Midlands 5/12 41,7 58/80 72,5 Dialect area generalised wasn’t /
total % generalised weren’t /
total %
Central Midlands 0/0 0 1/1 100 Total 5/12 41,7 59/81 72,8
The frequency of generalised was is relatively high (41,7%), however, the number of cases
found in the data, the number of generalised cases and the number of all the cases, is low. On the
other hand, the number of cases of generalised were is very high, as well as the percentage
(72,5%). In negative contexts the representation was again poor. No cases of generalised wasn’t
were found, no cases of wasn’t in general were found. One case of weren’t was found in the data
and that was a generalised form. On the basis of these results I would suggest that Central
Midlands is a dialect area which uses were-generalisation, even though making assumptions
based on one case found in the data is quite risky. However, I am doing so because of the high
number of generalised cases of were found.
Next, I will investigate how the generalised forms were distributed according to grammatical
person and number. The results are shown in table 28.
Table 28. Distribution according to grammatical person and number.
Pattern Cases/ Total
% Pattern Cases/ Total
%
you was 0/12 0 % you wasn’t 0/0 0% we was 0/12 0% we wasn’t 0/0 0% they was 0/12 0% they wasn’t 0/0 0% there was 5/12 41,7% there wasn’t 0/0 0% I were 24/80 30,0% I weren’t 0/1 0% s/he were 16/80 20,0% s/he weren’t 1/1 100%there were 18/80 22,5% there weren’t 0/1 0%
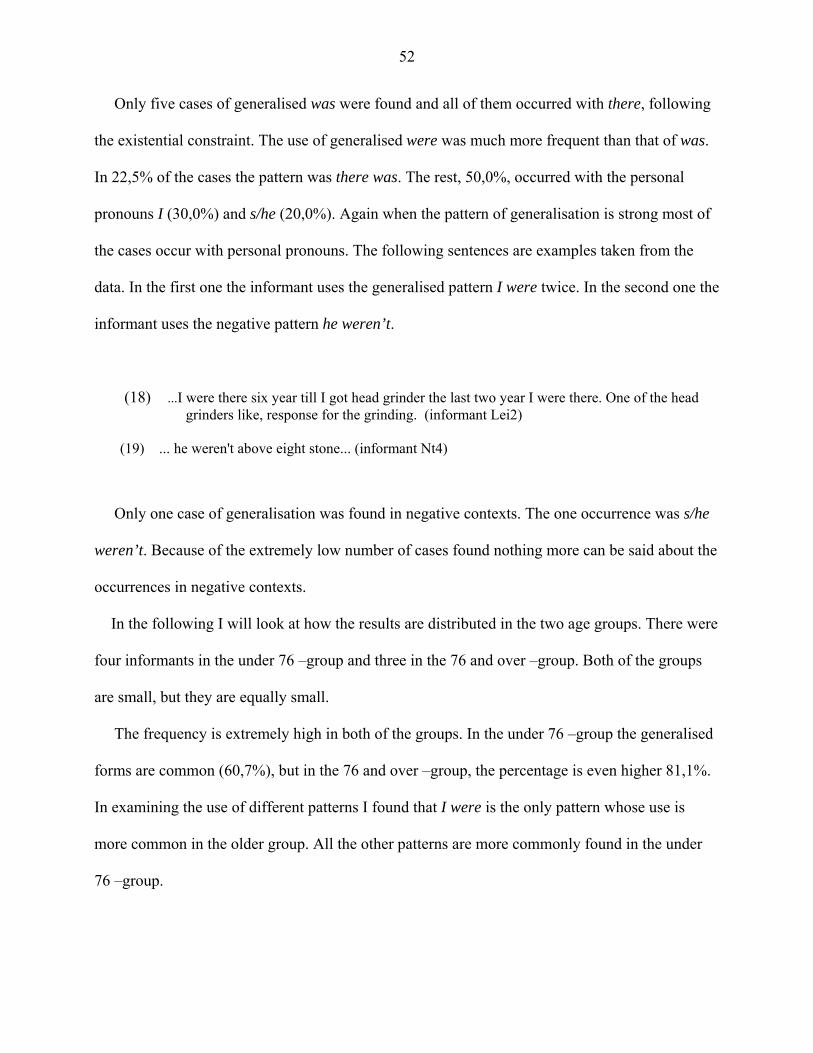
52
Only five cases of generalised was were found and all of them occurred with there, following
the existential constraint. The use of generalised were was much more frequent than that of was.
In 22,5% of the cases the pattern was there was. The rest, 50,0%, occurred with the personal
pronouns I (30,0%) and s/he (20,0%). Again when the pattern of generalisation is strong most of
the cases occur with personal pronouns. The following sentences are examples taken from the
data. In the first one the informant uses the generalised pattern I were twice. In the second one the
informant uses the negative pattern he weren’t.
(18) ...I were there six year till I got head grinder the last two year I were there. One of the head grinders like, response for the grinding. (informant Lei2) (19) ... he weren't above eight stone... (informant Nt4) Only one case of generalisation was found in negative contexts. The one occurrence was s/he
weren’t. Because of the extremely low number of cases found nothing more can be said about the
occurrences in negative contexts.
In the following I will look at how the results are distributed in the two age groups. There were
four informants in the under 76 –group and three in the 76 and over –group. Both of the groups
are small, but they are equally small.
The frequency is extremely high in both of the groups. In the under 76 –group the generalised
forms are common (60,7%), but in the 76 and over –group, the percentage is even higher 81,1%.
In examining the use of different patterns I found that I were is the only pattern whose use is
more common in the older group. All the other patterns are more commonly found in the under
76 –group.
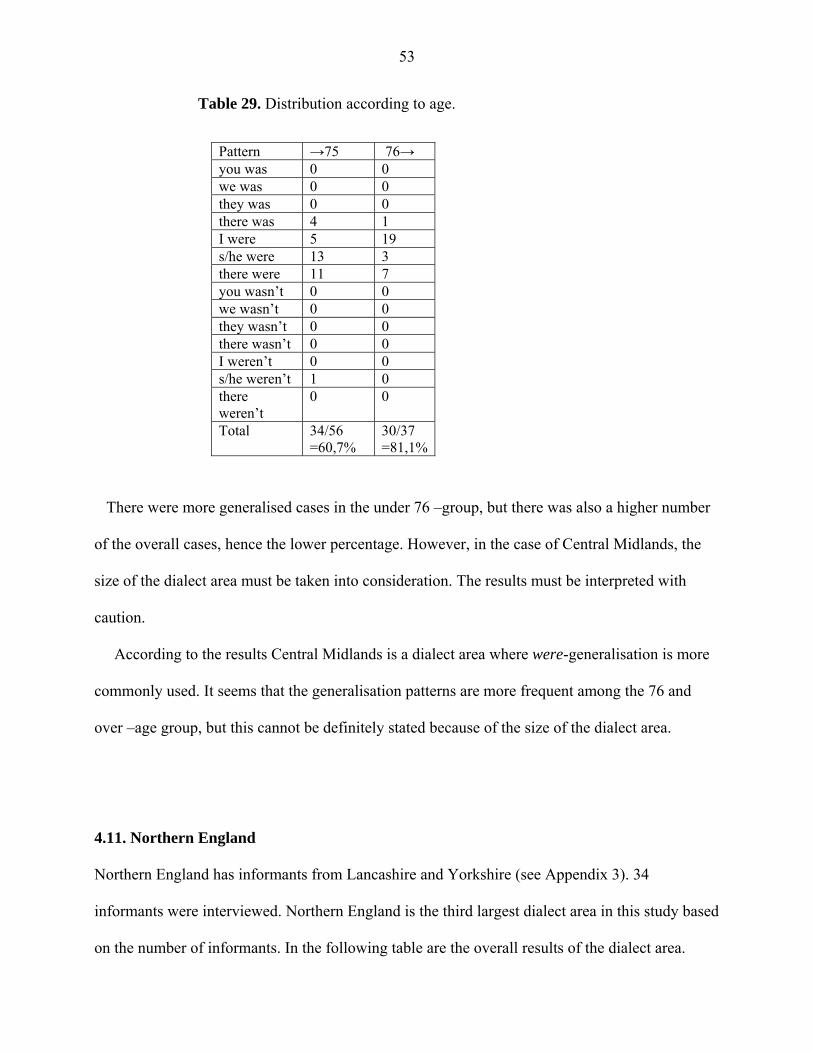
53
Table 29. Distribution according to age.
Pattern →75 76→ you was 0 0 we was 0 0 they was 0 0 there was 4 1 I were 5 19 s/he were 13 3 there were 11 7 you wasn’t 0 0 we wasn’t 0 0 they wasn’t 0 0 there wasn’t 0 0 I weren’t 0 0 s/he weren’t 1 0 there weren’t
0 0
Total
34/56 =60,7%
30/37 =81,1%
There were more generalised cases in the under 76 –group, but there was also a higher number
of the overall cases, hence the lower percentage. However, in the case of Central Midlands, the
size of the dialect area must be taken into consideration. The results must be interpreted with
caution.
According to the results Central Midlands is a dialect area where were-generalisation is more
commonly used. It seems that the generalisation patterns are more frequent among the 76 and
over –age group, but this cannot be definitely stated because of the size of the dialect area.
4.11. Northern England
Northern England has informants from Lancashire and Yorkshire (see Appendix 3). 34
informants were interviewed. Northern England is the third largest dialect area in this study based
on the number of informants. In the following table are the overall results of the dialect area.
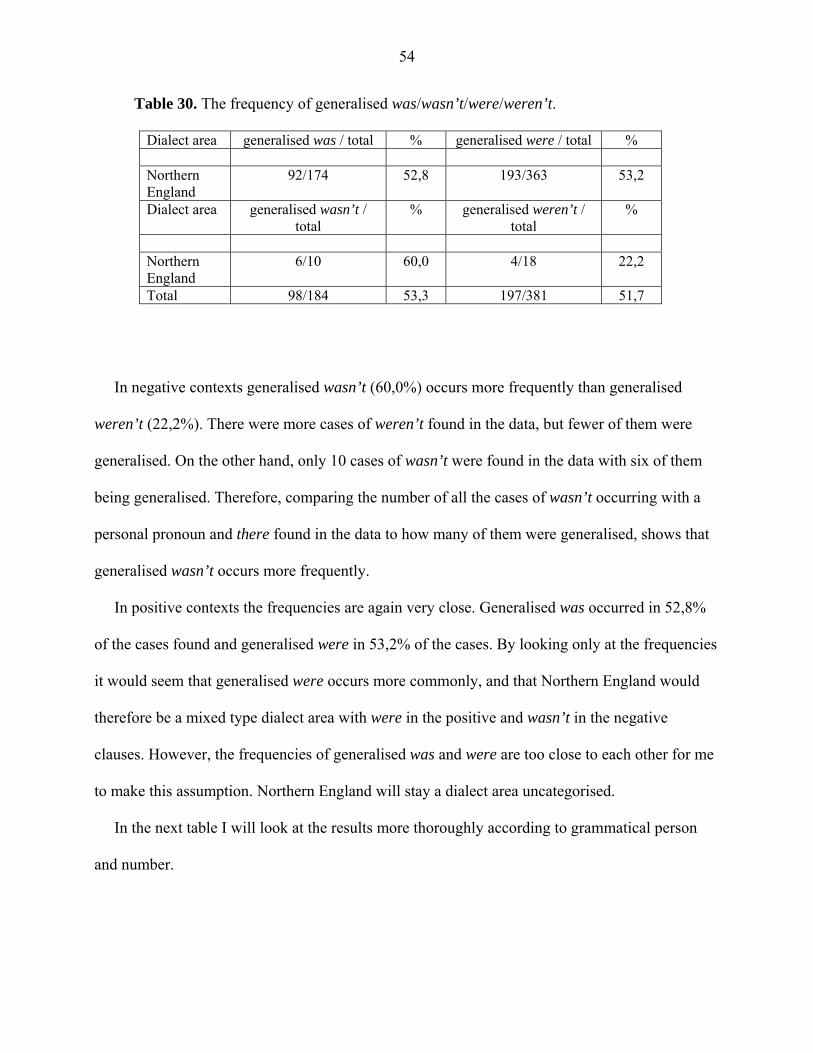
54
Table 30. The frequency of generalised was/wasn’t/were/weren’t.
Dialect area generalised was / total % generalised were / total % Northern England
92/174 52,8 193/363 53,2
Dialect area generalised wasn’t / total
% generalised weren’t / total
%
Northern England
6/10 60,0 4/18 22,2
Total 98/184 53,3 197/381 51,7
In negative contexts generalised wasn’t (60,0%) occurs more frequently than generalised
weren’t (22,2%). There were more cases of weren’t found in the data, but fewer of them were
generalised. On the other hand, only 10 cases of wasn’t were found in the data with six of them
being generalised. Therefore, comparing the number of all the cases of wasn’t occurring with a
personal pronoun and there found in the data to how many of them were generalised, shows that
generalised wasn’t occurs more frequently.
In positive contexts the frequencies are again very close. Generalised was occurred in 52,8%
of the cases found and generalised were in 53,2% of the cases. By looking only at the frequencies
it would seem that generalised were occurs more commonly, and that Northern England would
therefore be a mixed type dialect area with were in the positive and wasn’t in the negative
clauses. However, the frequencies of generalised was and were are too close to each other for me
to make this assumption. Northern England will stay a dialect area uncategorised.
In the next table I will look at the results more thoroughly according to grammatical person
and number.
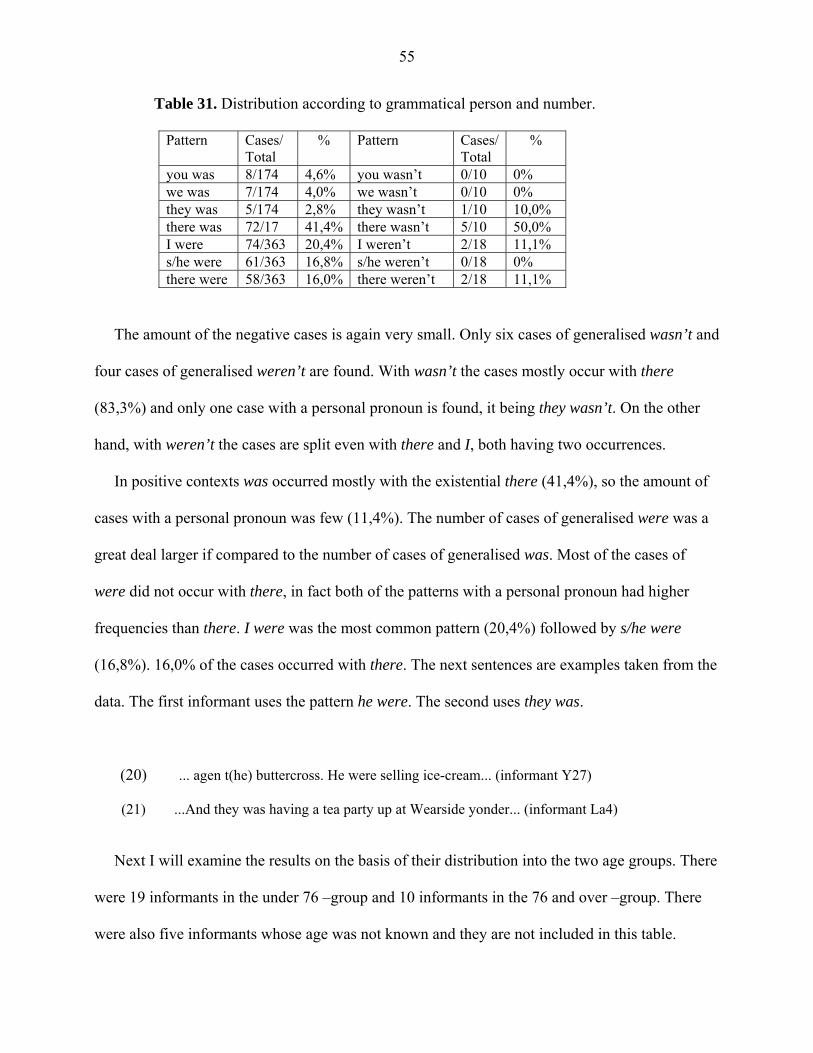
55
Table 31. Distribution according to grammatical person and number.
Pattern Cases/ Total
% Pattern Cases/ Total
%
you was 8/174 4,6% you wasn’t 0/10 0% we was 7/174 4,0% we wasn’t 0/10 0% they was 5/174 2,8% they wasn’t 1/10 10,0% there was 72/17 41,4% there wasn’t 5/10 50,0% I were 74/363 20,4% I weren’t 2/18 11,1% s/he were 61/363 16,8% s/he weren’t 0/18 0% there were 58/363 16,0% there weren’t 2/18 11,1%
The amount of the negative cases is again very small. Only six cases of generalised wasn’t and
four cases of generalised weren’t are found. With wasn’t the cases mostly occur with there
(83,3%) and only one case with a personal pronoun is found, it being they wasn’t. On the other
hand, with weren’t the cases are split even with there and I, both having two occurrences.
In positive contexts was occurred mostly with the existential there (41,4%), so the amount of
cases with a personal pronoun was few (11,4%). The number of cases of generalised were was a
great deal larger if compared to the number of cases of generalised was. Most of the cases of
were did not occur with there, in fact both of the patterns with a personal pronoun had higher
frequencies than there. I were was the most common pattern (20,4%) followed by s/he were
(16,8%). 16,0% of the cases occurred with there. The next sentences are examples taken from the
data. The first informant uses the pattern he were. The second uses they was.
(20) ... agen t(he) buttercross. He were selling ice-cream... (informant Y27)
(21) ...And they was having a tea party up at Wearside yonder... (informant La4)
Next I will examine the results on the basis of their distribution into the two age groups. There
were 19 informants in the under 76 –group and 10 informants in the 76 and over –group. There
were also five informants whose age was not known and they are not included in this table.
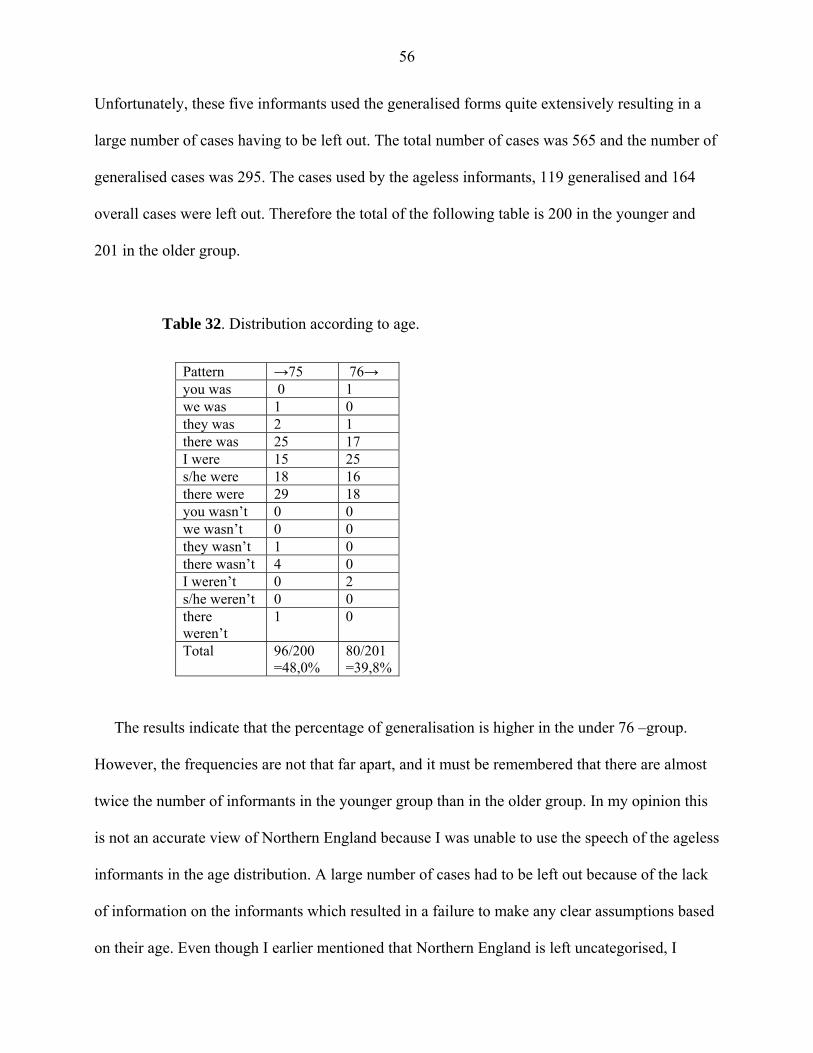
56
Unfortunately, these five informants used the generalised forms quite extensively resulting in a
large number of cases having to be left out. The total number of cases was 565 and the number of
generalised cases was 295. The cases used by the ageless informants, 119 generalised and 164
overall cases were left out. Therefore the total of the following table is 200 in the younger and
201 in the older group.
Table 32. Distribution according to age.
Pattern →75 76→ you was 0 1 we was 1 0 they was 2 1 there was 25 17 I were 15 25 s/he were 18 16 there were 29 18 you wasn’t 0 0 we wasn’t 0 0 they wasn’t 1 0 there wasn’t 4 0 I weren’t 0 2 s/he weren’t 0 0 there weren’t
1 0
Total
96/200 =48,0%
80/201 =39,8%
The results indicate that the percentage of generalisation is higher in the under 76 –group.
However, the frequencies are not that far apart, and it must be remembered that there are almost
twice the number of informants in the younger group than in the older group. In my opinion this
is not an accurate view of Northern England because I was unable to use the speech of the ageless
informants in the age distribution. A large number of cases had to be left out because of the lack
of information on the informants which resulted in a failure to make any clear assumptions based
on their age. Even though I earlier mentioned that Northern England is left uncategorised, I
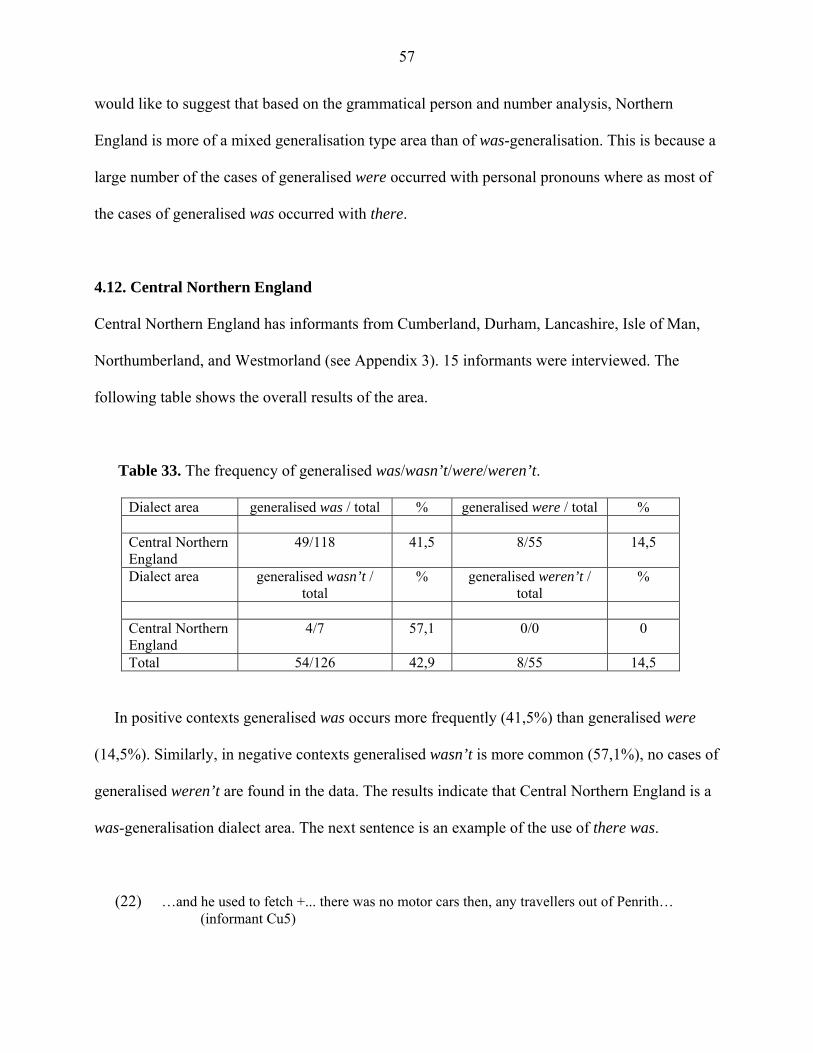
57
would like to suggest that based on the grammatical person and number analysis, Northern
England is more of a mixed generalisation type area than of was-generalisation. This is because a
large number of the cases of generalised were occurred with personal pronouns where as most of
the cases of generalised was occurred with there.
4.12. Central Northern England
Central Northern England has informants from Cumberland, Durham, Lancashire, Isle of Man,
Northumberland, and Westmorland (see Appendix 3). 15 informants were interviewed. The
following table shows the overall results of the area.
Table 33. The frequency of generalised was/wasn’t/were/weren’t.
Dialect area generalised was / total % generalised were / total % Central Northern England
49/118 41,5 8/55 14,5
Dialect area generalised wasn’t / total
% generalised weren’t / total
%
Central Northern England
4/7 57,1 0/0 0
Total 54/126 42,9 8/55 14,5
In positive contexts generalised was occurs more frequently (41,5%) than generalised were
(14,5%). Similarly, in negative contexts generalised wasn’t is more common (57,1%), no cases of
generalised weren’t are found in the data. The results indicate that Central Northern England is a
was-generalisation dialect area. The next sentence is an example of the use of there was.
(22) …and he used to fetch +... there was no motor cars then, any travellers out of Penrith… (informant Cu5)
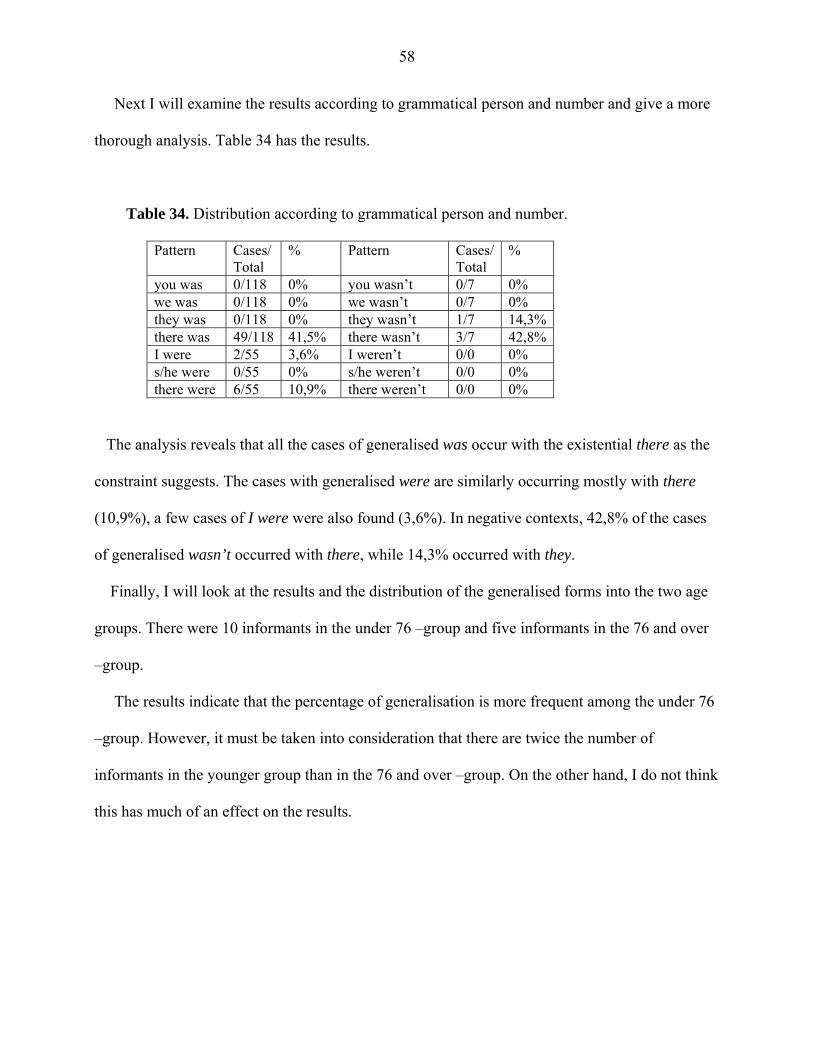
58
Next I will examine the results according to grammatical person and number and give a more
thorough analysis. Table 34 has the results.
Table 34. Distribution according to grammatical person and number.
Pattern Cases/ Total
% Pattern Cases/ Total
%
you was 0/118 0% you wasn’t 0/7 0% we was 0/118 0% we wasn’t 0/7 0% they was 0/118 0% they wasn’t 1/7 14,3%there was 49/118 41,5% there wasn’t 3/7 42,8%I were 2/55 3,6% I weren’t 0/0 0% s/he were 0/55 0% s/he weren’t 0/0 0% there were 6/55 10,9% there weren’t 0/0 0%
The analysis reveals that all the cases of generalised was occur with the existential there as the
constraint suggests. The cases with generalised were are similarly occurring mostly with there
(10,9%), a few cases of I were were also found (3,6%). In negative contexts, 42,8% of the cases
of generalised wasn’t occurred with there, while 14,3% occurred with they.
Finally, I will look at the results and the distribution of the generalised forms into the two age
groups. There were 10 informants in the under 76 –group and five informants in the 76 and over
–group.
The results indicate that the percentage of generalisation is more frequent among the under 76
–group. However, it must be taken into consideration that there are twice the number of
informants in the younger group than in the 76 and over –group. On the other hand, I do not think
this has much of an effect on the results.
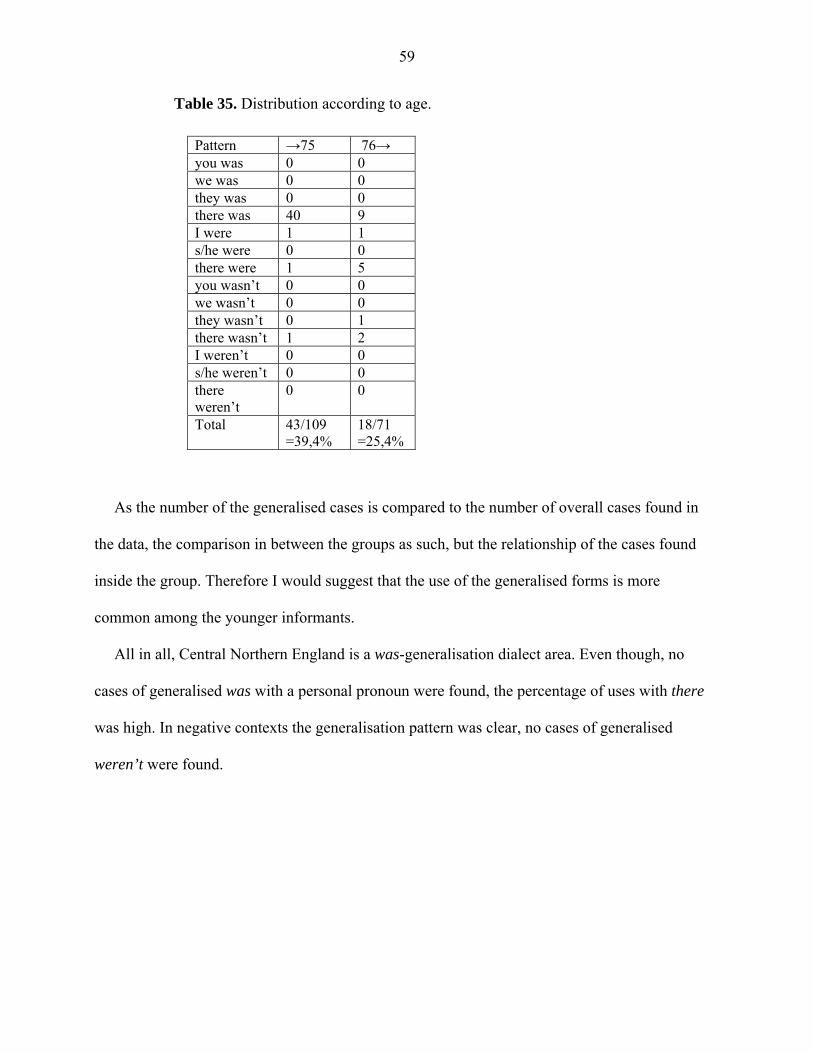
59
Table 35. Distribution according to age.
Pattern →75 76→ you was 0 0 we was 0 0 they was 0 0 there was 40 9 I were 1 1 s/he were 0 0 there were 1 5 you wasn’t 0 0 we wasn’t 0 0 they wasn’t 0 1 there wasn’t 1 2 I weren’t 0 0 s/he weren’t 0 0 there weren’t
0 0
Total
43/109 =39,4%
18/71 =25,4%
As the number of the generalised cases is compared to the number of overall cases found in
the data, the comparison in between the groups as such, but the relationship of the cases found
inside the group. Therefore I would suggest that the use of the generalised forms is more
common among the younger informants.
All in all, Central Northern England is a was-generalisation dialect area. Even though, no
cases of generalised was with a personal pronoun were found, the percentage of uses with there
was high. In negative contexts the generalisation pattern was clear, no cases of generalised
weren’t were found.
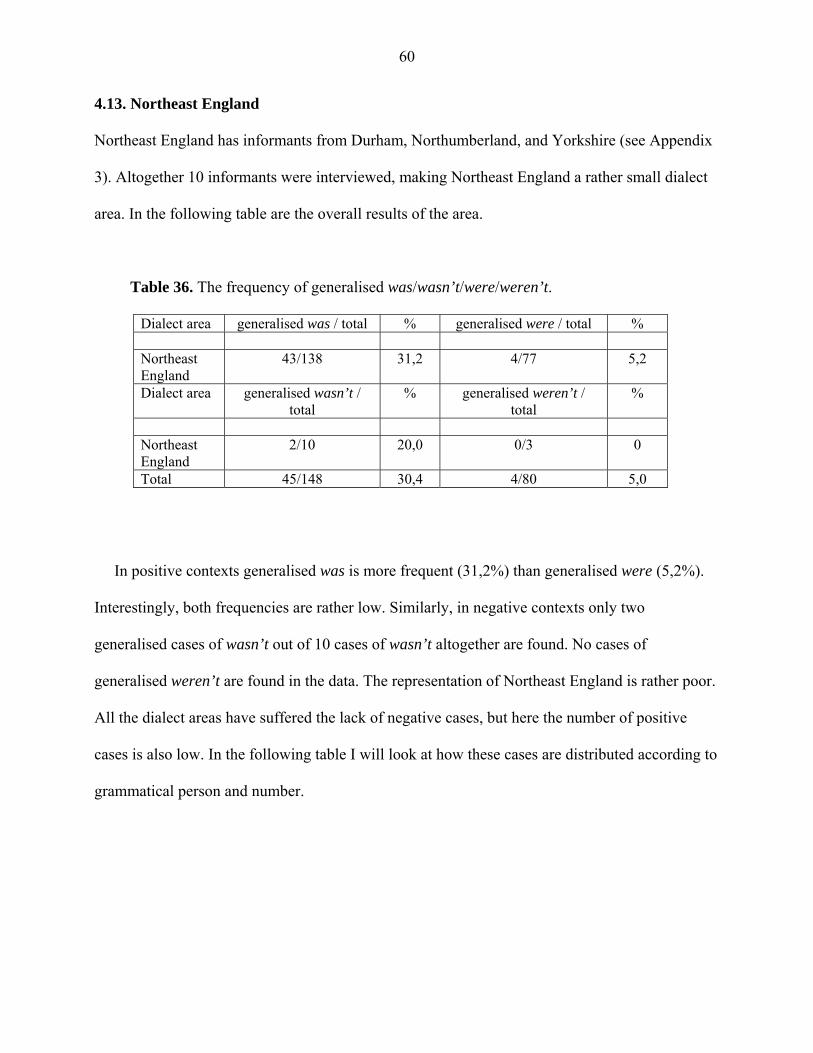
60
4.13. Northeast England
Northeast England has informants from Durham, Northumberland, and Yorkshire (see Appendix
3). Altogether 10 informants were interviewed, making Northeast England a rather small dialect
area. In the following table are the overall results of the area.
Table 36. The frequency of generalised was/wasn’t/were/weren’t.
Dialect area generalised was / total % generalised were / total % Northeast England
43/138 31,2 4/77 5,2
Dialect area generalised wasn’t / total
% generalised weren’t / total
%
Northeast England
2/10 20,0 0/3 0
Total 45/148 30,4 4/80 5,0
In positive contexts generalised was is more frequent (31,2%) than generalised were (5,2%).
Interestingly, both frequencies are rather low. Similarly, in negative contexts only two
generalised cases of wasn’t out of 10 cases of wasn’t altogether are found. No cases of
generalised weren’t are found in the data. The representation of Northeast England is rather poor.
All the dialect areas have suffered the lack of negative cases, but here the number of positive
cases is also low. In the following table I will look at how these cases are distributed according to
grammatical person and number.
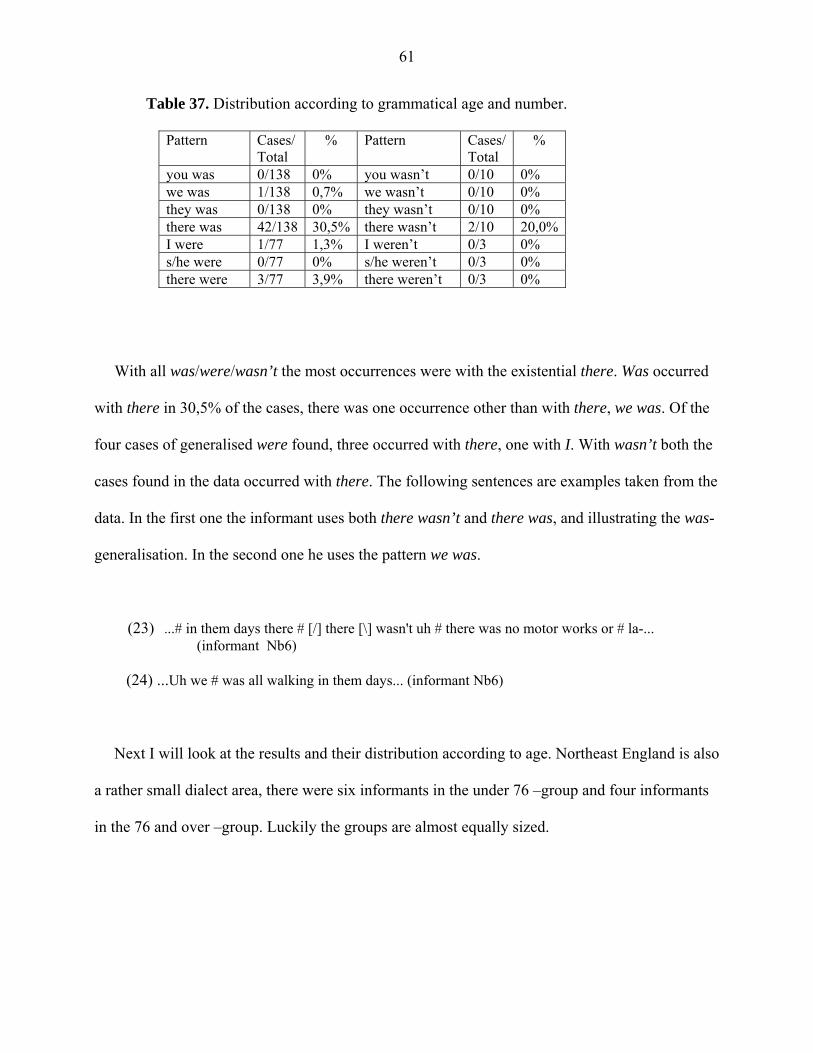
61
Table 37. Distribution according to grammatical age and number.
Pattern Cases/ Total
% Pattern Cases/ Total
%
you was 0/138 0% you wasn’t 0/10 0% we was 1/138 0,7% we wasn’t 0/10 0% they was 0/138 0% they wasn’t 0/10 0% there was 42/138 30,5% there wasn’t 2/10 20,0%I were 1/77 1,3% I weren’t 0/3 0% s/he were 0/77 0% s/he weren’t 0/3 0% there were 3/77 3,9% there weren’t 0/3 0%
With all was/were/wasn’t the most occurrences were with the existential there. Was occurred
with there in 30,5% of the cases, there was one occurrence other than with there, we was. Of the
four cases of generalised were found, three occurred with there, one with I. With wasn’t both the
cases found in the data occurred with there. The following sentences are examples taken from the
data. In the first one the informant uses both there wasn’t and there was, and illustrating the was-
generalisation. In the second one he uses the pattern we was.
(23) ...# in them days there # [/] there [\] wasn't uh # there was no motor works or # la-... (informant Nb6) (24) ...Uh we # was all walking in them days... (informant Nb6)
Next I will look at the results and their distribution according to age. Northeast England is also
a rather small dialect area, there were six informants in the under 76 –group and four informants
in the 76 and over –group. Luckily the groups are almost equally sized.
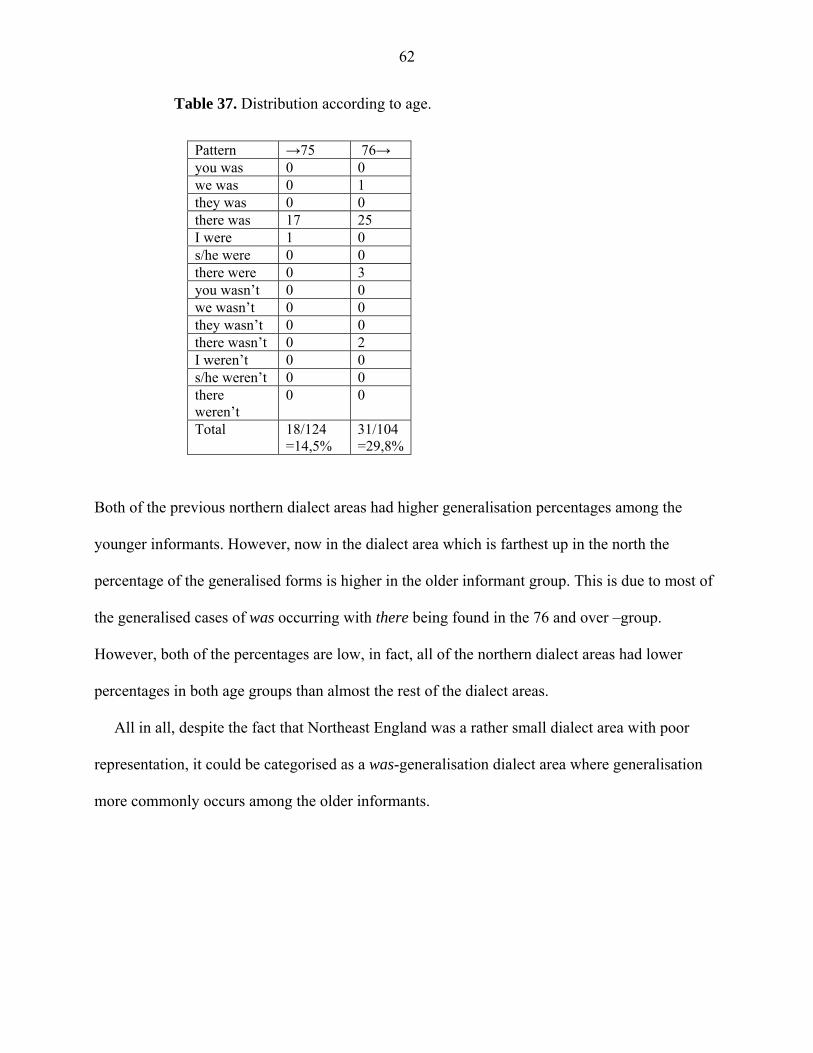
62
Table 37. Distribution according to age.
Pattern →75 76→ you was 0 0 we was 0 1 they was 0 0 there was 17 25 I were 1 0 s/he were 0 0 there were 0 3 you wasn’t 0 0 we wasn’t 0 0 they wasn’t 0 0 there wasn’t 0 2 I weren’t 0 0 s/he weren’t 0 0 there weren’t
0 0
Total
18/124 =14,5%
31/104 =29,8%
Both of the previous northern dialect areas had higher generalisation percentages among the
younger informants. However, now in the dialect area which is farthest up in the north the
percentage of the generalised forms is higher in the older informant group. This is due to most of
the generalised cases of was occurring with there being found in the 76 and over –group.
However, both of the percentages are low, in fact, all of the northern dialect areas had lower
percentages in both age groups than almost the rest of the dialect areas.
All in all, despite the fact that Northeast England was a rather small dialect area with poor
representation, it could be categorised as a was-generalisation dialect area where generalisation
more commonly occurs among the older informants.
63
5. Discussion
In this chapter I will compare my results to those of the studies by Lieselotte Anderwald and
Terttu Nevalainen introduced in sections 2.4.1. and 2.4.2. The aim of this comparison is to
examine language change based on these three studies. I will use the tables from the above-
mentioned studies to illustrate the differences and similarities between them. I have also made
tables and a map similar to those of Anderwald to make the comparison easier and clearer. I will
proceed chronologically, in other words, I will first compare my results to those of Terttu
Nevalainen, and then go on to investigate the differences in my findings to those of Lieselotte
Anderwald. The attempt is to illustrate language development from the Early Modern English
period to the present day.
In her study “Vernacular universals? The case of plural was in Early Modern English” Terttu
Nevalainen (2006) investigated the relationship between was and plural subjects. These plural
subjects included the existential there, noun phrases, and personal pronouns. She studied the
probability of was occurring with plural subjects in four different regions and in four different
time periods (see section 2.4.2.). Her results showed that in the two earlier periods, 1440-1519
and 1520-1579, the use of was with plural subjects was extremely frequent in the North, but in
the last two periods the frequency was lower. In the other regions the phenomenon is less
common (Nevalainen 2006, 359). In order to see how the frequencies differ according to area
and, especially, how they range according to the type of subject involved, I will use Nevalainen’s
own tables. Tables 38, 39, and 40 show the results of a multivariate analysis from the three first
time periods, 1440-1519, 1520-1579, and 1580-1639 (2006, 362-363). The factor weight that is
shown in these table varies between zero and one; the higher the weight, the more the factor
favours the use of was, and the lower the weight, the more it favours the use of were (Nevalainen
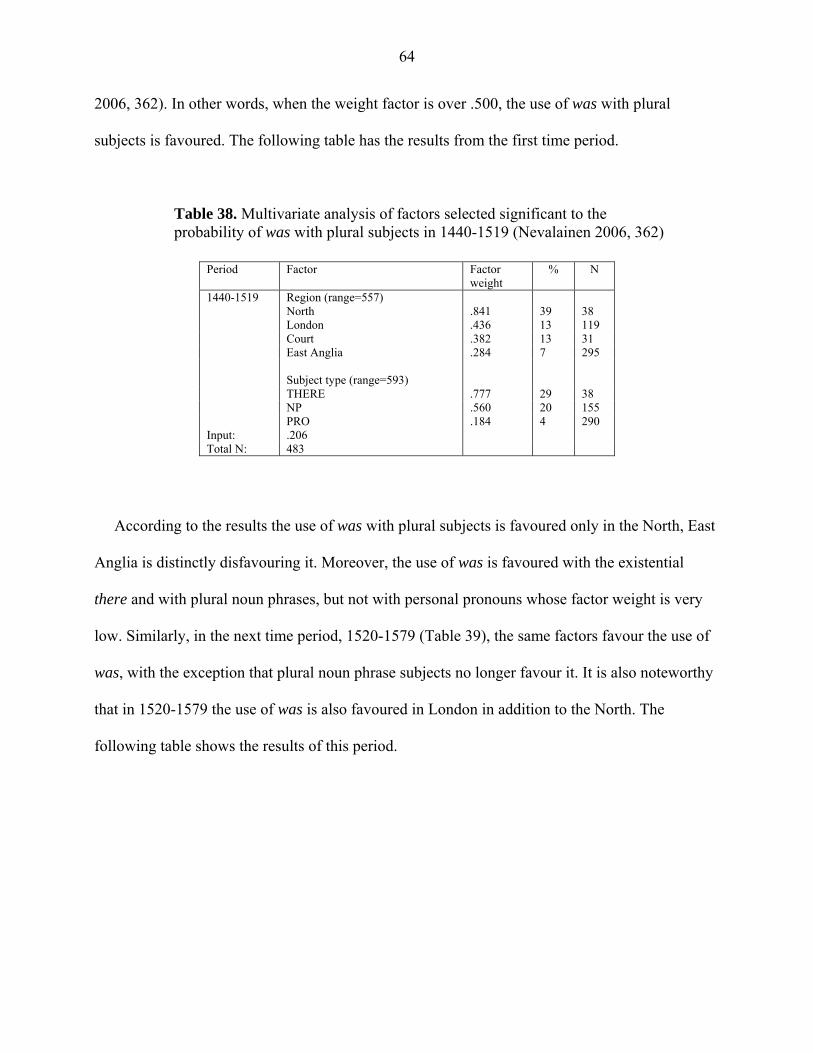
64
2006, 362). In other words, when the weight factor is over .500, the use of was with plural
subjects is favoured. The following table has the results from the first time period.
Table 38. Multivariate analysis of factors selected significant to the probability of was with plural subjects in 1440-1519 (Nevalainen 2006, 362) Period
Factor Factor
weight % N
1440-1519 Region (range=557) North .841 39 38 London .436 13 119 Court .382 13 31 East Anglia .284 7 295 Subject type (range=593) THERE .777 29 38 NP .560 20 155 PRO .184 4 290 Input: .206 Total N: 483
According to the results the use of was with plural subjects is favoured only in the North, East
Anglia is distinctly disfavouring it. Moreover, the use of was is favoured with the existential
there and with plural noun phrases, but not with personal pronouns whose factor weight is very
low. Similarly, in the next time period, 1520-1579 (Table 39), the same factors favour the use of
was, with the exception that plural noun phrase subjects no longer favour it. It is also noteworthy
that in 1520-1579 the use of was is also favoured in London in addition to the North. The
following table shows the results of this period.
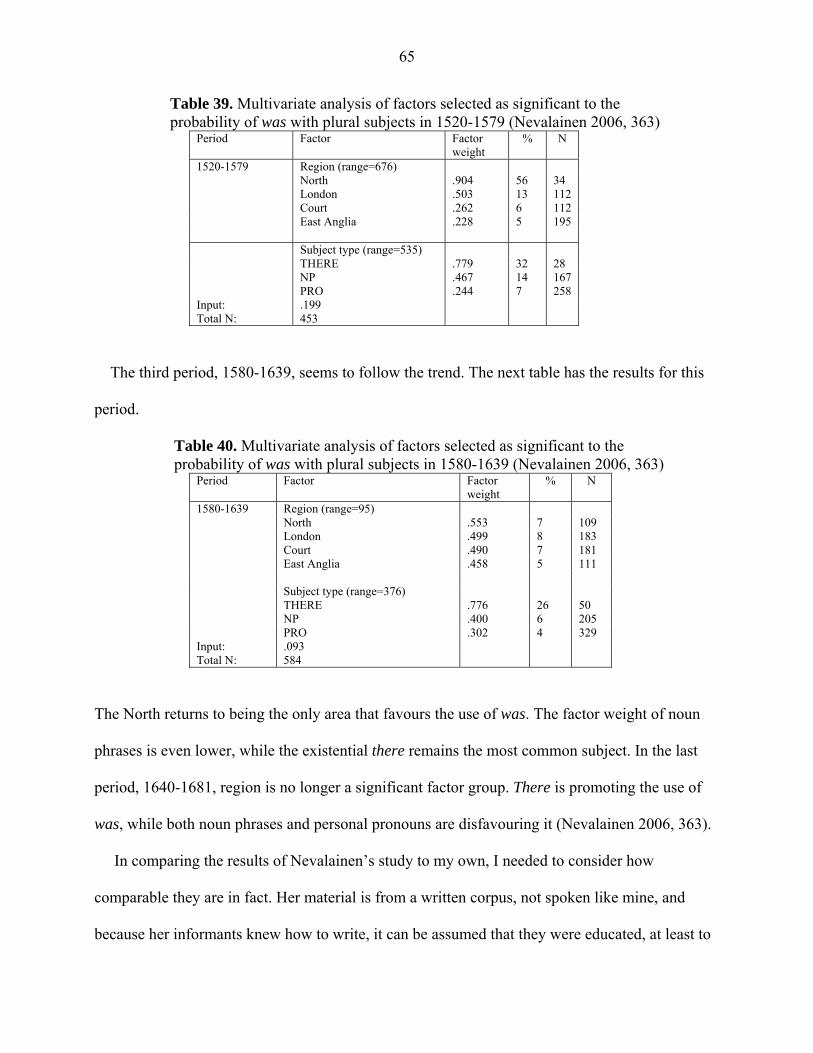
65
Table 39. Multivariate analysis of factors selected as significant to the probability of was with plural subjects in 1520-1579 (Nevalainen 2006, 363)
Period Factor Factor weight
% N
1520-1579 Region (range=676) North .904 56 34 London .503 13 112 Court .262 6 112 East Anglia .228 5 195 Subject type (range=535) THERE .779 32 28 NP .467 14 167 PRO .244 7 258 Input: .199 Total N: 453
The third period, 1580-1639, seems to follow the trend. The next table has the results for this
period.
Table 40. Multivariate analysis of factors selected as significant to the probability of was with plural subjects in 1580-1639 (Nevalainen 2006, 363)
Period Factor Factor weight
% N
1580-1639 Region (range=95) North .553 7 109 London .499 8 183 Court .490 7 181 East Anglia .458 5 111 Subject type (range=376) THERE .776 26 50 NP .400 6 205 PRO .302 4 329 Input: .093 Total N: 584
The North returns to being the only area that favours the use of was. The factor weight of noun
phrases is even lower, while the existential there remains the most common subject. In the last
period, 1640-1681, region is no longer a significant factor group. There is promoting the use of
was, while both noun phrases and personal pronouns are disfavouring it (Nevalainen 2006, 363).
In comparing the results of Nevalainen’s study to my own, I needed to consider how
comparable they are in fact. Her material is from a written corpus, not spoken like mine, and
because her informants knew how to write, it can be assumed that they were educated, at least to
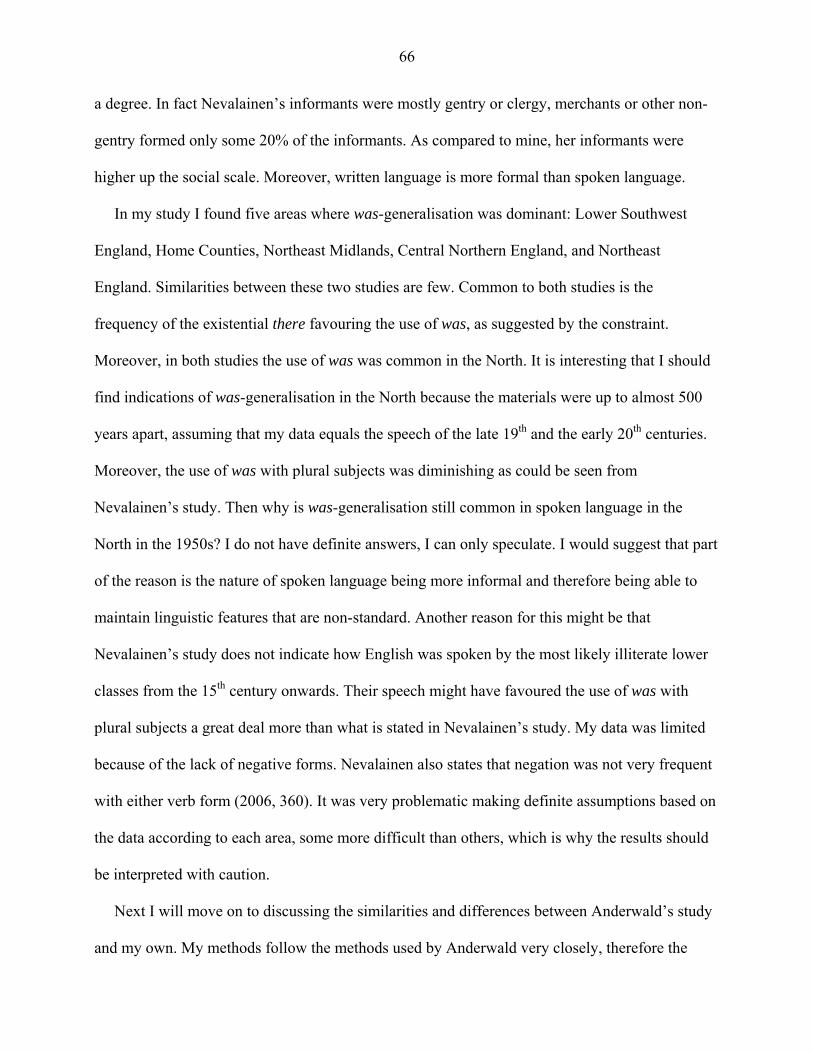
66
a degree. In fact Nevalainen’s informants were mostly gentry or clergy, merchants or other non-
gentry formed only some 20% of the informants. As compared to mine, her informants were
higher up the social scale. Moreover, written language is more formal than spoken language.
In my study I found five areas where was-generalisation was dominant: Lower Southwest
England, Home Counties, Northeast Midlands, Central Northern England, and Northeast
England. Similarities between these two studies are few. Common to both studies is the
frequency of the existential there favouring the use of was, as suggested by the constraint.
Moreover, in both studies the use of was was common in the North. It is interesting that I should
find indications of was-generalisation in the North because the materials were up to almost 500
years apart, assuming that my data equals the speech of the late 19th and the early 20th centuries.
Moreover, the use of was with plural subjects was diminishing as could be seen from
Nevalainen’s study. Then why is was-generalisation still common in spoken language in the
North in the 1950s? I do not have definite answers, I can only speculate. I would suggest that part
of the reason is the nature of spoken language being more informal and therefore being able to
maintain linguistic features that are non-standard. Another reason for this might be that
Nevalainen’s study does not indicate how English was spoken by the most likely illiterate lower
classes from the 15th century onwards. Their speech might have favoured the use of was with
plural subjects a great deal more than what is stated in Nevalainen’s study. My data was limited
because of the lack of negative forms. Nevalainen also states that negation was not very frequent
with either verb form (2006, 360). It was very problematic making definite assumptions based on
the data according to each area, some more difficult than others, which is why the results should
be interpreted with caution.
Next I will move on to discussing the similarities and differences between Anderwald’s study
and my own. My methods follow the methods used by Anderwald very closely, therefore the
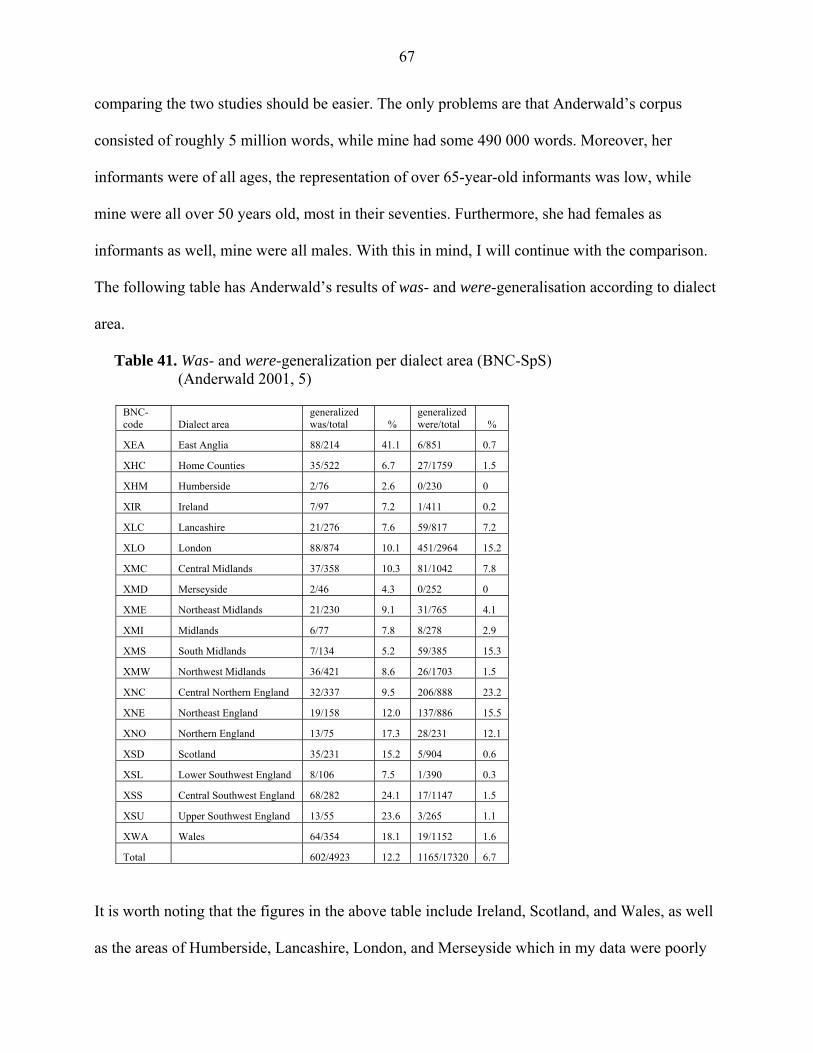
67
comparing the two studies should be easier. The only problems are that Anderwald’s corpus
consisted of roughly 5 million words, while mine had some 490 000 words. Moreover, her
informants were of all ages, the representation of over 65-year-old informants was low, while
mine were all over 50 years old, most in their seventies. Furthermore, she had females as
informants as well, mine were all males. With this in mind, I will continue with the comparison.
The following table has Anderwald’s results of was- and were-generalisation according to dialect
area.
Table 41. Was- and were-generalization per dialect area (BNC-SpS) (Anderwald 2001, 5)
BNC-code Dialect area
generalized was/total %
generalized were/total %
XEA East Anglia 88/214 41.1 6/851 0.7
XHC Home Counties 35/522 6.7 27/1759 1.5
XHM Humberside 2/76 2.6 0/230 0
XIR Ireland 7/97 7.2 1/411 0.2
XLC Lancashire 21/276 7.6 59/817 7.2
XLO London 88/874 10.1 451/2964 15.2
XMC Central Midlands 37/358 10.3 81/1042 7.8
XMD Merseyside 2/46 4.3 0/252 0
XME Northeast Midlands 21/230 9.1 31/765 4.1
XMI Midlands 6/77 7.8 8/278 2.9
XMS South Midlands 7/134 5.2 59/385 15.3
XMW Northwest Midlands 36/421 8.6 26/1703 1.5
XNC Central Northern England 32/337 9.5 206/888 23.2
XNE Northeast England 19/158 12.0 137/886 15.5
XNO Northern England 13/75 17.3 28/231 12.1
XSD Scotland 35/231 15.2 5/904 0.6
XSL Lower Southwest England 8/106 7.5 1/390 0.3
XSS Central Southwest England 68/282 24.1 17/1147 1.5
XSU Upper Southwest England 13/55 23.6 3/265 1.1
XWA Wales 64/354 18.1 19/1152 1.6
Total 602/4923 12.2 1165/17320 6.7
It is worth noting that the figures in the above table include Ireland, Scotland, and Wales, as well
as the areas of Humberside, Lancashire, London, and Merseyside which in my data were poorly
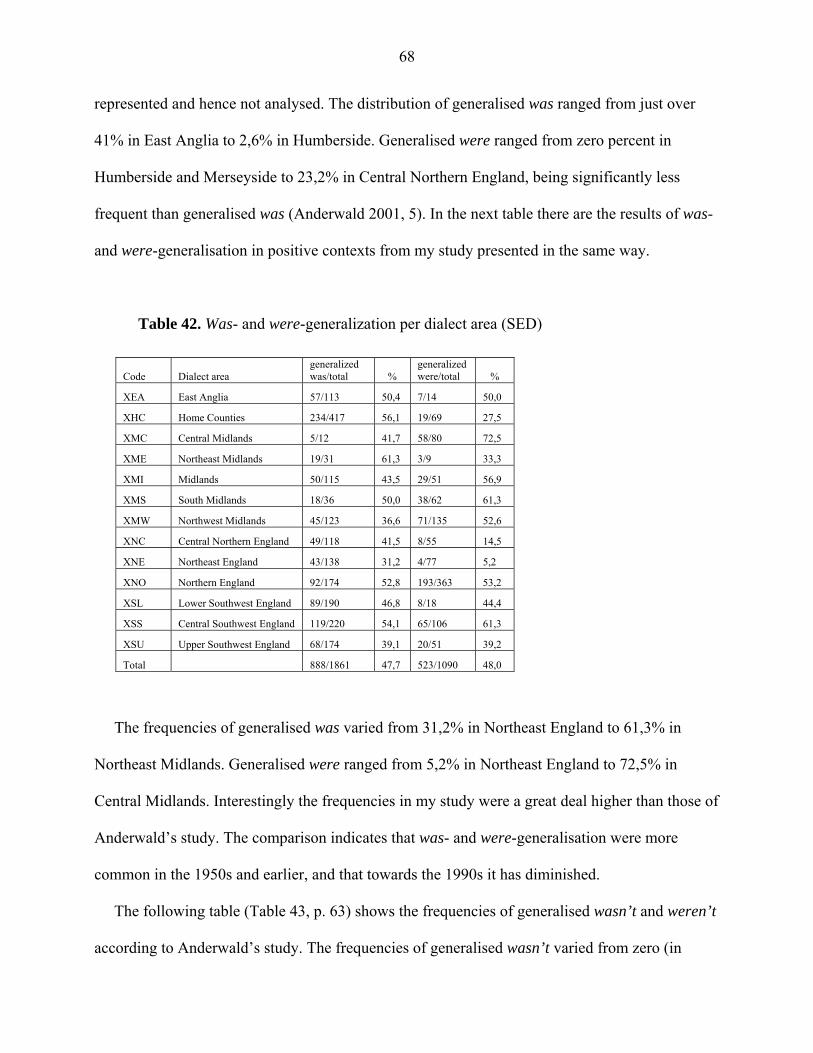
68
represented and hence not analysed. The distribution of generalised was ranged from just over
41% in East Anglia to 2,6% in Humberside. Generalised were ranged from zero percent in
Humberside and Merseyside to 23,2% in Central Northern England, being significantly less
frequent than generalised was (Anderwald 2001, 5). In the next table there are the results of was-
and were-generalisation in positive contexts from my study presented in the same way.
Table 42. Was- and were-generalization per dialect area (SED)
Code Dialect area generalized was/total %
generalized were/total %
XEA East Anglia 57/113 50,4 7/14 50,0
XHC Home Counties 234/417 56,1 19/69 27,5
XMC Central Midlands 5/12 41,7 58/80 72,5
XME Northeast Midlands 19/31 61,3 3/9 33,3
XMI Midlands 50/115 43,5 29/51 56,9
XMS South Midlands 18/36 50,0 38/62 61,3
XMW Northwest Midlands 45/123 36,6 71/135 52,6
XNC Central Northern England 49/118 41,5 8/55 14,5
XNE Northeast England 43/138 31,2 4/77 5,2
XNO Northern England 92/174 52,8 193/363 53,2
XSL Lower Southwest England 89/190 46,8 8/18 44,4
XSS Central Southwest England 119/220 54,1 65/106 61,3
XSU Upper Southwest England 68/174 39,1 20/51 39,2
Total 888/1861 47,7 523/1090 48,0
The frequencies of generalised was varied from 31,2% in Northeast England to 61,3% in
Northeast Midlands. Generalised were ranged from 5,2% in Northeast England to 72,5% in
Central Midlands. Interestingly the frequencies in my study were a great deal higher than those of
Anderwald’s study. The comparison indicates that was- and were-generalisation were more
common in the 1950s and earlier, and that towards the 1990s it has diminished.
The following table (Table 43, p. 63) shows the frequencies of generalised wasn’t and weren’t
according to Anderwald’s study. The frequencies of generalised wasn’t varied from zero (in
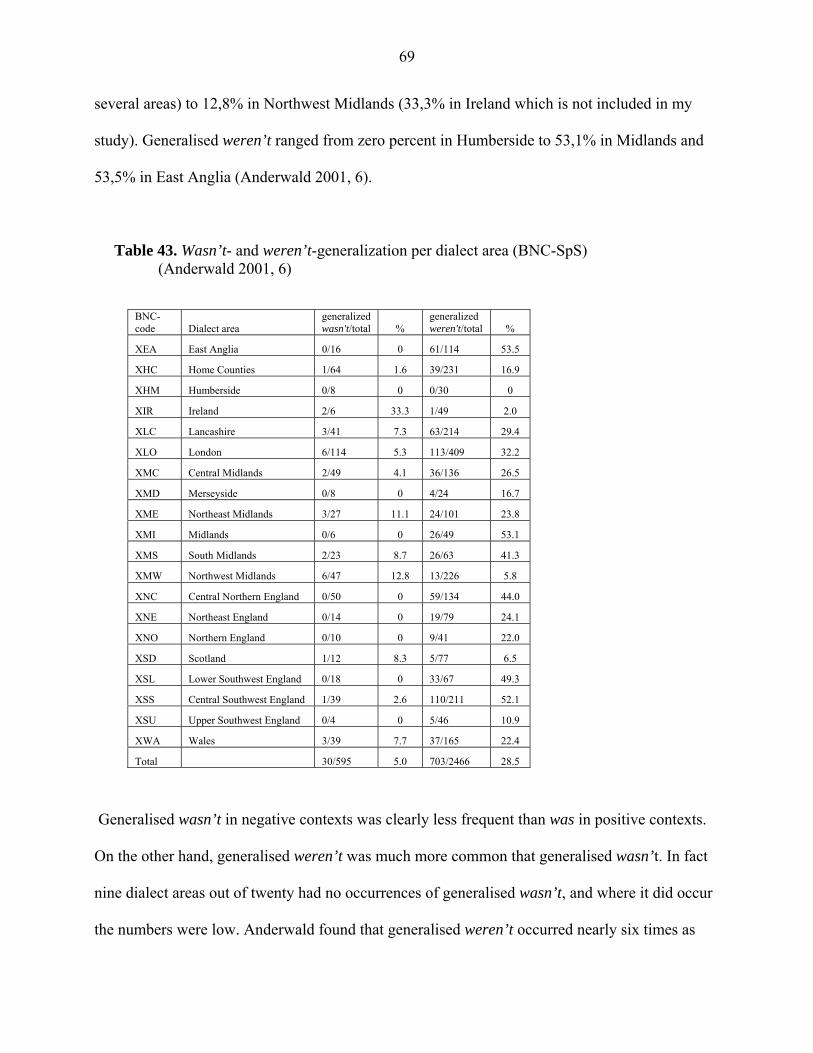
69
several areas) to 12,8% in Northwest Midlands (33,3% in Ireland which is not included in my
study). Generalised weren’t ranged from zero percent in Humberside to 53,1% in Midlands and
53,5% in East Anglia (Anderwald 2001, 6).
Table 43. Wasn’t- and weren’t-generalization per dialect area (BNC-SpS) (Anderwald 2001, 6)
BNC-code Dialect area
generalized wasn't/total %
generalized weren't/total %
XEA East Anglia 0/16 0 61/114 53.5
XHC Home Counties 1/64 1.6 39/231 16.9
XHM Humberside 0/8 0 0/30 0
XIR Ireland 2/6 33.3 1/49 2.0
XLC Lancashire 3/41 7.3 63/214 29.4
XLO London 6/114 5.3 113/409 32.2
XMC Central Midlands 2/49 4.1 36/136 26.5
XMD Merseyside 0/8 0 4/24 16.7
XME Northeast Midlands 3/27 11.1 24/101 23.8
XMI Midlands 0/6 0 26/49 53.1
XMS South Midlands 2/23 8.7 26/63 41.3
XMW Northwest Midlands 6/47 12.8 13/226 5.8
XNC Central Northern England 0/50 0 59/134 44.0
XNE Northeast England 0/14 0 19/79 24.1
XNO Northern England 0/10 0 9/41 22.0
XSD Scotland 1/12 8.3 5/77 6.5
XSL Lower Southwest England 0/18 0 33/67 49.3
XSS Central Southwest England 1/39 2.6 110/211 52.1
XSU Upper Southwest England 0/4 0 5/46 10.9
XWA Wales 3/39 7.7 37/165 22.4
Total 30/595 5.0 703/2466 28.5
Generalised wasn’t in negative contexts was clearly less frequent than was in positive contexts.
On the other hand, generalised weren’t was much more common that generalised wasn’t. In fact
nine dialect areas out of twenty had no occurrences of generalised wasn’t, and where it did occur
the numbers were low. Anderwald found that generalised weren’t occurred nearly six times as
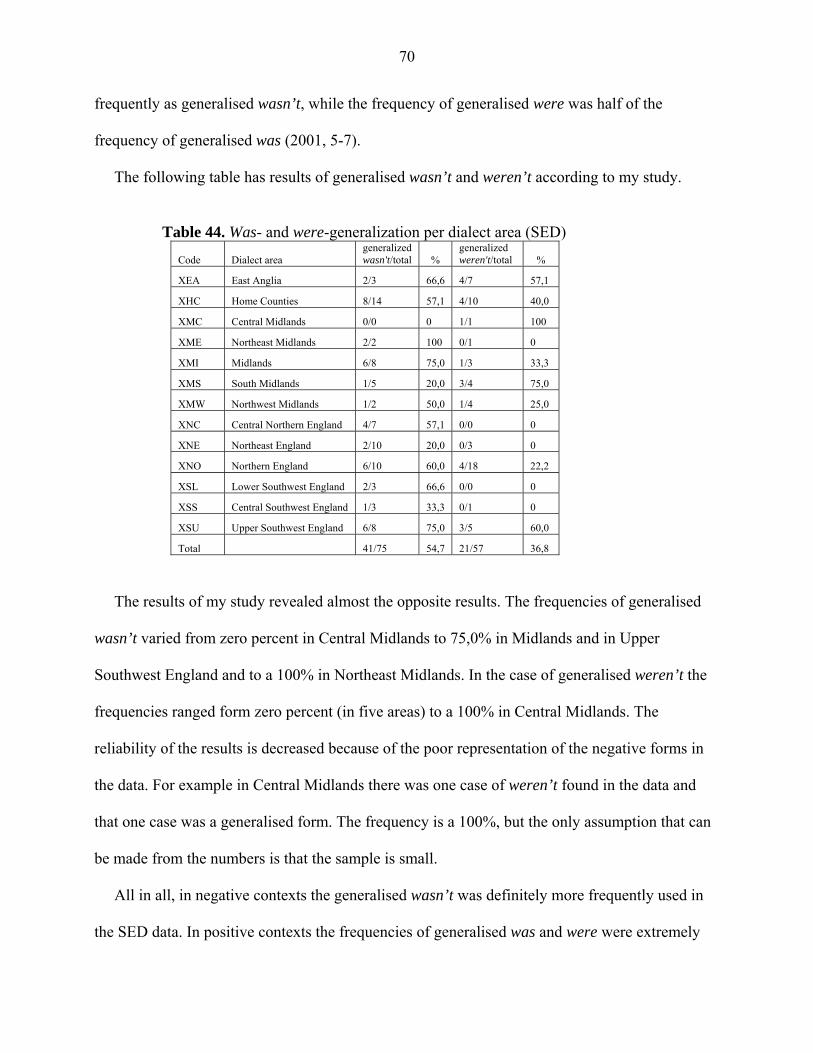
70
frequently as generalised wasn’t, while the frequency of generalised were was half of the
frequency of generalised was (2001, 5-7).
The following table has results of generalised wasn’t and weren’t according to my study. Table 44. Was- and were-generalization per dialect area (SED)
Code Dialect area generalized wasn't/total %
generalized weren't/total %
XEA East Anglia 2/3 66,6 4/7 57,1
XHC Home Counties 8/14 57,1 4/10 40,0
XMC Central Midlands 0/0 0 1/1 100
XME Northeast Midlands 2/2 100 0/1 0
XMI Midlands 6/8 75,0 1/3 33,3
XMS South Midlands 1/5 20,0 3/4 75,0
XMW Northwest Midlands 1/2 50,0 1/4 25,0
XNC Central Northern England 4/7 57,1 0/0 0
XNE Northeast England 2/10 20,0 0/3 0
XNO Northern England 6/10 60,0 4/18 22,2
XSL Lower Southwest England 2/3 66,6 0/0 0
XSS Central Southwest England 1/3 33,3 0/1 0
XSU Upper Southwest England 6/8 75,0 3/5 60,0
Total 41/75 54,7 21/57 36,8
The results of my study revealed almost the opposite results. The frequencies of generalised
wasn’t varied from zero percent in Central Midlands to 75,0% in Midlands and in Upper
Southwest England and to a 100% in Northeast Midlands. In the case of generalised weren’t the
frequencies ranged form zero percent (in five areas) to a 100% in Central Midlands. The
reliability of the results is decreased because of the poor representation of the negative forms in
the data. For example in Central Midlands there was one case of weren’t found in the data and
that one case was a generalised form. The frequency is a 100%, but the only assumption that can
be made from the numbers is that the sample is small.
All in all, in negative contexts the generalised wasn’t was definitely more frequently used in
the SED data. In positive contexts the frequencies of generalised was and were were extremely
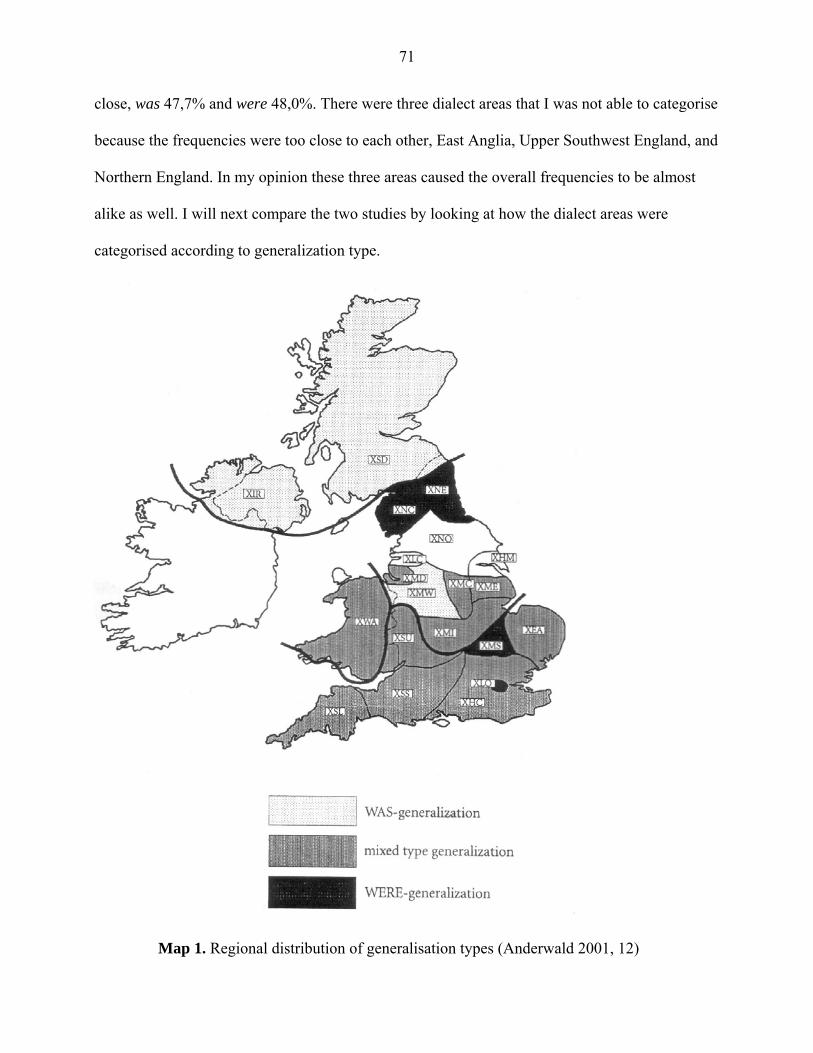
71
close, was 47,7% and were 48,0%. There were three dialect areas that I was not able to categorise
because the frequencies were too close to each other, East Anglia, Upper Southwest England, and
Northern England. In my opinion these three areas caused the overall frequencies to be almost
alike as well. I will next compare the two studies by looking at how the dialect areas were
categorised according to generalization type.
Map 1. Regional distribution of generalisation types (Anderwald 2001, 12)
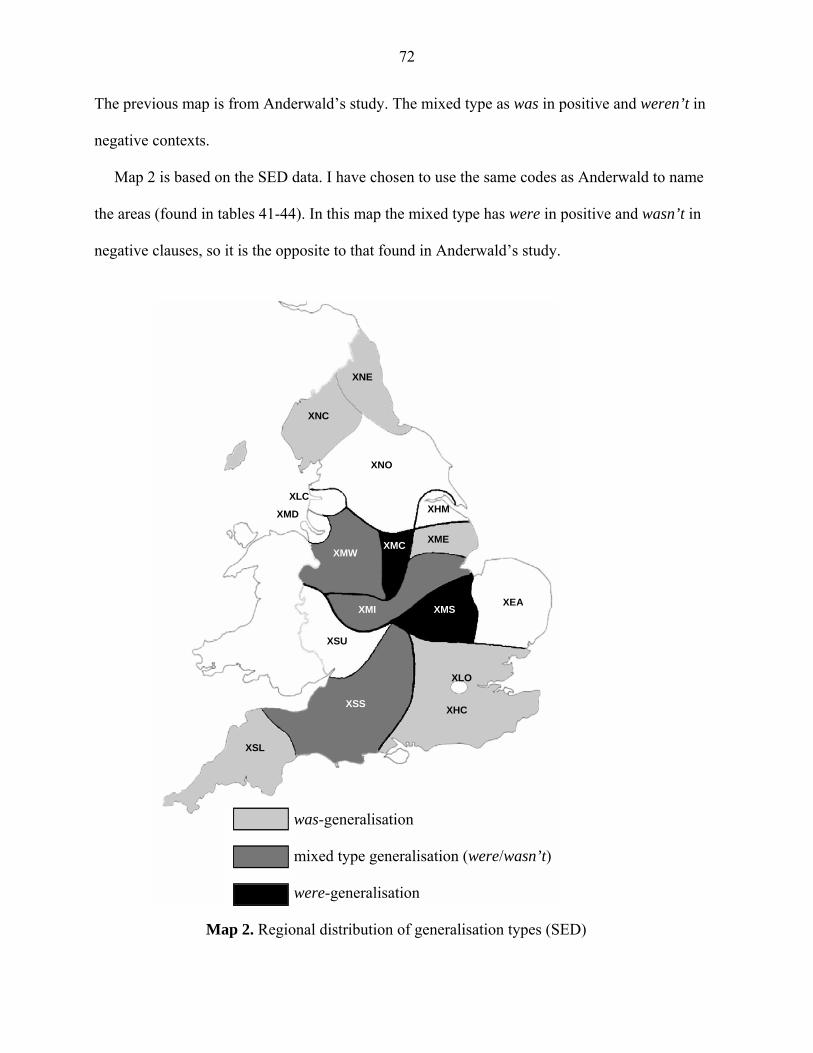
72
The previous map is from Anderwald’s study. The mixed type as was in positive and weren’t in
negative contexts.
Map 2 is based on the SED data. I have chosen to use the same codes as Anderwald to name
the areas (found in tables 41-44). In this map the mixed type has were in positive and wasn’t in
negative clauses, so it is the opposite to that found in Anderwald’s study.
XNC
XNE
XNO
XHMXLC
XMD
XMWXMC
XMI
XME
XMSXEA
XSU
XSS
XSL
XLO
XHC
was-generalisation mixed type generalisation (were/wasn’t) were-generalisation Map 2. Regional distribution of generalisation types (SED)
73
By comparing these maps together I found that only three areas had similar categorisation:
Central Southwest England, South Midlands, and Midlands. Similarly, Anderwald was also
unable to categorise one of the largest areas, Northern England, as well as some of the small
areas, Central Lancashire and Humberside, which I did not even analyse because of their size.
Other dialect areas have different categorisation. I found no cases of the mixed type with was in
positive and weren’t in negative clauses which is the most common categorisation in Anderwald
results. On the other hand, I found cases of another mixed type which is not supposed to exist. At
least in Anderwald’s study it did not occur, and according to her it has not been mentioned in the
literature for any other variety of English either (2001, 9).
Only one area, Northwest Midlands, is categorised as a was-generalisation dialect area in
Anderwald’s study. On the other hand, my results indicated that five areas use was-generalisation
more commonly: Lower Southwest England, Home Counties, Northeast Midlands, Central
Northern England, and Northeast England. The other three areas were categorised as mixed type
generalisation areas in Anderwald’s study, but interestingly Central Northern England and
Northeast England were were-generalisation areas according to her. This might indicate a rapid
change in the north.
I was unable to categorise Upper Southwest England and East Anglia, which both were
marked mixed type areas. These large uncategorised areas, including Northern England, were left
without a categorisation because of their high frequencies of both generalised was and
generalised were in positive contexts. East Anglia was closer to was-generalisation, while Upper
Southwest England and Northern England were closer to the mixed type (were/wasn’t). In
Anderwald’s study Northern England is similarly left uncategorised because no clear pattern of
generalisation is found. Although, she does state that in her study Northern England clearly
74
favoured weren’t in negative contexts (2001, 11). However, in my study Northern England
favoured wasn’t. Of the whole study there were only two areas where weren’t was favoured.
I found it rather surprising that so many of the categorisations are different in the two studies.
The findings were almost total opposites. Why? I have previously mentioned that my material is
limited. There were only a few negative forms which made the categorisation difficult.
Anderwald also experienced similar problems with the negative cases. Some areas had to be left
out of the analysis because there were so few informants. Other things affecting the comparison
and the differences in the two studies are facts such as Anderwald’s use of data with both males
and females, and her data consisting of informants of all ages, with poor representation of
informants over 60 years of age. This made the comparison to my study more challenging
because almost all of the SED informants were over 60 years old. Anderwald also used data
which was gathered without fieldworkers. When an informant is being interviewed his/her speech
is not as authentic as it could be because of the presence of the fieldworker. However, I do not
think that the absence of the fieldworker had a positive effect on the BNC data in this sense
because the informants were still aware of being recorded even if they were doing it themselves.
In order to see if language change can be detected on the basis of these three studies, the
results must be put into chronological order. In Nevalainen’s study the use of was with plural
subjects was frequent in the North. It was however gradually diminishing in frequency. In the
SED data Central Northern England and Northeast England were both categorised as was-
generalisation areas, which suggests that the use of generalised was had not decreased as much as
the results of Nevalainen’s study suggested. However, it has to be noted that Terttu Nevalainen
used written language in her study and that her informants were educated, not farmers and miners
like in the SED. Therefore, the results are not totally comparable. Anderwald categorised the two
areas as were-generalisation areas indicating a change in the generalisation pattern. However, it
75
must be noted that Anderwald’s results do not depict the speech of one single group at a certain
time. Her informants are of different age groups, and therefore her results illustrate more of an
average style of speech in a dialect area, not that of a certain group and not as old a speech as
possible.
In Central Midlands the categorisation pattern has changed from were-generalisation in my
study to a mixed type in Anderwald’s study. This transition seems plausible, because weren’t is
favoured in both patterns, only the generalisation in positive contexts has changed. Central
Southwest England and Midlands have changed from one mixed type to another. According to
the SED data the usage was were in positive and wasn’t in negative clauses, but according to the
BNC the usage has changed to was in positive and weren’t in negative clauses. In my opinion the
lack of negative cases in the data of the two studies can result in discrepancies and possible false
interpretations.
Based on the SED Northwest Midlands was categorised as a mixed type generalisation area,
but in Anderwald’s study it is marked as a was-generalisation dialect area. The usage has
changed from were in positive and wasn’t in negative clauses to was in both. Similarly as in
Central Midlands the generalisation pattern has stayed the same in negative contexts, but changed
in the positive ones.
Lower Southwest England, Home Counties, and Northeast Midlands were categorised as was-
generalisation dialect areas according to the SED. In Anderwald’s study based on the BNC, they
were areas of the mixed type generalisation with was in positive and weren’t in negative clauses.
It seems that with these three areas the change has followed opposite patterns from the two areas
mentioned above. The generalisation pattern has stayed the same in positive contexts, but
changed in the negative ones.
76
Unfortunately, it is impossible to determine generalisation usage changed to the direction it
changed based on these studies. No simple pattern can be found. Some of the areas had changes
only in positive contexts, some only in the negative. In some areas the pattern changed to its total
opposite, and in some the pattern stayed the same. In my opinion this is caused by the different
natures of the sample groups in terms of the SED having very old informants and the BNC
having informants of all ages, more young than old ones. The lack of negative forms in the data
has an effect on the results as well.
77
6. Conclusion
My aim was to see if language change could be detected on the basis of the three studies, that of
Terttu Nevalainen, that of Lieselotte Anderwald, and that of my own. My purpose was to
compare the results and to find evidence of language change. I used similar methods as
Anderwald and made a quantitative analysis of the data. By comparing the generalised cases
found in the data to the overall amount of cases with was/were/wasn’t/weren’t I was able to
categorise the 13 dialect areas according to the generalisation type. A more thorough analysis of
each area showed the distribution of the generalised cases according to grammatical person and
number indicating whether the use was more common with the existential there than with a
personal pronoun, and according to age. The informants were divided into two age groups and
my attempt was to find out whether the use of the generalised forms differed according to age.
Unfortunately, this analysis did not yield all of the wanted results, for example no regional
pattern of distribution according to age was found. However, I did find evidence of were-
generalisation being more common among the older group of informants. The analysis was, to a
certain extent, unsuccessful, which was due to the uneven amount of informants in the two
groups in some of the dialect areas. The lack of negative forms and the different sizes of the
dialect areas also created problems in the analysis. The areas were difficult to categorise when the
amount of cases found was so small. In some cases the problem occurred even with the positive
forms, but all of the dialect areas suffered from the lack of negative forms. Four dialect areas had
to be left unanalysed because the low number of informants. Moreover, three analysed areas had
to be left uncategorised because the frequencies of both generalised was and generalised were
were almost equally high.
In my analysis I found five was-generalisation dialect areas: Lower Southwest England, Home
Counties, Northeast Midlands, Central Northern England, and Northeast England; two were-
78
generalisation dialect areas: South Midlands and Central Midlands; and three areas with a mixed
type generalisation with were in positive and wasn’t in negative clauses: Central Southwest
England, Midlands, and Northwest Midlands. In Upper Southwest England, East Anglia, and
Northern England the frequencies in positive contexts were too close to each other, thus
categorisation was not possible. In analysing the distribution according to grammatical person
and number I found that in most cases was occurred most frequently with the existential there. In
areas of were-generalisation and the mixed type the cases of generalised were most frequently
occurred with a personal pronoun. In was-generalisation areas with the exception of Northeast
Midlands the generalised cases of were occurred with there. In negative contexts it was very
common for both wasn’t and weren’t to occur with there, but there were also instances where no
cases of either were found.
In the analysis concerning the age groups the division was five dialect areas where the use of
generalised forms was more common in the under 76 –group, and eight dialect areas where it was
more common in the 76 and over –group. No relationship between the geographical location of
the dialect area and the age group was detected. However, I found that there were 10 dialect areas
where the number of generalised cases of were was larger in the 76 and over –group than in the
under 76 –group. There were two areas where the results were the opposite, and one area where
the number of cases was equally high. Because the generalisation of were was more frequent
among the older group of informants, it suggests that were-generalisation is a phenomenon which
is diminishing. This is supported by the fact that in his discussion on vernacular universals,
Chambers (2004, 129) states that was is used instead of were in plural contexts. Moreover,
Britain (2002, 19) states that there are two dominant pattern of past be in English, one of which is
was occurring for standard were in both positive and negative contexts, and the other being the
occurrence of was in positive and weren’t in negative clauses. This suggests that generalised
79
cases of were do not occur in present day English, or at least are extremely rare. The fact that the
generalised cases of were were more common among the older informants suggests that between
1850-1875 when the informants approximately were born were-generalisation was more common
than towards the 20th century when the younger informants were born. It seems that towards the
20th century there was a change in language and was-generalisation became more common,
because in the speech of the younger informants were-generalisation is less common.
As expected the results of the three studies differed to a great extent. Terttu Nevalainen’s
study was distinct from the other two, the methods being slightly different. Therefore, I could not
make as direct a comparison of my results as was possible with those of Anderwald. Moreover,
Nevalainen’s data was from a written corpus, hence the comparisons of the two studies to mine
were diverse. On the other hand, Anderwald’s informants were a lot younger than mine, which
set the studies apart. There was only one dialect area that was categorised in the same way by
Anderwald and myself. From the SED to the BNC the generalisation pattern of South Midlands
had not changed. All the other dialect areas differed in categorisation. Similarly, to Nevalainen’s
study I categorised Central Northern England and Northeast England as was-generalisation areas,
while they in Anderwald’s study were categorised as areas of were-generalisation.
Language change is definitely detectable based on these three studies. Unfortunately, it is
impossible to say when this change has taken place and why. Even though I found evidence of
change occurring in the end of the 19th century, more research is needed to make this more
definite. In order to have made this a more tenable study more data would have been needed,
especially more negative forms, and an equal distribution of informants from all over the country.
On the other hand, even though the BNC was much larger than the SED, Anderwald suffered
from the same problems as I did, e.g. the lack of negative forms. My analysis revealed how
generalisations patterns were used in the later half of the 19th and early 20th centuries. Especially
80
interesting was the fact that I found evidence of a supposedly nonexistent generalisation type.
Furthermore, results indicating that were-generalisation was more common among the older
informants and therefore suggesting a possible place in time when were-generalisation started to
diminish, made this a successful study.
The Survey of English Dialects spoken corpus has been used very little in linguistic analysis
before, but even though the corpus is rather small, it is large enough for analysing frequently
occurring linguistic phenomena.
81
References Anderwald, Lieselotte. 2001. ”Was/were-variation in non-standard British English today.” English World-Wide 22:1, 1-21. Boberg, Charles. 2004. “Real and Apparent Time in Language Change: Late Adoption of Changes in Montreal English.” American Speech 79:3, 250-269. Britain, David. 2002. “Diffusion, levelling, simplification and reallocation in past tense BE in the English Fens.” Journal of Sociolinguistics 6:1, 16-43. Chambers, J.K. 1995. Sociolinguistic theory. Oxford: Blackwell. 2004. “Dynamic typology and vernacular universals." In Dialectology Meets Typology: Dialect Grammar from a Cross-Linguistic Perspective, ed. Bernd Kortmann, 127-145. Berlin: Mouton de Gruyter. Chomsky, Noam. 1964. Aspects of the Theory of Syntax Cambridge: MIT Press.. Francis, W.N. 1983. Dialectology: An Introduction. London: Longman. Hay, Jennifer & Daniel Scheier. 2004. “Reversing the trajectory of language change: Subject-verb agreement with be in New Zealand English.” Language Variation and Change 16:3, 209-235. Klemola, Juhani & Mark J. Jones. 1999. ”The Leeds Corpus of English Dialects – Project.” In Dialectal Variation in English: Proceedings of the Harold Orton Centenary Conference 1998. Leeds Studies in English, New Series XXX, 1999, ed. Clive Upton and Katie Wales, 17-30. Leeds: University of Leeds. Labov, William. 1966. The Social Stratification of English in New York City. Washington DC: Center for Applied Linguistics. 2003. "Some Sociolinguistic Principles." In Sociolinguistics. The Essential Readings, ed. Christina Bratt Paulston and G. Richard Tucker, 234-250. Oxford: Blackwell Publishing Ltd. Lass, Roger. 1992. “Phonology and morphology.” The Cambridge History of the English Language. Ed. N. Blake. Cambridge: Cambridge University Press, 23-154. McEnery, Tony & Andrew Wilson. 2001. Corpus Linguistics: An Introduction. Edinburgh: Edinburgh University Press. Meyer, Charles F. 2002. English Corpus Linguistics: An Introduction. Cambridge: Cambridge University Press.
82
Milroy, James. 1992. Linguistic Variation & Change: On the Historical Sociolinguistics of English. Oxford: Basil Blackwell. Nevalainen, Terttu. 2006. “Vernacular universals? The case of plural was in Early Modern English.” In Types of Variation: Diachronic, dialectal and typological interfaces, ed. Terttu Nevalainen, Juhani Klemola and Mikko Laitinen, 351-369. Amsterdam & Philadelphia: Benjamins. Orton, Harold. 1962. Survey of English Dialects: An Introduction. Leeds: E. J. Arnold and Son Ltd. Pyles, Thomas & John Algeo. 1993. The Origins and Development of the English Language. Orlando: Harcourt Brace and Company. Schreier, Daniel. 2002. “Past BE in Tristan da Cunha: the rise and fall of categoriality in language change. “ American Speech 77:1, 70-99. Smith, Jennifer and Sali Tagliamonte. 1998. “We were all thegither... I think we was all thegither’: was regularization in Buckie English.” World Englishes 17:2, 105-126. Tagliamonte, Sali. 1998. “Was/were variation across three generations: View from the city of York.” Language Variation and Change 10:2, 153-191. Thakerar, J.N., H. Giles and J. Chesire. 1982. “Psychological and linguistic parameters of speech accommodation theory.” In Advances in the Social Psychology of Language. Ed. C. Fraser and K.R. Scherer. Cambridge: Cambridge University Press, 205-255. Tognini-Bonelli, Elena. 2001. Corpus Linguistics at Work. Amsterdam: Benjamins. Trudgill, Peter. 1978. Sociolinguistic Patterns in British English. London: Arnold. 1990. Dialects of England. Oxford: Basil Blackwell. Wardhaugh, Ronald. 1998. An Introduction to Sociolinguistics. Oxford: Basil Blackwell. Wolfram, Walt and Natalie Schilling-Estes. 2003. “Language change in conservative dialects: the case of past tense BE in Southern enclave communities.” American Speech 78:2, 208-227.
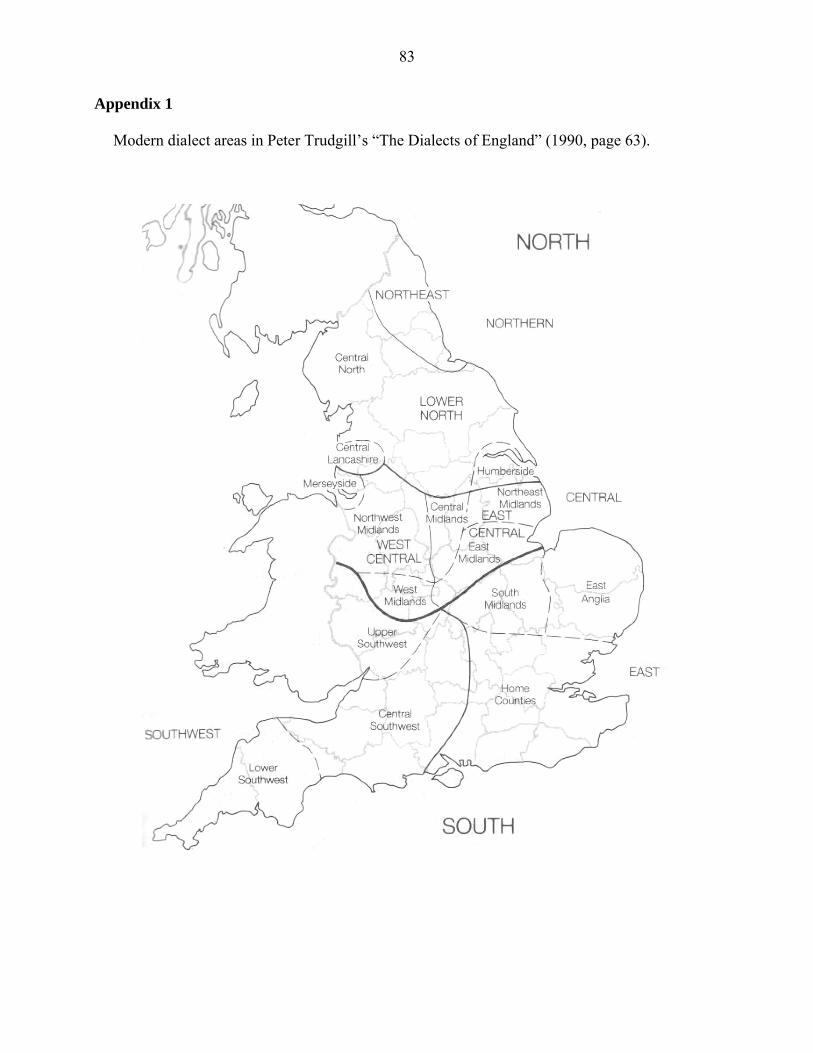
83
Appendix 1
Modern dialect areas in Peter Trudgill’s “The Dialects of England” (1990, page 63).
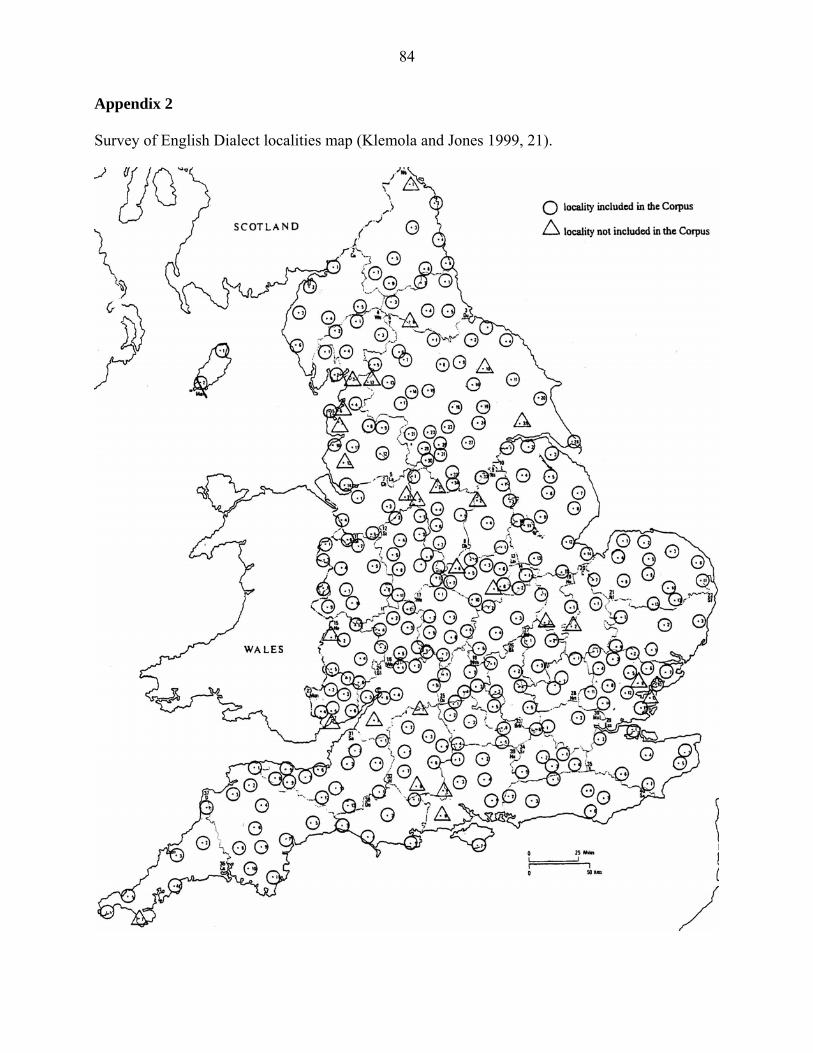
84
Appendix 2 Survey of English Dialect localities map (Klemola and Jones 1999, 21).
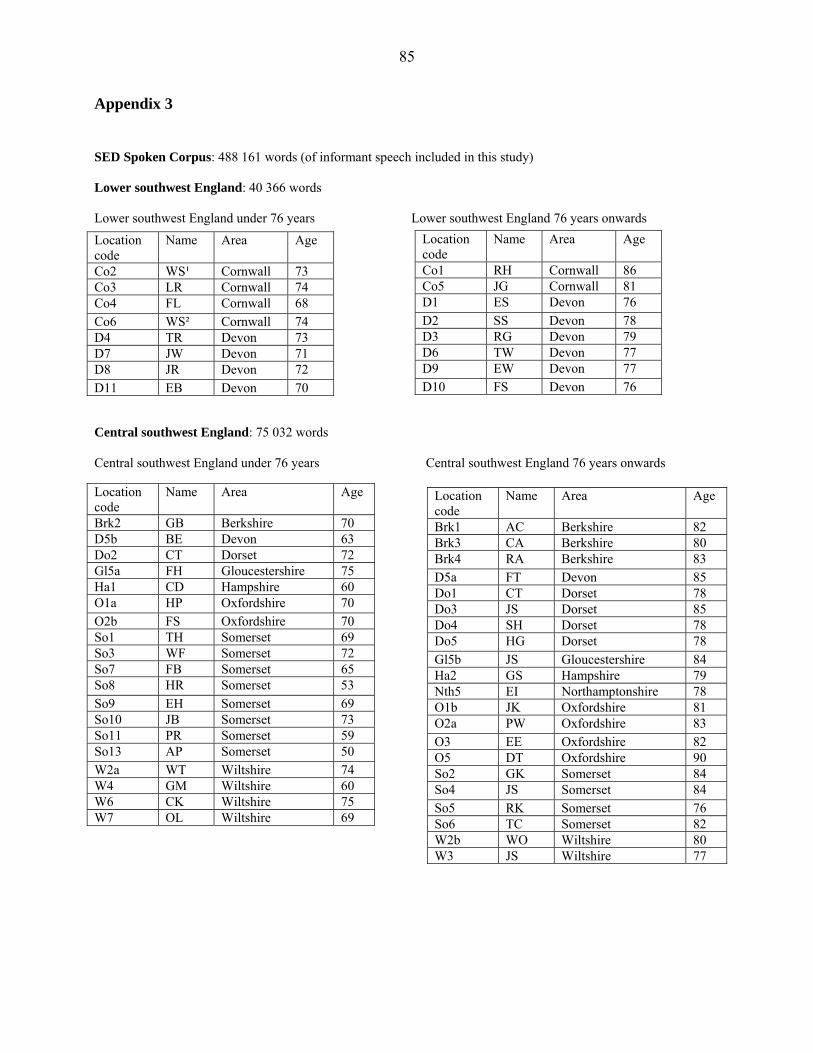
85
Appendix 3 SED Spoken Corpus: 488 161 words (of informant speech included in this study) Lower southwest England: 40 366 words Lower southwest England under 76 years Lower southwest England 76 years onwards
Location code
Name Area Age
Co2 WS¹ Cornwall 73 Co3 LR Cornwall 74 Co4 FL Cornwall 68 Co6 WS² Cornwall 74 D4 TR Devon 73 D7 JW Devon 71 D8 JR Devon 72 D11 EB Devon 70
Location code
Name Area Age
Co1 RH Cornwall 86 Co5 JG Cornwall 81 D1 ES Devon 76 D2 SS Devon 78 D3 RG Devon 79 D6 TW Devon 77 D9 EW Devon 77 D10 FS Devon 76
Central southwest England: 75 032 words Central southwest England under 76 years Central southwest England 76 years onwards
Location code
Name Area Age
Brk2 GB Berkshire 70 D5b BE Devon 63 Do2 CT Dorset 72 Gl5a FH Gloucestershire 75 Ha1 CD Hampshire 60 O1a HP Oxfordshire 70 O2b FS Oxfordshire 70 So1 TH Somerset 69 So3 WF Somerset 72 So7 FB Somerset 65 So8 HR Somerset 53 So9 EH Somerset 69 So10 JB Somerset 73 So11 PR Somerset 59 So13 AP Somerset 50 W2a WT Wiltshire 74 W4 GM Wiltshire 60 W6 CK Wiltshire 75 W7 OL Wiltshire 69
Location code
Name Area Age
Brk1 AC Berkshire 82 Brk3 CA Berkshire 80 Brk4 RA Berkshire 83 D5a FT Devon 85 Do1 CT Dorset 78 Do3 JS Dorset 85 Do4 SH Dorset 78 Do5 HG Dorset 78 Gl5b JS Gloucestershire 84 Ha2 GS Hampshire 79 Nth5 EI Northamptonshire 78 O1b JK Oxfordshire 81 O2a PW Oxfordshire 83 O3 EE Oxfordshire 82 O5 DT Oxfordshire 90 So2 GK Somerset 84 So4 JS Somerset 84 So5 RK Somerset 76 So6 TC Somerset 82 W2b WO Wiltshire 80 W3 JS Wiltshire 77
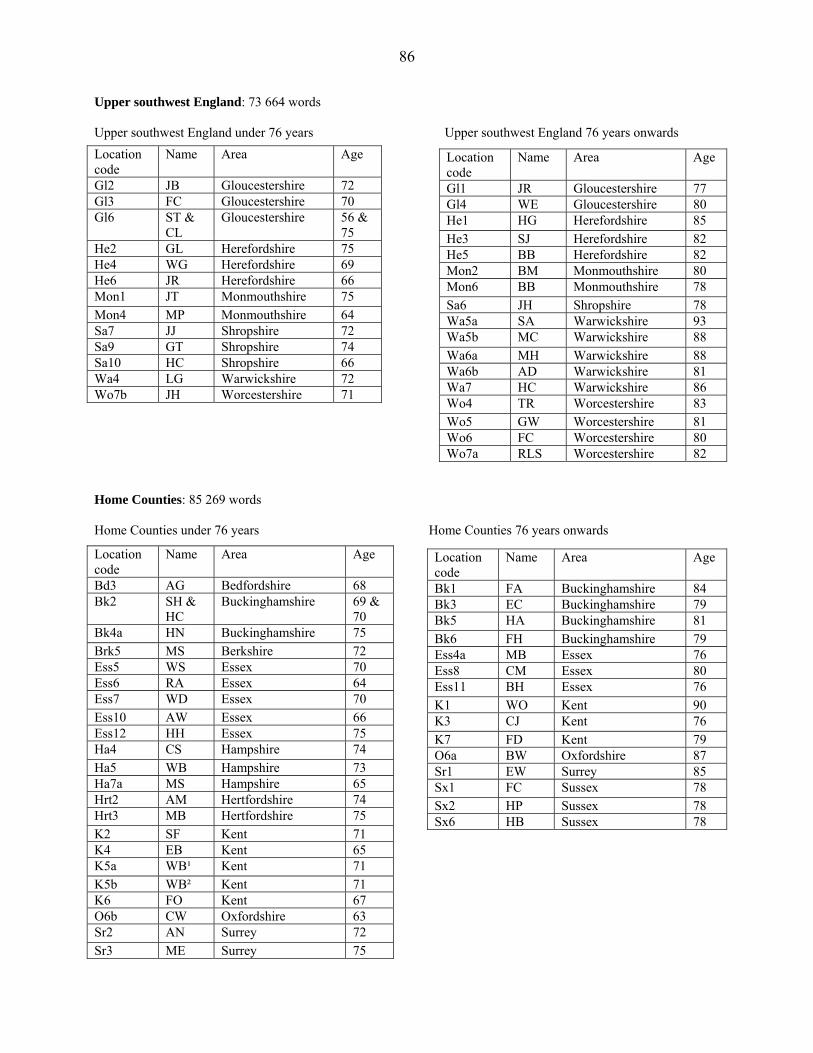
86
Upper southwest England: 73 664 words Upper southwest England under 76 years Upper southwest England 76 years onwards
Location code
Name Area Age
Gl2 JB Gloucestershire 72 Gl3 FC Gloucestershire 70 Gl6 ST &
CL Gloucestershire 56 &
75 He2 GL Herefordshire 75 He4 WG Herefordshire 69 He6 JR Herefordshire 66 Mon1 JT Monmouthshire 75 Mon4 MP Monmouthshire 64 Sa7 JJ Shropshire 72 Sa9 GT Shropshire 74 Sa10 HC Shropshire 66 Wa4 LG Warwickshire 72 Wo7b JH Worcestershire 71
Location code
Name Area Age
Gl1 JR Gloucestershire 77 Gl4 WE Gloucestershire 80 He1 HG Herefordshire 85 He3 SJ Herefordshire 82 He5 BB Herefordshire 82 Mon2 BM Monmouthshire 80 Mon6 BB Monmouthshire 78 Sa6 JH Shropshire 78 Wa5a SA Warwickshire 93 Wa5b MC Warwickshire 88 Wa6a MH Warwickshire 88 Wa6b AD Warwickshire 81 Wa7 HC Warwickshire 86 Wo4 TR Worcestershire 83 Wo5 GW Worcestershire 81 Wo6 FC Worcestershire 80 Wo7a RLS Worcestershire 82
Home Counties: 85 269 words Home Counties under 76 years Home Counties 76 years onwards
Location code
Name Area Age
Bd3 AG Bedfordshire 68 Bk2 SH &
HC Buckinghamshire 69 &
70 Bk4a HN Buckinghamshire 75 Brk5 MS Berkshire 72 Ess5 WS Essex 70 Ess6 RA Essex 64 Ess7 WD Essex 70 Ess10 AW Essex 66 Ess12 HH Essex 75 Ha4 CS Hampshire 74 Ha5 WB Hampshire 73 Ha7a MS Hampshire 65 Hrt2 AM Hertfordshire 74 Hrt3 MB Hertfordshire 75 K2 SF Kent 71 K4 EB Kent 65 K5a WB¹ Kent 71 K5b WB² Kent 71 K6 FO Kent 67 O6b CW Oxfordshire 63 Sr2 AN Surrey 72 Sr3 ME Surrey 75
Location code
Name Area Age
Bk1 FA Buckinghamshire 84 Bk3 EC Buckinghamshire 79 Bk5 HA Buckinghamshire 81 Bk6 FH Buckinghamshire 79 Ess4a MB Essex 76 Ess8 CM Essex 80 Ess11 BH Essex 76 K1 WO Kent 90 K3 CJ Kent 76 K7 FD Kent 79 O6a BW Oxfordshire 87 Sr1 EW Surrey 85 Sx1 FC Sussex 78 Sx2 HP Sussex 78 Sx6 HB Sussex 78
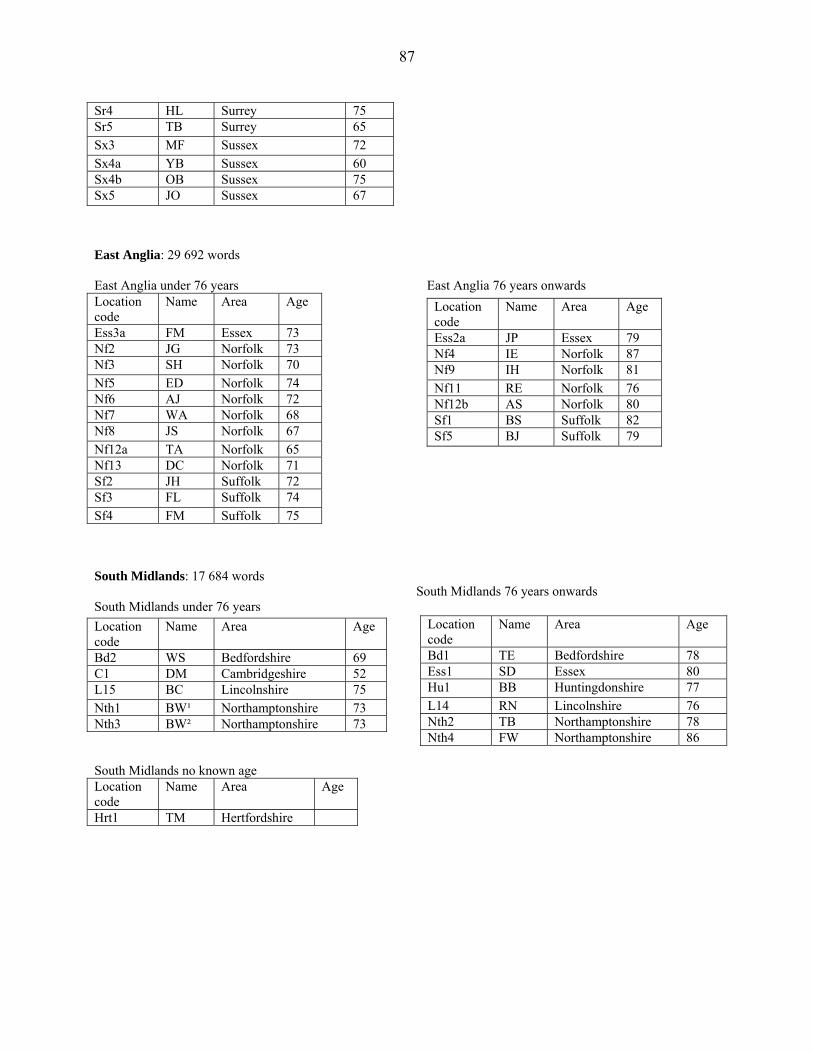
87
Sr4 HL Surrey 75 Sr5 TB Surrey 65 Sx3 MF Sussex 72 Sx4a YB Sussex 60 Sx4b OB Sussex 75 Sx5 JO Sussex 67
East Anglia: 29 692 words East Anglia under 76 years East Anglia 76 years onwards
Location code
Name Area Age
Ess3a FM Essex 73 Nf2 JG Norfolk 73 Nf3 SH Norfolk 70 Nf5 ED Norfolk 74 Nf6 AJ Norfolk 72 Nf7 WA Norfolk 68 Nf8 JS Norfolk 67 Nf12a TA Norfolk 65 Nf13 DC Norfolk 71 Sf2 JH Suffolk 72 Sf3 FL Suffolk 74 Sf4 FM Suffolk 75
Location code
Name Area Age
Ess2a JP Essex 79 Nf4 IE Norfolk 87 Nf9 IH Norfolk 81 Nf11 RE Norfolk 76 Nf12b AS Norfolk 80 Sf1 BS Suffolk 82 Sf5 BJ Suffolk 79
South Midlands: 17 684 words South Midlands 76 years onwards
South Midlands under 76 years Location code
Name Area Age
Bd1 TE Bedfordshire 78 Ess1 SD Essex 80 Hu1 BB Huntingdonshire 77 L14 RN Lincolnshire 76 Nth2 TB Northamptonshire 78 Nth4 FW Northamptonshire 86
Location code
Name Area Age
Bd2 WS Bedfordshire 69 C1 DM Cambridgeshire 52 L15 BC Lincolnshire 75 Nth1 BW¹ Northamptonshire 73 Nth3 BW² Northamptonshire 73
South Midlands no known age Location code
Name Area Age
Hrt1 TM Hertfordshire
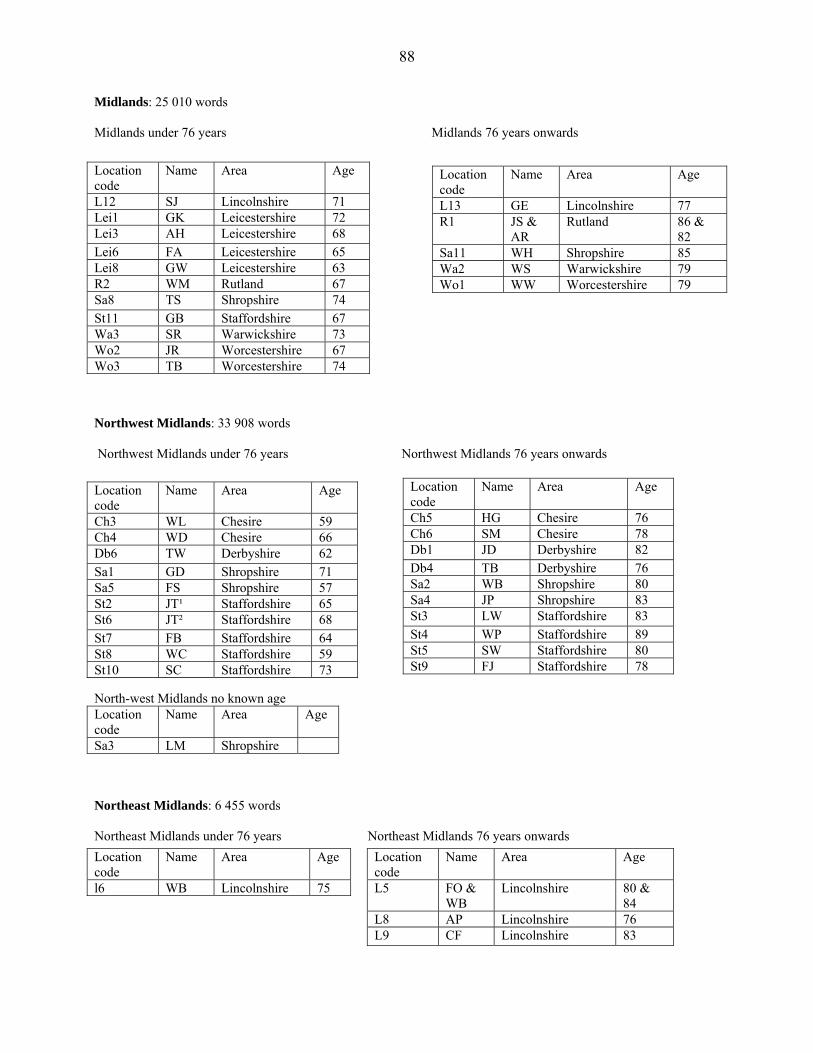
88
Midlands: 25 010 words Midlands under 76 years Midlands 76 years onwards
Location code
Name Area Age
L12 SJ Lincolnshire 71 Lei1 GK Leicestershire 72 Lei3 AH Leicestershire 68 Lei6 FA Leicestershire 65 Lei8 GW Leicestershire 63 R2 WM Rutland 67 Sa8 TS Shropshire 74 St11 GB Staffordshire 67 Wa3 SR Warwickshire 73 Wo2 JR Worcestershire 67 Wo3 TB Worcestershire 74
Location code
Name Area Age
L13 GE Lincolnshire 77 R1 JS &
AR Rutland 86 &
82 Sa11 WH Shropshire 85 Wa2 WS Warwickshire 79 Wo1 WW Worcestershire 79
Northwest Midlands: 33 908 words Northwest Midlands under 76 years Northwest Midlands 76 years onwards
Location code
Name Area Age
Ch5 HG Chesire 76 Ch6 SM Chesire 78 Db1 JD Derbyshire 82 Db4 TB Derbyshire 76 Sa2 WB Shropshire 80 Sa4 JP Shropshire 83 St3 LW Staffordshire 83 St4 WP Staffordshire 89 St5 SW Staffordshire 80 St9 FJ Staffordshire 78
Location code
Name Area Age
Ch3 WL Chesire 59 Ch4 WD Chesire 66 Db6 TW Derbyshire 62 Sa1 GD Shropshire 71 Sa5 FS Shropshire 57 St2 JT¹ Staffordshire 65 St6 JT² Staffordshire 68 St7 FB Staffordshire 64 St8 WC Staffordshire 59 St10 SC Staffordshire 73
North-west Midlands no known age
Location code
Name Area Age
Sa3 LM Shropshire
Northeast Midlands: 6 455 words Northeast Midlands under 76 years Northeast Midlands 76 years onwards
Location code
Name Area Age
l6 WB Lincolnshire 75
Location code
Name Area Age
L5 FO & WB
Lincolnshire 80 & 84
L8 AP Lincolnshire 76 L9 CF Lincolnshire 83
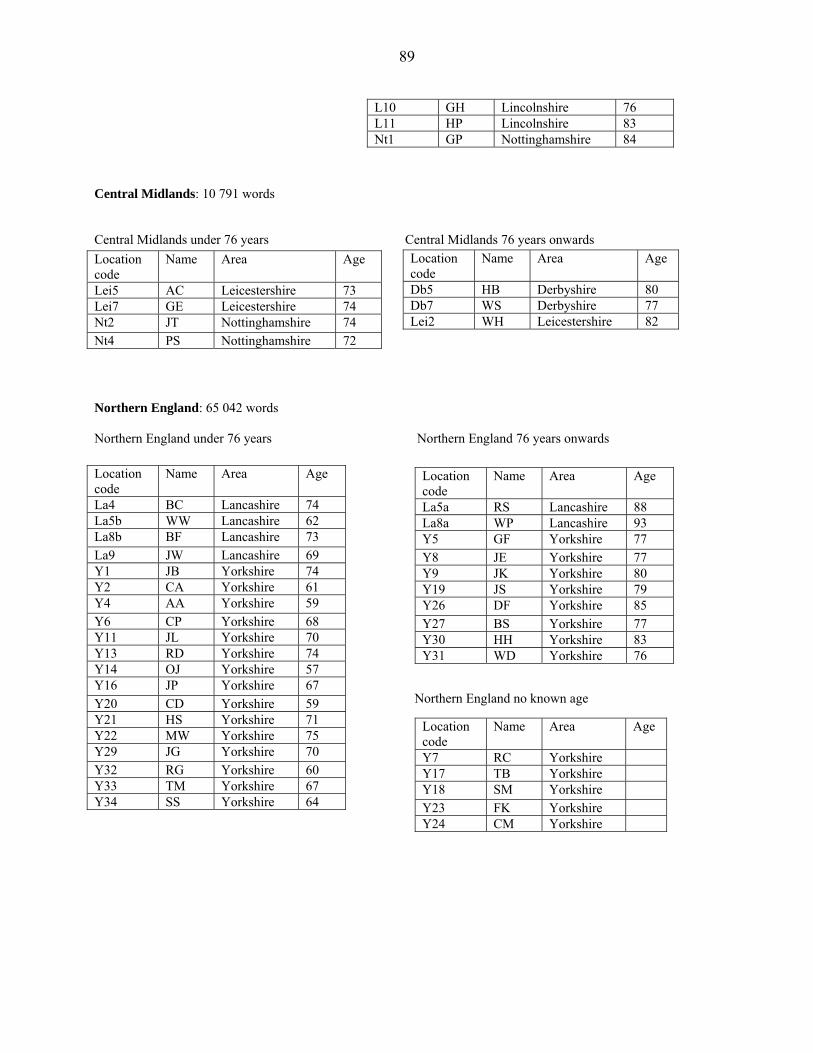
89
L10 GH Lincolnshire 76 L11 HP Lincolnshire 83 Nt1 GP Nottinghamshire 84
Central Midlands: 10 791 words
Central Midlands under 76 years Central Midlands 76 years onwards
Location code
Name Area Age
Lei5 AC Leicestershire 73 Lei7 GE Leicestershire 74 Nt2 JT Nottinghamshire 74 Nt4 PS Nottinghamshire 72
Location code
Name Area Age
Db5 HB Derbyshire 80 Db7 WS Derbyshire 77 Lei2 WH Leicestershire 82
Northern England: 65 042 words Northern England under 76 years Northern England 76 years onwards
Northern England no known age
Location code
Name Area Age
La4 BC Lancashire 74 La5b WW Lancashire 62 La8b BF Lancashire 73 La9 JW Lancashire 69 Y1 JB Yorkshire 74 Y2 CA Yorkshire 61 Y4 AA Yorkshire 59 Y6 CP Yorkshire 68 Y11 JL Yorkshire 70 Y13 RD Yorkshire 74 Y14 OJ Yorkshire 57 Y16 JP Yorkshire 67 Y20 CD Yorkshire 59 Y21 HS Yorkshire 71 Y22 MW Yorkshire 75 Y29 JG Yorkshire 70 Y32 RG Yorkshire 60 Y33 TM Yorkshire 67 Y34 SS Yorkshire 64
Location code
Name Area Age
La5a RS Lancashire 88 La8a WP Lancashire 93 Y5 GF Yorkshire 77 Y8 JE Yorkshire 77 Y9 JK Yorkshire 80 Y19 JS Yorkshire 79 Y26 DF Yorkshire 85 Y27 BS Yorkshire 77 Y30 HH Yorkshire 83 Y31 WD Yorkshire 76
Location code
Name Area Age
Y7 RC Yorkshire Y17 TB Yorkshire Y18 SM Yorkshire Y23 FK Yorkshire Y24 CM Yorkshire
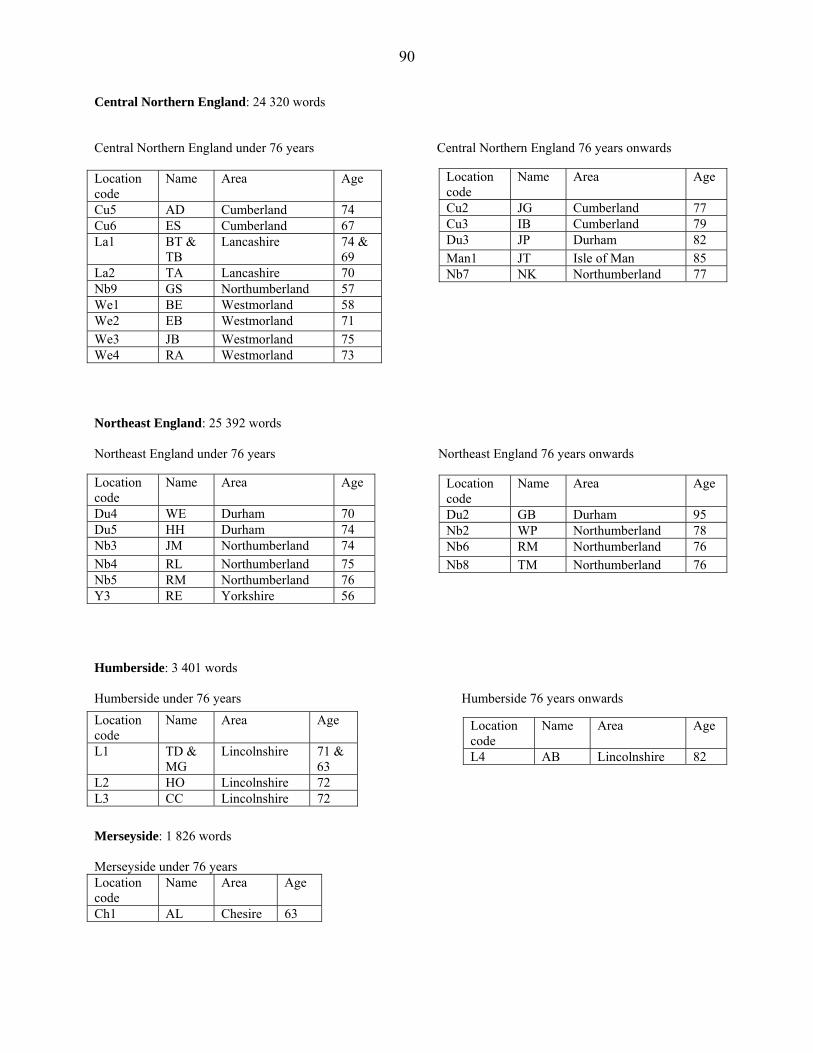
90
Central Northern England: 24 320 words Central Northern England under 76 years Central Northern England 76 years onwards
Location code
Name Area Age
Cu2 JG Cumberland 77 Cu3 IB Cumberland 79 Du3 JP Durham 82 Man1 JT Isle of Man 85 Nb7 NK Northumberland 77
Location code
Name Area Age
Cu5 AD Cumberland 74 Cu6 ES Cumberland 67 La1 BT &
TB Lancashire 74 &
69 La2 TA Lancashire 70 Nb9 GS Northumberland 57 We1 BE Westmorland 58 We2 EB Westmorland 71 We3 JB Westmorland 75 We4 RA Westmorland 73
Northeast England: 25 392 words Northeast England under 76 years Northeast England 76 years onwards
Location code
Name Area Age
Du4 WE Durham 70 Du5 HH Durham 74 Nb3 JM Northumberland 74 Nb4 RL Northumberland 75 Nb5 RM Northumberland 76 Y3 RE Yorkshire 56
Location code
Name Area Age
Du2 GB Durham 95 Nb2 WP Northumberland 78 Nb6 RM Northumberland 76 Nb8 TM Northumberland 76
Humberside: 3 401 words Humberside under 76 years Humberside 76 years onwards
Location code
Name Area Age
L1 TD & MG
Lincolnshire 71 & 63
L2 HO Lincolnshire 72 L3 CC Lincolnshire 72
Location code
Name Area Age
L4 AB Lincolnshire 82
Merseyside: 1 826 words Merseyside under 76 years Location code
Name Area Age
Ch1 AL Chesire 63
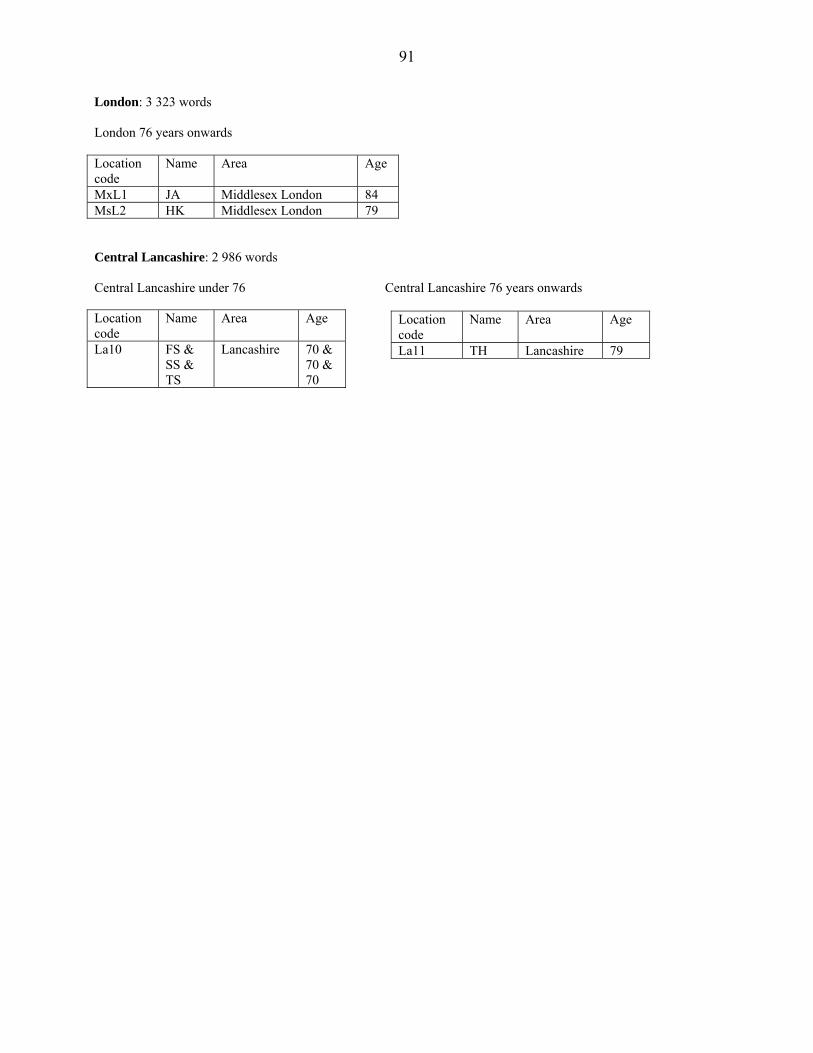
91
London: 3 323 words London 76 years onwards
Location code
Name Area Age
MxL1 JA Middlesex London 84 MsL2 HK Middlesex London 79
Central Lancashire: 2 986 words Central Lancashire under 76 Central Lancashire 76 years onwards
Location code
Name Area Age
La11 TH Lancashire 79
Location code
Name Area Age
La10 FS & SS & TS
Lancashire 70 & 70 & 70
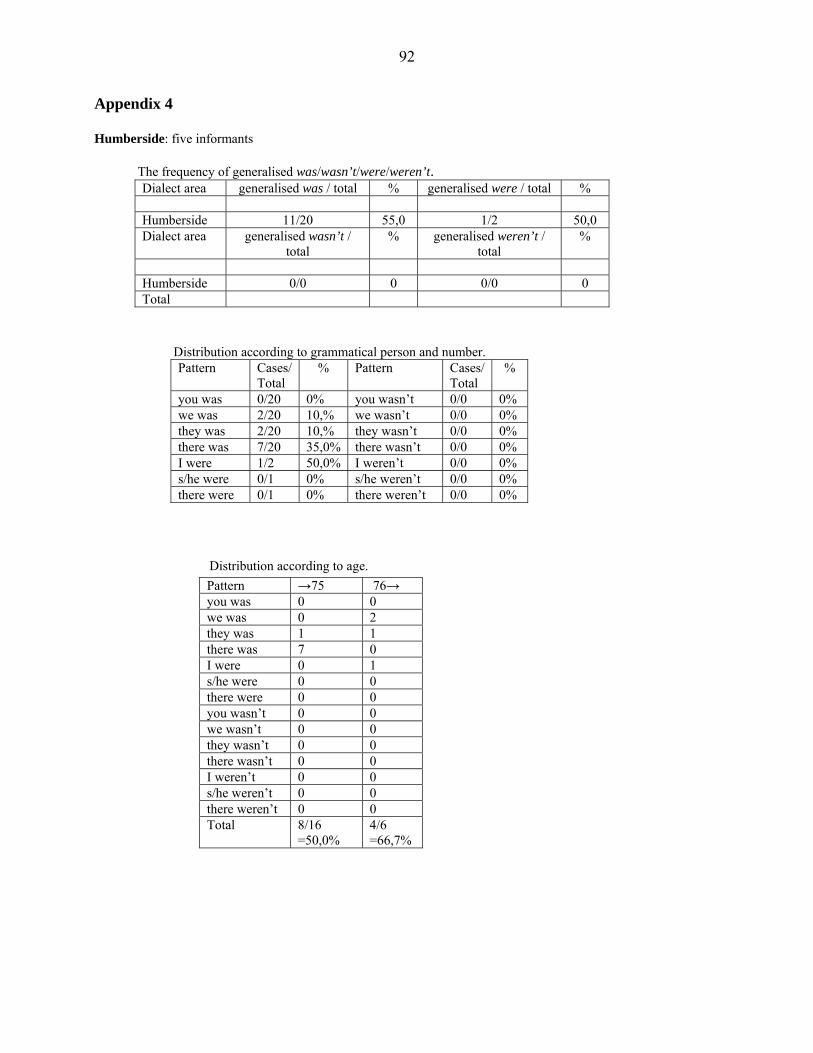
92
Appendix 4 Humberside: five informants The frequency of generalised was/wasn’t/were/weren’t.
Dialect area generalised was / total % generalised were / total %
Humberside 11/20 55,0 1/2 50,0 Dialect area generalised wasn’t /
total % generalised weren’t /
total %
Humberside 0/0 0 0/0 0 Total
Distribution according to grammatical person and number.
Pattern Cases/ Total
% Pattern Cases/ Total
%
you was 0/20 0% you wasn’t 0/0 0% we was 2/20 10,% we wasn’t 0/0 0% they was 2/20 10,% they wasn’t 0/0 0% there was 7/20 35,0% there wasn’t 0/0 0% I were 1/2 50,0% I weren’t 0/0 0% s/he were 0/1 0% s/he weren’t 0/0 0% there were 0/1 0% there weren’t 0/0 0%
Distribution according to age. Pattern →75 76→
you was 0 0 we was 0 2 they was 1 1 there was 7 0 I were 0 1 s/he were 0 0 there were 0 0 you wasn’t 0 0 we wasn’t 0 0 they wasn’t 0 0 there wasn’t 0 0 I weren’t 0 0 s/he weren’t 0 0 there weren’t 0 0 Total 8/16
=50,0% 4/6 =66,7%
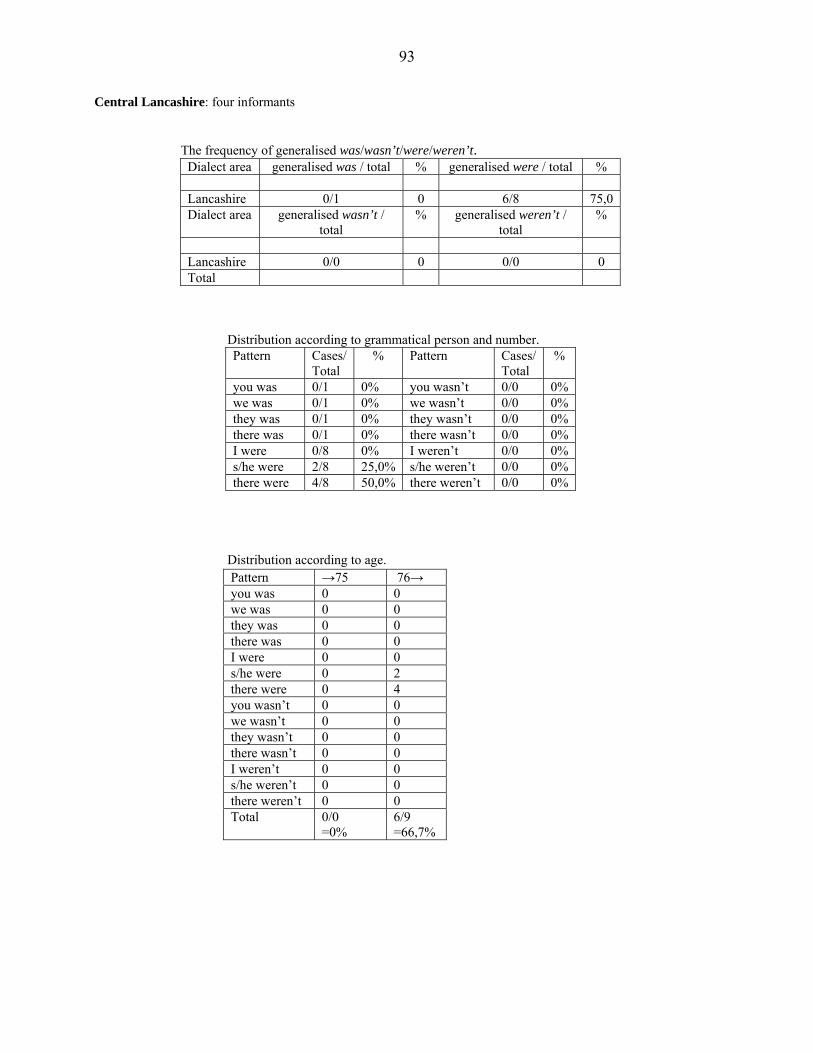
93
Central Lancashire: four informants The frequency of generalised was/wasn’t/were/weren’t.
Dialect area generalised was / total % generalised were / total % Lancashire 0/1 0 6/8 75,0 Dialect area generalised wasn’t /
total % generalised weren’t /
total %
Lancashire 0/0 0 0/0 0 Total
Distribution according to grammatical person and number.
Pattern Cases/ Total
% Pattern Cases/ Total
%
you was 0/1 0% you wasn’t 0/0 0% we was 0/1 0% we wasn’t 0/0 0% they was 0/1 0% they wasn’t 0/0 0% there was 0/1 0% there wasn’t 0/0 0% I were 0/8 0% I weren’t 0/0 0% s/he were 2/8 25,0% s/he weren’t 0/0 0% there were 4/8 50,0% there weren’t 0/0 0%
Distribution according to age. Pattern →75 76→
you was 0 0 we was 0 0 they was 0 0 there was 0 0 I were 0 0 s/he were 0 2 there were 0 4 you wasn’t 0 0 we wasn’t 0 0 they wasn’t 0 0 there wasn’t 0 0 I weren’t 0 0 s/he weren’t 0 0 there weren’t 0 0 Total 0/0
=0% 6/9 =66,7%
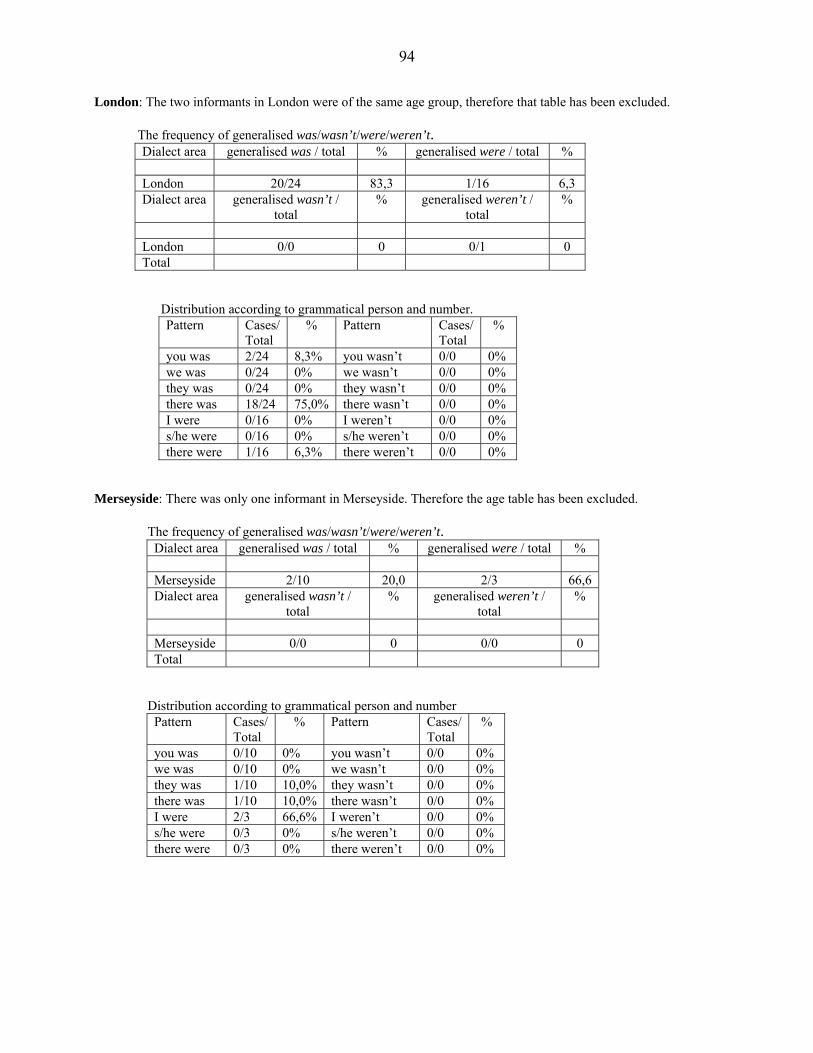
94
London: The two informants in London were of the same age group, therefore that table has been excluded. The frequency of generalised was/wasn’t/were/weren’t.
Dialect area generalised was / total % generalised were / total % London 20/24 83,3 1/16 6,3 Dialect area generalised wasn’t /
total % generalised weren’t /
total %
London 0/0 0 0/1 0 Total
Distribution according to grammatical person and number.
Pattern Cases/ Total
% Pattern Cases/ Total
%
you was 2/24 8,3% you wasn’t 0/0 0% we was 0/24 0% we wasn’t 0/0 0% they was 0/24 0% they wasn’t 0/0 0% there was 18/24 75,0% there wasn’t 0/0 0% I were 0/16 0% I weren’t 0/0 0% s/he were 0/16 0% s/he weren’t 0/0 0% there were 1/16 6,3% there weren’t 0/0 0%
Merseyside: There was only one informant in Merseyside. Therefore the age table has been excluded. The frequency of generalised was/wasn’t/were/weren’t.
Dialect area generalised was / total % generalised were / total % Merseyside 2/10 20,0 2/3 66,6 Dialect area generalised wasn’t /
total % generalised weren’t /
total %
Merseyside 0/0 0 0/0 0 Total
Distribution according to grammatical person and number
Pattern Cases/ Total
% Pattern Cases/ Total
%
you was 0/10 0% you wasn’t 0/0 0% we was 0/10 0% we wasn’t 0/0 0% they was 1/10 10,0% they wasn’t 0/0 0% there was 1/10 10,0% there wasn’t 0/0 0% I were 2/3 66,6% I weren’t 0/0 0% s/he were 0/3 0% s/he weren’t 0/0 0% there were 0/3 0% there weren’t 0/0 0%

![Title: Welfare rights, governance and forced migration · Web viewFM6: At first it was good since we were living in a supported [NASS] house and everything was well. We were living](https://static.fdocuments.us/doc/165x107/5ea5334f0b053313bf17b2fc/title-welfare-rights-governance-and-forced-web-view-fm6-at-first-it-was-good.jpg)