Water Treatment and Distribution System …web.mit.edu/watsan/Docs/Student Reports/Thailand/MIT...
47
Water Treatment and Distribution System Improvements for Mae La Refugee Camp, Thailand Final Group Report May 23, 2008 Mary Harding Navid Rahimi Katherine Vater Master of Engineering Program Department of Civil and Environmental Engineering Massachusetts Institute of Technology (Lantagne, 2007)
Transcript of Water Treatment and Distribution System …web.mit.edu/watsan/Docs/Student Reports/Thailand/MIT...

Water Treatment and Distribution System Improvements
for Mae La Refugee Camp, Thailand
Final Group Report May 23, 2008
Mary Harding Navid Rahimi
Katherine Vater
Master of Engineering Program Department of Civil and Environmental Engineering
Massachusetts Institute of Technology
(Lantagne, 2007)

Mae La Water System 2 Group Report
TABLE OF CONTENTS TABLE OF CONTENTS ................................................................................................... 2 1 INTRODUCTION ..................................................................................................... 3
1.1 Climate in Northwestern Thailand ......................................................................... 3 1.2 Mae La Camp......................................................................................................... 4
2 WATER IN MAE LA.................................................................................................. 7
2.1 Drinking Water Sources ......................................................................................... 7 2.2 Drinking Water System Layout .............................................................................. 9 2.3 Water Quality....................................................................................................... 11 2.4 Existing Water Treatment .................................................................................... 12 2.5 Non-potable Water Sources ................................................................................. 14
3 MODELING OF THE WATER SUPPLY ............................................................... 16
3.1 Data Collection and Analysis................................................................................ 16 3.2 Distribution System Model .................................................................................. 17 3.3 Analysis of Distribution System ........................................................................... 20 3.4 Recommendations ............................................................................................... 23
4 GIS REPRESENTATION AND ASSESSMENT .................................................... 24
4.1 Data Collection and Analysis................................................................................ 24 4.2 Results ................................................................................................................. 24 4.3 Volume of Water Per Household ......................................................................... 30 4.4 Conclusion and Recommendations ...................................................................... 33
5 RECOMMENDATIONS FOR SPRING WATER QUALITY IMPROVEMENT.. 35
5.1 Design Parameters ............................................................................................... 35 5.2 Pre-treatment ....................................................................................................... 35 5.3 Field Work ........................................................................................................... 36 5.4 Recommendations ............................................................................................... 41
REFERENCES ................................................................................................................. 46
Mae La Water System 3 Group Report
1 INTRODUCTION Among the 1.1 billion people worldwide without UN-qualified improved drinking
water, refugees are a population with unique needs (UNICEF & WHO, 2004). According to
the 1951 Geneva Refugee Convention a refugee is defined as,
“A person who, owning to a well-founded fear of being persecuted for reasons of race, religion, nationality, membership of a particular social group or political opinion, is outside the country of his nationality and is unable or, owning to such fear, is unwilling to avail himself of the protection of that country” (UNHCR, 2003).
Upon fleeing, refugees find themselves reliant on local governments and NGOs to
provide assistance with basic human needs. For over twenty years, Karen people have been
fleeing Myanmar (Burma) to Thailand to escape persecution from the military junta which is
in power. There are two million refugees living legally and illegally in Thailand along the
Myanmar (Burma) border, including 50,000 in Mae La Temporary Shelter (TBBC, No Date;
UNHCR, 2007).
Mae La has existed for over twenty years and has an improved water system.
Drinking water is drawn from a nearby river and from springs, is chlorinated in most cases,
and released into a pipe-tap network. Non-potable water is also available from various wells
through out the camp, as well as surface water sources. This report summarizes the work
completed by Harding (2008) and Rahimi (2008) on water distribution in the camp and by
Vater (2008) on drinking water treatment in Mae La. Further detailed work is available in
each of their theses.
1.1 Climate in Northwestern Thailand The Tak region of northwestern Thailand is characterized by a tropical climate with
wet and dry seasons (UN Thailand, 2006; ESS, 2002). The rainy season lasts from June to
October, followed by a cool season until February. The weather turns hot and sunny
between March and May (UN Thailand, 2006). This region of Thailand has an average
temperature of 26ºC although there is significant variation during the year and, due to
changes in elevation, over the region. Temperatures can range from 4ºC to 42ºC (Thailand
Meteorological Department in ESS, 2002). The average annual rainfall in Mae Sot, Thailand
Mae La Water System 4 Group Report
0
20
40
60
80
100
120
140
160
J F M A M J J A S O N D
Month
Mon
thly
Rai
nfal
l [m
m]
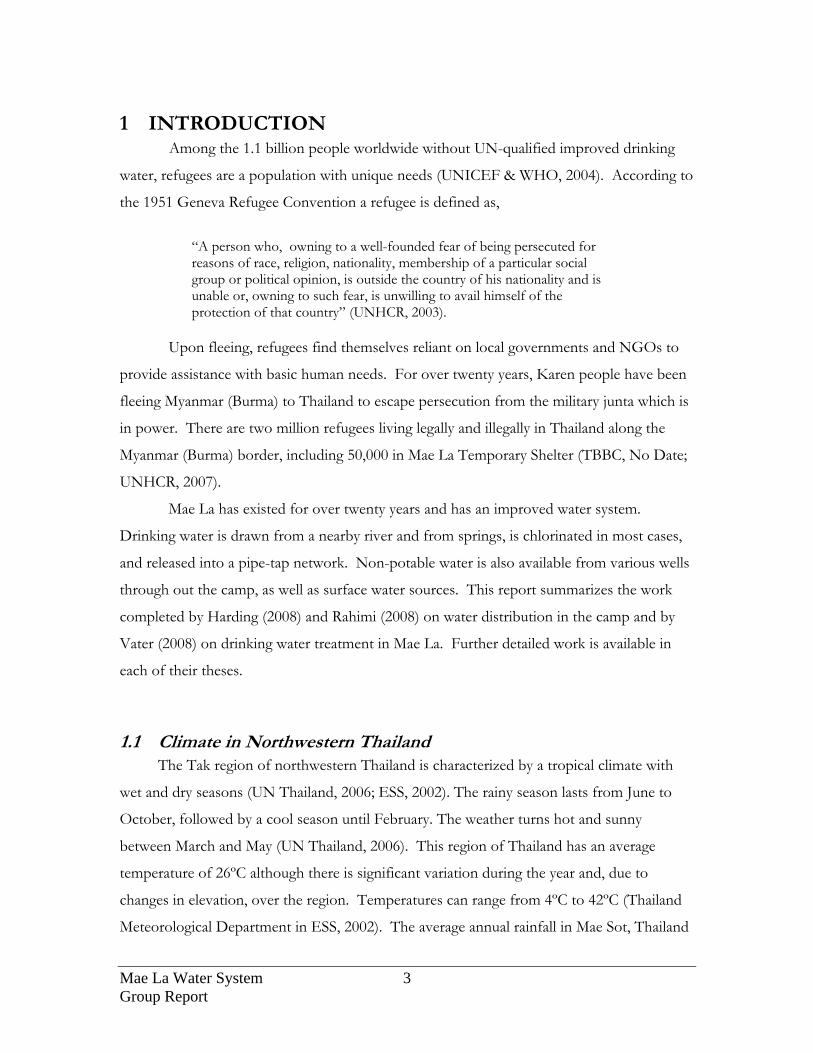
is 2100 mm (GOSIC, 2007). Figure 1-1 shows the monthly rainfall averages over the past 56
years. During the wet season there is a clear increase in precipitation, as more than 85% of
the annual rainfall occurs during this period.
Figure 1-1: Average Monthly Rainfall for Mae Sot, Thailand (GOSIC, 2007).
1.2 Mae La Camp The Mae La camp is a refuge for people seeking protection from the Myanmar
(Burma) government. The camp is run by the United Nations High Commissioner on
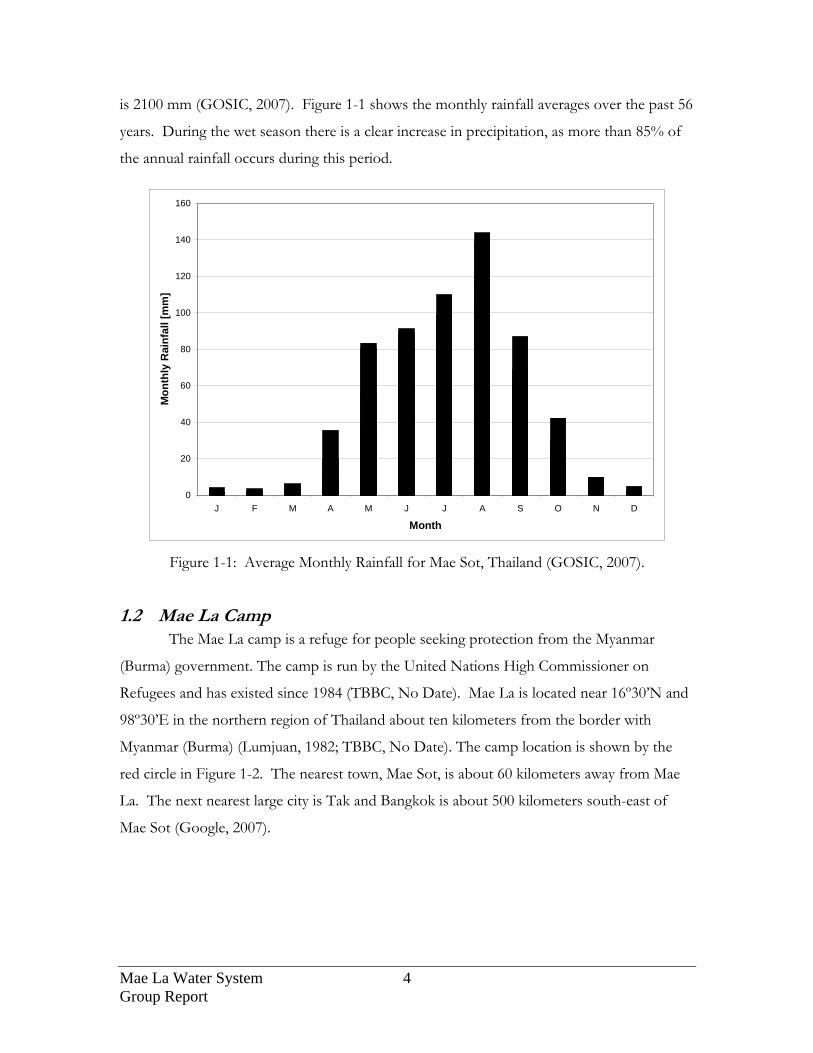
Refugees and has existed since 1984 (TBBC, No Date). Mae La is located near 16º30’N and
98º30’E in the northern region of Thailand about ten kilometers from the border with
Myanmar (Burma) (Lumjuan, 1982; TBBC, No Date). The camp location is shown by the
red circle in Figure 1-2. The nearest town, Mae Sot, is about 60 kilometers away from Mae
La. The next nearest large city is Tak and Bangkok is about 500 kilometers south-east of
Mae Sot (Google, 2007).
Mae La Water System 5 Group Report
Figure 1-2: Location of the Mae La Refugee Camp (Map of the Mekong River Subregion, 2006).
1.2.1 Environment The Mae La camp is located in a valley surrounded by two ridges rising about 300
meters above the camp. These hills are distant extremities of the Himalayan mountain range
which is mainly located northwest of Thailand. A river runs through the end of the two
ridges and bounds the camp on the north. The Thai military protects the road that borders
the camp and links it with the nearest Thai city of Mae Sot. These key boundaries are shown
in Figure 1-3, where the camp is roughly circled in white. Figure 1-3 also shows some water
infrastructure including several storage tanks and some spring locations.
1.2.2 Public Health and Water Supply There are about eleven NGOs that provide services within the camp ranging from
food and shelter provisions, health care, protection, and water supply. Aide Médicale
Internationale (AMI) is currently charged with providing health care and water supply. The
AMI Mae La Water and Logistics Coordinator oversees a staff of about 30 refugees who
operate the water system on a daily basis. The water system consists of drinking water
supplied to public tap stands from surface and groundwater sources. In addition, non-

Mae La Water System 6 Group Report
potable water is provided throughout the camp by rope-pump and bore-hole groundwater
supplies. The drinking water system is discussed in detail in Chapter 3.
Figure 1-3: Mae La Location, looking southwest
(Google Earth, 2007; Lantagne, 2007).
Road
River
Myanmar (Burma)
Mae Sot
Thailand
Mae La Camp
Mae La Water System 7 Group Report
2 WATER IN MAE LA AMI maintains potable and non-potable public water supplies within Mae La. This
chapter outlines the sources of water for the camp, the water system components, and the
existing treatment processes for drinking water.
2.1 Drinking Water Sources The drinking water sources in Mae La are surface water from the river and naturally
flowing springs. The river runs east-west, cross-cutting through the north end of the
southwest facing ridge that borders the camp. While the river is an important water supply
for the camp, its existing quality and potential means of treatment are not the focus of this
work. The thirteen springs that are used for public drinking water supply flow from the
ridge that borders the camp to the southwest and their quality is the focus of this thesis.
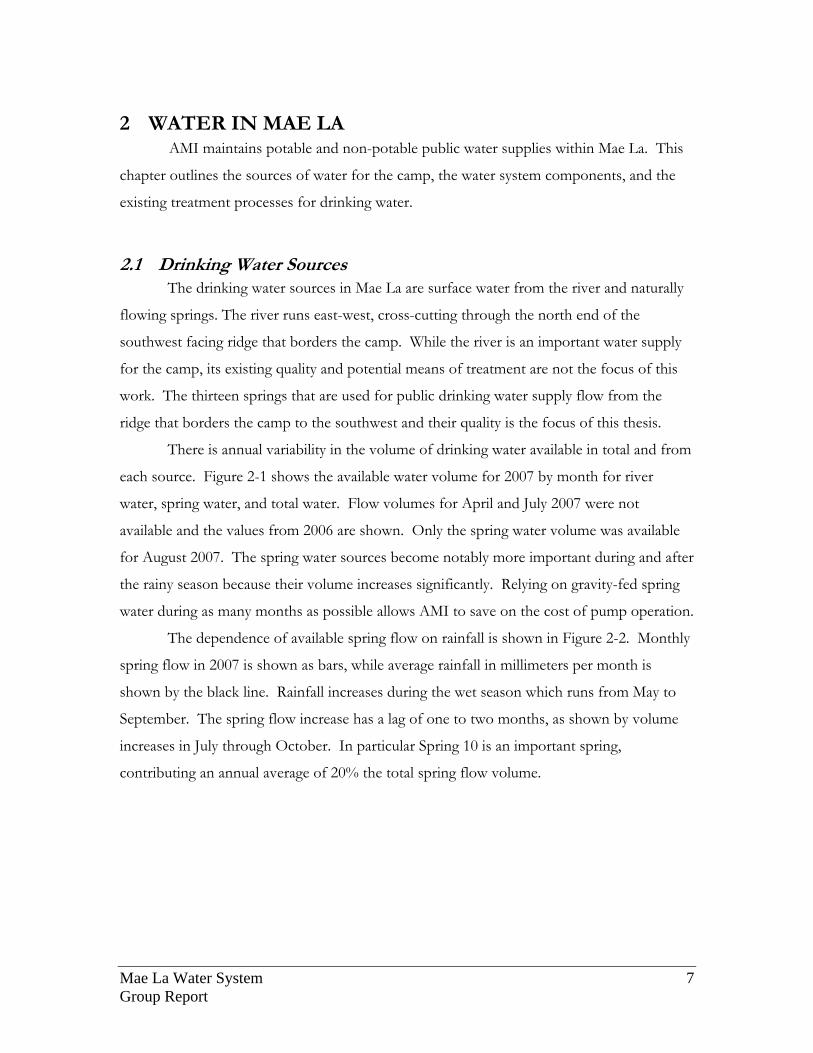
There is annual variability in the volume of drinking water available in total and from
each source. Figure 2-1 shows the available water volume for 2007 by month for river
water, spring water, and total water. Flow volumes for April and July 2007 were not
available and the values from 2006 are shown. Only the spring water volume was available
for August 2007. The spring water sources become notably more important during and after
the rainy season because their volume increases significantly. Relying on gravity-fed spring
water during as many months as possible allows AMI to save on the cost of pump operation.
The dependence of available spring flow on rainfall is shown in Figure 2-2. Monthly
spring flow in 2007 is shown as bars, while average rainfall in millimeters per month is
shown by the black line. Rainfall increases during the wet season which runs from May to
September. The spring flow increase has a lag of one to two months, as shown by volume
increases in July through October. In particular Spring 10 is an important spring,
contributing an annual average of 20% the total spring flow volume.

Mae La Water System 8 Group Report
0
500
1000
1500
2000
2500
Jan
FebMar
Apr* MayJu
nJu
l*Aug
**Sep Oct
Nov Dec
Month
Ave
rage
Flo
w
[cub
ic m
eter
s pe
r day
]
River Water Spring Water Total Water
0
2000
4000
6000
8000
10000
12000
14000
J F M A M J J A S O N D
Month
2007
Spr
ing
Flow
[c
ubic
met
ers
per m
onth
]
0
50
100
150
200
250300
350
400
450500
Ave
rage
Rai
nfal
l [m
m p
er m
onth
]
Spring Flow Rainfall
Figure 2-1: Division of 2007 Flow Volume from Storage Tanks by Source
*Data from 2006, ** River Water Flow Rate Unavailable
Figure 2-2: Annual Rainfall and Spring Flow Averages (AMI, 2007; GOSIC, 2007).
Mae La Water System 9 Group Report
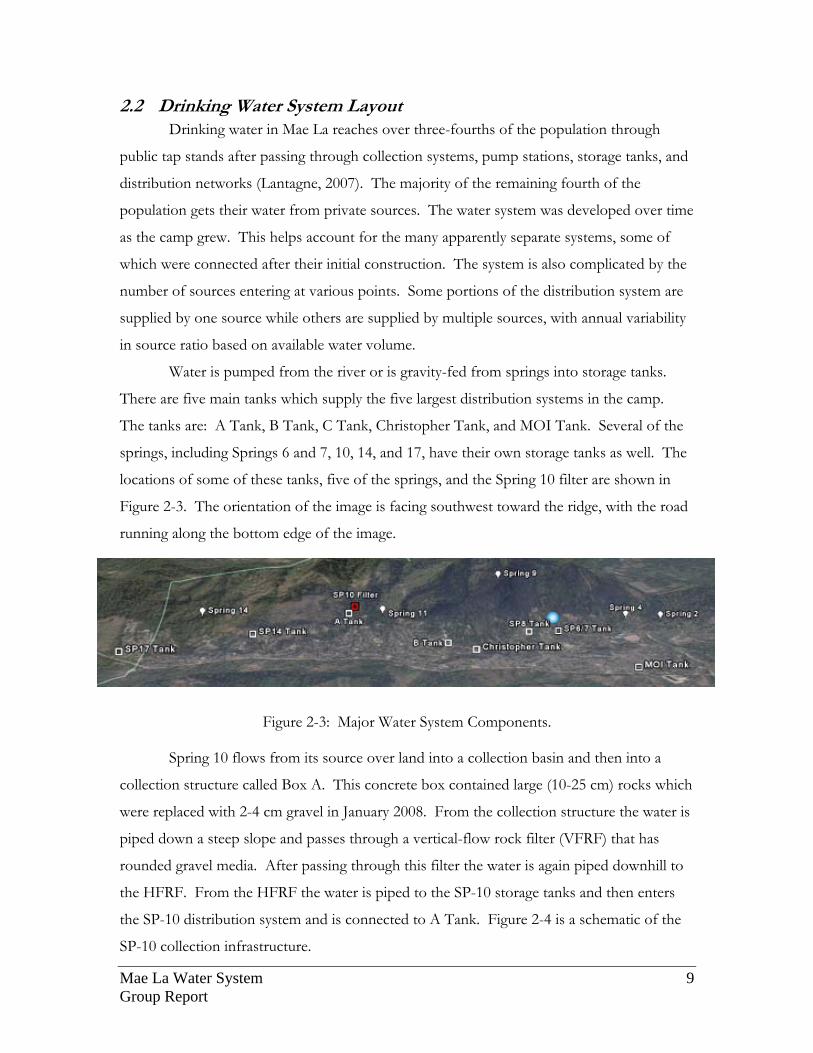
2.2 Drinking Water System Layout Drinking water in Mae La reaches over three-fourths of the population through
public tap stands after passing through collection systems, pump stations, storage tanks, and
distribution networks (Lantagne, 2007). The majority of the remaining fourth of the
population gets their water from private sources. The water system was developed over time
as the camp grew. This helps account for the many apparently separate systems, some of
which were connected after their initial construction. The system is also complicated by the
number of sources entering at various points. Some portions of the distribution system are
supplied by one source while others are supplied by multiple sources, with annual variability
in source ratio based on available water volume.
Water is pumped from the river or is gravity-fed from springs into storage tanks.
There are five main tanks which supply the five largest distribution systems in the camp.
The tanks are: A Tank, B Tank, C Tank, Christopher Tank, and MOI Tank. Several of the
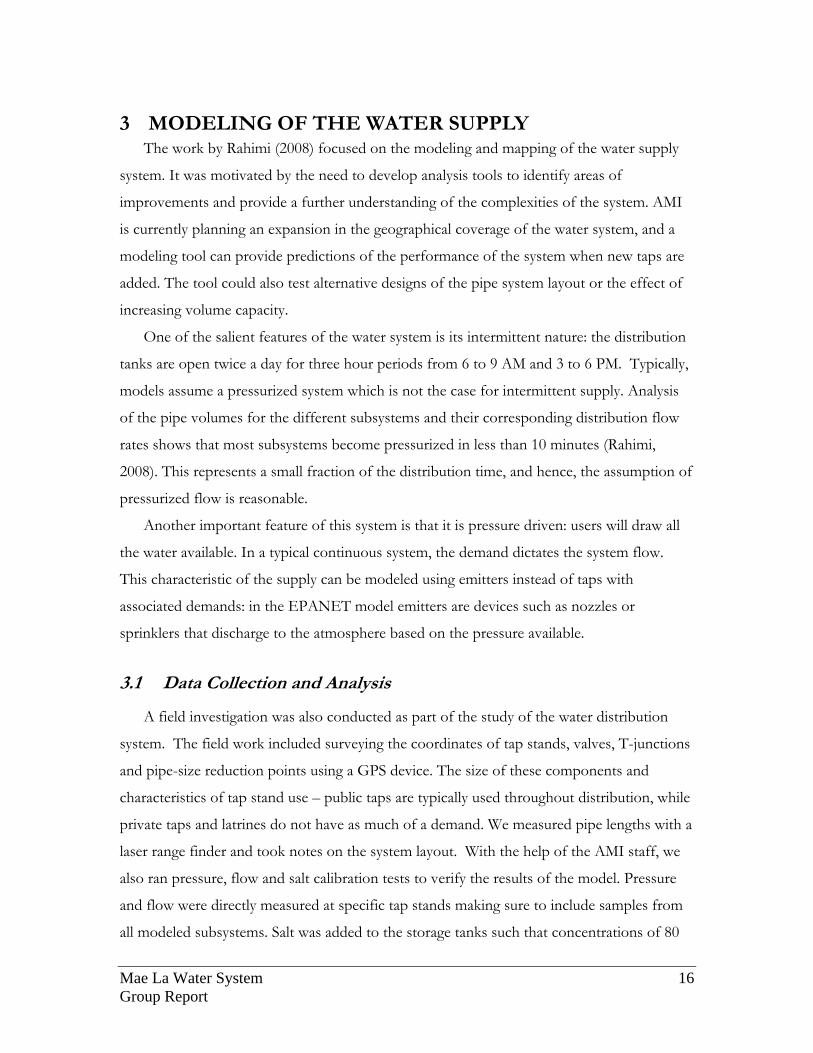
springs, including Springs 6 and 7, 10, 14, and 17, have their own storage tanks as well. The
locations of some of these tanks, five of the springs, and the Spring 10 filter are shown in
Figure 2-3. The orientation of the image is facing southwest toward the ridge, with the road
running along the bottom edge of the image.
Figure 2-3: Major Water System Components.
Spring 10 flows from its source over land into a collection basin and then into a
collection structure called Box A. This concrete box contained large (10-25 cm) rocks which
were replaced with 2-4 cm gravel in January 2008. From the collection structure the water is
piped down a steep slope and passes through a vertical-flow rock filter (VFRF) that has
rounded gravel media. After passing through this filter the water is again piped downhill to
the HFRF. From the HFRF the water is piped to the SP-10 storage tanks and then enters
the SP-10 distribution system and is connected to A Tank. Figure 2-4 is a schematic of the
SP-10 collection infrastructure.

Mae La Water System 10 Group Report
Figure 2-4: Schematic of SP-10 collection infrastructure.
Most of the tanks, including the main ones listed above, are opened for distribution
twice a day, generally for 3 hour periods from 6 to 9 AM and 3 to 6 PM. There is ample
demand at the tap stands and people must wait in line to receive water. Typically, water is
continuously collected throughout the distribution time and all available water is taken.
Some of the smaller and isolated spring systems are always open as the spring water flows
directly to tap stands.
Some private standpipes exist (such as those for the school or the hospital), but the
vast majority of the tap stands shown in Figure 2-1 are public. It is estimated that tap stands
provides the majority of the water supply to over three-fourths of the population (Lantagne,
2007). The water is free for residents of the camp.
There are three pumps used to drive the river water to tanks: Tim pump, Christopher pump
and MOI pump. Tim pump brings river water to tanks A, B, C and Christopher; Christopher
pump to both the Christopher and MOI tanks; and MOI pump to the MOI tank and
recently, on an intermittent basis, to a storage pond located across the road from the camp.
A lower pumping rate occurs during the dry season because of the lack of available
river water. Additionally, more water is available from the springs in August, so there is less
need to pump water from the river.
Stream Basin
Box A
VFRF
HFRF
Storage Tanks

Mae La Water System 11 Group Report
0102030405060708090
100110120130140150160170180190
J F M A M J J A S O N D
Month
Turb
idity
[NTU
]
2.3 Water Quality AMI determines water quality in Mae La by turbidity measurement, microbial
sampling, and chlorine residual testing. Information on turbidity is available for the past
several years on a weekly basis at several locations throughout the distribution system.
Turbidity of the water supply is measured at a variety of locations throughout the
distribution system—including spring collection boxes, storage tanks, and pump stations—
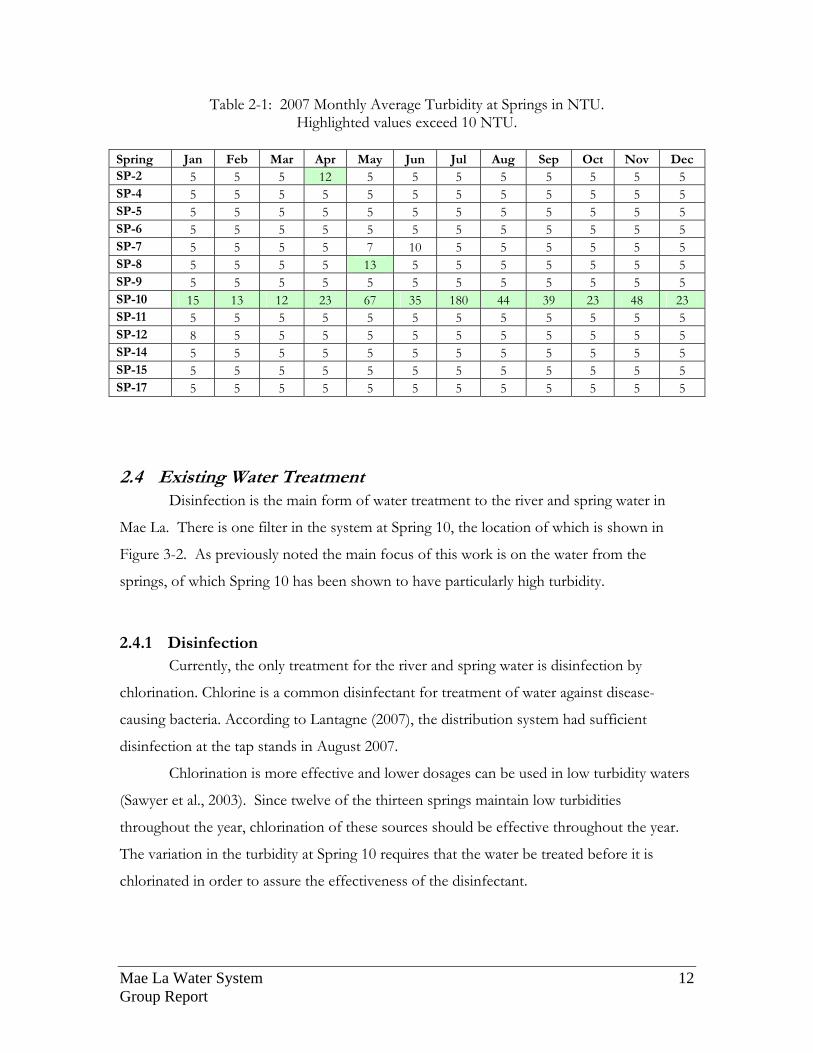
normally on a weekly basis. Table 2-1 gives the monthly turbidity average at each of the
springs. Values greater than ten NTU are highlighted. Spring 10 is the only spring to have
turbidity consistently greater than 10 NTU. In particular, at Spring 10 the highest turbidity
can be correlated with the rainy season. Figure 2-5 shows that the turbidity increases over
the months of May to September.
Figure 2-5: 2007 Turbidity at Spring 10.
Mae La Water System 12 Group Report
Table 2-1: 2007 Monthly Average Turbidity at Springs in NTU. Highlighted values exceed 10 NTU.
Spring Jan Feb Mar Apr May Jun Jul Aug Sep Oct Nov Dec SP-2 5 5 5 12 5 5 5 5 5 5 5 5 SP-4 5 5 5 5 5 5 5 5 5 5 5 5 SP-5 5 5 5 5 5 5 5 5 5 5 5 5 SP-6 5 5 5 5 5 5 5 5 5 5 5 5 SP-7 5 5 5 5 7 10 5 5 5 5 5 5 SP-8 5 5 5 5 13 5 5 5 5 5 5 5 SP-9 5 5 5 5 5 5 5 5 5 5 5 5 SP-10 15 13 12 23 67 35 180 44 39 23 48 23 SP-11 5 5 5 5 5 5 5 5 5 5 5 5 SP-12 8 5 5 5 5 5 5 5 5 5 5 5 SP-14 5 5 5 5 5 5 5 5 5 5 5 5 SP-15 5 5 5 5 5 5 5 5 5 5 5 5 SP-17 5 5 5 5 5 5 5 5 5 5 5 5
2.4 Existing Water Treatment Disinfection is the main form of water treatment to the river and spring water in
Mae La. There is one filter in the system at Spring 10, the location of which is shown in
Figure 3-2. As previously noted the main focus of this work is on the water from the
springs, of which Spring 10 has been shown to have particularly high turbidity.
2.4.1 Disinfection Currently, the only treatment for the river and spring water is disinfection by
chlorination. Chlorine is a common disinfectant for treatment of water against disease-
causing bacteria. According to Lantagne (2007), the distribution system had sufficient
disinfection at the tap stands in August 2007.
Chlorination is more effective and lower dosages can be used in low turbidity waters
(Sawyer et al., 2003). Since twelve of the thirteen springs maintain low turbidities
throughout the year, chlorination of these sources should be effective throughout the year.
The variation in the turbidity at Spring 10 requires that the water be treated before it is
chlorinated in order to assure the effectiveness of the disinfectant.
Mae La Water System 13 Group Report
0102030405060708090
100110120130140150160170180190
J F M A M J J A S O N D
Month
Turb
idity
[NTU
]
S-10 Box A S-10 Tank
2.4.2 Filtration The only treatment other than disinfection as of January 2008 is a horizontal-flow
roughing filter located between the collection and storage of Spring 10 water. The roughing
filter has three compartments separated by internal walls constructed with off-set concrete
blocks. Each compartment is 4 meters long, 1.5 meters wide, and filled with 0.8 m of
filtration media. The media consists of loose gravel with a size range of two to four
centimeters.
A pipe of three-inch diameter conveys water from the SP-10 collection box into the
filter. This inflow pipe does not distribute the water over the operating width of the filter.
The outflow pipe is a vertical perforated pipe that collects water over the depth of the filter
and sends it to the SP-10 storage tank through an outlet located at the bottom of the HFRF.
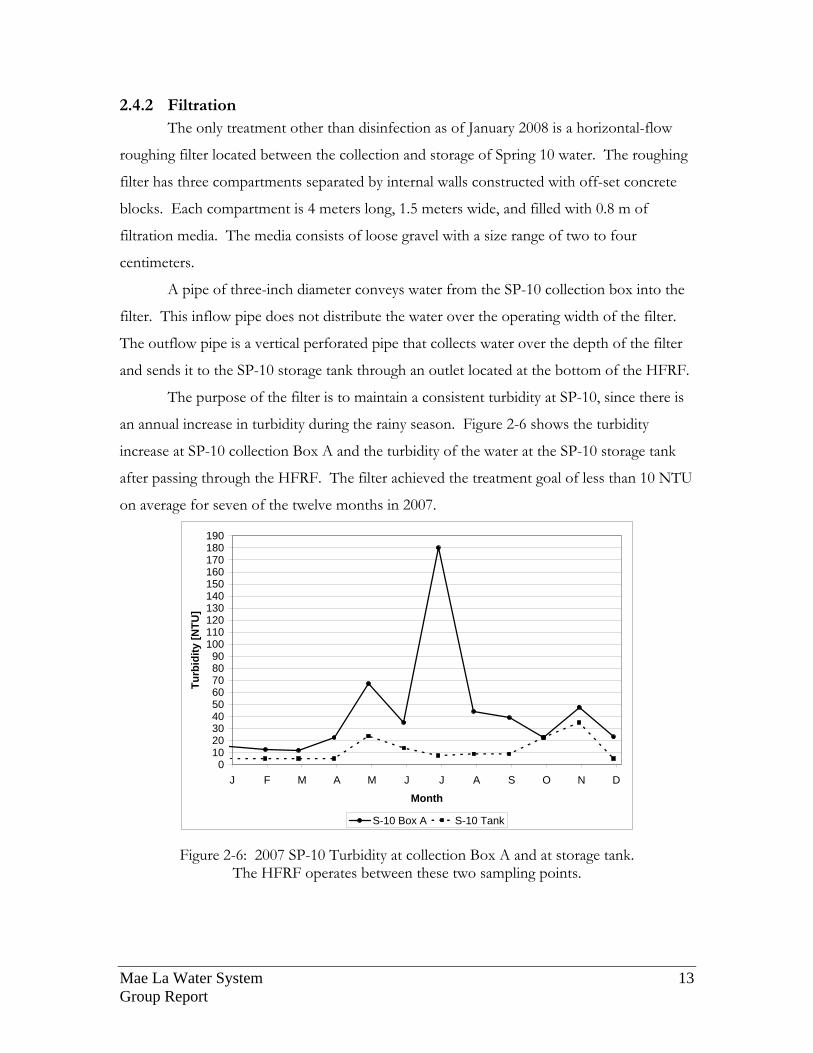
The purpose of the filter is to maintain a consistent turbidity at SP-10, since there is
an annual increase in turbidity during the rainy season. Figure 2-6 shows the turbidity
increase at SP-10 collection Box A and the turbidity of the water at the SP-10 storage tank
after passing through the HFRF. The filter achieved the treatment goal of less than 10 NTU
on average for seven of the twelve months in 2007.
Figure 2-6: 2007 SP-10 Turbidity at collection Box A and at storage tank. The HFRF operates between these two sampling points.

Mae La Water System 14 Group Report
2.5 Non-potable Water Sources There are two main types of water access within the camp: drinking water and non-
potable water. Drinking water is used for drinking and cooking, and hygienic water is used
for bathing, laundry, hand and dish washing. This water is provided by public tap stands,
while rope-pump wells, hand-dug wells or surface water serve as the sources of non-potable
water. A series of deeper boreholes exist throughout the camp but are not currently used
due to contamination and disrepair. These infrastructure points are visible in Figure 2-7.
People tend to store their water in containers on their porches and in their homes. If
water goes unused, it is discarded and the containers are refilled the following day (Lantagne,
personal communication, October 19, 2007). This makes understanding the actual water
demand of the camp difficult, because not all the water collected is used.
Figure 2-7: Distribution of boreholes, rope-pump wells and tap stands
(D. Lantagne, personal communication, 2007).
Since it is not necessary that water for bathing, washing and other non-consumable
water be disinfected through chlorination, there are a number of alternative access points
throughout the camp. The primary alternate sources are the 63 rope-pump wells are located
mainly at lower elevations in the camp. By UN definition it is an improved water source
since there is a cover and concrete drainage area, but some of the wells are contaminated by
sewerage (D. Lantagne, personal communication, October 19, 2007).
In order to collect water using rope-pump well, users place a container for collection
beneath the opening of the blue PVC pipe and pull outwards on the pump’s metal handle.
This mechanically drives water from a shallow ground water source to the surface and out
boreholes tap stands rope- pump wells

Mae La Water System 15 Group Report
the blue pipe. In order to bathe, users will either collect water in a container to pour over
themselves or place extremities at the opening of the pump one at a time to rinse off.
Some regions of the camp have very shallow ground water levels that can be
accessed through hand-dug wells. These sources are generally discouraged as the open
stagnant water is a breeding ground for disease carrying mosquitoes and the water is much
more likely to be contaminated by sewage from nearby latrines.
Many people utilize the major river as well as a small stream that cuts through the
camp a as sources for hygienic water. In the heart of the dry season, this stream can run dry
and the river can run very low, decreasing or eliminating use.
Mae La Water System 16 Group Report
3 MODELING OF THE WATER SUPPLY The work by Rahimi (2008) focused on the modeling and mapping of the water supply
system. It was motivated by the need to develop analysis tools to identify areas of
improvements and provide a further understanding of the complexities of the system. AMI
is currently planning an expansion in the geographical coverage of the water system, and a
modeling tool can provide predictions of the performance of the system when new taps are
added. The tool could also test alternative designs of the pipe system layout or the effect of
increasing volume capacity.
One of the salient features of the water system is its intermittent nature: the distribution
tanks are open twice a day for three hour periods from 6 to 9 AM and 3 to 6 PM. Typically,
models assume a pressurized system which is not the case for intermittent supply. Analysis
of the pipe volumes for the different subsystems and their corresponding distribution flow
rates shows that most subsystems become pressurized in less than 10 minutes (Rahimi,
2008). This represents a small fraction of the distribution time, and hence, the assumption of
pressurized flow is reasonable.
Another important feature of this system is that it is pressure driven: users will draw all
the water available. In a typical continuous system, the demand dictates the system flow.
This characteristic of the supply can be modeled using emitters instead of taps with
associated demands: in the EPANET model emitters are devices such as nozzles or
sprinklers that discharge to the atmosphere based on the pressure available.
3.1 Data Collection and Analysis
A field investigation was also conducted as part of the study of the water distribution
system. The field work included surveying the coordinates of tap stands, valves, T-junctions
and pipe-size reduction points using a GPS device. The size of these components and
characteristics of tap stand use – public taps are typically used throughout distribution, while
private taps and latrines do not have as much of a demand. We measured pipe lengths with a
laser range finder and took notes on the system layout. With the help of the AMI staff, we
also ran pressure, flow and salt calibration tests to verify the results of the model. Pressure
and flow were directly measured at specific tap stands making sure to include samples from
all modeled subsystems. Salt was added to the storage tanks such that concentrations of 80
Mae La Water System 17 Group Report
percent of the U.S. Environmental Protection Agency (EPA) taste threshold. Samples were
then collected at tap stands and salt concentration was analyzed over time using a
conductivity meter. After the site visit, elevations were taken from a Digital Elevation Model
(DEM) of the area provided by Bunlur Emaruchi from Mahidol University in Bangkok.
The computer program used for modeling is called EPANET: it is a free software code
available from the U.S. EPA (Rossman, 2000) that simulates hydraulic and water quality
behavior within pressurized pipe networks. Some of the key capabilities of EPANET include
no size limitations on the network, time-varying controls (e.g. opening and closing valves),
providing different types of mixing models to characterize mixing in storage tanks, and
simulating pressure-driven nodes using the concept of emitters. To use the emitter capability
as part of the model, we tested flow versus pressure of the type of tap used in the camp.
All coordinates, elevation and identifications of system components were entered into
EPANET. Taps were included with their specific emitter characteristics; tanks were set to
their corresponding size; pipe lengths and roughness as well as valve open or closed status
were also entered. Controls were added to simulate the opening and closing of the tanks at
specific times and to represent the salt test conducted. Finally, field calibration data was
entered to allow for comparison with the calculated results of pressure, flow and salt
concentration. The Mae La supply model in EPANET relies on the assumptions that all
storage tanks started full, that only large-use public taps discharge significant quantities of
water during distribution and that no water enters the tanks during distribution. This last
assumption is reasonable because 75 percent of the water flow is pumped from the river
outside of the distribution period and the portion of spring water entering tanks during
distribution is not important within the three-hour distribution window.
3.2 Distribution System Model
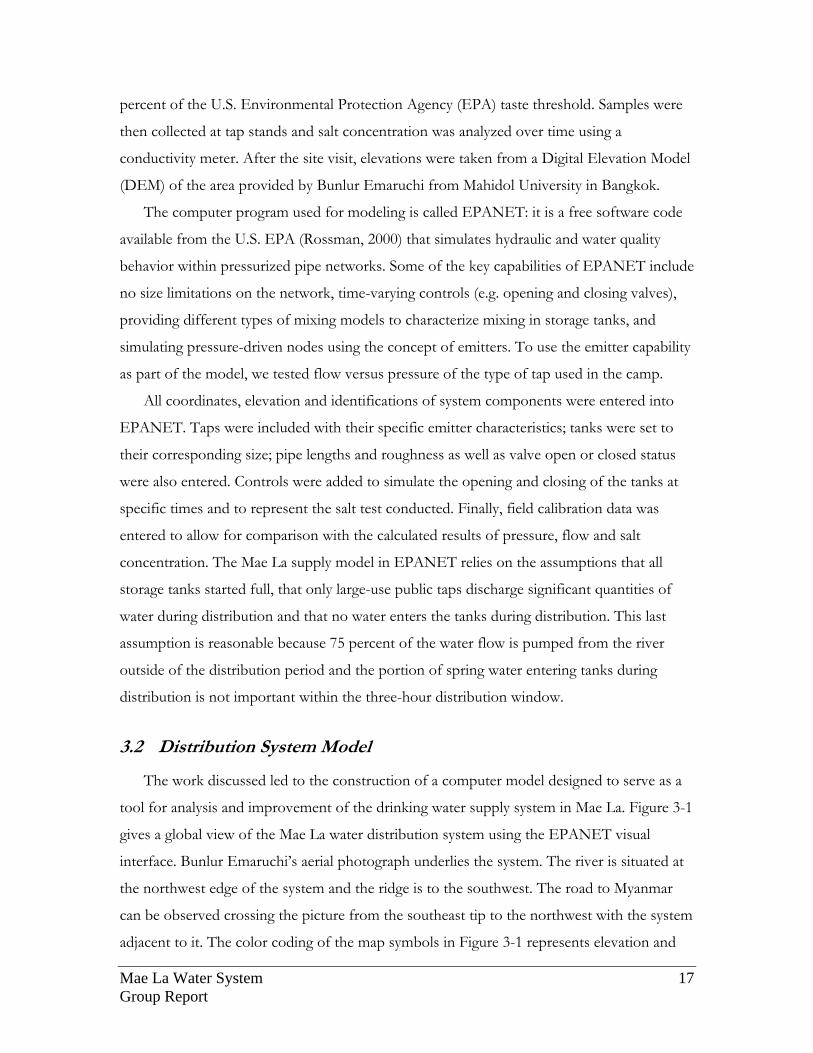
The work discussed led to the construction of a computer model designed to serve as a
tool for analysis and improvement of the drinking water supply system in Mae La. Figure 3-1
gives a global view of the Mae La water distribution system using the EPANET visual
interface. Bunlur Emaruchi’s aerial photograph underlies the system. The river is situated at
the northwest edge of the system and the ridge is to the southwest. The road to Myanmar
can be observed crossing the picture from the southeast tip to the northwest with the system
adjacent to it. The color coding of the map symbols in Figure 3-1 represents elevation and
Mae La Water System 18 Group Report
can be read from the legend. Supplying tanks as well as secondary tanks receiving water are
shown as rectangular symbols on the map. The many nodes (circular symbols) represent tap
stands, joints and tees. Pipelines are shown as blue lines.
Figure 3-1. Overall view of water distribution system in EPANET
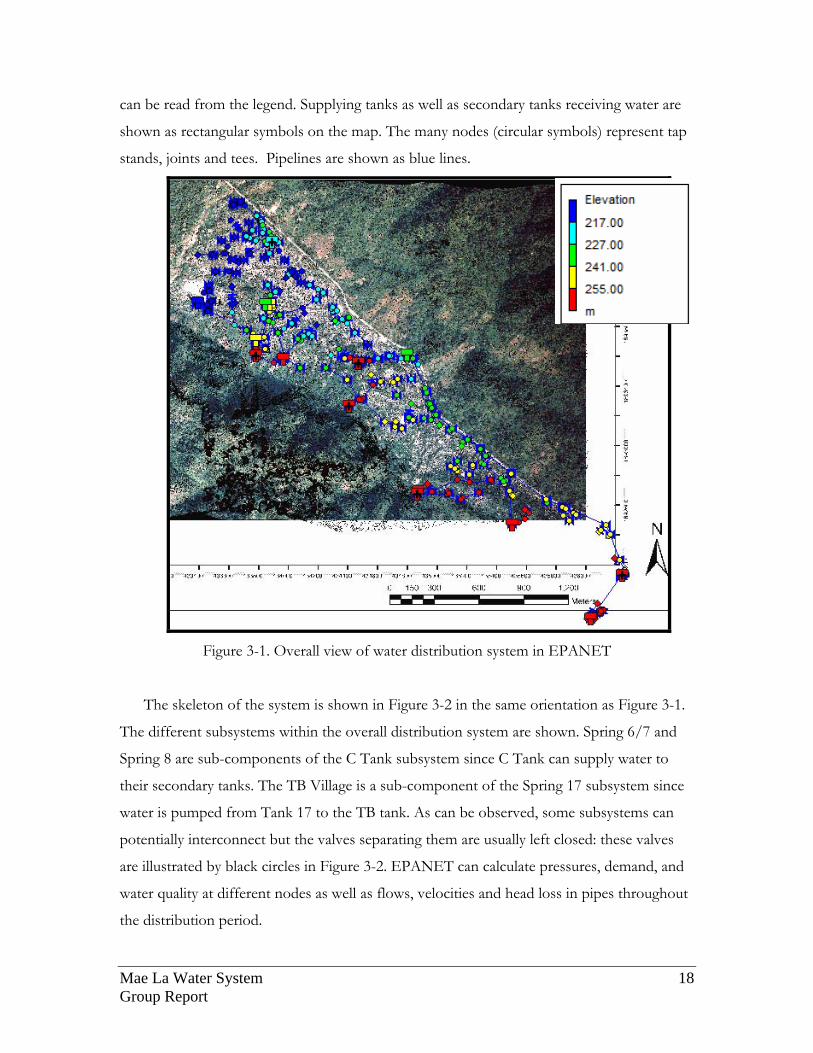
The skeleton of the system is shown in Figure 3-2 in the same orientation as Figure 3-1.
The different subsystems within the overall distribution system are shown. Spring 6/7 and
Spring 8 are sub-components of the C Tank subsystem since C Tank can supply water to
their secondary tanks. The TB Village is a sub-component of the Spring 17 subsystem since
water is pumped from Tank 17 to the TB tank. As can be observed, some subsystems can
potentially interconnect but the valves separating them are usually left closed: these valves
are illustrated by black circles in Figure 3-2. EPANET can calculate pressures, demand, and
water quality at different nodes as well as flows, velocities and head loss in pipes throughout
the distribution period.
Mae La Water System 19 Group Report
Figure 3-2. Skeleton of the water distribution system
Pressures, flows and salt concentrations were measured in the field in order to compare
them with the results of the distribution model. Pressure calibration revealed a coefficient of
determination (R2) of 0.36. The major source of error resides in the elevation of tap stands.
The GPS coordinates recorded have a horizontal (X-Y) accuracy of about 15 meters. This
magnitude of error translates, depending on the slope, to elevation errors from 3 to up to 15
meters when using the DEM. This is commensurate with the error recorded between
measured and calculated pressure results. In addition, this error in pressure was random
including over-estimates and under-estimates at all ranges, with no particular tendency by
subsystem, confirming that it is not an error in methodology. Since flow is directly related to
pressure, a similar level of error was recorded between calculated and measured flow rates
with an R2 value of 0.38.
Salt concentrations on the other hand do not directly depend on elevations: they are
predominantly a function of the mixing at storage tanks. The R2 between calculated and
measured results from the salt-tracer test is much higher than that for flow and pressure
calibration: it amounts to 0.82. Measured concentrations revealed that salt did not
completely mix in the storage tanks but short-circuited them to an extent. A two-
compartment mixing model was adopted to simulate such dynamics: it includes a bottom
MOI
C tank Sp 17
TB Village
A tank
B tank
Christopher
Sp 14
Sp 6/7
Sp 8
N

Mae La Water System 20 Group Report
compartment, the active compartment with inflow and outflow of salt, and a top “dead-
zone” compartment. It was found that a fraction of 12 percent for the active compartment
best reflects the reality of the system. Salt analysis also showed that dispersion of matter
throughout the system is not an important process. In addition, it was found that some of
the flows of the system did not follow the expected controls, and that some flow actually
does enter certain storage tanks during the distribution period.
3.3 Analysis of Distribution System The distribution system model was used to evaluate three alternative scenarios to
improve system performance. The objective of the first and second scenario is to increase
the flow rate at taps of low supply; the third scenario aims at adding taps to parts of the
camp without easy access to running water. The first scenario consists in opening the valves
shown in Figure 3-2 to connect subsystems. Figure 3-3 shows the evolution of flow
distribution between the original and modified system. Under the modified system, the
Spring 14 tank drains after an hour of distribution, and Figure 3-3 shows the flow
distribution both before and after drainage.
Figure 3-3. Numerical distribution of flow from opening system connecting valves
During the first hour of distribution after opening the valves (blue line in Figure 3-3), the
decrease in percentage of low-flow taps is significant in the 16 to 22 liters per minute range
by pushing 3 percent of them to higher flow rates. The bulk of the benefit however occurs
Mae La Water System 21 Group Report
for higher flow taps between 33 and 47 liters per minute by decreasing their numbers by 6
percent. The downfall of this scenario occurs after the Spring 14 tank drain, as illustrated by
the green line in Figure 3-3: there are 2 percent more taps with zero flow. Hence, this
scenario benefits taps of large supply more so than taps of low supply and then completely
drains parts of the water supply. This scenario is not recommended.
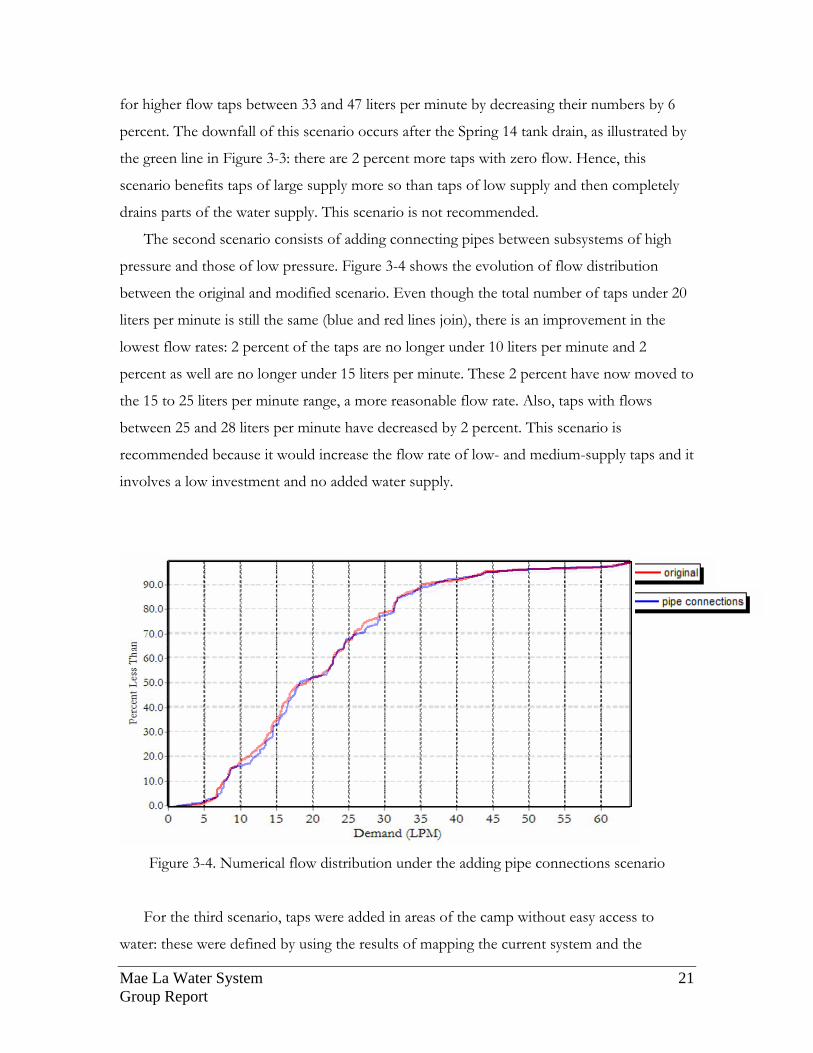
The second scenario consists of adding connecting pipes between subsystems of high
pressure and those of low pressure. Figure 3-4 shows the evolution of flow distribution
between the original and modified scenario. Even though the total number of taps under 20
liters per minute is still the same (blue and red lines join), there is an improvement in the
lowest flow rates: 2 percent of the taps are no longer under 10 liters per minute and 2
percent as well are no longer under 15 liters per minute. These 2 percent have now moved to
the 15 to 25 liters per minute range, a more reasonable flow rate. Also, taps with flows
between 25 and 28 liters per minute have decreased by 2 percent. This scenario is
recommended because it would increase the flow rate of low- and medium-supply taps and it
involves a low investment and no added water supply.
Figure 3-4. Numerical flow distribution under the adding pipe connections scenario
For the third scenario, taps were added in areas of the camp without easy access to
water: these were defined by using the results of mapping the current system and the

Mae La Water System 22 Group Report
population distribution by Harding (2008). Figure 3-5 shows the geographical evolution of
flow distribution between the original and modified scenario with the new taps illustrated by
white stars. It shows that reasonable flow rates can come out of all the new taps. Comparing
the original scenario against that with new tap stands, one can see that the latter covers a
larger geographical area of the camp: it has a denser southeastern distribution as well as
northwestern. Hence, these new taps were successful in providing water to these areas and
this scenario is recommended.
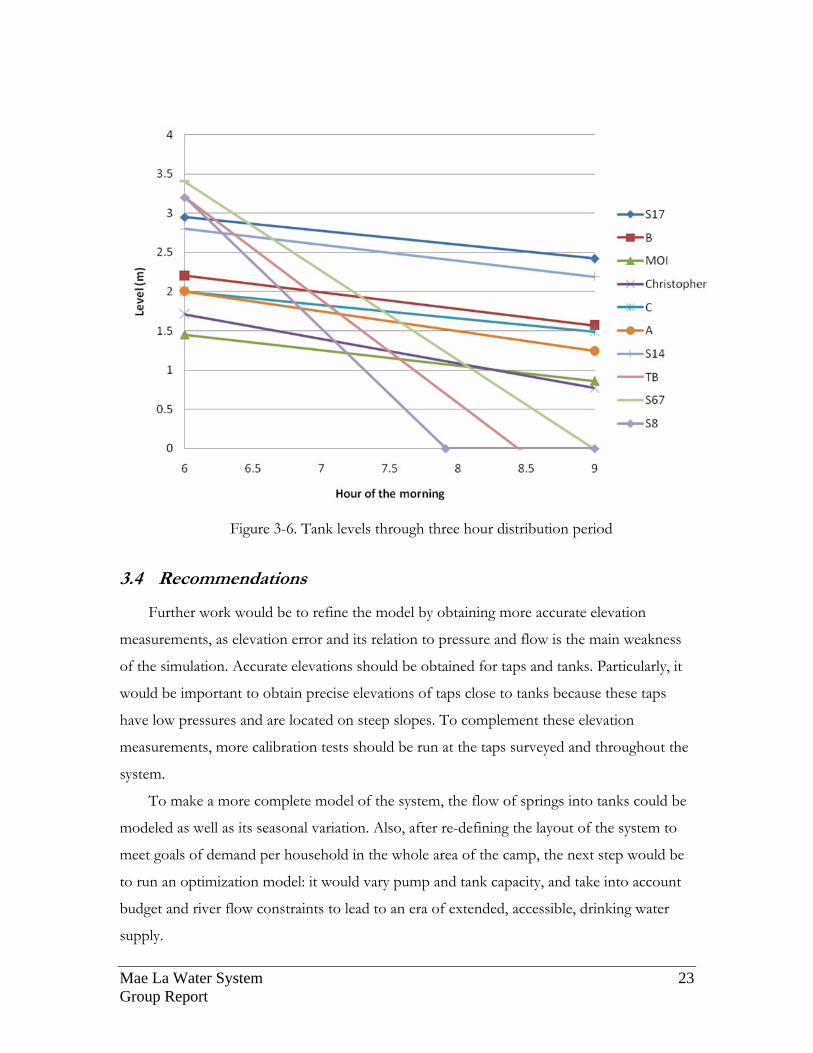
An additional recommendation for increasing the water supply in the camp was found
from analyzing tank levels during the distribution period. Figure 7 shows the evolution of
water level in storage tanks through a three-hour distribution period. The three tanks that
drain during the distribution period (Spring 6/7, Spring 8 and TB) only make up about 5
percent of the total volume of water supplied. Figure 3-6 shows that none of the major tanks
drain fully after 3 hours of distribution. The limiting tank with the most use of its capacity is
the Christopher Tank which drains about 53 percent of its volume. In order to make full use
of the capacity of tanks, a safe recommendation is to increase the period of water supply
from 3 hours to 4½ hours.
Figure 3-5. Geographical flow distribution from adding pipe connections
Original scenario
New tap stands
MOI
C tankSp 17
TB village
A tank
B tank
Christopher
Sp 14
Sp 6/7
Sp 8
N
Mae La Water System 23 Group Report
Figure 3-6. Tank levels through three hour distribution period
3.4 Recommendations
Further work would be to refine the model by obtaining more accurate elevation
measurements, as elevation error and its relation to pressure and flow is the main weakness
of the simulation. Accurate elevations should be obtained for taps and tanks. Particularly, it
would be important to obtain precise elevations of taps close to tanks because these taps
have low pressures and are located on steep slopes. To complement these elevation
measurements, more calibration tests should be run at the taps surveyed and throughout the
system.
To make a more complete model of the system, the flow of springs into tanks could be
modeled as well as its seasonal variation. Also, after re-defining the layout of the system to
meet goals of demand per household in the whole area of the camp, the next step would be
to run an optimization model: it would vary pump and tank capacity, and take into account
budget and river flow constraints to lead to an era of extended, accessible, drinking water
supply.
Mae La Water System 24 Group Report
4 GIS REPRESENTATION AND ASSESSMENT A geographic information system (GIS) is a useful tool to understand spatial
relationships and visualize problems in new ways. This work utilizes a GIS in coordination
with a computer model created by Navid Rahimi (2008) to better understand the condition
of water supply within Mae La camp, Thailand.
This assessment distinguishes between two main types of water access within the
camp: consumable water and hygienic water. Consumable water is disinfected with chlorine
and used for drinking and cooking, and hygienic water is used for bathing, laundry, hand and
dish washing. Consumable water is provided by public tap stands, while rope-pump wells,
hand-dug wells or surface water serve as the sources of hygienic water.
4.1 Data Collection and Analysis
Various data sources were needed to complete this work. Global Positioning System
(GPS) data of major water system infrastructure points were collected during a site-visit.
Location data for points not visited were received from Daniele Lantagne; 130 of the 152 tap
stands were visited during the site-visit. Additionally, Dr. Bunlur Emaruchi from the Faculty
of Civil Engineering of Mahidol University in Bangkok supplied a DEM which was received
during the site visit. Upon return to Cambridge, home location data were collected through
inspection of Google Earth images.
With respect to the inspection of home locations, since the highly populated areas,
such as in the northeast section of camp, have sparse vegetation cover, it is likely that more
homes were unidentified in the less populated areas. This may affect the results since the less
populated areas also tend to be further away from infrastructure points of interest such as
tap stands and rope pump wells. It is thus possible that the results are skewed so that a fewer
number of homes, both as a percentage and a raw number, are identified as being
undesirably far from water points.
4.2 Results
Through the analysis of home, tap stand, and rope-pump well locations along with
outputs from the EPANET model, the effectiveness of water access within Mae La camp is

Mae La Water System 25 Group Report
accessed. The work identifies homes and regions with inadequate service concerning one or
more of the following:
1. Located further than 115 meters to nearest tap stand
2. Located further than 180 meters to nearest rope-pump well
3. Availability of less than 50 liters per home per day
4.2.1 Tap Stand Proximity
It has been shown that the amount of time needed to collect water (round-trip)
correlates strongly with consumption, and when the return trip travel time to source water is
less than about three minutes, water consumption drastically increases (WELL, 1998).
This analysis assumes that each home gathers drinking water from the nearest public tap
stand. The range of comfortable walking pace considered was 75-85 meters per minute
(Bohannon, 1997). To be conservative speed of 75 meters per minute is used which equates
to a maximum allowable tap stand distance of 115 meters.
Figure 4-1 shows an overall view of the camp with homes represented by different
colors based on distance to the nearest viable tap stand. Tap stands are considered viable if
public drinking water is provided for collection. For example, public latrines and private taps
for NGOs are not included.
There are 349 of the 7,117 homes identified (less than 5%) located further than 115
meters from the nearest viable tap stand.
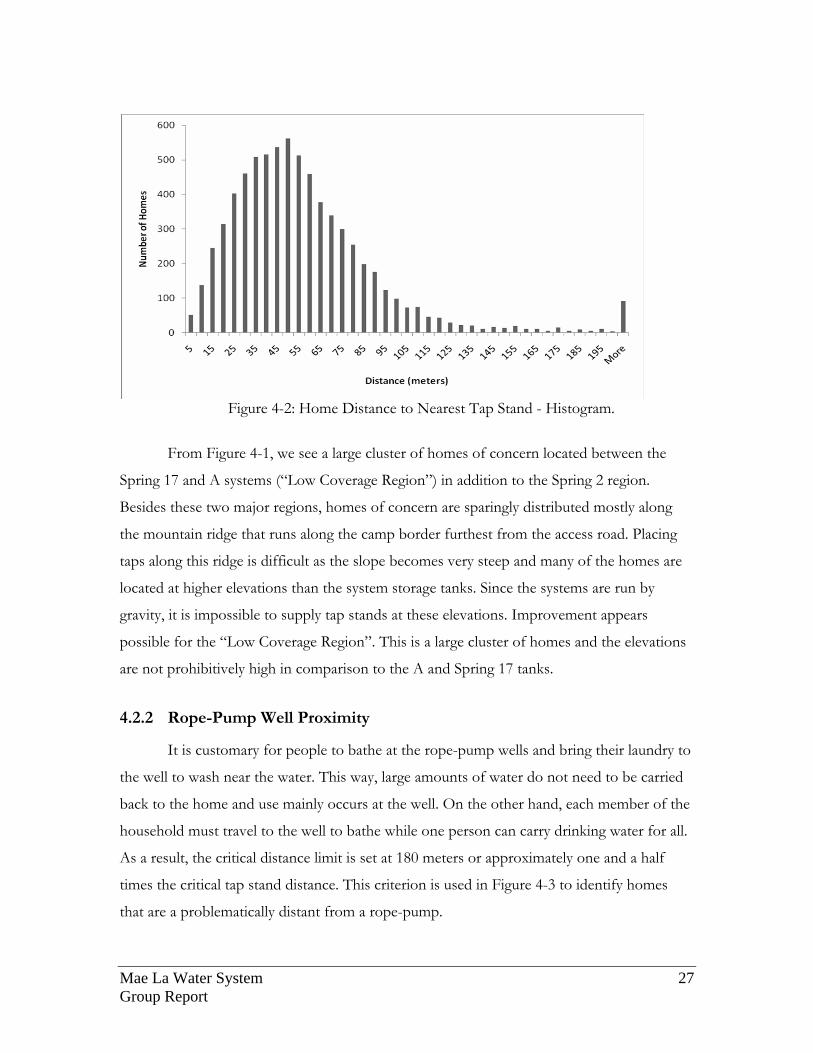
Figure 4-2, a histogram of the results, includes the Spring 2 homes. When these
homes, which are well supplied by natural springs, are not included, the number of homes
with tap stands located more than 200 meters away is reduced by 60% (Terville, personal
communication, January 2008). Fifty percent of homes are located between 30 and 60 meters
from a drinking water source.

Mae La Water System 26 Group Report
Distance (meters)
Tap Stands
Figure 4-1: Home Distance to Nearest Tap Stand.
N Low Coverage
Region
Spring 2 Region
Mae La Water System 27 Group Report
Figure 4-2: Home Distance to Nearest Tap Stand - Histogram.
From Figure 4-1, we see a large cluster of homes of concern located between the
Spring 17 and A systems (“Low Coverage Region”) in addition to the Spring 2 region.
Besides these two major regions, homes of concern are sparingly distributed mostly along
the mountain ridge that runs along the camp border furthest from the access road. Placing
taps along this ridge is difficult as the slope becomes very steep and many of the homes are
located at higher elevations than the system storage tanks. Since the systems are run by
gravity, it is impossible to supply tap stands at these elevations. Improvement appears
possible for the “Low Coverage Region”. This is a large cluster of homes and the elevations
are not prohibitively high in comparison to the A and Spring 17 tanks.
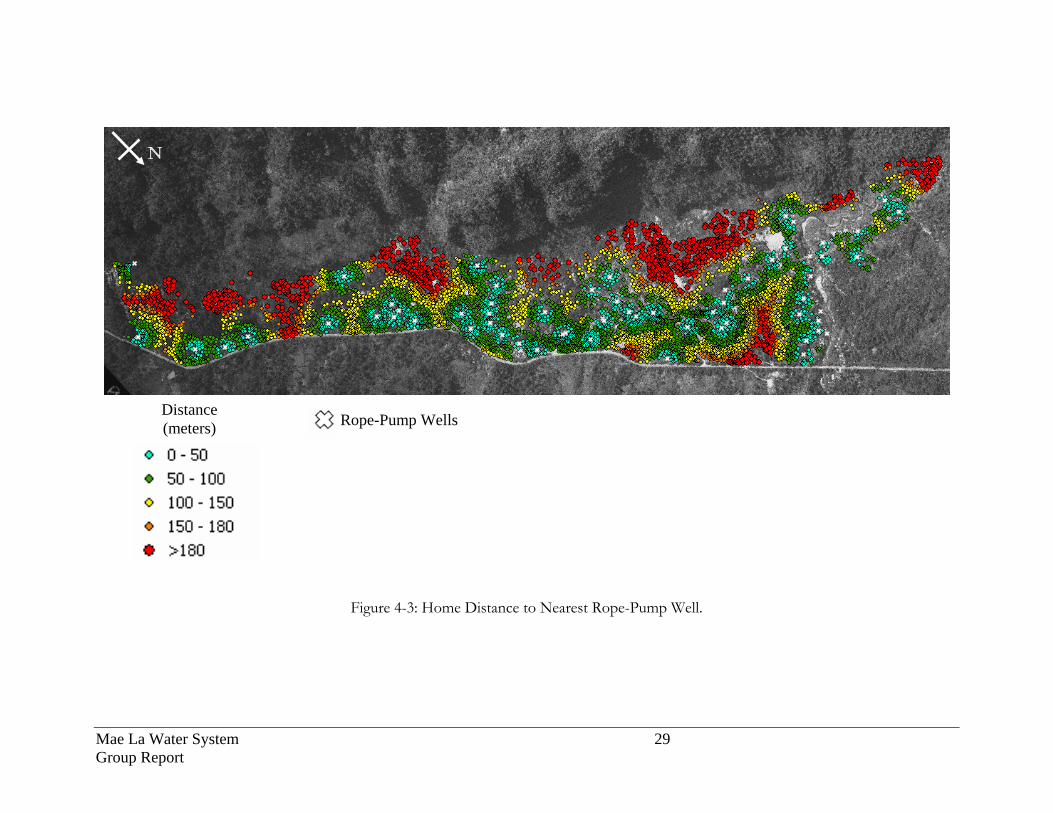
4.2.2 Rope-Pump Well Proximity
It is customary for people to bathe at the rope-pump wells and bring their laundry to
the well to wash near the water. This way, large amounts of water do not need to be carried
back to the home and use mainly occurs at the well. On the other hand, each member of the
household must travel to the well to bathe while one person can carry drinking water for all.
As a result, the critical distance limit is set at 180 meters or approximately one and a half
times the critical tap stand distance. This criterion is used in Figure 4-3 to identify homes
that are a problematically distant from a rope-pump.

Mae La Water System 28 Group Report
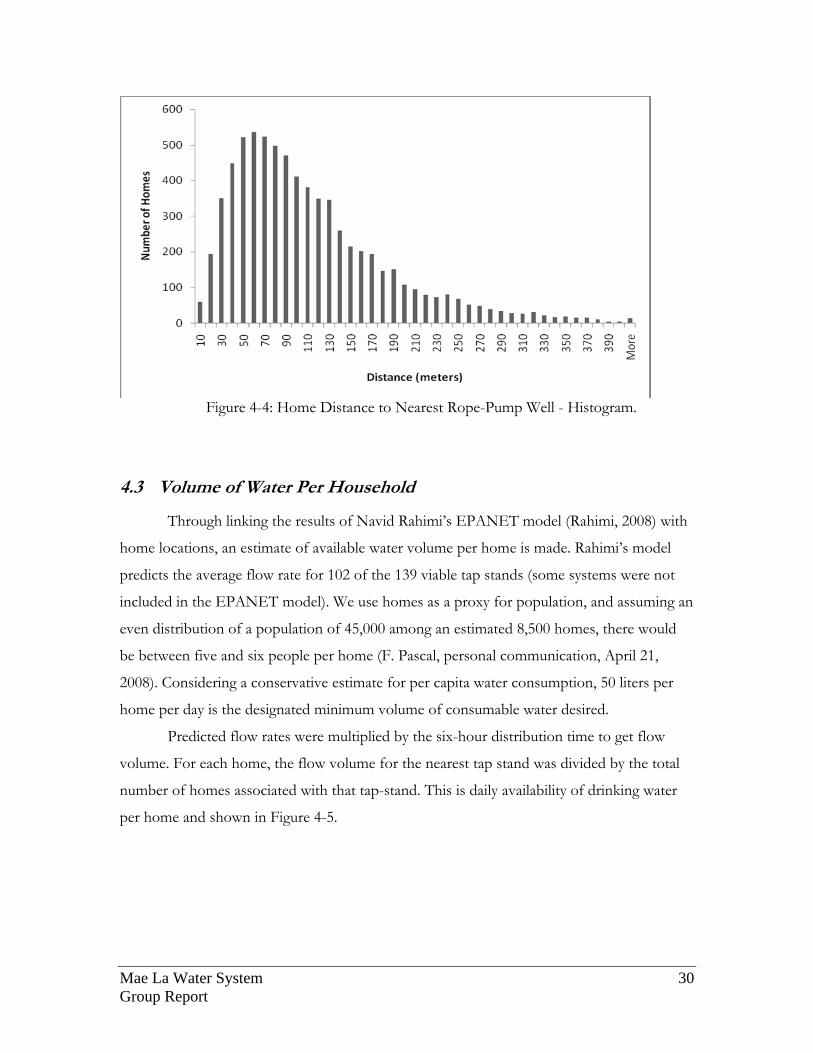
Under this criterion, just over 1000 homes, or 14%, are an unreasonable distance
from the nearest rope-pump well (Figure 4-4). Over one half of the homes have a rope-
pump well somewhere between 30 and 100 meters away. There are a much greater number
of homes located far from rope-pump wells compared to tap-stands, but this may not be
easily remedied and there are additional sources of washing water.
It is likely that drilling wells along the mountain ridge is not economically feasible
given the greater depth to the water table from the increased elevations. Since a rope-pump
well relies on the ability of the user to pull water from the water table to the surface, the
wells are ill suited for locations where this distance is large. Also, there is a stream that runs
west through the camp to the river in the northwest which can act as an alternative supply
for some areas.
Mae La Water System 29 Group Report
Distance (meters) Rope-Pump Wells
Figure 4-3: Home Distance to Nearest Rope-Pump Well.
N
Mae La Water System 30 Group Report
Figure 4-4: Home Distance to Nearest Rope-Pump Well - Histogram.
4.3 Volume of Water Per Household
Through linking the results of Navid Rahimi’s EPANET model (Rahimi, 2008) with
home locations, an estimate of available water volume per home is made. Rahimi’s model
predicts the average flow rate for 102 of the 139 viable tap stands (some systems were not
included in the EPANET model). We use homes as a proxy for population, and assuming an
even distribution of a population of 45,000 among an estimated 8,500 homes, there would
be between five and six people per home (F. Pascal, personal communication, April 21,
2008). Considering a conservative estimate for per capita water consumption, 50 liters per
home per day is the designated minimum volume of consumable water desired.
Predicted flow rates were multiplied by the six-hour distribution time to get flow
volume. For each home, the flow volume for the nearest tap stand was divided by the total
number of homes associated with that tap-stand. This is daily availability of drinking water
per home and shown in Figure 4-5.

Mae La Water System 31 Group Report
Water Available per Home (liters/day)
Viable Tap Stands
Figure 4-5: Daily Home Water Availability.
N

Mae La Water System 32 Group Report
The homes of concern, shown in red and orange, are scattered throughout the camp.
There is no single subsystem within the overall network where flow is low and no
geographic similarities between the homes of concern, such as being located along the steep
mountain ridge. Homes for which the closest viable tap stand was not included in the
EPANET model are shown in black.
Figure 4-6: Water Volume Distribution - Histogram.
A total of 809 homes, or 15% of those considered, are categorized as unable to
obtain 50 liters of water per day (Figure 4-6). By tracing these underserviced homes back to
the originating taps, we find that there are 15 tap stands of concern.
There is definitely error in the model results because the model predicts flow rates of
zero liters per minute at nine of the tap stands. Flow was observed at these tap stands during
the site visit, however. It is most likely that these errors are related to the elevation assigned
to the tap stands based on the GPS location. As discussed by Harding (2008, Section 4.3),
the GPS location error can create significant error in elevation. Since the model is driven in
large part by these elevation differences, the model results are sensitive to these errors
(Rahimi, 2008). Excluding the nine tap stands with zero flow, 365 homes, or 7%, are unable
to collect sufficient water volume.

Mae La Water System 33 Group Report
4.4 Conclusion and Recommendations
Overall this research shows that the vast majority of residents in Mae La have
sufficient access to water. A water use survey is recommended in order to verify the findings
of this research and modify the GIS tool for future work. The assumptions that every home
utilizes the rope-pump well or tap stand that is of closest proximity may or may not be valid.
A major area of concern, especially regarding the EPANET model results, is in attaining
accurate locations and especially elevations of tap stands and water infrastructure points
within the camp.
4.4.1 Overall Water Access
This research used GIS to assess three major indicators —home distance to tap
stands, home distance to rope-pump wells, and volume of drinking water per home—with
results summarized in Table 4-1. The overall results show that the access issue of least
concern is proximity to public tap stands.
Table 4-1: Summary of Homes with Inadequate Access.
Homes with Far Taps* 349 (5% of 7,117) Homes with Far Rope-Pump Wells 1,017 (14% of 7,117) Homes with Low Volume 809 (15% of 5,500) *Reduces to 210 (3%) when not including Spring 2 region
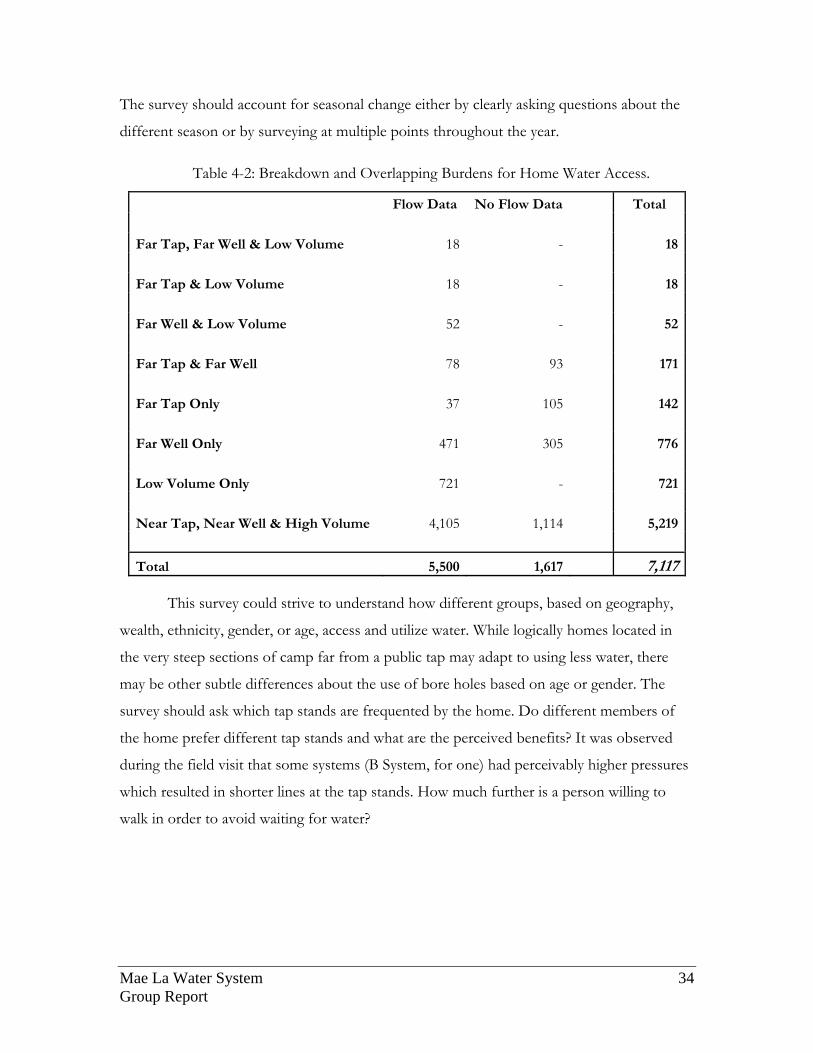
There are homes which fail more than one test, however. Table 4-2 shows a
breakdown of the results considering that some homes will have multiple problems. Of
homes identified, 73% are adequately serviced. Roughly one fifth of these homes are located
nearest to tap stands not included in the EPANET model and therefore the volume test was
not completed.
4.4.2 Potential Improvements
There are a variety of concerns regarding these results and what service is actually
provided in the camp. The proximity to the nearest rope-pump well may not relate directly
to water use since there are additional sources for non-drinking water such as bore holes and
surface water. A water use survey that gathers information from a variety of homes dispersed
throughout the camp would help better understand the extent of these alternative sources.
Mae La Water System 34 Group Report
The survey should account for seasonal change either by clearly asking questions about the
different season or by surveying at multiple points throughout the year.
Table 4-2: Breakdown and Overlapping Burdens for Home Water Access.
Flow Data No Flow Data Total
Far Tap, Far Well & Low Volume 18 - 18 Far Tap & Low Volume 18 - 18 Far Well & Low Volume 52 - 52 Far Tap & Far Well 78 93 171 Far Tap Only 37 105 142 Far Well Only 471 305 776 Low Volume Only 721 - 721 Near Tap, Near Well & High Volume 4,105 1,114 5,219 Total 5,500 1,617 7,117
This survey could strive to understand how different groups, based on geography,
wealth, ethnicity, gender, or age, access and utilize water. While logically homes located in
the very steep sections of camp far from a public tap may adapt to using less water, there
may be other subtle differences about the use of bore holes based on age or gender. The
survey should ask which tap stands are frequented by the home. Do different members of
the home prefer different tap stands and what are the perceived benefits? It was observed
during the field visit that some systems (B System, for one) had perceivably higher pressures
which resulted in shorter lines at the tap stands. How much further is a person willing to
walk in order to avoid waiting for water?
Mae La Water System 35 Group Report
5 RECOMMENDATIONS FOR SPRING WATER QUALITY IMPROVEMENT
Spring water is an important water source for Mae La. It accounted for an average
of 50% of the water supply in 2007 and climbed to 80% of the water supply during the rainy
season. The spring water in Mae La presents several water quality issues because of the
number of springs and the annual water quality cycle. This chapter describes the design
recommendations for spring water treatment based on the work of Vater (2008). Her work
contains detailed theoretical background of horizontal-flow roughing filtration.
5.1 Design Parameters Water treatment design is based on influent water quality and treatment objectives.
Based on the existing information about spring water quality in Mae La, four main design
parameters have been identified. Of these, turbidity is especially important because the
effectiveness of disinfection by chlorination is lowered at higher turbidity (AWWA, 2003;
Wegelin et al., 1991). Water from the largest volume springs is chlorinated before release
into the distribution system. The bacterial load of the water is the second important
parameter because of the potential for disease-causing organisms in the water supply,
particularly in the sources that are not chlorinated. The last two design parameters have to
do with the size and location of the spring, both of which are unique to Mae La due to
seasonal flow variation and steep land slopes.
5.2 Pre-treatment As described above, the main goals of treatment are to remove turbidity and
bacteriological contamination and to normalize the quality throughout the year. Due to the
range of turbidity seen in Table 2-1 and Figure 2-5, some sort of pre-treatment is
recommended (Okun and Schulz, 1984). Wagner and Lanoix (1959) write that the simplest
technologies are the best because of low maintenance requirements. This is particularly
important in Mae La, where the availability and turnover in maintenance staff predicates low
maintenance.
Pre-treatment options include several low-technology processes that improve water
quality without significant labor or mechanical investment (Wagner and Lanoix, 1959). The

Mae La Water System 36 Group Report
influent water quality and quantity dictate the type of pre-treatment. Horizontal-flow
roughing filtration is the selected pre-treatment technology for use in Mae La. Other
treatment technologies are outlined by Vater (2008).
5.3 Field Work Information on the condition of the existing spring collection and treatment
infrastructure was gathered on a site visit to Mae La Temporary Shelter in January 2008.
Water turbidity at Spring 10 (SP-10) was measured several times at various locations. Flow
rate tests were conducted at the SP-10 filter.
5.3.1 Turbidity Sampling Turbidity was used to demonstrate the effectiveness of various roughing filters along
the pipe that runs from SP-10 Box A to SP-10 storage tanks. There are two rock vertical-
flow roughing filters (VFRFs) which precede the main SP-10 horizontal-flow roughing filter
(HFRF). The small VFRFs have larger-diameter filter material than the HFRF.
The short length and large media in Box A and the VFRF predict that neither is
effective at removing turbidity from the water. Turbidity was sampled twice at multiple
points along the collection pipe. The first set of data was taken before the HFRF was
cleaned, while the second set was collected after cleaning. Both sets are under natural
environmental conditions for January, which falls in the dry season. Stream 1 and Stream 2
are two sample points in the SP-10. Data are available from Vater (2008).
The turbidity in the stream and collection basin is between 30 and 40 NTU, with one
spike to above 70 NTU. From Box A through the HFRF inflow, the turbidity is again
between 30 and 40 NTU, but usually nearer to 30 NTU. The HFRF is the only treatment
process that removes a significant amount of turbidity. In one case, when the filter was not
cleaned and had not been modified, more than 50% removal was achieved. In another case,
when the filter had been cleaned and the baffles added, more than 85% removal was
achieved.
Two conclusions can be drawn from these results. First, neither Box A nor the
VFRF is treating the water. The treatment is all achieved in the HFRF. Second, the clean,
modified filter is more effective than the dirty, unaltered HFRF.
Mae La Water System 37 Group Report
5.3.2 Filter Flow Tests The SP-10 roughing filter consists of three compartments each with the same filter
material. Upon first inspection, the free surface of the water was above the filter media in
the first and third compartments. The filter media in the second compartment had a layer of
sediment on top of it. The construction of the filter, without inlet or outlet weirs, suggested
that short circuiting could be occurring. Figure 5-1 shows the plan layout of the filter,
including the walls separating the three compartments. These walls are made of offset
cement blocks. The theoretical flow path is shown with dashed arrows. Potential short
circuits are shown by the arrows. The inflow is a pipe through which water free-falls onto
the filter media and the outflow is a vertical pipe which is perforated over depth. To
determine the residence time of the filter under different conditions, three tracer flow tests
were conducted under varying filter and influent water conditions. The first test was
completed before the filter was cleaned or modified. The next two tests were completed
after the filter was cleaned and the baffles were added.
The filter was cleaned during the second week of field work. In addition, gravel was
added to the first and third compartments so all the water now flows below the surface of
the medium. While the gravel was removed from the filter, two baffles were added in order
to direct flow through the entire filter volume. Each baffle consisted of a plastic sheet placed
over a portion of the cinder-block interior wall. The layout of these baffles is shown in
Figure 5-2.
The results of the tracer tests are divided into two sections, one for the two tests run
with dry season turbidity and the other for the test run with simulated-rainy season turbidity.
The results demonstrate that the baffles increased the residence time of water in the filter by
approximately three times and that the clean HFRF is capable of greatly reducing even high
turbidity loads.

Mae La Water System 38 Group Report
Figure 5-1: Spring-10 Roughing Filter Flow Paths. Theoretical paths are shown with dotted-line arrows and
potential short-circuiting paths are shown with solid-line arrows.
Figure 5-2: Plan View of Spring-10 Roughing Filter Flow Path with Baffles. Baffles are shown in bold and coincide with the compartment walls.
5.3.2.1 Dry Season Load The mean residence time of the tracer in the first test was about 30 minutes. This
test established a background to which the post-baffle installation tracer test could be
compared. Although the exact relationship between the flow velocity of the tracer and the
INFLOW
OUTFLOW
INFLOW
OUTFLOW

Mae La Water System 39 Group Report
0
10
20
30
40
50
60
70
80
90
100
110
0 20 40 60 80 100 120 140 160
Time [minutes]
Salin
ity [p
pm]
Dry Season - No Baffles Dry Season - Baffles
water is not known, such a low tracer residence time likely indicates short-circuiting of the
filter. This means that the treatment potential of the filter was not maximized.
The second test results showed the residence time of the tracer to be about 95
minutes. This test was conducted after the baffles were installed, demonstrating that this
simple installation increased the functionality of the HFRF. The relative residence time of
water in the filter increased three times after installation of the baffles. Figure 5-3 shows the
data for both the tests. The residence time for the tracer found in these studies is not the
residence time of the filter because of the density difference between the tracer and the
water. The tracer residence time is about 20 minutes longer than the theoretical residence
time of water in the filter.
Figure 5-3: Dry season flow test results. Time shown is for the tracer.
In conclusion, for these two flow tests under similar influent flow volume and water
quality, the baffles increase residence time and produce a higher quality effluent. The
turbidity in the first case was reduced 53% from 30 NTU to 14 NTU. After adding the
baffles the reduction was 86% from 38 NTU to 6 NTU. Part of this improvement can be

Mae La Water System 40 Group Report
attributed to cleaning the gravel. The clean HFRF with baffles can achieve the treatment
goals for SP-10 turbidity during the dry season.
5.3.2.2 Rainy Season Load The order to better understand the performance of the HFRF during rainy season
turbidity levels, which range from 200 to 400 NTU, high turbidity water was sent through
the SP-10 HFRF. The water was agitated at the collection basin, raising the turbidity to
between 100 and 500 NTU, or three to 15 times the dry season average turbidity of 30 to 40
NTU.
The HFRF removed over 90% of the turbidity over the duration of this test. Even
still, because the influent turbidity was so high, effluent turbidity was 20 to 30 NTU. This is
above the treatment goal of the HFRF. The SP-10 treatment processes, including the
HFRF, could be modified so that even during the high turbidities of the rainy season the
goal of water with 10 NTU or less can be met.
During this high turbidity test another tracer test was also conducted. It resulted in a
tracer residence time of about 90 min. This result is similar to the result of the other test run
after the baffles were installed.
5.3.3 Results Based on the SP-10 Filter-specific filter coefficients summarized by Vater (2008), it
is possible to predict performance of a horizontal-flow roughing filter design for SP-10. If
the existing filter is lengthened, or a second filter is built, filter performance will improve.
The existing filter is 12 meters in length. Only under the Dry Season, Clean Filter
coefficient condition, an effluent turbidity of less than 10 NTU is achieved. Notably, when
the filter length is 24 m all the flow scenarios except Wet Season, Dirty Filter, predict an
effluent turbidity of less than 10 NTU. Not until the filter is 38 m long, more than three
times the length of the existing filter, do all four flow conditions achieve below 10 NTU
effluent values. The Wet Season, Dirty Filter coefficient is also a liberal estimate and so it
could take an even longer filter to achieve the desired treatment.
Ideally the Wet Season, Dirty Filter flow condition would not occur. This means
that a filter of double the existing length should achieve the desired effluent turbidity level
during the remaining possible conditions. The main limitations on a long filter are
Mae La Water System 41 Group Report
construction and maintenance costs and land availability. At the site of the existing SP- 10
Filter, there is not enough land area to triple the filter length. There is enough space to
double the filter size.
5.4 Recommendations Vater (2008) recommends treatment technologies that are easily implemented and
operated to improve Mae La spring water quality. First, modifications, including
maintenance, to the SP-10 filter that will improve its performance are addressed. Second,
the application of a general filter design for the other twelve springs is discussed.
Information about the spring water quality and treatment was gained through the
analysis of turbidity and flow volume from 2007 and field study of the SP-10 horizontal-flow
roughing filter (HFRF). The combination of an additional filter and improvements to the
existing filter will meet the treatment demands of the system, particularly that which is a
problem at present—high turbidity during the rainy season.
5.4.1 SP-10 Box A and VFRF Based on the turbidity measurements taken along the water-collection structures of
SP-10, both the VFRF rock filters preceding the HFRF were shown to be ineffective. Based
on this information the VFRF was removed and the rocks in Box A were replaced with 2-4
cm gravel. The effectiveness of such a short, 1 m, HFRF in Box A is unknown, but the use
of gravel instead of large rocks should at least reduce the velocity of flow through Box A,
preventing re-suspension of solids from the bottom of the box.
5.4.2 SP-10 Filter Modifications The existing HFRF filter has neither an inlet weir, an inflow distribution chamber, an
outflow collection chamber, nor an outlet weir. Weirs are used in HFRFs for maintaining
constant water volumes within the filter by only allowing inflow and outflow from above the
top of the filter media. Chambers located at the inlet and outlet distribute and collect,
respectively, the flow over the depth of the filter (Wegelin et al., 1991).
Since the saline tracer was not passive, it cannot be used to determine vertical
distribution of flow at the inflow pipe. The tracer studies and baffle addition did show that
there was horizontal short-circuiting in the filter which was corrected by the baffle
Mae La Water System 42 Group Report
installation. The installation of a perforated pipe to distribute the flow vertically at the inlet
is recommended. The pipe should be of 3-inch or 4-inch diameter and perforated every 0.5
to 1-inch. It should be installed at the inflow of the filter where the influent water will flow
into it. This is a simple improvement that will improve vertical distribution of the influent
water.
The combination of an outflow collection chamber and an outlet pipe located at the
top of the filter can be used to collect water over the depth of the filter and maintain a
constant volumetric flow through the filter (Wegelin et al., 1991). The existing outlet pipe in
the SP-10 filter is a vertical-slotted pipe with an outflow at the bottom of the filter. This
construction does not hold a constant volume of water in the filter, allowing water to exit
the filter more quickly than the theoretical residence time of the filter. In order to achieve
maximum filter performance, water should remain in the filter for as close to the theoretical
residence time as possible.
If, instead, the effluent water was collected at the top of the filter, then the flow
velocity through the tank would be regulated and a constant volume of water would be held
in the filter. This can be achieved by using an existing pipe located at the top of the filter
and by collecting the water over the depth of the filter in a collection chamber. The
construction of the chamber will require a slight reduction in the length of the filter, but will
allow water to flow easily into the existing outflow pipe. To make the chamber, a slotted
wall should be constructed 0.25 m away from the existing wall which contains the effluent
pipes. The wall would be built with off-set concrete blocks in the same construction style as
the internal walls of the filter. Design drawings can be seen in Vater (2008).
The filter already has an outflow pipe near the top of the filter. This outflow pipe
would need to be connected on the outside of the filter to the existing pipe which flows to
the SP-10 ring tanks. The new pipe connection should be the same diameter as the existing
outflow pipe so that there is no loss of head as the water enters the pipe to the SP-10 ring
tanks.
5.4.3 Second equivalent filter The second recommendation in order to meet the treatment goals of the system is to
build a second filter at SP-10 which is equivalent to the first, including the modifications
discussed above. Doubling the filter length to 24 m means the treatment goal of less than

Mae La Water System 43 Group Report
ten NTU in the effluent water is achieved in three of the four flow scenarios. The only flow
scenario in which it is not achieved is the Wet Season, Dirty Filter scenario. Ideally this
condition will not occur with proper filter maintenance.
The second filter should be operated in parallel with the existing filter. This means
the influent pipe should split and half the flow should travel to the first filter and the other
half should travel to the second filter. A valve should be installed in each pipe just
downstream of the point in the pipe where the flow is divided in order for all the flow to be
diverted to one of the filters if necessary. The construction of outflow collection chambers
in both of the filters will ensure that the flow entering either filter is treated for the same
amount of time.
5.4.4 Maintenance In order to keep the new and existing HFRFs operating so they meet the treatment
goal, both filters need to be maintained. The first step to maintaining the filters is daily or
weekly monitoring of influent and effluent turbidity levels in order to determine the
efficiency of the filter. To collect useful turbidity information, a regularly calibrated
electronic nephelometer should be used. The LaMotte turbidimeter currently owned by
AMI would be effective if regularly calibrated. In addition the staff members that are using
the turbidimeter should be trained to use it and collect accurate data.
Second, the filters will need to be cleaned when the effluent water quality is not
meeting the treatment goals. A benefit of the two parallel filters is that one filter can easily
be taken off-line for cleaning by closing the valve in the inflow pipe. In addition, during
lower volumes of flow during the dry season, it may be possible to only operate one of the
filters, thus reducing the labor demand of cleaning the filters. Another benefit of having two
filters is that the total amount of solids collected will be distributed over two filters instead
of one, thus theoretically increasing the amount of time between cleanings.
Currently the filters are cleaned manually. Mechanical cleaning of HFRF is an
option which would reduce the need for labor and reduce the amount of time the filter is
offline. In order to effectively remove solids from the filter, turbulent flows of 0.5-1.5
meters per minute are needed. Wegelin (1996) writes the ideal flushing flow would be 1.0-
Mae La Water System 44 Group Report
1.5 m min-1. Taking 1.0 m min-1 as the flushing flow goal, the volume of water that needs to
be flushed is 18 m3 min-1.
The water will flow through these pipes at 4 m s-1. From the flush rate and the
velocity of water through the drainage pipes, the area of pipes is calculated as five times the
present area. Five three-inch pipes need to be added to each compartment to achieve this.
With six three-inch drainage pipes per compartment, the flushing velocity of 1.0 m min-1 is
achieved. The amount of time it will take for the filter to drain under these conditions is 45
seconds.
The drainage velocity assumes that the height of water in the filter remains constant
over the flushing. Since the flushing volume is the same as the volume of the filter, 15 m3, it
will be necessary to replace this volume at the same rate at which water exits the filter in
order to maintain the same head over the duration of flushing. First, this means that this
volume of water must be available. AMI is planning on constructing storage tanks for this
purpose along the SP-10 collection pipeline, at the location of the VFRF. Second, this
volume of water must be able to reach the HFRF at the same rate that water is being flushed
out.
In order to achieve this flow rate the head in these tanks needs to be maintained as
well. This requires storing two times the necessary volume or 30 m3. This can be achieved
in 12 eight-ring tanks made with one-meter diameter rings. The ring tanks should be
constructed in two rows of six. Six of the tanks will have two three-inch pipes which
connect to the HFRF. The other six tanks, placed behind the first row, will each have two
three-inch pipes which connect to one tank in the first row.
This flushing system is a significant investment of capital. It will require the addition
of twelve ring tanks and the pipes necessary to connect the tanks to the HFRF. If AMI
chooses to construct this system, I recommend they make the pipe connections between the
storage tanks and the HFRF temporary. This will require that the pipes are reconnected for
each flushing, but this should only be one day in every two to four months. During the
months they are not in use they can be locked at A Tank or the Mae La 2 Office. Detaching
these pipes will require labor to set up on the day of the flushing, but since the flushing will
take less than one minute, the entire process should only require the services of day laborers
for one day. This is in contrast to the current manual medium regeneration method which
requires multiple day laborers working for five days. It should be reiterated that manual
Mae La Water System 45 Group Report
medium regeneration is an effective means of cleaning the HFRF and is as recommendable
as mechanical regeneration.
5.4.5 General filter design One purpose of this work was to provide a general filter design that can be
constructed at the twelve springs currently without filters. Review of the turbidity levels
collected weekly in 2007 shows than no spring other than SP-10 has elevated turbidity
throughout the rainy season.
The springs which had a monthly average turbidity over 10 NTU are SP-2, SP-8, and
SP-10. SP-2 and SP-8 had only one month with an average exceedance, while SP-10
exceeded 10 NTU every month. In addition to these springs, SP-7 and SP-12 each had at
least one weekly exceedance of 10 NTU, but these did not result in monthly averages more
than 10 NTU. Since only SP-10 has consistently elevated turbidity, it is not recommendable
to construct a roughing filter at any of the other twelve springs. These data are shown in
Table 2-1.
Mae La Water System 46 Group Report
REFERENCES AMI. 2007. “Mae La Distribution Data.” Aide Médicale Internationale. Unpublished
distribution data. Thailand: Aide Médicale Internationale. AWWA. 2003. Water Quality. American Water Works Association. Denver, CO, USA:
AWWA. Bohannon, R. 1997. “Comfortable and maximum walking speed of adults aged 20-79 years:
reference values and determinants.” Oxford University Press. Age Ageing. 26:1:15. ESS. 2002. “Macro-scale, Multi-temporal Land Cover Assessment and Monitoring of
Thailand.” Environmental Software and Services. Online. Retrieved October 12, 2007, from http://www.ess.co.at/GAIA/CASES/TAI/chp1to3.html
GOSIC. 2007. “Global Historic Climatology Network Daily – Mae Sot, Thailand.” Global
Observing Systems Information Center. Online. Retrieved November 26, 2007, from http://gosic.org/gcos/GSN/gsndatamatrix.htm
Google. 2007. “Google maps – Mae Sot, Tak, Thailand.” Online. Retrieved October 12,
2007, from http://maps.google.com Google Earth. 2007. “Mae Sot, Tak, Thailand.” Google Earth. Computer Software. Online.
Available at http://earth.google.com Harding, M. 2008. “GIS Representation and Assessment of Water Distribution System for
Mae La Temporary Shelter, Thailand” Master of Engineering Thesis, Massachusetts Institute of Technology, Cambridge, MA, USA.
Lantagne, D. 2007. Water and Sanitation Assessment to Inform Case-Control Study of Cholera
Outbreak in Mae La Refugee Camp, Thailand. Unpublished presentation. Centers for Disease Control and Prevention, Atlanta, USA.
Lumjuan, A. 1982. Geological Map of Thailand. Bangkok, Thailand: Geological Survey
Division, Thailand Department of Mineral Resources. “Map of the Mekong River Subregion.” 2006. Map of Thailand – Maps for Thailand
Travel. Online. Accessed 18 October 2007. http://www.maps-thailand.com/map-mekong-subregion.php
Okun, D. and C. Schulz. 1984. Surface Water Treatment for Communities in Developing Countries.
Great Britain: John Wiley and Sons. Rahimi, N. 2008. “Modeling and Mapping of MaeLa Refugee Camp Water Supply.”
Master of Engineering Thesis, Massachusetts Institute of Technology, Cambridge, MA, USA.
Mae La Water System 47 Group Report
Rossman, L.A. (2000). EPANET2 USERS MANUAL. Report No. EPA/600/R-00/057.
Cincinnati, OH, USA: National Risk Management Research Laboratory. Available at: http://www.epa.gov/nrmrl/wswrd/dw/epanet.html
Sawyer, C., P. McCarty, and G. Parkin. 2003. Chemistry for Environmental Engineering and
Science. (5th ed). USA: McGraw-Hill. TBBC. No Date. “Mae Sot area.” Thailand Burma Border Consortium. Online. Retrieved
December 5, 2007, from http://www.tbbc.org/camps/mst.htm
UNHCR. 2003. “Ensuring clean water and sanitation for refugees.” United Nations High Commissioner on Refugees. Online. Retrieved December 5, 2007, from http://www.unhcr.org/cgi-bin/texis/vtx/partners/opendoc.pdf?tbl=PARTNERS&id=3fcb5a3b1
UNHCR. 2007. “Resettlement of Myanmar refugees under way from northern Thai camp.”
United Nations High Commissioner on Refugees. May 27, 2007. Online. Retrieved December 5, 2007, from http://www.unhcr.org/news/NEWS/465430f04.html
UNICEF & WHO. 2004. “Meeting the MDG drinking water and sanitation target: A mid-
term assessment of progress.” United Nations Children’s Fund and World Health Organization. Online. Retrieved December 5, 2007, from http://www.who.int/water_sanitation_health/monitoring/jmp2004/en/
UN Thailand. 2006. “Thailand Info.” Online. Retrieved October 12, 2007, from
http://www.un.or.th/thailand/geography.html Vater, K. 2008. “Appropriate Technology Water Treatment Processes for Mae La
Temporary Shelter, Thailand.” Master of Engineering Thesis, Massachusetts Institute of Technology, Cambridge, MA, USA.
Wagner, E. and Lanoix, J. 1959. Water Supply for Rural Areas and Small Communities.
Switzerland: World Health Organization. Wegelin, M. 1996. “Surface Water Treatment by Roughing Filters - A Design, Construction
and Operation Manual.” SANDEC Report No. 2/96. Dübendorf, Switzerland: SANDEC and EAWAG. Online. Retrieved January 7, 2008, from http://www.eawag.ch/organisation/abteilungen/sandec/schwerpunkte/ws/documents/surface_water_treatment
Wegelin, M., R. Schertenleib, and M. Boller. 1991. “The decade of roughing filters—
development of a rural water-treatment process for developing countries.” Journal of Water SRT. 40(5): 304-316.
WELL. 1998. Guidance manual on water supply and sanitation programmes. Water and
Environmental Health at London and Loughborough. WEDC, Loughborough, UK.