water reuse technology demonstration project - King County
73
WATER REUSE TECHNOLOGY DEMONSTRATION PROJECT Demonstration Facility Pilot Study Reverse Osmosis Membrane Advanced Treatment Application Final Draft Report June 2002 By HDR Engineering, Inc. BLACK & VEATCH Department of Natural Resources and Parks Wastewater Treatment Division Technology Assessment Program
Transcript of water reuse technology demonstration project - King County

WATER REUSE TECHNOLOGYDEMONSTRATION PROJECT
Demonstration Facility Pilot StudyReverse Osmosis Membrane
Advanced Treatment ApplicationFinal Draft Report
June 2002
By
HDR Engineering, Inc.
BLACK & VEATCH
Department of Natural Resources and ParksWastewater Treatment DivisionTechnology Assessment Program

King County Department of Natural Resources and Parks
June 2002 i King County Water Reuse Demonstration ProjectReverse Osmosis Report (Final Report)
ContentsExecutive Summary.................................................................................................................... 1
TDS Removal ....................................................................................................................................... 1Turbidity Removal................................................................................................................................. 2TOC Removal....................................................................................................................................... 2TP Removal.......................................................................................................................................... 2Long-Term Flux Decline ....................................................................................................................... 2
Introduction ................................................................................................................................. 3Description of the Technology .................................................................................................. 3
Full-Scale Facilities................................................................................................................................... 5
Pilot Testing ................................................................................................................................ 5Goals and Objectives................................................................................................................................ 5Demonstration Setup................................................................................................................................ 6Testing Plan.............................................................................................................................................. 8
Results ....................................................................................................................................... 10Operating Data Considerations .............................................................................................................. 10
Trans Membrane Pressure................................................................................................................. 10Membrane Flux................................................................................................................................... 10
Stage 1 – MBR Effluent Feed................................................................................................................. 11RO Element Clean Water Performance ............................................................................................. 11Scaling Characteristics....................................................................................................................... 11Fouling Characteristics....................................................................................................................... 12Stage 1 Operating Data...................................................................................................................... 13Water Quality...................................................................................................................................... 14
Stage 2 – MF Effluent Feed.................................................................................................................... 26RO Element Clean Water Performance ............................................................................................. 26Scaling Characteristics....................................................................................................................... 26Fouling Characteristics....................................................................................................................... 27Stage 2 Operating Data...................................................................................................................... 27Water Quality...................................................................................................................................... 29
Evaluation of Pilot Results....................................................................................................... 40Effectiveness of Technology to Achieve Performance Goals................................................................. 40
TDS Removal ..................................................................................................................................... 40Turbidity Removal............................................................................................................................... 40TOC Removal..................................................................................................................................... 40TP Removal........................................................................................................................................ 40Long-Term Flux Decline ..................................................................................................................... 40
Reliability Considerations ....................................................................................................................... 41Pilot Unit Observations....................................................................................................................... 41
Implementation ......................................................................................................................... 41Design Criteria ........................................................................................................................................ 41Design Features ..................................................................................................................................... 42Issues Not Resolved By Pilot Test Program .......................................................................................... 42
References................................................................................................................................. 42

King County Department of Natural Resources and Parks
June 2002 ii King County Water Reuse Demonstration ProjectReverse Osmosis Report (Final Report)
TablesTable 1. Effectiveness of RO Membrane to Meet Performance Goals........................................................1Table 2. Summary of RO Pilot System Parameters ....................................................................................8Table 3. Stage 1 Membrane Clean Water Performance............................................................................11Table 4. Scaling Constituents in MBR Effluenta.........................................................................................12Table 5. MBR Effluent SDI Values.............................................................................................................13Table 6. Stage 1 Water Quality Summary .................................................................................................16Table 7. Stage 1 Feed and Permeate Metals ............................................................................................24Table 8. Stage 1 Feed and Permeate Organics ........................................................................................25Table 9. Stage 2 Membrane Clean Water Performance............................................................................26Table 10. Scaling Constituents in BAF #2 Effluenta...................................................................................27Table 11. BAF #2 Effluent SDI Values.......................................................................................................27Table 12. Stage 2 Water Quality Summary ...............................................................................................30Table 13. Stage 2 Feed and Permeate Metals ..........................................................................................38Table 14. Stage 2 Feed and Permeate Organics ......................................................................................39Table 15. Effectiveness of Process to Achieve Performance Goals .........................................................40
FiguresFigure 1. RO Pilot System Schematic..........................................................................................................4Figure 2. Black & Veatch RO Membrane Pilot Unit. ....................................................................................7Figure 3. Stage 1 Operating Data ..............................................................................................................14Figure 4. Stage 1 Feed and Permeate Conductivity..................................................................................14Figure 5. Stage 1 - Feed and Filtrate TDS.................................................................................................17Figure 6. Stage 1 – Permeate TDS Log Normal Distribution.....................................................................17Figure 7. Stage 1 - Feed and Permeate TOC............................................................................................18Figure 8. Stage 1 – Permeate TOC Log Normal Distribution ....................................................................19Figure 9. Stage 1 - Feed and Permeate TKN ............................................................................................20Figure 10. Stage1 Feed and Permeate NH4-N .........................................................................................20Figure 11. Stage 1 Feed and Permeate NO3-N ........................................................................................21Figure 12. Stage 1 Feed and Permeate TP...............................................................................................22Figure 13. Stage 1 Permeate TP Log Normal Distribution ........................................................................22Figure 14. Stage 1 Feed and Permeate PO4-P.........................................................................................23Figure 15. Stage 2 Operating Data ............................................................................................................28Figure 16. Stage 2 Feed and Permeate Conductivity................................................................................29Figure 17. Stage 2 - Feed and Permeate TDS ..........................................................................................32Figure 18. Stage 2 – Permeate TDS Log Normal Distribution...................................................................32Figure 19. Stage 2 - Feed and Filtrate TOC ..............................................................................................33Figure 20. Stage 2 Permeate TOC Log Normal Distribution .....................................................................33Figure 21. Stage 2 - Feed and Permeate TKN ..........................................................................................34Figure 22. Stage2 Feed and Permeate NH4-N .........................................................................................34Figure 23. Stage 2 Feed and Permeate NO3-N ........................................................................................35Figure 24. Stage 2 Feed and Permeate TP...............................................................................................36Figure 25. Stage 2 Permeate TP Log Normal Distribution ........................................................................36Figure 26. Stage 2 Feed and Permeate PO4-P.........................................................................................37
King County Department of Natural Resources and Parks
June 2002 iii King County Water Reuse Demonstration ProjectReverse Osmosis Report (Final Report)
Appendices
Appendix A - Test Plan Revisions, Test Plan and RO Operations Manual
Appendix B - Pilot Unit Photos and Operator Comments

King County Department of Natural Resources and Parks
June 2002 1 King County Water Reuse Demonstration ProjectReverse Osmosis Report (Final Report)
Executive SummaryThis report summarizes the findings of the reverse osmosis (RO) membrane process pilot tests.The testing facilities were designed to supply the RO unit with two feed streams, each of whichwas designated as a specific test stage:
Stage 1 – Membrane Bioreactor (MBR) Effluent.
Stage 2 – Microfiltration Membrane (MF) Effluent.
The focus of these tests was to evaluate the RO membrane process as an advanced treatmentstep to achieve the highest level of nutrient and total organic carbon (TOC) removal, i.e. tomeet established water quality goals for a number of potential effluent end uses includingdischarge to wetlands, streams, lakes, and groundwater recharge. As summarized below, theperformance goals were:
Effluent TDS <100 mg/L, 95th percentile (for discharge to lakes and groundwater).
Effluent turbidity < 0.1 NTU, 95th percentile (for discharge to wetlands, streams andlakes, and for non-potable groundwater recharge).
Effluent TOC <1 mg/L, 90th percentile (for groundwater recharge, potable).
Effluent total phosphorous (TP) <0.02 mg/L, 90th percentile (for discharge to lakes).
Less than 2 percent long-term flux decline per year.
Table 1 summarizes the RO unit’s ability to meet these performance goals.
Table 1. Effectiveness of RO Membrane to Meet Performance Goals
Goal Description Reliability Target Measured PerformancePercentile Stage 1 Stage 2
TDS Removal 95th <100 mg/L 109 mg/L 62.6 mg/LTurbidity Removal 95th <0.1 NTU Not measureda Not measureda
TOC Removal 90th <1 mg/L 1.56 mg/L 1.38 mg/LTP Removal 90th <0.02 mg/L 0.014 mg/L 0.0067 mg/L
Long-Term Flux Decline <2% per year Not measruedb Not measruedb
a no reliable turbidity measurement, little if any solids in the RO permeateb Unable to measure during the pilot test duration
The performance of the RO for specific parameters is discussed below.
TDS RemovalThe RO membrane achieved the performance goal of <100 mg/L TDS at the 95th percentile forStage 2. However, for Stage 1, TDS removal was 109 mg/L at the 95th percentile. The data sethad only five data points for each test stage. With the caveat that the number of data points was

King County Department of Natural Resources and Parks
June 2002 2 King County Water Reuse Demonstration ProjectReverse Osmosis Report (Final Report)
small, it is anticipated that the RO membrane can meet the performance goal when treating MFeffluent.
Turbidity RemovalThis performance goal was not evaluated because turbidity could not be reliably measured inthe RO permeate. The permeate turbidity levels were below the measuring accuracy of theturbidimeter.
TOC RemovalThe RO membrane did not achieve the 90th percentile performance goal of <1 mg/L TOC. Theactual 90th percentile values were 1.56 and 1.38 mg/L for Stage 1 and 2, respectively.
TP RemovalThe RO membranes achieved the TP 90th percentile performance goal of <0.02 mg/L. Most ofthe permeate samples analyzed were below the detection limit of 0.005 mg/L.
Long-Term Flux DeclineThe clean-water performance data for both membranes were similar and indicated a goodrecovery of membrane performance after one chemical clean. However, to fully assess long-term flux decline, additional filtration/cleaning cycles need to be tested.
This technology would be suitable for use in a full-scale facility with the following designcriteria (for the RO membrane tested):
Operating Pressure: 100 to 400 psi.
Average Flux at 20 ºC: 9 gfd.
System Recovery: 70 to 85 percent.

King County Department of Natural Resources and Parks
June 2002 3 King County Water Reuse Demonstration ProjectReverse Osmosis Report (Final Report)
IntroductionThe King County Department of Natural Resources (King County) conducted a nine-monthdemonstration pilot-testing project to assess the performance of eight emerging wastewatertreatment technologies. The focus of this project is to assess technologies capable of producingeffluent meeting either State of Washington Class A Reuse Standards or more stringent waterquality standards.
This report summarizes the findings of the reverse osmosis (RO) membrane filtration pilottests. The RO pilot unit, supplied by Black & Veatch, was configured to receive effluent fromthe membrane bioreactor (MBR) pilot unit and the microfiltration (MF) pilot unit. The focus ofthese particular pilot tests was to evaluate an RO membrane process for advanced treatment,specifically additional nutrient reduction.
Description of the TechnologyThe RO membrane process removes dissolved impurities from water. A semi-permeablemembrane selectively allows water to pass through the membrane under pressure at a muchgreater rate than dissolved material. Water and a small amount of the dissolved materialdiffuse through the semi-permeable membrane. The purified RO water is called "permeate" or"product." The remaining water that flows out of the membrane pressure vessel contains higherconcentrations of impurities than the influent (because water has been removed from this flowbut most of the impurities are still in it); this outflow is called the "concentrate" or "brine".
In addition to removing ions (such as sodium and chloride), RO also removes unchargedcompounds, such as cysts, silica, and many organics. The removal percentage of dissolvedcomponents depends on the size and charge of those components, and on operating conditions(pressure, temperature, membrane material). To prevent rapid fouling or plugging of the ROmembrane’s spiral-wound configurations, pretreatment of the influent with a low-pressuremembrane (e.g., microfiltration) is required.
Figure 1. RO Pilot System Schematic
is a process schematic for the RO pilot system. The unit is equipped with a feed tank, a low-pressure supply pump, two cartridge filters, a high-pressure supply pump, an RO membranehoused in a pressure vessel, and a downstream collection tank. The feed to the RO system issupplied to the feed tank, which typically overflows to the collection tank to maintain aconstant pressure to the cartridge filter pump. The overflow from the collection tank goes todrain. There are two chemical injection points just upstream of the cartridge filters. Thecartridge filters, typically with a pore size between 5 and 10-micron, prevent debris fromclogging the spiral-wound membrane element. The chemical injection points allow for theaddition of anti scalant and acid addition. Acid is added to prevent calcium carbonate scaling.Anti scalant is added to control scaling of other sparingly soluble salts in the feed stream.

King County Department of Natural Resources and Parks
June 2002 4 King County Water Reuse Demonstration ProjectReverse Osmosis Report (Final Report)
Flow from the cartridge filters is routed to the high-pressure supply pump. This pump includesa variable frequency drive to control flow rate and pressure to the RO membrane. The portionof the feed stream that passes through the membrane (permeate) is sent to the downstreamcollection tank. The portion not passed through the membrane (concentrate) can berecirculated to the suction side of the high-pressure pump and/or sent to drain.
F
P
Membrane Module
F
F
P
F
Sample
Sample
High Pressure Pump
Sample Concentrate Concentrate
Recycle
Concentrate toCollection Tank
Chemicals
Feed Tank Collection
TankTo DrainSample Low
Pressure Pump Overflow to
Collection Tank
Cartridgefilter
Permeate
P F
LPS
F = Flow MeterP = Pressure Gage
LPS = Low Pressure Sensor
Figure 1. RO Pilot System Schematic
The single membrane module is placed in a horizontal housing. Filtration occurs in cross-flowmode (i.e., flow direction is parallel to the membrane surface), and only a portion of the feedpasses through the membrane. The concentrate stream continuously carries away concentratedimpurities to minimize membrane fouling. However, over time, impurities will build up on themembrane and restrict the permeate flow. To maintain a constant permeate flow rate, the feedpressure is automatically increased as needed. When the feed pressure becomes excessive, themodule is taken off-line and is chemically cleaned.
The membrane manufacturer will specify the cleaning protocol. Typically, it includes low-velocity recirculation followed by high-velocity recirculation with the cleaning solution. Thenthe system is flushed using de-ionized or RO permeate water. In some cases, a chemicalsoaking step is implemented between the recirculation steps.
System recovery is defined as the ratio of permeate flow to feed flow. Since RO membranesare designed for cross-flow filtration, a single multi-module pressure vessel will typically beoperated at about 50 percent recovery. A full-scale plant usually includes multiple membranestages operated in series. The concentrate from the upstream stages becomes the feed for thedownstream stages, which increases the system recovery for the overall plant. The typicalrecovery of a full-scale 3-stage system is 85 percent. Since the RO pilot system has just onemodule and therefore one stage, it can be operated at 50 percent recovery if brine recirculationis used to maintain cross-flow velocity. This represents the operating conditions of amembrane element in the middle-stage of a full-scale plant.

King County Department of Natural Resources and Parks
June 2002 5 King County Water Reuse Demonstration ProjectReverse Osmosis Report (Final Report)
Full-Scale FacilitiesReverse osmosis has been widely used in wastewater reuse projects in the recent years.Following is a list of full-scale RO membrane water reuse system installations in the UnitedStates that treat secondary effluent from municipal wastewater plants.
Chandler, AZ (2mgd): MF + RO
Scottsdale, AZ (19 mgd): MF + RO
Alamitos, CA (3.5 mgd): MF + RO
Carlsbad, CA (1 mgd): MF + RO
Dublin/San Ramon, CA (3 mgd): MF + RO
Livermore, CA (1 mgd): MF + RO
Terminal Island, Los Angeles, CA (6.2 mgd): MF + RO
Water Factory 21, Fountain Valley, CA (5 mgd): RO
Groundwater Replenishment Project (in design), Water Factory 21, Fountain Valley,CA (86 mgd): MF + RO
West Basin/Carson, CA (5.9 mgd): MF + RO
West Basin/El Segundo, CA (2.7 mgd): MF + RO
West Basin/El Segundo Phase 3, CA (5.9 mgd): MF + RO
Honolulu, HA (3.4 mgd): MF + RO
East Coast Power, NJ (3 mgd): MF + RO
State College, PA (1 mgd): MF + RO
Pilot Testing
Goals and ObjectivesThe goal of the pilot study was to use the reverse osmosis membrane process to treat MBReffluent and MF effluent and determine its effectiveness to meet effluent water quality goalsmore stringent than Class A Reuse requirements. The pilot study was designed to address thefollowing major goals:
Determine nutrient and total dissolved solids (TDS) removal.
Target the following performance goals for the specified potential end uses:
Effluent TDS<100 mg/L, 95th percentile (for discharge to lakes and groundwaterrecharge).

King County Department of Natural Resources and Parks
June 2002 6 King County Water Reuse Demonstration ProjectReverse Osmosis Report (Final Report)
Effluent turbidity < 0.1 NTU, 95th percentile (for discharge to wetlands, streams andlakes, and for non-potable groundwater recharge).
Effluent TOC <1 mg/L, 90th percentile (groundwater recharge, potable).
Effluent total phosphorous (TP) <0.02 mg/L, 90th percentile (for discharge to lakes).
Less than 2 percent long-term flux decline per year.
Also, the following were considered secondary goals for the project.
Monitor head loss across the membrane for a constant flux rate and system recovery.
Evaluate the potential for long-term membrane fouling.
Demonstration SetupThe RO pilot unit arrived at the West Point WWTP on August 29, 2001 and was on site for atotal of five months. The Black & Veatch startup engineer was on site in mid-September toconduct the system startup and train County staff to operate the unit. County staff operated theunit for the entire testing duration. The consultant team coordinated the pilot testing andprovided data analysis.
The pilot unit was located inside the Technology Assessment Facility at the West PointWWTP, as shown in Figure 2. Table 2 describes the physical attributes of the pilot unit.

King County Department of Natural Resources and Parks
June 2002 7 King County Water Reuse Demonstration ProjectReverse Osmosis Report (Final Report)
Figure 2. Black & Veatch RO Membrane Pilot Unit.

King County Department of Natural Resources and Parks
June 2002 8 King County Water Reuse Demonstration ProjectReverse Osmosis Report (Final Report)
Table 2. Summary of RO Pilot System Parameters
Parameter aaa Unit ValueMembrane Moduleb
Filtration Surface Area Square Feet 78 Module Length Inches 40 Module Diameter Inches 4 Membrane Material - polyamide Membrane Structure - thin-film
compositeFeed Tank Volume Gallon 45Collection Tank Volume Gallon 15Low-Pressure Pump Flow Rate gpm 20 Discharge Pressure (at 20 gpm) psi 20High-Pressure Pump Flow Rate gpm 20 Discharge Pressure (at 20 gpm) psi 300Cartridge Filter Pore Size µm 10
a (Black & Veatch, 2001)b Koch/Fluid Systems Model TFC 4820 HR
The system does not include a programmable logic controller, data logger, or SCADA system;the operator records the instrument readings manually. Instrumentation includes:
Inlet and outlet cartridge filter pressure gage.
Low-pressure sensor on the suction side of the high-pressure pump.
Inlet and outlet RO membrane pressure gages.
Flow meters (rotameters) to measure RO membrane feed flow, permeate flow, recycledconcentrate flow and concentrate flow to drain.
Feed water temperature probe.
The system includes two chemical feed pumps, each with chemical solution tanks, to supplyantiscalant and/or acid to the feed.
Testing PlanA testing plan was prepared at the beginning of the pilot study and is contained in Appendix A.Also included in Appendix A is a copy of the Model RO-2001 Pilot Unit Operations Manual,Black & Veatch, 2001. This manual provides a good summary of reverse osmosis membranetechnology as well as a detailed description of the pilot unit configuration, including process,instrumentation, and layout drawings.

King County Department of Natural Resources and Parks
June 2002 9 King County Water Reuse Demonstration ProjectReverse Osmosis Report (Final Report)
The test plan includes a detailed description of the pilot unit operating conditions, test stages,sampling, and special testing. As the testing progressed, there were deviations from this testplan, which are summarized in the beginning of Appendix A.
The system performance was checked two to four times per day. Pressure and flowmeasurements were manually recorded on operator data sheets two to four times per day. Ifneeded, manual valves or pump speed were adjusted to maintain permeate and concentrateflow-rate set points. Inlet and outlet cartridge filter pressure was recorded to determine thepressure drop. The antiscalant feed pump rate was checked along with the level in theantiscalant supply tank.
Following is a summary of key features of the original test plan:
The focus of the testing was to evaluate permeate water quality when treating MBR andMF effluent. Operating parameters such as permeate flow rate, system recovery, andantiscalant dose were not optimized. Instead, these parameters remained constant toprovide a stable operation.
For each feed stream, grab samples were collected and analyzed for scaling indices toassess the need for antiscalant and/or acid addition.
Particulate and organic material in the feed stream will accumulate on the membranesurface and cause membrane fouling. The silt density index (SDI) is used as a foulingindicator. SDI is calculated based on the time required to filter a 100 mL feed samplethrough a 0.45 µm filter. In general, an SDI value less than three indicates that the feedstream is not likely to foul the membrane. For each feed stream, the SDI was calculatedto assess fouling potential.
Feed and permeate conductivity were measured to monitor salt rejection. A sudden saltpassage increase would indicate the membrane had been damaged or that there had beena failure in one of the physical sealing systems, such as the o-rings. Conductivitypassage, one way to assess salt rejection, is the ratio of permeate to feed conductivity.A low percent conductivity passage represents high salt rejection.
Two new membrane modules were used, one for each stage of testing. The membranemanufacturer performed clean water performance tests prior to supplying the modules.At the conclusion of each test stage, the membrane module was shipped to a membranetesting company to perform a chemical clean and determine the post-clean waterperformance. Chemical cleaning was not done onsite.
The polyamide membrane is not resistant to free chlorine.
The pilot test consisted of the following testing stages:
Stage 1 – MBR Effluent Feed. Effluent from the Zenon MBR was supplied to theRO unit during this stage. The MBR was treating West Point WWTP primaryinfluent to demonstrate compliance with Class A reuse standards. It was also

King County Department of Natural Resources and Parks
June 2002 10 King County Water Reuse Demonstration ProjectReverse Osmosis Report (Final Report)
operated to nitrify. This system includes a low-pressure ultrafiltration membranethat produced effluent turbidity consistently below 0.1 NTU.
Stage 2 – MF Effluent Feed. Effluent from the MF pilot unit was supplied to theRO unit during this stage. The entire treatment train included West Point WWTPprimary effluent supplied to the biological aerated filter (BAF) #1 unit forbiochemical oxygen demand (BOD) oxidation followed by the BAF #2 unit fornitrification, which then supplied the MF unit. The focus of Stage 2 was enhancednutrient removal on West Point primary effluent. Similar to the MBR, the MFeffluent turbidity was consistently below 0.1 NTU.
Results
Operating Data Considerations
Trans Membrane PressureThe trans membrane pressure (TMP) is the head loss across the membrane and represents thedriving force needed to achieve a given permeate flow condition. Membrane fouling andscaling will cause the TMP to rise. TMP is a calculated value using feed pressure, concentratepressure and permeate pressure values.
Membrane FluxMembrane flux is evaluated during a pilot study to determine the design flux for a full-scaleapplication. The flux is a measure of the membrane permeate flow rate divided by the activesurface area of the membrane. It is calculated as follows:
Flux (gfd) = filtrate flow (gallons per day) / membrane surface area (sq ft)
In the United States, the units for flux are gallons per day per square foot, which is abbreviatedas gfd.
Membrane flux is a parameter used for evaluating the system performance. The flux is directlyaffected by the feed water temperature. As the temperature decreases, the liquid viscosityincreases, requiring a higher feed pressure to maintain the same flux for a colder feed stream.
A temperature of 20 °C was used as the standard temperature. The temperature-corrected flux(flux at 20 °C) is calculated by multiplying the actual flux by the temperature correction factor.The correction factor is calculated as follows:
Temperature correction factor = 1.03(20 ºC – actual feed temperature ºC)
However, the system can produce a constant flux even when the temperature drops. A higherfeed pressure is required which, in turn, increases the TMP. To account for this variable, theflux is normalized with respect to TMP, and is referred to as the specific flux. To account for

King County Department of Natural Resources and Parks
June 2002 11 King County Water Reuse Demonstration ProjectReverse Osmosis Report (Final Report)
both temperature and TMP, the temperature-corrected specific flux is used and calculated asfollows:
Temperature-Corrected Specific Flux (gfd/psi) = Temperature-Corrected Flux (gfd)/TMP (psi)
In the results section below, the operating data presented include the feed temperature, TMP,temperature-corrected flux and temperature-corrected specific flux.
Stage 1 – MBR Effluent FeedThe RO unit was supplied with MBR effluent from September 20, 2001, to January 20, 2002.
RO Element Clean Water PerformanceTable 3 is a summary of the clean water flux data for the Stage 1 membrane module. Testingresults were corrected to standard conditions of: 2000 mg/L NaCl feed concentration, 225 psi,15% recovery, 77 ºF, and pH 7.5. Cleaning was performed by Betz-Dearborn/Argo Scientificusing their standard acid (Kleen MCT103 ) and caustic-detergent (Kleen MCT411) cleaningagents. A standard acid and caustic-detergent cleaning brought the permeate flow performanceto within 5% of the initial clean water performance. The post-cleaning rejection and pressuredrop was essentially the same as the initial clean water test results. It is not unusual to observe asmall amount of flux loss during early operations. A properly designed full-scale plant wouldtake this into account.
Table 3. Stage 1 Membrane Clean Water Performance
Description Before Pilot Test After Pilot TestBefore CIP After CIP
Permeate Flow, gpd 2010 1730 1940Flux, gfd 25.8 22.2 24.9
Chloride Rejection, % 99.6 98.8 99.0Feed-Brine Pressure Drop, psid 4.1 5 3
Overall, these results indicate the scaling/fouling was not irreversible; however, longer-termtesting would be needed to fully quantify the fouling potential, to observe multiple fouling-cleaning cycles and verify that this initial loss would not worsen over time.
Scaling CharacteristicsThe MBR effluent was sampled on October 23, 2001. The County laboratories performed theanalyses for various inorganic species. These species, if concentrated at the membrane surface,can reach saturation causing precipitates to form. Depending on the cross-flow hydraulicconditions at the membrane surface, these particulates can deposit on the membrane andincrease membrane fouling.

King County Department of Natural Resources and Parks
June 2002 12 King County Water Reuse Demonstration ProjectReverse Osmosis Report (Final Report)
The following parameters and their concentrations found in the MBR effluent are summarizedin Table 4.
Table 4. Scaling Constituents in MBR Effluenta
Parameter ValueAlkalinity, mg/L CaCO3 52.7TDS, mg/L 578Chloride, mg/L 211Sulfate, mg/L 45.2Fluoride, mg/L 0.644NO2 + NO3, mg/L 12Silica, mg/L 16.3Total Barium, mg/L 0.0025Total Calcium, mg/L 19.7Total Iron, mg/L 0.053Total Magnesium, mg/L 15.9Total Manganese, mg/L 0.0049Total Potassium, mg/L 12.6Total Sodium, mg/L 137Total Aluminum, mg/L 0.0227
a sample without anti scalant.
Equilibrium calculations showed little potential for precipitating calcium carbonate and othersparingly soluble salts for this feed stream as long as the unit continued to operate at less thanor equal to 50 percent recovery. If the feed water concentrations were to increase, the mostlikely precipitant would be calcium carbonate. In turn, if this precipitation occurred, it wouldresult in a high membrane feed pressure and a significant increase in the feed-brine pressuredrop.
Antiscalant feed (Bet3Dearborn, Inc. Hyperspace AF 150 UF at a target dose of 2 to 2.5 mg/L)was implemented at the beginning of Stage 1. For the last month of testing, beginning onJanuary 8, 2002, the antiscalant feed was shut off to determine the impact on TMP. Acidaddition was not implemented because high levels of calcium carbonate were not anticipated inthe feed. This was confirmed with the data analysis (Table 4).
Fouling CharacteristicsThe County measured the SDI twice and this data is summarized in Table 5. Both values wereless than 3, suggesting a low potential for fouling with MBR effluent. This was the anticipatedoutcome due to the pore size of the membrane in the MBR.

King County Department of Natural Resources and Parks
June 2002 13 King County Water Reuse Demonstration ProjectReverse Osmosis Report (Final Report)
Table 5. MBR Effluent SDI Values
Date SDI ValueNovember 9, 2001 2.5November 14, 2001 0.8
The MBR effluent TOC measured during Stage 1 ranged from 4 to 8.4 mg/L.
Stage 1 Operating DataThe RO membrane temperature-corrected specific flux, TMP and temperature-corrected fluxare plotted in Figure 3 for the Stage 1 testing duration. Feed temperature is also included.
The TMP pressure was initially 104 psi and gradually increased to 184 psi by the end of thetesting. There was no noticeable change in the TMP increase once the antiscalant feed wasdiscontinued. The feed temperature was initially 20 ºC and decreased to as low as 15 ºC.
The temperature-corrected flux ranged from 8.3 to 13.7 gfd, with an average of 11.2 gfd. Thefluctuation was primarily due to the manually controlled permeate flow rate.
The temperature-corrected specific flux was initially 0.11 gfd/psi and gradually decreased to0.05 gfd/psi by the end of the test. A 50 percent reduction in specific flux indicates membranefouling/scaling occurred for the MBR effluent. The element clean in place (CIP) appeared tobe successful but more fouling/cleaning cycles are recommended before the long-term foulingbehavior can be fully assessed.
Figure 4 shows the feed and permeate conductivity data. The average permeate conductivitywas 9 µmho/cm compared to the average feed conductivity of 816 µmho/cm. The RO systemprovided a 2-log reduction of conductivity and the conductivity passage ranged between 0.5and 1.9 %. Overall these data show low conductivity passage and therefore, a high saltrejection.

King County Department of Natural Resources and Parks
June 2002 14 King County Water Reuse Demonstration ProjectReverse Osmosis Report (Final Report)
0.01
0.10
1.00
10.00
100.00
1000.00
Sep 20-01 Oct 05-01 Oct 20-01 Nov 04-01 Nov 19-01 Dec 04-01 Dec 19-01 Jan 03-02 Jan 18-02
gfd/
psi,
psi
0
5
10
15
20
25
30
gfd,
C
Temperature-Corrected Specific Flux TMP Temperature Corrected Flux Feed Temperature
Anti-Scalant Feed Off
Figure 3. Stage 1 Operating Data
1
10
100
1000
10000
Sep 20-01 Oct 05-01 Oct 20-01 Nov 04-01 Nov 19-01 Dec 04-01 Dec 19-01 Jan 03-02 Jan 18-02
µmho
/cm
Feed Conductivity Permeate Conductivity
Figure 4. Stage 1 Feed and Permeate Conductivity
Water QualityTDS, TOC and nutrients were measured in the feed and permeate. Automatic samplers wereused to collect 24-hour composites for a measurement of conductivity, TDS and TKN by the

King County Department of Natural Resources and Parks
June 2002 15 King County Water Reuse Demonstration ProjectReverse Osmosis Report (Final Report)
West Point WWTP Process Laboratory. Grab samples were also collected for analysis of TOCand other nutrients by the King County Environmental Laboratory. On one occasion, feed andpermeate grab samples were collected and analyzed for metals and organics.
Table 6 summarizes the TDS, TOC and nutrient data, including percent removal. All datacollected were used to calculate the feed and permeate concentration statistics presented. Formany parameters, the permeate concentrations were less than the laboratory method detectionlimit (MDL). These data were assigned the MDL value for the statistics calculations. Percentremoval was calculated using the average feed and permeate concentrations.
The following subsections present the feed and permeate concentrations for each water qualityparameter. Special sampling results for metals and organics are presented in the lastsubsection.
TDSFeed and permeate TDS are shown in Figure 5. The data was collected from January 13 toJanuary 17. These limited data indicate the RO membrane provided a high rejection of TDS.The average removal was 93.8%.
Figure 6 shows a lognormal distribution of the permeate TDS data. At the 95th percentile, theTDS concentration was 109 mg/L, which did not quite meet the permeate TDS performancegoal of <100 mg/L 95th percentile.

King County Department of Natural Resources and Parks
June 2002 16 King County Water Reuse Demonstration ProjectReverse Osmosis Report (Final Report)
Table 6. Stage 1 Water Quality Summary
Parameter Average Minimum Maximum MDL TDS Feed, mg/L 579 472 936 na Permeate, mg/L 39 6 96 na Removal, percent 93.8 - - TOC Feed, mg/L 6.515 3.950 8.390 0.5 Permeate, mg/L 1.114 0.770 1.770 0.5 Removal, percent 82.6 - -NITROGEN COMPOUNDS TKN Feed, mg/L 0.472 0.103 1.050 0.01 Permeate, mg/L 0.054 <0.01 0.090 0.01 Removal, percent >88.6a - - NH4-N Feed, mg/L 0.146 0.010 3.570 0.01 Permeate, mg/L 0.014 0.010 0.107 0.01 Removal, percent 90.4 - - NO3-N Feed, mg/L 6.786 0.4000 14.600 0.02 Permeate, mg/L 0.169 0.035 0.452 0.02 Removal, percent >97.5 a - -PHOSPHOROUS COMPOUNDS TP Feed, mg/L 0.99 0.05 3.66 0.005 Permeate, mg/L 0.006 0.005 0.012 0.005 Removal, percent >99.4 a - - PO4-P Feed, mg/L 1.39 0.045 5.87 0.002 Permeate, mg/L 0.002 0.002 0.004 0.002 Removal, percent >99.9a - -
na not applicable- = percent removal only calculated for average feed and permeate dataa shown as greater than calculated value because the average permeate includes values <MDL

King County Department of Natural Resources and Parks
June 2002 17 King County Water Reuse Demonstration ProjectReverse Osmosis Report (Final Report)
1
10
100
1000
Jan 10-02 Jan 12-02 Jan 14-02 Jan 16-02 Jan 18-02 Jan 20-02
mg/
L
Feed TDS Permeate TDS
Figure 5. Stage 1 - Feed and Filtrate TDS
50%
27.75 75%
48.61 95%
108.89
10% 20% 35% 65% 80% 90% 99.9%0.1% 50%1.00
10.00
100.00
1000.00
Percent of values less than of equal to indicated value
Perm
eate
TDS
(mg/
L)
Normal Values Permeate TDS
Figure 6. Stage 1 – Permeate TDS Log Normal Distribution
TOCFigure 7 shows feed and permeate TOC. The average removal was 82.8%. The RO membraneeffectively removed TOC from the MBR effluent.

King County Department of Natural Resources and Parks
June 2002 18 King County Water Reuse Demonstration ProjectReverse Osmosis Report (Final Report)
Figure 8 shows a log normal distribution of the permeate TOC. The 90th percentile value is1.56 mg/L. These data indicate the RO membrane did not achieve the permeate TOC 90th
percentile performance goal of <1 mg/L.
TOC Method Detection Limit 0.5 mg/L
0.1
1
10
Sep 20-01 Oct 05-01 Oct 20-01 Nov 04-01 Nov 19-01 Dec 04-01 Dec 19-01 Jan 03-02 Jan 18-02
mg/
L
Feed TOC Permeate TOC
Figure 7. Stage 1 - Feed and Permeate TOC

King County Department of Natural Resources and Parks
June 2002 19 King County Water Reuse Demonstration ProjectReverse Osmosis Report (Final Report)
1
50%
1.31
75%
1.56
90%
10% 20% 35% 65% 80% 90% 99.9%0.1% 50%0.10
1.00
10.00
Percent of values less than of equal to indicated value
Perm
eate
TO
C (m
g/L)
Normal Values Permeate TOC
Figure 8. Stage 1 – Permeate TOC Log Normal Distribution
Nitrogen CompoundsFigure 9 includes feed and permeate TKN concentrations. The average removal was >88.6%.
Figure 10 shows NH4-N feed and permeate concentrations. With the exception of four days inDecember, feed NH4-N ranged from 0.02 to 0.17 mg/L. The permeate NH4-N wasconsistently <0.01 mg/L, the lab method detection limit. The average removal was >90.4%.
During Stage 1, the MBR unit was operating in nitrification mode. However, on the followingdays the MBR effluent ammonia increased and there was a corresponding increase in ROpermeate ammonia. In all cases, RO reduced ammonia by more than 90%, providing aprotection against a potential upstream MBR upset.
December 7: MBR effluent ammonia, 3.57 mg/L; RO permeate ammonia (notmeasured)
December 18: MBR effluent ammonia, 2.09 mg/L; RO permeate ammonia, 0.107 mg/L
December 19: MBR effluent ammonia, 1.4 mg/L; RO permeate ammonia, 0.071 mg/L
December 20: MBR effluent ammonia, 1.94 mg/L; RO permeate ammonia, 0.067 mg/L
There were two days in early October when the MBR effluent ammonia peaked above 0.1mg/L. However, the permeate ammonia remained < 0.01 mg/L.

King County Department of Natural Resources and Parks
June 2002 20 King County Water Reuse Demonstration ProjectReverse Osmosis Report (Final Report)
0.001
0.01
0.1
1
10
Sep 20-01 Oct 05-01 Oct 20-01 Nov 04-01 Nov 19-01 Dec 04-01 Dec 19-01 Jan 03-02 Jan 18-02
mg/
L
Feed TKN Permeate TKN
TKN Method Detection Limit 0.01
Figure 9. Stage 1 - Feed and Permeate TKN
NH4-N Method Detection Limit 0.01 mg/l
0.001
0.01
0.1
1
10
Sep 20-01 Oct 05-01 Oct 20-01 Nov 04-01 Nov 19-01 Dec 04-01 Dec 19-01 Jan 03-02 Jan 18-02
mg/
L
Feed NH4-N Permeate NH4-N
Figure 10. Stage1 Feed and Permeate NH4-N
Figure 11 shows NO3-N feed and permeate concentrations and percent removal. The ROmembrane consistently rejected nitrate at a high rate, with an average removal >97.5%.

King County Department of Natural Resources and Parks
June 2002 21 King County Water Reuse Demonstration ProjectReverse Osmosis Report (Final Report)
0.01
0.1
1
10
100
Sep 20-01 Oct 05-01 Oct 20-01 Nov 04-01 Nov 19-01 Dec 04-01 Dec 19-01 Jan 03-02 Jan 18-02
mg/
L
Feed NO3-N Permeate NO3-N
NO3-N Method Detection Limit 0.02 mg/L
Figure 11. Stage 1 Feed and Permeate NO3-N
Phosphorous CompoundsFigure 12 shows the feed and permeate TP concentrations. The average removal was >99.4%.
A log normal distribution of the permeate TP is shown in Figure 13. The 90th percentile was0.014 mg/L, which met the 90th percentile performance goal of <0.02 mg/L. The ROmembrane effectively removed TP from the MBR effluent.

King County Department of Natural Resources and Parks
June 2002 22 King County Water Reuse Demonstration ProjectReverse Osmosis Report (Final Report)
TP Method Detection Limit 0.005 mg/L
0.001
0.01
0.1
1
10
Sep 20-01 Oct 05-01 Oct 20-01 Nov 04-01 Nov 19-01 Dec 04-01 Dec 19-01 Jan 03-02 Jan 18-02
mg/
L
Feed TP Permeate TP
MDL
Figure 12. Stage 1 Feed and Permeate TP
10% 20% 35% 65% 80% 90% 99.9%0.1% 50%0.00
0.01
0.10
Percent of values less than of equal to indicated value
Perm
eate
TP
(mg/
L)
Normal Values Permeate TP
95%75%
50%
0.0080.004
0.014
Figure 13. Stage 1 Permeate TP Log Normal Distribution
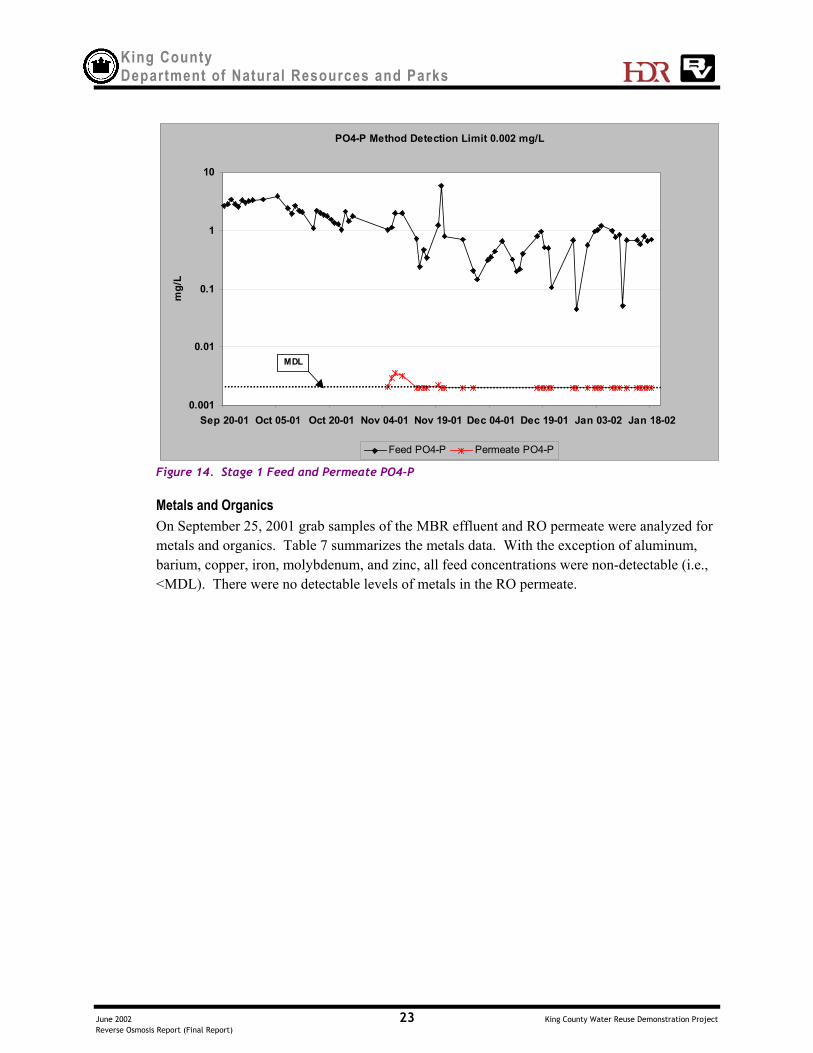
Feed and permeate ortho phosphate (PO4-P) concentrations are shown in Figure 14. With theexception of three data points, all of the permeate PO4-P results were <0.005 mg/L, the MDL.The RO membrane effectively removed PO4-P from the MBR effluent with an averageremoval >99.9%.
King County Department of Natural Resources and Parks
June 2002 23 King County Water Reuse Demonstration ProjectReverse Osmosis Report (Final Report)
PO4-P Method Detection Limit 0.002 mg/L
0.001
0.01
0.1
1
10
Sep 20-01 Oct 05-01 Oct 20-01 Nov 04-01 Nov 19-01 Dec 04-01 Dec 19-01 Jan 03-02 Jan 18-02
mg/
L
Feed PO4-P Permeate PO4-P
MDL
Figure 14. Stage 1 Feed and Permeate PO4-P
Metals and OrganicsOn September 25, 2001 grab samples of the MBR effluent and RO permeate were analyzed formetals and organics. Table 7 summarizes the metals data. With the exception of aluminum,barium, copper, iron, molybdenum, and zinc, all feed concentrations were non-detectable (i.e.,<MDL). There were no detectable levels of metals in the RO permeate.

King County Department of Natural Resources and Parks
June 2002 24 King County Water Reuse Demonstration ProjectReverse Osmosis Report (Final Report)
Table 7. Stage 1 Feed and Permeate Metals
Parameter FeedConcentration
(mg/L)
PermeateConcentration
(mg/L)
MDL
(mg/L)Aluminum 0.0133 <0.002 0.002Antimony <0.0005 <0.0005 0.005Arsenic 0.0017 <0.0005 0.005Barium 0.00342 <0.0002 0.0002Beryllium <0.0002 <0.0002 0.0002Cadmium <0.0001 <0.0001 0.0001Chromium 0.0006 <0.0004 0.0004Cobalt 0.002 <0.0002 0.0002Copper 0.00953 <0.0004 0.0004Iron 0.071 <0.05 0.05Lead 0.00074 <0.0002 0.0002Molybdenum 0.00917 <0.0005 0.0005Nickel 0.00325 <0.0003 0.0003Selenium <0.0015 <0.0015 0.0015Silver <0.0002 <0.0002 0.0002Thallium <0.0002 0.00024 0.0002Vanadium 0.001 <0.0003 0.0003Zinc 0.0332 <0.0005 0.0005Mercury <0.00005 <0.00005 0.00005

King County Department of Natural Resources and Parks
June 2002 25 King County Water Reuse Demonstration ProjectReverse Osmosis Report (Final Report)
The organics data are summarized in Table 8. For all parameters measured, none of the feed orpermeate concentrations exceeded the method detection limit. With no detectable organics inthe feed, these data cannot be used to evaluate the ability of the RO membrane to remove theseorganic compounds from the MBR effluent.
Table 8. Stage 1 Feed and Permeate Organics
Parameter Feed Concentration (µg/l) Permeate Concentration (µg/l) MDL (µg/l)1,1,1-Trichloroethane <1 <1 11,1,2,2-Tetrachloroethane <1 <1 11,1,2-Trichloroethane <1 <1 11,1,2-Trichloroethylene <1 <1 11,1-Dichloroethane <1 <1 11,1-Dichloroethylene <1 <1 11,2-Dichloroethane <1 <1 11,2-Dichloropropane <1 <1 12-Butanone (MEK) <5 <5 52-Chloroethylvinyl ether <1 <1 12-Hexanone <5 <5 54-Methyl-2-Petanone (MIBK) <5 <5 5Acetone <2. 5 <2. 5 2.5Acrolein <5 <5 5Acrylonitrile <5 <5 5Benzene <1 <1 1Bromodichloromethane <1 <1 1Bromoform <1 <1 1Bromoethane <1 <1 1Carbon Disulfide <1 <1 1Carbon Tetrachloride <1 <1 1Chlorobenzene <1 <1 1Chlorodibromoethane <1 <1 1Chloroethane <1 <1 1Chloroform <1 <1 1Chloromethane <1 <1 1Cis-1,3-Dichloropropene <1 <1 1Ethylbenzene <1 <1 1Methylene Chloride <1 <1 1Styrene <1 <1 1Tetrachloroethylene <1 <1 1Toluene <1 <1 1Total Xylenes <1 <1 1Trans-1,2-Dichloroethylene <1 <1 1Trans-1,3-Dichloropropene <1 <1 1Trichloroflouromethane <1 <1 1Vinyl Acetate <5 <5 5Vinyl Chloride <1 <1 1

King County Department of Natural Resources and Parks
June 2002 26 King County Water Reuse Demonstration ProjectReverse Osmosis Report (Final Report)
Stage 2 – MF Effluent FeedThe RO unit received MF effluent from February 3, 2002 to February 27, 2002. Antiscalantwas not used during Stage 2, because equilibrium calculations (see Scaling Characteristicssection) did not indicate the need, and because the results from Stage 1 did not indicate anybenefit was realized from adding antiscalant. From February 20 to 27, alum (50 mg/L) wasadded to the MF unit feed to enhance phosphorous removal, and this addition reduced the ROfeed TP and PO4-P levels.
RO Element Clean Water PerformanceThe clean water performance data is shown in Table 9 for the Stage 2 membrane module.Testing results were corrected to standard conditions of: 2000 mg/L NaCl feed concentration,225 psi, 15% recovery, 77 ºF, and pH 7.5. Cleaning was performed by Betz-Dearborn/ArgoScientific using their standard acid (Kleen MCT103) and caustic-detergent (Kleen MCT411).
Table 9. Stage 2 Membrane Clean Water Performance
Description Before Pilot Test After Pilot TestBefore CIP After CIP
Permeate Flow, gpd 2,340 920 2260Flux, gfd 30.0 11.8 29.0
Chloride Rejection, % 99.7 98.8 99.0Feed-Brine Pressure Drop, psid 3.1 5 3
As with the first element, the permeability of the membrane element was almost completelyrestored after chemical cleaning. There was some decline in performance, but it is not unusualto observe a small amount of performance loss during the first few operation-cleaning cycles.
Overall, the results indicate the flux loss was not irreversible. Longer-term testing isrecommended to fully understand the fouling potential by observing multiple fouling-cleaningcycles to verify that this initial loss would not worsen over time.
Scaling CharacteristicsThe RO membrane feed was sampled on January 29, 2002 before Stage 2 testing started. Atthat time, the MF unit was treating BAF #2 effluent. Since the MF membrane does not rejectinorganic salts, it was assumed that the target scaling species in the MF unit feed (BAF #2effluent) would represent the scaling characteristics of the feed to the RO unit.
Table 10 summarizes the parameters and their concentrations measured in the BAF #2 effluent.

King County Department of Natural Resources and Parks
June 2002 27 King County Water Reuse Demonstration ProjectReverse Osmosis Report (Final Report)
Table 10. Scaling Constituents in BAF #2 Effluenta
Parameter ValueAlkalinity, mg/L CaCO3 62.6TDS, mg/L nmChloride, mg/L 211Sulfate, mg/L 45.2Fluoride, mg/L 0.644NO2 + NO3, mg/L 12Silica, mg/L 16.3Total Barium, mg/L 0.0025Total Calcium, mg/L 19.7Total Iron, mg/L 0.053Total Magnesium, mg/L 15.9Total Manganese, mg/L 0.0049Total Potassium, mg/L 12.6Total Sodium, mg/L 137Total Aluminum, mg/L 0.0227
nm = not measureda sample without antiscalant.
Similar to Stage 1, operating at the pilot testing condition of 50 percent recovery, the risk ofinorganic scaling is low. Generally, calcium carbonate scaling would not occur at this condition;however, it might occur if conditions worsened beyond what was measured (Table 10).
Fouling CharacteristicsThree SDI tests were conducted and the results are shown in Table 11. All values were lessthan 3, suggesting a low fouling potential with MF effluent, as anticipated based on experiencewith this technology at other sites.
Table 11. BAF #2 Effluent SDI Values
Date SDI ValueFebruary 4, 2002 1.4February 21, 2002 0.9February 25, 2002 1.1
Stage 2 Operating DataThe membrane temperature-corrected specific flux, TMP, temperature-corrected flux and feedtemperature are plotted in Figure 15 for Stage 2.

King County Department of Natural Resources and Parks
June 2002 28 King County Water Reuse Demonstration ProjectReverse Osmosis Report (Final Report)
0.01
0.10
1.00
10.00
100.00
1000.00
Feb 03-02 Feb 07-02 Feb 11-02 Feb 15-02 Feb 19-02 Feb 23-02 Feb 27-02
gfd/
psi,
psi
0
10
20
30
40
50
60
gfd,
C
Temperature-Corrected Specific Flux TMP Temperature Corrected Flux Feed Temperature
Permeate Flow 0.3 gpm
Permeate Flow 0.83 gpm
Figure 15. Stage 2 Operating Data
The TMP was initially 137 psi and increased to 314 psi by the end of the 3-week testing. Thiswas a much faster TMP increase than the increase observed during Stage 1.
Except for two days, the temperature-corrected flux remained between 12 and 14 gfd. OnFebruary 20, the observed permeate flow rate was 0.3 gpm. The operator adjusted the valves,and the next day permeate flow was 0.83 gpm, which exceeded the 0.6 gpm set point. Thevalves were adjusted again and the permeate flow rate remained at 0.5 to 0.6 gpm for the rest ofthe testing.
The temperature-corrected specific flux was initially 0.09 gfd/psi and decreased to 0.04 gfd/psiby the end of the test. A 55% reduction in specific flux indicates the membrane fouled underconstant permeate flow rate conditions for the MF effluent. The feed temperature was initially15.5 ºC and decreased to as low as 9.7 ºC.
The decline in temperature-corrected specific flux increased right after the increase in permeateflow from 0.3 to 0.83 gpm. This could have caused some scale formation. Under theseconditions, the system recovery increased above 50%, which increases the concentration ofrejected species at the membrane surface. This can cause inorganic species to exceed theirprecipitation limit. Once precipitation takes place, the crystals will provide nuclei forsubsequent precipitation, causing more scaling.
Figure 16 shows the feed and permeate conductivity data. The average permeate conductivitywas 6 µmho/cm compared to the average feed conductivity of 621 µmho/cm. The conductivity

King County Department of Natural Resources and Parks
June 2002 29 King County Water Reuse Demonstration ProjectReverse Osmosis Report (Final Report)
passage ranged between 0.6 and 1.4%. Overall these data show low conductivity passage andtherefore, a high salt rejection.
1
10
100
1000
Feb 03-02 Feb 07-02 Feb 11-02 Feb 15-02 Feb 19-02 Feb 23-02 Feb 27-02
µmho
/cm
Feed Conductivity Permeate Conductivity
Figure 16. Stage 2 Feed and Permeate Conductivity
Water QualityTDS, TOC, and nutrients were measured in the feed and permeate. Automatic samplers wereused to collected 24-hour composites for measurement of conductivity, TDS and TKN by theWest Point WWTP Process Laboratory. Grab samples were also collected for analysis of TOCand other nutrients by the King County Environmental Laboratory. On January 29, 2002 feedand permeate grab samples were collected and analyzed for metals, organics, andmicroorganisms. A few microbiological parameters, along with Total Suspended Solids (TSS)were also measured in the feed and permeate and are discussed at the end of this section.
Table 12 summarizes TDS, TOC, and nutrients data including percent removal. Since the alumpre-treatment for the MF unit decreased the RO feed TP and PO4-P concentrations, thephosphorous data is presented with the alum-pretreatment data separate from the no alumpretreatment data.
All data collected were used to calculate the feed and permeate concentration statisticspresented. For many parameters, the permeate concentrations were less than the laboratorymethod detection limit (MDL). These data were assigned the MDL value for the statisticalcalculations. Percent removal was calculated using the average feed and permeateconcentrations.

King County Department of Natural Resources and Parks
June 2002 30 King County Water Reuse Demonstration ProjectReverse Osmosis Report (Final Report)
Table 12. Stage 2 Water Quality Summary
Parameter Average Minimum Maximum Lab MDL
TDS Feed, mg/L 386 280 496 na Permeate, mg/L 30 10 54 na Removal, percent 92.2 - - TOC Feed, mg/L 7.365 4.390 9.560 0.5 Permeate, mg/L 1.208 0.950 1.390 0.5 Removal, percent 83.6 - -NITROGEN COMPOUNDS TKN Feed, mg/L 0.890 0.340 1.940 0.01 Permeate, mg/L 0.08 0.05 0.14 0.01 Removal, percent >91.0a - - NH4-N Feed, mg/L 0.610 0.033 2.350 0.01 Permeate, mg/L 0.015 0.010 0.040 0.01 Removal, percent 97.5 - - NO3-N Feed, mg/L 9.877 5.550 12.90 0.02 Permeate, mg/L 0.1666 0.102 0.219 0.02 Removal, percent >98.0a - -PHOSPHOROUS COMPOUNDS TP ( no alum in MF feed) Feed, mg/L 1.6 1.0 2.5 0.005 Permeate, mg/L <0.005 <0.005 0.007 0.005 Removal, percent >99.7a - - TP ( alum in MF feed) Feed, mg/L 0.033 0.015 0.056 0.005 Permeate, mg/L <0.005 <0.005 <0.005 0.005 Removal, percent >84.9a - - PO4-P (no alum in MF feed) Feed, mg/L 1.483 0.900 2.260 0.002 Permeate, mg/L <0.002 <0.002 0.003 0.002 Removal, percent >99.9 - - PO4-P (alum in MF feed) Feed, mg/L 0.004 0.002 0.009 0.002 Permeate, mg/L <0.002 <0.002 <0.002 0.002 Removal, percent >50.0a - -
na not applicable- percent removal calculated only for average feed and permeate dataa shown as greater than calculated value because the average permeate includes values <MDL
King County Department of Natural Resources and Parks
June 2002 31 King County Water Reuse Demonstration ProjectReverse Osmosis Report (Final Report)
The following subsections present the feed and permeate concentrations for each water qualityparameter. Special sampling results for metals and organics are presented in the lastsubsection., followed by the TSS and microbial data.
TDSFigure 17 shows feed and permeate TDS. These data indicate the RO membrane provided ahigh rejection of TDS. The average removal rate was 92.2%.
Figure 18 shows a log normal distribution of the permeate TDS data. The 95th percentile was62.6 mg/L and the RO membrane achieved the performance goal of < 100 mg/L at the 95th
percentile.
TOCFigure 19 shows feed and filtrate TOC. The average removal was 83.6%.
Figure 20 shows log normal distribution of the permeate TOC. The 90th percentile value is 1.38mg/L. These data indicate the RO membrane did not achieve the performance goal of permeateTOC <1 mg/L at the 90th percentile when treating the MF filtrate.
Nitrogen CompoundFigure 21 includes feed and permeate TKN concentrations. The average removal was >91%.
NH4-N feed and permeate concentrations are shown in Figure 22. The average removal was97.5%.
Figure 23 shows NO3-N feed and permeate concentrations. The RO membrane achieved aconsistently high nitrate rejection rate. Only three permeate NO3-N values were above themethod detection limit. The average removal was 98%.

King County Department of Natural Resources and Parks
June 2002 32 King County Water Reuse Demonstration ProjectReverse Osmosis Report (Final Report)
1
10
100
1000
Feb 03-02 Feb 07-02 Feb 11-02 Feb 15-02 Feb 19-02 Feb 23-02 Feb 27-02
mg/
L
Feed TDS Permeate TDS
Figure 17. Stage 2 - Feed and Permeate TDS
26.02
50%
37.29
75%
62.56
95%
10% 20% 35% 65% 80% 90% 99.9%0.1% 50%10.00
100.00
Percent of values less than of equal to indicated value
Perm
eate
TDS
(mg/
L)
Normal Values Permeate TDS
Figure 18. Stage 2 – Permeate TDS Log Normal Distribution

King County Department of Natural Resources and Parks
June 2002 33 King County Water Reuse Demonstration ProjectReverse Osmosis Report (Final Report)
TOC Method Detection Limit 0.5 mg/L
0.1
1
10
Feb 03-02 Feb 07-02 Feb 11-02 Feb 15-02 Feb 19-02 Feb 23-02 Feb 27-02
mg/
L
Feed TOC Permeate TOC
Figure 19. Stage 2 - Feed and Filtrate TOC
50%
1.27
75%
1.35
90%
1.38
10% 20% 35% 65% 80% 90% 99.9%0.1% 50%0.10
1.00
10.00
Percent of values less than of equal to indicated value
Perm
eate
TO
C (m
g/L)
Normal Values Permeate TOC
Figure 20. Stage 2 Permeate TOC Log Normal Distribution

King County Department of Natural Resources and Parks
June 2002 34 King County Water Reuse Demonstration ProjectReverse Osmosis Report (Final Report)
0.01
0.1
1
10
Feb 03-02 Feb 07-02 Feb 11-02 Feb 15-02 Feb 19-02 Feb 23-02 Feb 27-02
mg/
L
Feed TKN Permeate TKN
TKN Method Detection Limit 0.01 /L
Figure 21. Stage 2 - Feed and Permeate TKN
NH4-N Method Detection Limit 0.01 mg/L
0.001
0.01
0.1
1
10
Feb 03-02 Feb 07-02 Feb 11-02 Feb 15-02 Feb 19-02 Feb 23-02 Feb 27-02
mg/
L
Feed NH4-N Permeate NH4-N
Figure 22. Stage2 Feed and Permeate NH4-N

King County Department of Natural Resources and Parks
June 2002 35 King County Water Reuse Demonstration ProjectReverse Osmosis Report (Final Report)
0.01
0.1
1
10
100
Feb 03-02 Feb 07-02 Feb 11-02 Feb 15-02 Feb 19-02 Feb 23-02 Feb 27-02
mg/
L
Feed NO3-N Permeate NO3-N
NO3-N Method Detection Limit 0.02
Figure 23. Stage 2 Feed and Permeate NO3-N
Phosphorous CompoundsFigure 24 shows the feed and permeate TP concentrations. On February 20, 2002 the feed TPdecreased because alum pre-treatment was initiated on the MF unit feed. The addition of alumenhanced the MF unit’s ability to remove TP, which reduced the MF filtrate (RO feed) TPlevels. Before alum pre-treatment, the RO membrane achieved an average TP removal>99.7%. With alum pre-treatment, the average TP removal was >84.9% (lower than with noalum pre-treatment due to the lower feed TP concentration). The permeate TP levels were justabove the MDL or non-detectable.
A log normal distribution of the permeate TP is shown in Figure 25. The entire permeate TPdata set is included in this analysis. Permeate TP was 0.0067 mg/L at the 90th percentile, whichmet the performance goal of <0.02 mg/L at the 90th percentile. Note that the MDL for TP is0.005 mg/L.
Figure 26 shows feed and permeate PO4-P concentrations. Alum pre-treatment for the MF unitfeed had a similar impact on the RO unit PO4-P feed concentrations. Before alum pre-treatment, the RO membrane achieved an average PO4-P removal >99.9%. With alum pre-treatment, the average removal was >50%. This lower removal rate with alum pre-treatment isdue to a lower feed TP level in the RO feed. The permeate PO4-P concentration was just abovethe MDL or non-detectable.

King County Department of Natural Resources and Parks
June 2002 36 King County Water Reuse Demonstration ProjectReverse Osmosis Report (Final Report)
TP Method Detection Limit 0.005 mg/L
0.001
0.01
0.1
1
10
Feb 03-02 Feb 07-02 Feb 11-02 Feb 15-02 Feb 19-02 Feb 23-02 Feb 27-02
mg/
L
Feed TP Permeate TP
MDL
50 mg/L alum added to MF unit feed
Figure 24. Stage 2 Feed and Permeate TP
10% 20% 35% 65% 80% 90% 99.9%0.1% 50%0.00
0.01
Percent of values less than of equal to indicated value
Perm
eate
TP
(mg/
L)
Normal Values Permeate TP
50%
75%
90%
0.0067
0.0043
0.0032
Figure 25. Stage 2 Permeate TP Log Normal Distribution

King County Department of Natural Resources and Parks
June 2002 37 King County Water Reuse Demonstration ProjectReverse Osmosis Report (Final Report)
PO4-P Method Detection Limit 0.002 mg/L
0.001
0.01
0.1
1
10
Feb 03-02 Feb 07-02 Feb 11-02 Feb 15-02 Feb 19-02 Feb 23-02 Feb 27-02
mg/
L
Feed PO4-P Permeate PO4-P
MDL
50 mg/L alum added to MF unit feed
Figure 26. Stage 2 Feed and Permeate PO4-P
Metals and OrganicsOn January 29, 2002 grab samples of the BAF #2 effluent and RO permeate were analyzed formetals and organics. This was before the RO unit began continuous operation for Stage 2.However, to accommodate this special sampling, the RO unit was turned on for several hourson January 29, 2002 to collect the permeate sample.
Table 13 summarizes the metals data. The following metals were detected in the RO feed atconcentrations above the MDL: aluminum, barium, chromium, cobalt, copper, iron, lead,molybdenum, nickel, vanadium and zinc. The remaining metals analyzed in the feed werebelow the MDL. There were no detectable levels of metals in the RO permeate.
Total Suspended SolidsTotal suspended solids were measured on the feed and permeate. The average feed andpermeate levels were 2 mg/L and 1.5 mg/L, respectively.
MicrobiologicalHeterotrophic plate counts (HPC) and total Coliform (TC) levels were measured in grabsamples of the feed and permeate three days during Stage 2; one sample each day. The averagefeed and permeate HPC counts were 38,600 CFU/100 mL and 1,500 CFU/100 mL,respectively. The average feed TC level was only 16 CFU/100 mL. There was no evidence ofTC measured in the three permeate grab samples. The values reported by the countyEnvironmental Laboratory were 0 CFU/100 mL.

King County Department of Natural Resources and Parks
June 2002 38 King County Water Reuse Demonstration ProjectReverse Osmosis Report (Final Report)
Table 13. Stage 2 Feed and Permeate Metals
Parameter FeedConcentration
(mg/L)
PermeateConcentration
(mg/L)
MDL
(mg/L)Aluminum 0.0133 <0.002 0.002Antimony <0.0005 <0.0005 0.005Arsenic 0.0017 <0.0005 0.005Barium 0.00342 <0.0002 0.0002Beryllium <0.0002 <0.0002 0.0002Cadmium <0.0001 <0.0001 0.0001Chromium 0.0006 <0.0004 0.0004Cobalt 0.002 <0.0002 0.0002Copper 0.00953 <0.0004 0.0004Iron 0.071 <0.05 0.05Lead 0.00074 <0.0002 0.0002Molybdenum 0.00917 <0.0005 0.0005Nickel 0.00325 <0.0003 0.0003Selenium <0.0015 <0.0015 0.0015Silver <0.0002 <0.0002 0.0002Thallium <0.0002 0.00024 0.0002Vanadium 0.001 <0.0003 0.0003Zinc 0.0332 <0.0005 0.0005Mercury <0.00005 <0.00005 0.00005

King County Department of Natural Resources and Parks
June 2002 39 King County Water Reuse Demonstration ProjectReverse Osmosis Report (Final Report)
Table 14 shows that of all the organic compounds analyzed, both the feed and permeatesamples had non-detectable levels except methylene chloride.
Table 14. Stage 2 Feed and Permeate Organics
Parameter Feed Concentration (µg/l) Permeate Concentration (µg/l) MDL (µg/l)1,1,1-Trichloroethane <1 <1 11,1,2,2-Tetrachloroethane <1 <1 11,1,2-Trichloroethane <1 <1 11,1,2-Trichloroethylene <1 <1 11,1-Dichloroethane <1 <1 11,1-Dichloroethylene <1 <1 11,2-Dichloroethane <1 <1 11,2-Dichloropropane <1 <1 12-Butanone (MEK) <5 <5 52-Chloroethylvinyl ether <1 <1 12-Hexanone <5 <5 54-Methyl-2-Petanone (MIBK) <5 <5 5Acetone <2.5 <2.5 2.5Acrolein <5 <5 5Acrylonitrile <5 <5 5Benzene <1 <1 1Bromodichloromethane <1 <1 1Bromoform <1 <1 1Bromoethane <1 <1 1Carbon Disulfide <1 <1 1Carbon Tetrachloride <1 <1 1Chlorobenzene <1 <1 1Chlorodibromoethane <1 <1 1Chloroethane <1 <1 1Chloroform <1 <1 1Chloromethane <1 <1 1Cis-1,3-Dichloropropene <1 <1 1Ethylbenzene <1 <1 1Methylene Chloride 1.2 <1 1Styrene <1 <1 1Tetrachloroethylene <1 <1 1Toluene <1 <1 1Total Xylenes <1 <1 1Trans-1,2-Dichloroethylene <1 <1 1Trans-1,3-Dichloropropene <1 <1 1Trichloroflouromethane <1 <1 1Vinyl Acetate <5 <5 5Vinyl Chloride <1 <1 1

King County Department of Natural Resources and Parks
June 2002 40 King County Water Reuse Demonstration ProjectReverse Osmosis Report (Final Report)
Evaluation of Pilot Results
Effectiveness of Technology to Achieve Performance GoalsTable 15 summarizes performance goals and Stage 1 and Stage 2 results.
Table 15. Effectiveness of Process to Achieve Performance Goals
Goal Description Reliability Target Measured PerformancePercentile Stage 1 Stage 2
TDS Removal 95th <100 mg/L 109 mg/L 62.6 mg/LTurbidity Removal 95th <0.1 NTU Not Measureda Not Measureda
TOC Removal 90th <1 mg/L 1.56 mg/L 1.38 mg/LTP Removal 90th <0.02 mg/L 0.014 mg/L 0.0067 mg/L
Long-Term Flux Decline <2% per year Not Measuredb Not Measuredb
a no reliable turbidity measurement, little if any solids in the RO permeateb Unable to measure due to the pilot test duration
The performance of the RO for specific parameters is discussed below.
TDS RemovalThe RO membrane achieved the performance goal of <100 mg/L TDS at the 95th percentile forStage 2. However, for Stage 1, TDS removal was 109 mg/L at the 95th percentile. The data sethad only five data points for each test stage. With the caveat that the number of data points wassmall, it is anticipated that the RO membrane can the performance goal when treating MFeffluent.
Turbidity RemovalThis performance goal was not evaluated because turbidity could not be reliably measured inthe RO permeate. The permeate turbidity levels were below the measuring accuracy of theturbidimeter.
TOC RemovalThe RO membrane did not achieve the 90th percentile performance goal of <1 mg/L TOC. Theactual 90th percentile values were 1.56 and 1.38 mg/L for Stage 1 and 2, respectively.
TP RemovalThe RO membranes achieved the TP 90th percentile performance goal of <0.02 mg/L. Most ofthe permeate samples analyzed were below the detection limit of 0.005 mg/L.
Long-Term Flux DeclineThe clean-water performance data for both membranes were similar and indicated a goodrecovery of membrane performance after one chemical clean. However, to fully assess long-term flux decline, additional filtration/cleaning cycles need to be tested.

King County Department of Natural Resources and Parks
June 2002 41 King County Water Reuse Demonstration ProjectReverse Osmosis Report (Final Report)
Long-term flux decline would be evaluated in a pilot test by comparing the new membraneclean water flux to the post chemical cleaning clean water flux. Post-clean flux data from atleast two to three chemical cleans is recommended. A chemical clean is conducted when thesystem inlet pressure exceeds a specified set point (for the membrane used in this pilot study, atypical set point would be 400 psi).
Reliability ConsiderationsThe reliability of the RO membrane process to achieve the performance goals is described indetail in the previous results sections. The RO membrane reliably achieved the TDS and TPperformance goals. However, it did not achieve the TOC goal, for either test stage.
Pilot Unit ObservationsThe RO pilot unit system was simple and easy to operate. Throughout the testing, the Countyoperators recorded detailed comments on the pilot unit operation. These comments areincluded in Appendix B. The following summarizes the main observations recorded by theoperators.
The manual flow control required daily operator attention to maintain the target setpoints.
Because the RO membrane was not resistant to free chlorine, the operators had to shutdown the RO unit during Stage 1 when a maintenance clean was conducted on the MBRunit. The MBR maintenance clean included a backwash with chlorine solution.
Implementation
Design CriteriaThe intent of this pilot test was to demonstrate the ability of the RO membrane to removespecific pollutants from the feed stream while operating under “typical” plant conditions.Using only one brand of RO membrane, albeit one that is commonly used in reuse applications,flux, chemical addition and chemical cleaning were not optimized. Therefore, full-scaleimplementation of the RO membrane process will have to be based on previous experience andother pilot testing information. In general, for treating a feed stream similar to the MBReffluent or MF filtrate, a single module operating at 50 percent recovery would meet thepermeate water quality goals. A full-scale plant would likely be designed for an 85% recoveryusing a multi-stage design.
Full-scale design criteria for the RO membrane tested includes:
Operating Pressure: 100 to 400 psi.
Average Flux at 20 ºC: 9 gfd.

King County Department of Natural Resources and Parks
June 2002 42 King County Water Reuse Demonstration ProjectReverse Osmosis Report (Final Report)
System Recovery: 70 to 85 percent.
Design FeaturesThe following features would be included in a full-scale RO membrane application forenhanced nutrient removal of MBR or MF effluent.
Chemical Addition Facilities. Chemical feed facilities with automatic dosing controlfor antiscalant and acid addition and for chemical cleans.
Monitoring and Process Control. Provide on-line instrumentation to monitorpressure, flow and post acid-feed pH. Flow control will be automated to maintain apermeate flow rate design point.
Dechlorination. Because the RO membrane is not resistant to free chlorine,dechlorination facilities will be required for treating MF effluent, if chlorine is added tothe MF feed.
Residuals. The concentrated brine stream will require disposal. The stream can betoxic to receiving waters. Also, spent cleaning chemicals will require disposal. For afull-scale installation, it is anticipated that the brine and spent chemicals will bedischarged to the local sewer.
Effluent Blending. The RO permeate could be corrosive because most of the inorganicspecies will be removed by the membrane. If this is the case, blending the RO permeatewith a non-RO treated reuse stream may be considered to minimize the corrosive natureof the permeate.
Issues Not Resolved By Pilot Test Program The impact on permeate water quality by increasing the system recovery.
The impact on scaling using antiscalant and acid addition when treating MF effluent.
Operator experience with chemical cleaning an RO membrane.
The determination of nutrient removal was somewhat limited because many of thepermeate data points were below detection levels.
The determination of TDS removal was limited because there were only five data pointscollected for each test stage.
Long-term fouling could not be measured.
ReferencesBlack & Veatch, Inc., 2001 Model RO-2001 Pilot Unit Operations Manual.

King County Department of Natural Resources and Parks
June 2002 King County Water Reuse Demonstration ProjectReverse Osmosis Report (Final Report)
Appendix A - Test Plan Revisions, Test Plan and RO Unit OperationManual

King County Department of Natural Resources and Parks
June 2002 King County Water Reuse Demonstration ProjectReverse Osmosis Report (Final Report)
Appendix B - Pilot Unit Photos and Operator Comments

King CountyDepartment of Natural Resources and Parks
June 2002 1 King County Water Reuse Technology Demonstration ProjectReverse Osmosis Test Plan Revisions
Reverse Osmosis Test Plan Revisions Summary
IntroductionThis memorandum is a brief summary of the actual test conditions for the reverse osmosismembrane pilot unit. It focuses on changes and modifications from the last version of themicrofiltration membrane pilot test plan, Procedure H-08 Reverse Osmosis Operation Rev. 1Draft, October 16, 2001. This memorandum does not replace the test plan. The intent is forthe reader to reference it in conjunction with the test plan, which is also included in AppendixA.
The changes and modifications are summarized below. Each major heading corresponds to asection of the test plan affected.
Pilot Unit Description
Operating ConditionsThe percent recovery remained at 50% for all of the testing. Testing at 85% recovery wasdropped (see below).
Pilot Testing Objectives
Full-Scale ConsiderationsTesting at 85% recovery was not conducted because optimizing the system recovery was not amain objective of the pilot testing. Operating a single-element system at 50% recoveryprovided a permeate water quality similar to a full-scale system operated at 85% recovery.
Pilot Test Plan
OverviewPhase 1 and 2 are referred to as Stage 1 and 2 in the Reverse Osmosis Membrane AdvancedTreatment Memorandum (RO Report).
ScheduleTable 1 summarized the anticipated test phases and individual test runs to be conducted. Eachrun was to address treating either MBR effluent or MF unit effluent. For the MBR effluenttesting, the MBR feed stream would always be West Point WWTP primary influent. However,the feed to the MF unit could have included BAF #1 effluent or BAF #2 effluent. Due tochanges in the anticipated schedule for operating the upstream unit processes, many of theanticipated runs were not conducted. Also, the runs designated for 15% system recovery weredropped. The conditions actually tested are listed below.

King CountyDepartment of Natural Resources and Parks
June 2002 2 King County Water Reuse Technology Demonstration ProjectReverse Osmosis Test Plan Revisions
Phase 1 (Stage 1): MBR effluent, Run 1.
Phase 2 (Stage 2): BAF #2, Run 7.
Sampling
OperationalThe County operators measured the SDI on each feed twice for each test stage, instead of twiceper week.
To limit the number of special tests conducted by the County Environmental Laboratory,special testing on the recycle stream was not conducted.
Sampling PlanThe sampling plan included in the test plan was an estimation of the schedule and timing forvarious parameters measured. However, the actual test schedule changed from week to week.Beginning in December 2001, the actual sampling plan for all of the pilot units was updated bythe County weekly and reviewed by the consultant team.
AppendicesThe appendices included in the original test plan are no longer provided in this Appendix. Thesampling plan was updated regularly as noted above. The data management system ROOperation Data Sheet can be found in the County’s data management system files.

King CountyDepartment of Natural Resources and Parks
June 2002 1 King County Water Reuse Technology Demonstration ProjectReverse Osmosis Test Plan_V1b
Reverse Osmosis Test PlanRO Test Plan Rev. 1b Draft
October 16, 2001
Background and Purpose
The reverse osmosis (RO) unit, supplied by Black & Veatch (B&V), is one of eight unitprocesses to be tested during the King County Water Reuse Demonstration Project. It is beingtested as an advanced treatment step (i.e., post tertiary filtration) and will treat various sources oftertiary effluent during the overall testing program. The unit arrived on site the week of August27. The B&V startup engineer started it up the week of September 17. This unit will be on sitefor six months: months 4 through 9 of the overall testing program.
The Water Reuse Demonstration Project, Test Plan, Rev. 2, August 15, 2001 depicts the “bigpicture” testing program for all eight pilots units and the entire nine-month testing program. Itsummarizes the performance goals for each test unit. This unit-specific test plan provides adetailed road map for operating the RO unit to meet the objectives of the overall testing program.
Pilot Unit Description
The Model RO-2001 Pilot Unit Operations Manual, Black & Veatch, August 2001 provides adetailed description of the pilot unit.
Modes of OperationThe unit operates in the follow modes:
• Normal Operation: Normal operation occurs when water is passed through themembrane. With a spiral-wound membrane cartridge configuration, backwashing is notdone. To minimize fouling, acid and an anti-scalant is added to the feed stream.
• Membrane Cleaning: When the pressure drop across the membrane increases by 15percent, the membrane is taken off line and cleaned. The cleaning protocol includes alow-flow recirculation step followed by high-flow recirculation.
Membrane CharacteristicsBlack & Veatch selected a reverse osmosis membrane that has performed well on other reuseprojects. Only one membrane type will be used throughout the testing. The membrane selectedis manufactured by Koch/Fluid Systems. The membrane characteristics are listed below:
• Model No.: TFC 4820 HR• Material: polyamide, thin-film composite• Active filter area: 78 square feet (sf)

King CountyDepartment of Natural Resources and Parks
June 2002 2 King County Water Reuse Technology Demonstration ProjectReverse Osmosis Test Plan_V1b
• Module size: 4 inches wide by 40 inches long
The RO unit was shipped with one spare RO membrane.
It should be noted that this membrane is not resistant to free chlorine. Based on recentexperience at other plants, this membrane can handle chloramine concentrations up to 5 ppm.
For this project, the feed streams to the RO unit must not contain any free chlorine. Feedchloramine concentrations should be below 5 ppm.Instrumentation and ControlRefer to the PI&D in the back of the O&M manual for details on the RO unit instrumentation.All valves and instruments are controlled manually. The County operators will record allinstrument readings manually.
Operating ConditionsBased on the startup data collected the week of September 17, the RO unit operating conditionswill be as follows:
• Permeate flow: 0.6 gpm• Membrane flux: 11 gfd• Recirculation Flow: 6.5 gpm• Concentrate Flow: 0.6 gpm• System Recovery: 50%• Anti-scalant Feed: 2.25 gpm• Anti-scalant: Argo Scientific/Betz Dearborn AF 150 UL, 7,000 mg/l stock solution• Anti-scalant chemical feed pump: Feed stock solution at 90 ml/min into the 1.2 gpm feed
stream.
With the exception of system recovery, it is not anticipated that these operating conditions willchange for the six months of testing. The system recovery may be increased to 85% for full-scale considerations, which are discussed in a subsequent section of this Plan.
Under these conditions, the RO unit will be able to demonstrate that this technology can providea permeate water quality that meets the water quality goals for groundwater, stream and lakedischarge.
In order to maintain these operating conditions, the County operators will need to adjust thefollowing about every other day:
• Permeate flow: controlled by the booster pump speed on the electrical panel• Recycle (recirculation) flow: controlled by valve MV-5.• Concentrate flow: controlled by valve MV-4 with MV-3 (high flow range) valve closed.• Anti-scalant feed rate: check the feed pump output and adjust as needed to maintain 90
ml/min.

King CountyDepartment of Natural Resources and Parks
June 2002 3 King County Water Reuse Technology Demonstration ProjectReverse Osmosis Test Plan_V1b
Pilot Testing Objectives
The pilot testing objective will be to determine the ability of the RO unit to meet nutrientremoval requirements focused on permeate nitrogen and phosphorous limits.
Key performance questions for the RO unit are:
• What nutrient and TDS removal rates can be achieved?• What is the head loss across membrane, transmembrane pressure (TMP)?• What is the achievable flux rate?• What recovery rate can be achieved?• What are the long-term fouling characteristics?
The specific performance goals are listed below.
• Effluent TDS < 100 mg/L, 95th percentile• Effluent turbidity < 0.5 NTU, 95th percentile• Effluent total phosphorous (TP) concentration <0.02 mg/L, 90th percentile• Effluent TOC <1 mg/L, 90th percentile• Less than 2% long-term flux decline per year.
Full-Scale ConsiderationsThe results from this testing will provide reliable flux- and recovery-rates for consistenttreatment performance. With the recovery at only 50% and only using a single module, theresults from other full-scale systems and pilot studies will be used in conjunction with the datafrom this project to determine the recovery for a full-scale treatment train.
Since full-scale plants typically operate at a total plant recovery of 85%, the pilot unit will beoperated at 85% recovery for a seven-day period during several of the test runs. This willprovide some additional information on the permeate water quality at 85% recovery conditions.
Pilot Test Plan
Overview
The RO unit pilot testing will include the two phases listed below. Each phase is based on thefeed stream to the unit, which will come either from the MBR or the MF unit.
Startup – This was completed the week of September 17. The system is operating asexpected and the operating conditions have been established for the remainder of thetesting. It is not expected that the operating conditions will change between test phases.
Phase 1 – Nutrient removal demonstration with MBR filtrate.

King CountyDepartment of Natural Resources and Parks
June 2002 4 King County Water Reuse Technology Demonstration ProjectReverse Osmosis Test Plan_V1b
Phase 2 – Nutrient removal demonstration with MF filtrate.
Test Conditions
Startup has been completed and the system will run per the aforementioned operating conditionswhile treating both feed streams. The unit will be operated in a constant flow condition whilemonitoring an increase in TMP as the membrane fouls.
Schedule
Table 1 depicts the testing schedule for the RO unit. It is based on 23 weeks of testing to becompleted at the end of Month 9, February 2002. There are four runs for treating the MBRfiltrate and six runs for treating the MF filtrate.

King CountyDepartment of Natural Resources and Parks
June 2002 5 King County Water Reuse Technology Demonstration ProjectReverse Osmosis Test Plan_V1b
Table 1. Test Phases and Schedule
Phase RunExpected Duration Weekly Schedule(1)
1 - MBR EffluentNutrient Removal
1 - MBR treating WP PE & WP PI, Nit/Denit Mode, 50% REC
5 weeks Weeks 1 - 5: 9/24 to 10/28
2 - MBR treating WP PE & WP PI, Nit/Denit Mode15% REC
1 week Week 6: 10/29 to 11/4
2 - MF EffluentNutrient Removal
3 - MF Filtrate from treating BAF 1 effluent.BAF 1 treating WP PE (2) 50% REC
3 weeks Weeks 7 - 9: 11/5 to 11/25
4 - MF Filtrate from treating BAF 1 effluent.BAF 1 treating WP PE (2) 15% REC
1 week Week 10: 11/26 to 12/2
5 - MF Filtrate from treating BAF 1 effluent.BAF 1 treating DND PE 50% REC
2 weeks Weeks 11 - 12: 12/3 to 12/16
6- MF Filtrate from treating BAF 2 effluent.BAF 1 treating DND PE. 50% REC
9 days Weeks 13 - 14: 12/17 to 12/27
7 - MF Filtrate from treating BAF 2 effluent.BAF 1 treating WP PE. 50% REC
4 weeks Weeks 15 - 18: 12/31 to 1/27
8 - MF Filtrate from treating BAF 2 effluent.BAF 1 treating WP PE. 15% REC
1week Week 19: 1/28 to 2/3
1 - MBR EffluentNutrient Removal
9 - MBR treating WP PI, Bio P mode50% REC
3 weeks Weeks 20 - 22: 2/4 to 2/24
10 - MBR treating WP PI, Bio P mode15% REC
4 days Week 23: 2/25 to 2/28
Notes:(1) Week 1 starts on September 24th. Startup was completed on September 21st.(2) Assumes FF1 will not be supplying PE to BAF 1. Still using WP PE to supply BAF 1.
BAF 2 will not be ready to supply the MF unit until December.WP PE: West Point Primary Effluent
WP PI: West Point Primary InfluentDND PE Densadeg Unit Primary Effluent
Sampling
Sampling and analysis to track the RO unit performance is presented herein. The samplingefforts include operational sampling, special tests and water quality goals sampling.
OperationalParameters to be measured to address the operating performance of the RO unit include pH,temperature, conductivity, flow and pressure. The values will be recorded the by operators dailyusing the daily operator log included in the O&M Manual. The operators will also measure thesilt density index (SDI) on the feed twice a week.
The following parameters will also be measured with analyses to be done by the King CountyEnvironmental Lab:
• TOC• TDS• Fouling Indices/Recovery Limitations
• Alkalinity• Nitrate

King CountyDepartment of Natural Resources and Parks
June 2002 6 King County Water Reuse Technology Demonstration ProjectReverse Osmosis Test Plan_V1b
• pH• Special Test
It is expected that TOC will be measured twice a week and TDS will be measured once a weekon the feed and permeate. The alkalinity, nitrate, pH and special tests will be conducted once foreach of the ten test runs to characterize the fouling characteristics of the feed, the concentrateand, when recycling the concentrate (50% recovery mode) the raw/recycle blend. A permeatesample will also be included so a mass balance on fouling constituents can be determined.
The special test will include the following parameters:
• Calcium• Magnesium• Sodium• Potassium• Iron (total and dissolved)• Manganese• Barium (with a detection limit down to 0.01 mg/L)• Strontium• Aluminum• Chloride• Sulfate• Fluoride• Silica (total and dissolved)
Water QualityThe following parameters will be measured, with analysis done by the King CountyEnvironmental Lab, to assess the ability of the RO unit to meet water quality goals:
• NH4
• TKN• NO2 + NO3
• Ortho P• Metals• Organics (including SOCs and VOCs)
With the exception of metals and organics, the water quality parameters will be measured threetimes a week on the feed and permeate. Metals and organics will be measured on the feed andpermeate, but only once during a given test run. The schedule for collecting and performing theanalyses for all of the samples handled by the Environmental Lab is discussed in the followingsection.
Sampling PlanThe sampling plan for the Environmental Lab is detailed in Table 1 of the Appendix. The tableidentifies the number of samples for each parameter collected each day.

King CountyDepartment of Natural Resources and Parks
June 2002 7 King County Water Reuse Technology Demonstration ProjectReverse Osmosis Test Plan_V1b
The sample location labels are as follows:
• RO Influent from MF, auto sampler S10• RO Influent from MBR, auto sampler S12• RO permeate auto sampler: S13• RO concentrate grab sample 13g• RO blend (feed plus recycled concentrate) grab sample 13b
ROLES AND RESPONSIBILITIES
The County will operate the RO unit, maintain the daily data collection, conduct the SDI testtwice per week, and collect all samples for analysis by the Environmental Lab.
The County will also maintain the project data management system to include the data obtainedfor the RO unit. The consultant team (HDR and Black & Veatch) will evaluate the data anddistribute the information to the project team. It is anticipated that two conference calls permonth will be held to discuss the overall testing program. These calls will include the status anddata review for the RO unit. On an as-needed basis, the County will coordinate a conference callwith Scott Freeman of Black & Veatch. If possible, these calls will include all project teammembers listed in the subsequent contacts section. However, since it is difficult to coordinatecalls for a large group of people, the level of participation may vary to reduce the coordinationeffort. At a minimum, Bob Bucher and J. B. Neethling or Michael Norton will participate inthese calls.
DATA MANAGEMENT
County operators will fill out the daily log sheet to record specified operating parameters. Thedata from the Environmental Lab will be logged into standard excel spreadsheets that will bekept on the County’s network servers for access by County staff. This data will also betransferred into the project data management system (DMS) by County staff.
Data collected by the County operators will be entered in the RO operation data sheet by Countystaff. In this way lab data and manually recorded operating conditions will be maintained in theDMS and accessed via the RO operation data sheet.
CONTACTS
Since this testing is expected to require midstream adjustments, it is important to maintainfrequent communications between King County, the consultant team (HDR and Black & Veatch)and the vendor. The following is a list of the project team members.
King CountyBob Bucher
King CountyDepartment of Natural Resources and Parks
June 2002 8 King County Water Reuse Technology Demonstration ProjectReverse Osmosis Test Plan_V1b
206-263-3883, [email protected]
John Smyth206-684-1774, [email protected]
HDRJB Neethling, Sacramento916-351-3830, [email protected]
Mike Norton, Seattle425-450-6250, [email protected]
Mario Benisch, Portland, DMS coordination503-768-3768, [email protected]
Black & Veatch (Consultant Team)Cindy Wallis-Lage, Kansas City913-458-3603, [email protected]
Black & Veatch (Vendor)Scott Freeman, Kansas City913-458-3421, [email protected]

King CountyDepartment of Natural Resources and Parks
June 2002 9 King County Water Reuse Technology Demonstration ProjectReverse Osmosis Test Plan_V1b
APPENDIXTable 1. Sampling Plan
(see separate Excel workbook “RO sampling plan_Oct1Feb v1.xls”worksheet “RO all” emailed with this file)
DMS RO Operation Data Sheet(to be provided in the next version of the Test Plan)
King CountyDepartment of Natural Resources and Parks
June 2002 10 King County Water Reuse Technology Demonstration ProjectReverse Osmosis Test Plan_V1b

Comments
Date Comments (Operator Data Sheet) Comments (Log Book)8/29/2001 Black and Veatch RO skid arrived.8/30/2001 Skid uncrated and set in place. Electrical contractor noted problem with
feed power connection. Primary neutral included - transformer not providing secondary side neutral. Transformer will have to be replaced. Mechanical connections (hoses) ordered.
8/31/20019/6/20019/7/20019/8/20019/9/20019/10/2001 Resolved problem with transformer. Con reconfigured existing
transformer to provide secondary side neutral. Black & Veatch (Scott Freeman) provided necessary documentation to perform work.
9/11/2001 Resolved problem with transformer. Con reconfigured existing transformer to provide secondary side neutral. Black & Veatch (Scott Freeman) provided necessary documentation to perform work.
9/12/2001 Resolved problem with transformer. Con reconfigured existing transformer to provide secondary side neutral. Black & Veatch (Scott Freeman) provided necessary documentation to perform work.
9/13/2001 Resolved problem with transformer. Con reconfigured existing transformer to provide secondary side neutral. Black & Veatch (Scott Freeman) provided necessary documentation to perform work.
9/14/2001 Resolved problem with transformer. Con reconfigured existing transformer to provide secondary side neutral. Black & Veatch (Scott Freeman) provided necessary documentation to perform work.
9/15/20019/16/20019/17/2001 Electrical contractor completed reconfiguration of transformer by late
afternoon. Black & Veatch onsite (Scott Freeman and Patty Buchanan) for skid startup. Mechanical hoses to and from skid installed.
9/18/2001 Performed water checkouts on skid with "dummy" RO module. Both Scott and Patty onsite during day. At the end of the day, discovered that emergency stop button does not shutdown pumps when they are in the "manual" operating mode. Black & Veatch investigating
RO Report App B Operator Log Page 1of 9 9/19/2002

Comments
Date Comments (Operator Data Sheet) Comments (Log Book)9/19/2001 Black & Veatch onsite (Patty and Scott) to continue startup. Switched feed
water source from potable water (used during checkouts) to MBR effluent. RO module was installed. Provided with wiring revision to allow Emergency stop to secure feed and booster
9/20/2001 RO feed is from MBR (treated effluent). RO element is Koch/Fluid Systems TFC 4820 hr (s/n KM809720-1088).
[MBR EFFLUENT OFFICIAL START]
Arranged for Electrical contractor to perform emergency stop switch wiring. Will not be performed until 0730 hrs tomorrow (9/21). Operated unit throughout day on MBR effluent. Plan to run overnight. Modified feed tankto provide additional overflow cap
9/21/2001 At 1920 hrs united secured during MBR maintenance clean. Allowed MBR feed to drain for 15 minutes.
9/22/2001 No changes9/23/2001 No changes. Working on install of S11/S13 sampler. Plan to use 2L
overflow container and standard autosampler.9/24/2001 At 1530 hrs disconnected to perform MBR maintenance clean,
returned feed at 1621 hrs.No comments.
9/25/2001 No comments.9/26/2001 No comments.9/27/2001 At 1702 hrs adjusted booster pump speed (permeate flow) and
MV-4 (concentrate flow) to setpoint targets.No comments.
9/28/2001 No comments.9/29/2001 No comments.9/30/2001 Composite sampler will be started on 10/1 (grab sample on 10/1
for process lab).No comments.
10/1/2001 Unit secured from 1226 hrs to 1330 hrs for MBR maintenance clean.
At 1226 hrs secured skid per planned shutdown process. Secured during maintenance clean on the MBR unit. Plan restart at 1330 hrs. Process lab conductivity measurement: S12 (feed from MBR) = 956 ps/cm, S13 (RO effluent) = 17 ps/cm. At 1635 hrs confirm
10/2/2001 At 1033 hrs suspect previous problem with dosing pump (air in supply line).
At 1033 hrs noted antiscalant tank level has dropped from 6.75 gal - 6 gal. Expect that over the last 10 days, flow has not been delivered to feed water due to bubbles in dosing pump line. To confirm. Checks of dosing. At 1245 hrs discovered unit had
10/3/2001 At 1515 hrs following flow adjustments to match targets. At 1575 hrs adjusted process flows. Recycle flow: 7.4 to 6.5 gpm. Low range concentration flow: 0.55 to 0.6 gpm.
10/4/2001 No comments.10/5/2001 No comments.
RO Report App B Operator Log Page 2of 9 9/19/2002

Comments
Date Comments (Operator Data Sheet) Comments (Log Book)10/6/2001 No comments.10/7/2001 At 1030 hrs adjusted recycle flow from 7 to 6.5 gpm. At 1031
hrs adjusted concentrate flow from 0.58 to 0.6 gpm. At 1032 hrs adjusted permeate flow from 0.55 to 0.6 gpm.
Setup S11/S13 sampler and overflow container. Ready to start except for power to sampler. Will purchase power cord pigtail and install tomorrow. At 1330 hrs refilled antiscalant tank (used 120 mL).
10/8/2001 At 1612 hrs adjusted flows. System secured due to MBR effluent at loss.
At 1615 hrs unit shutdown due to loss of MBR effluent feed flow. MBR permeate off due to drop in aerobic tank level - primary effluent feed OFF for LEL detector calibration. At 1640 hrs unit started back up. MBR in production.
10/9/2001 No comments.10/10/2001 No comments.10/11/2001 At 1530 hrs adjusted permeate flow back to 0.6 gpm. MV-2
opened slightly to decrease permeate pressure. Booster pump speed increased to increase permeate flow.
No comments.
10/12/2001 At 0932 hrs no permeate flow to sampler. No comments.10/13/2001 No comments.10/14/2001 At 0630 hrs filled antiscalant tank with 5 gallons of DI water and
120 mL antiscalant.At 0630 hrs refilled antiscalant tank. 5 gal DI water and 120 mL antiscalant.
10/15/2001 At 1235 hrs secured RO skid in support of MBR cleaning. At 1625 hrs restarted RO skid following MBR maintenance.
10/16/2001 No comments.10/17/2001 At 0923 hrs unit shutdown for MC1 clean of MBR; followed
panel shutdown procedures. Back online at 1030 hrs.No comments.
10/18/2001 At 1025 hrs - secured RO skid to support MBR cleaning restarted at 1135 hrs. At 1137 hrs adjusted permeate flow to achieve 0.6 gpm.
10/19/2001 At 1136 hrs adjusted permeate flow to 0.6 gpm. At 1450 hrs adjusted permeate flow to 0.6 gpm.
No comments.
10/20/2001 At 0847 hrs adjusted permeate flow. No comments.10/21/2001 At 1001 planned shutdown to facilitate MBR maintenance clean.
At 1124 hrs back online.Refilled antiscalant tank.
10/22/2001 At 1001 hrs planned shutdown to facilitate MBR maintenance clean; back online at 1124 hrs.
10/23/2001 No comments.10/24/2001 Planned shutdown of skid to facilitate MBR maintenance clean; back
online at 1124 hrs.10/25/2001 Antiscalant level not dropping - need to check into. Low permeate flux and
high permeate psi, need to check.
RO Report App B Operator Log Page 3of 9 9/19/2002

Comments
Date Comments (Operator Data Sheet) Comments (Log Book)10/26/2001 No comments.10/27/2001 At 0856 hrs adjusted permeate flow up to 0.6 gpm from 0.52
gpm.No comments.
10/28/2001 At 0832 hrs filled antiscalant tank with 5 gal of RO quality water (from process lab) and 120 mL antiscalant. Pre-fill reading of 2 gallons. Post-fill reading of 7 gallons.
10/29/2001 Secured unit to facilitate MBR cleaning at 0907 hrs. Back online at 1017 hrs.
10/30/2001 No comments.10/31/2001 Secured unit for MBR maint clean at 1113 hrs. Back online at
1215 hrs.Unit offline during MBR Citric acid clean (approximately 1 hr).
11/1/2001 At 0945 hrs adjusted flows (recycle flow, low range concentrate flow, and permeate flow) after recording data. At 0941 hrs secured unit for MBR work. At 1018 hrs restarted unit.
No comments.
11/2/2001 At 0115 hrs unit not running. At 0835 hrs adjusted permeate flow after taking reading.
Unit offline during following periods: from 0100 to 0200 hrs (MBR permeate off due to PI feed pump tripped out on overload), 1010hrs to 1110 hrs (MBR unit clean with HOCl). Setup for SDI measurement of feed water (MBR permeate). Plant to perform SDI on
11/3/2001 No comments.11/4/2001 No comments.11/5/2001 Secured unit for MBR maintenance clean at 0933 hrs. Back
online at 1110 hrs.Filled antiscalant tank (initial tank level was 0.1 gals, final tank level of 7 gals) added 6 gals of H2O and 137 mL antiscalant. Planned shutdown for MBR maintenance clean at 0935 hrs.
11/6/2001 At 1000 hrs adjusted flows after readings taken. No comments.11/7/2001 Planned shutdown to facilitate MBR maintenance clean at 1028
hrs. Back online at 1120 hrs.No comments.
11/8/2001 At 1356 hrs adjusted flows after readings. No comments.11/9/2001 Planned shutdown to facilitate MBR maintenance clean at 0930
hrs. Back online at 1044 hrs.Performed SDI test on RO feed using feed 2 sample tap.
11/10/2001 At 0835 hrs discovered offline - no MBR feed (most likely since last evening at approximately 1900 hrs). At 0935 hrs restarted unit.
No comments.
11/11/2001 No comments.11/12/2001 No comments.
RO Report App B Operator Log Page 4of 9 9/19/2002

Comments
Date Comments (Operator Data Sheet) Comments (Log Book)11/13/2001 At 1025 hrs added 5 gal DI and 120 mL antiscalant. At 0840 hrs unit secured due to loss of MBR permeate flow (WS1/3
empty). Back online by 0930 hrs. At 1020 hrs added 5 gal RO quality water and 120 mL antiscalant to antiscalant feed tank. Now at 7 gal level.
11/14/2001 At 1149 hrs secured unit for MBR chlorination clean. At 1545 hrs unit back online.
At 1149 hrs unit secured for MBR chlorination clean. At 1545 hrs restarted unit following MBR clean.
11/15/2001 No comments.11/16/2001 No comments.11/17/2001 No comments.11/18/2001 No comments.11/19/2001 Shutdown process to facilitate MBR maintenance clean at 0914
hrs. Back in service at 1110 hrs.No comments.
11/20/2001 No comments.11/21/2001 At 0911 hrs shutdown process to facilitate MBR maintenance
clean, back online at 1008 hrs.No comments.
11/22/2001 No comments.11/23/2001 No comments.11/24/2001 No comments.11/25/2001 Adjusted permeate flow at 0910 hrs. No comments.11/26/2001 Planned shutdown for MBR maintenance clean, started at 0834
hrs, back online at 0954 hrs.No comments.
11/27/2001 At 0910 hrs, adjusted flows after recording values. No comments.11/28/2001 At 0938 hours planned shutdown for MBR maintenance clean. Added 5 gallons of RO quality H2O + 120 mL antiscalant. Final level was
7 gallons.11/29/2001 No comments.11/30/2001 No comments.12/1/2001 No comments.12/2/2001 No comments.12/3/2001 At 08?? Hours unit down for MBR maintenance work and
maintenance clean. Back online at 1117 hrs. At 1132 hrs adjusted permeate flow.
No comments.
12/4/2001 At 0700 hrs increased permeate flow. No comments.12/5/2001 At 1042 hrs planned shutdown to facilitate MBR maintenance
clean. Back online at 1147 hrs.At 1040 hrs added 5 gallons of RO PH2O plus 120 mL antiscalant, final level of 7 gallons.
RO Report App B Operator Log Page 5of 9 9/19/2002

Comments
Date Comments (Operator Data Sheet) Comments (Log Book)12/6/2001 Offline due to MBR being down. RO back online at 1217 hrs.
Adjusted recycle flow to 6.5 at 1227 hrs. Adjusted permeate flow to 0.6 at 1228 hrs.
No comments.
12/7/2001 S13 grab. Adjusted permeate flow to 0.6 at 0717 hrs and recycle flow to 6.5. Adjusted permeate flow to 0.60 and 6.5 for recycle flow at 1714 hrs.
No comments.
12/8/2001 Adjusted permeate flow to 0.6 at 0916 hrs. Adjusted permeate flow to 0.6 and recycle flow to 6.5 at 2245 hrs.
No comments.
12/9/2001 Adjusted permeate flow to 0.6 and recycle flow to 6.5 at 0450 hrs. Started sampler at 0900 hrs. Adjusted permeate flow to 0.6 at 1850 hrs.
No comments.
12/10/2001 S13 sample grab. At 0747 hrs adjust MV4 (concentrate flow) to 0.6 gpm. Planned shutdown to facilitate MBR maint clean at 1008 hrs. Back online at 1110 hrs.
No comments.
12/11/2001 Adjusted flows following data record at 0940 hrs. No comments.12/12/2001 Planned shutdown for MBR clean at 1102 hrs. Back online at
1212 hrs.No comments.
12/13/2001 Adjusted flows following data record at 1001 hrs. 1450 hrs - Filled antiscalant tank
At 1450 hrs added 5 gallons of RO PH2O plus 120 mL antiscalant, final level of 7 gallons.
12/14/2001 Adjusted flows following data record at 0927 hrs. 1430 hrs - Secured unit for MBR Maint Clean.
No comments.
12/15/2001 1440 hrs - Adjusted Permeate flow to 0.6; Recycle flow to 6.5 No comments.12/16/2001 Adjusted concentrate flow to 0.6 following data record at
0936hrs. No comments.
12/17/2001 Planned shutdown for MBR clean at 0902 hrs. Back online at 1026hrs.
No comments.
12/18/2001 No comments.12/19/2001 Planned shutdown for MBR clean at 1452 hrs. Back online at
1605 hrs.No comments.
12/20/2001 Adjusted permeate flow @ 1515 hrs. At 0920 hrs added 5 gallons of RO PH2O plus 120 mL antiscalant, final level of 7 gallons.
12/21/2001 Planned shutdown for MBR clean at 1206 hrs. Back online at 1323 hrs. Adjusted flows @ 1151 hrs & 1750 hrs
No comments.
12/22/2001 1445 Hrs - Adjusted permeate flow to 0.6; Recycle flow dropped to 6.5
No comments.
12/23/2001 No comments.
RO Report App B Operator Log Page 6of 9 9/19/2002

Comments
Date Comments (Operator Data Sheet) Comments (Log Book)12/24/2001 No comments.12/25/2001 No comments.12/26/2001 No comments.12/27/2001 Added 5 gallons of RO PH2O plus 120 mL antiscalant, final level of 7
gallons.12/28/2001 No comments.12/29/2001 No comments.12/30/2001 No comments.12/31/2001 0724 - Adjusted permeate flow to 0.6; raised recycle flow to 6.5;
1340 hrs - 1500 hrs Unit secured for MBR Maint Clean.Secured unit to facilitate MBR cleaning from 1340 - 1500 hrs.
1/1/2002 1840 hrs - Adjusted Permeate, Recycle, and Concentrate flow No comments.1/2/2002 1007 - Planned shutdown for MBR Maint Clean; BIS 2 1110 hrs;
0030 hrs - Adjusted Permeate, Recycle, and concentrate flowsAdded 5 gallons of RO PH2O plus 120 mL antiscalant, final level of 7 gallons.
1/3/2002 1620 hrs - Adjusted concentrate flow No comments.1/4/2002 0948 hrs - Planned shutdown to facilitate MBR Maint Clean; BIS
1051 hrs; RO shutdown due to high vacuum alarm on MBRNo comments.
1/5/2002 No comments.1/6/2002 No comments.1/7/2002 No comments.1/8/2002 0830 hrs - Antiscalant turned OFF. 0835 hrs - Secured antiscalant dosing pump. Conference call with
consultants led to decision not to operate with antiscalant for remainder of testing with MBR effluent
1/9/2002 0847 hrs - Planned shutdown to facilitate MBR Maint Clean; BIS @ 1054 hrs.
1/10/2002 0200 -1030 hrs - Unit shutdown due to MBR permeate pump failure. ~1045 hrs- Unit back on line with MBR effluent feed.
1/11/20021/12/2002 ~0100 hrs - Unit shutdown due to MBR failure.1/13/2002 1145 hrs - Adjusted flows following readings logged-
concentrate flow and permeate0940 hrs - Shut OFF RO unit (still not restarted from MBR failure) and plan to restart midday after MBR has a chance to operate for several hours; 1050 hrs - Started unit with HIGH RANGE concentrate valve open to 8 gpm ( for 1 min)
1/14/2002 1034 hrs - Planned shutdown to facilitate MBR Maint Clean; BIS @ 1230 hrs; Adjusted flows at 1230 hrs.
[restart unit]
RO Report App B Operator Log Page 7of 9 9/19/2002
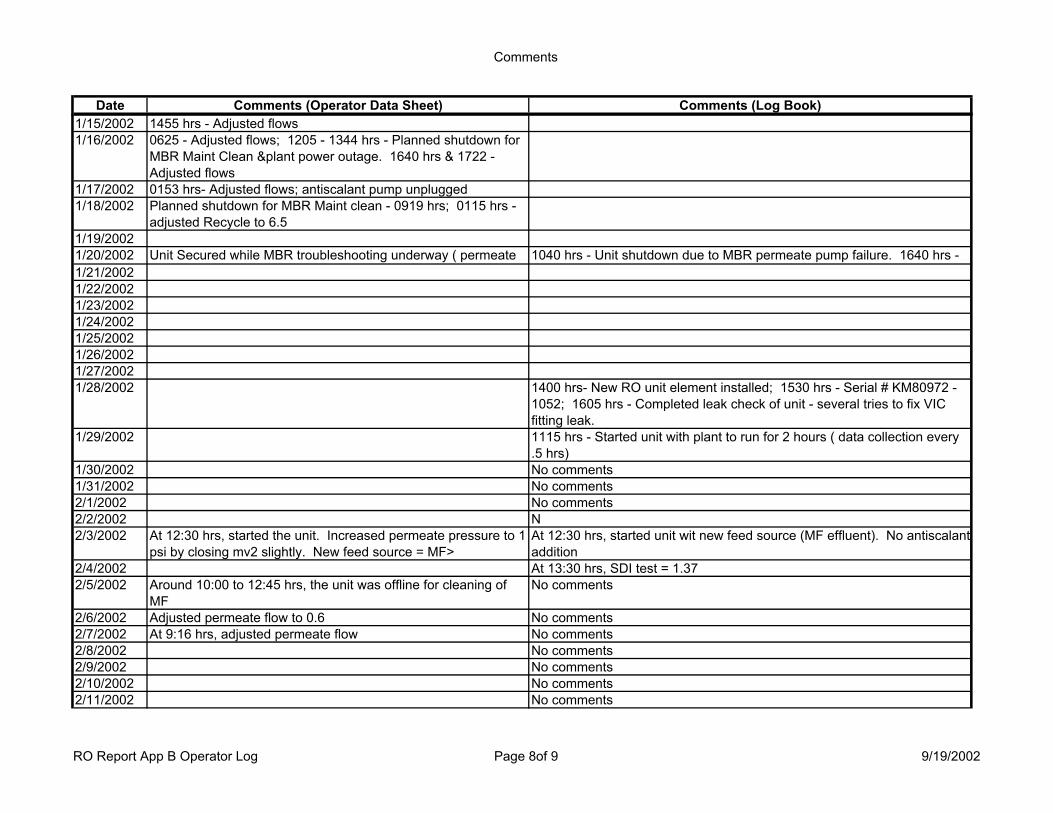
Comments
Date Comments (Operator Data Sheet) Comments (Log Book)1/15/2002 1455 hrs - Adjusted flows1/16/2002 0625 - Adjusted flows; 1205 - 1344 hrs - Planned shutdown for
MBR Maint Clean &plant power outage. 1640 hrs & 1722 - Adjusted flows
1/17/2002 0153 hrs- Adjusted flows; antiscalant pump unplugged1/18/2002 Planned shutdown for MBR Maint clean - 0919 hrs; 0115 hrs -
adjusted Recycle to 6.51/19/20021/20/2002 Unit Secured while MBR troubleshooting underway ( permeate 1040 hrs - Unit shutdown due to MBR permeate pump failure. 1640 hrs - 1/21/20021/22/20021/23/20021/24/20021/25/20021/26/20021/27/20021/28/2002 1400 hrs- New RO unit element installed; 1530 hrs - Serial # KM80972 -
1052; 1605 hrs - Completed leak check of unit - several tries to fix VIC fitting leak.
1/29/2002 1115 hrs - Started unit with plant to run for 2 hours ( data collection every .5 hrs)
1/30/2002 No comments1/31/2002 No comments2/1/2002 No comments2/2/2002 N2/3/2002 At 12:30 hrs, started the unit. Increased permeate pressure to 1
psi by closing mv2 slightly. New feed source = MF> At 12:30 hrs, started unit wit new feed source (MF effluent). No antiscalant addition
2/4/2002 At 13:30 hrs, SDI test = 1.372/5/2002 Around 10:00 to 12:45 hrs, the unit was offline for cleaning of
MFNo comments
2/6/2002 Adjusted permeate flow to 0.6 No comments2/7/2002 At 9:16 hrs, adjusted permeate flow No comments2/8/2002 No comments2/9/2002 No comments2/10/2002 No comments2/11/2002 No comments
RO Report App B Operator Log Page 8of 9 9/19/2002

Comments
Date Comments (Operator Data Sheet) Comments (Log Book)2/12/2002 AT 13:30 hrs, SDI test = 1.6. From 14:00 to 15:55 hrs, secured unit for MF
maintenance clean. 2/13/2002 No comments2/14/2002 No comments2/15/2002 No comments2/16/2002 No comments2/17/2002 No comments2/18/2002 No comments2/19/2002 At 15:15, secured unit for MF maintenance clean.2/20/2002 At 18:30, performed adjustments, decrease permeate pressure
to 1 psi and increase permeate flow 0.6At 14:30, started the unit back up.
2/21/2002 At 8:32 hrs, reduced permeate flow to 0.6 No comments2/22/2002 No comments2/23/2002 No comments2/24/2002 No comments2/25/2002 No comments2/26/2002 No comments2/27/2002 At 11:45, shut down the unit--finished testing
RO Report App B Operator Log Page 9of 9 9/19/2002
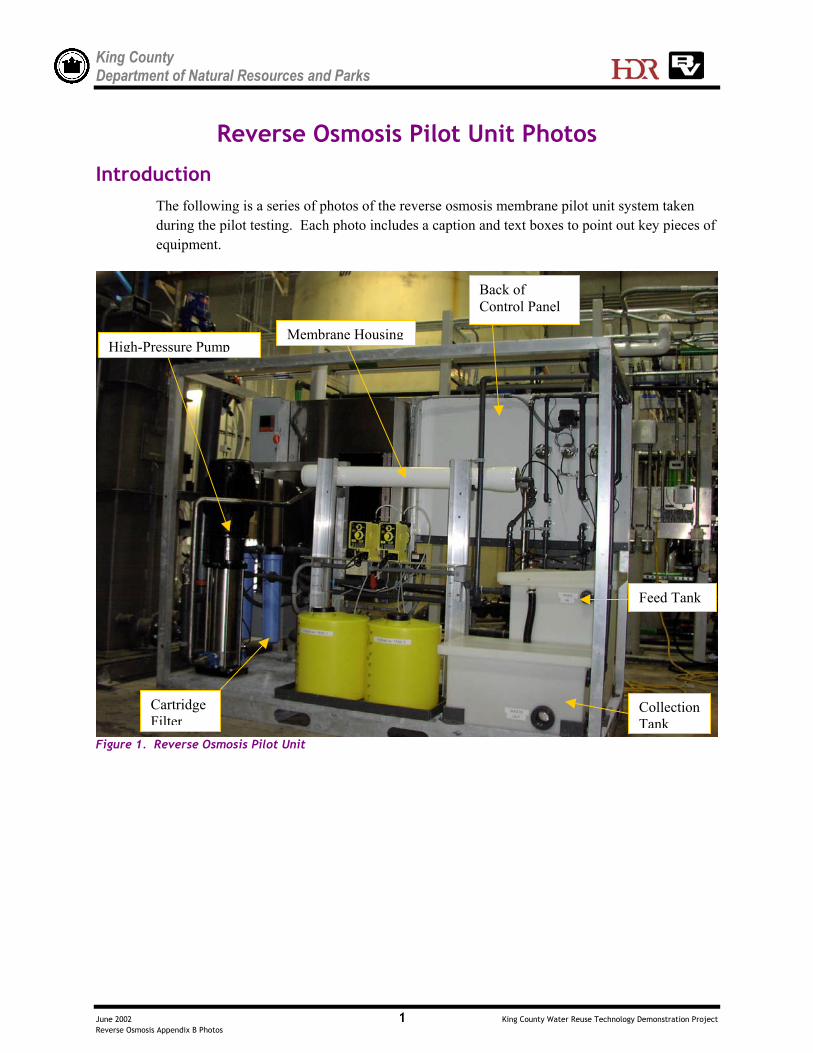
King CountyDepartment of Natural Resources and Parks
June 2002 1 King County Water Reuse Technology Demonstration ProjectReverse Osmosis Appendix B Photos
Reverse Osmosis Pilot Unit Photos
IntroductionThe following is a series of photos of the reverse osmosis membrane pilot unit system takenduring the pilot testing. Each photo includes a caption and text boxes to point out key pieces ofequipment.
Figure 1. Reverse Osmosis Pilot Unit
Membrane HousingHigh-Pressure Pump
Feed Tank
CartridgeFilter
CollectionTank
Back ofControl Panel

King CountyDepartment of Natural Resources and Parks
June 2002 2 King County Water Reuse Technology Demonstration ProjectReverse Osmosis Appendix B Photos
Figure 2. Reverse Osmosis Pilot Unit Side View
Acid &Antiscalant FeedPumps
Acid & AntiscalantSolution Tanks
Feed & PermeateAuto samplers24 hour Composite

King CountyDepartment of Natural Resources and Parks
June 2002 3 King County Water Reuse Technology Demonstration ProjectReverse Osmosis Appendix B Photos
Figure 3. Reverse Osmosis Pilot Unit Front View
Instrument Panel
Control Panel
Low-PressurePump
Sample Taps

King CountyDepartment of Natural Resources and Parks
June 2002 4 King County Water Reuse Technology Demonstration ProjectReverse Osmosis Appendix B Photos
Figure 4. RO Membrane Module – Spiral Wound Configuration – End View