
WATER QUALITY TECHNICAL REPORT - Mission Valley
161
WATER QUALITY TECHNICAL REPORT SAN DIEGO STATE UNIVERSITY MISSION VALLEY CAMPUS PROJECT Prepared for Gatzke Dillon & Balance LLP 2762 Gateway Road Carlsbad, California 92009 Prepared by Geosyntec Consultants, Inc. 1111 Broadway, 6 th Floor Oakland, California 94607 Project Number: SW0311 August 2019
Transcript of WATER QUALITY TECHNICAL REPORT - Mission Valley

WATER QUALITY TECHNICAL REPORT SAN DIEGO STATE UNIVERSITY MISSION VALLEY CAMPUS PROJECT
Prepared for
Gatzke Dillon & Balance LLP 2762 Gateway Road Carlsbad, California 92009
Prepared by
Geosyntec Consultants, Inc. 1111 Broadway, 6th Floor Oakland, California 94607
Project Number: SW0311
August 2019

SDSU Mission Valley Campus Project WQTR ii August 2019
TABLE OF CONTENTS
1. INTRODUCTION ....................................................................................................................1
2. ENVIRONMENTAL SETTING ..............................................................................................2 2.1 Physical Setting ...............................................................................................................2
2.1.1 Project Location ..................................................................................................2 2.1.2 Existing Land Use ...............................................................................................2 2.1.3 Climate ................................................................................................................3 2.1.4 Topography .........................................................................................................4 2.1.5 Vegetation and Habitat ........................................................................................4 2.1.6 Geology and Soils ...............................................................................................5
2.2 Proposed Project Development .......................................................................................5 2.2.1 Proposed Land Uses ............................................................................................5 2.2.2 Project Drainage ..................................................................................................7 2.2.3 Potable Water Supply Source ..............................................................................7 2.2.4 Wastewater Treatment .........................................................................................8
2.3 Watershed Description ....................................................................................................8 2.3.1 San Diego River ..................................................................................................8 2.3.2 Murphy Canyon Creek ........................................................................................9
2.4 Existing Surface Water Quality .......................................................................................9 2.4.1 Surface Water Beneficial Uses ..........................................................................10 2.4.2 San Diego River Water Quality Data ................................................................11 2.4.3 Murphy Canyon Creek ......................................................................................18 2.4.4 Surface Water Quality Data Summary ..............................................................21
2.5 Existing Groundwater Quality .......................................................................................23 2.5.1 Groundwater Beneficial Uses ............................................................................24 2.5.2 Depth to Groundwater .......................................................................................25
3. REGULATORY SETTING ....................................................................................................26 3.1 Federal Regulations .......................................................................................................26
3.1.1 Clean Water Act ................................................................................................26 3.1.2 California Toxics Rule ......................................................................................28 3.1.3 Federal Antidegradation ....................................................................................29
3.2 State Regulations ...........................................................................................................29 3.2.1 California Porter-Cologne Act ..........................................................................29 3.2.2 California Antidegradation Policy .....................................................................30 3.2.3 Basin Plan ..........................................................................................................30 3.2.4 Statewide Trash Control Requirements .............................................................31

SDSU Mission Valley Campus Project WQTR iii August 2019
3.2.5 Permits and Policies ..........................................................................................32 3.3 Local Regulations ..........................................................................................................37
3.3.1 Phase I MS4 Permit ...........................................................................................37 3.3.2 City of San Diego Stormwater Standards..........................................................39 3.3.3 Tentative Investigative Order No. R9-2018-0021 .............................................40
4. POLLUTANTS OF CONCERN AND SIGNIFICANCE CRITERIA ..................................41 4.1 Surface Water Quality Pollutants of Concern for MS4 Area ........................................41
4.1.1 Pollutants of Concern ........................................................................................41 4.1.2 Other Constituents .............................................................................................47
4.2 Groundwater Quality Pollutants of Concern .................................................................48 4.2.1 Pollutants of Concern ........................................................................................49 4.2.2 Other Constituents .............................................................................................49
4.3 Hydrologic Conditions of Concern (Hydromodification) .............................................50 4.4 Significance Criteria and Thresholds for Significance ..................................................51
4.4.1 Surface Water Quality Thresholds ....................................................................51 4.4.2 Significance Thresholds for Hydrologic Conditions of Concern
(Hydromodification Impacts) ............................................................................53 4.4.3 Groundwater Impacts ........................................................................................53 4.4.4 Cumulative Impacts ...........................................................................................54
5. WATER QUALITY AND HYDROMODIFICATION CONTROL BEST MANAGEMENT PRACTICES ...........................................................................................................................55 5.1 Construction-Phase Controls .........................................................................................55
5.1.1 Erosion and Sediment Control BMPs to be Implemented during Construction ...........................................................................................................................55
5.1.2 Construction BMP Implementation ...................................................................57 5.2 Post-Construction Source Control BMPs ......................................................................58 5.3 LID BMPs .....................................................................................................................62
5.3.1 LID Site Design BMPs ......................................................................................62 5.3.2 Structural LID BMPs .........................................................................................65
5.4 Operations and Maintenance .........................................................................................67
6. SURFACE WATER QUALITY IMPACTS ASSESSMENT METHODOLOGY ...............68 6.1 Surface Water Quality Modeling ..................................................................................68
6.1.1 Pollutants Modeled ............................................................................................69 6.1.2 Qualitative Impact Analysis ..............................................................................70
7. IMPACT ASSESSMENT .......................................................................................................72

SDSU Mission Valley Campus Project WQTR iv August 2019
7.1 Post-Development Stormwater Runoff Impact Assessment for Modeled Pollutants of Concern .........................................................................................................................72 7.1.1 Stormwater Runoff Volumes .............................................................................74 7.1.2 Total Suspended Solids (TSS) ...........................................................................74 7.1.3 Total Dissolved Solids (TDS) ...........................................................................74 7.1.4 Total Phosphorus ...............................................................................................75 7.1.5 Nitrogen .............................................................................................................75 7.1.6 Metals ................................................................................................................76
7.2 Post Development Impact Assessment for Pollutants Addressed without Modeling ...77 7.2.1 Turbidity ............................................................................................................77 7.2.2 Pathogens ...........................................................................................................78 7.2.3 Pesticides ...........................................................................................................80 7.2.4 Petroleum Hydrocarbons (PAHs) ......................................................................82 7.2.5 Toxicity .............................................................................................................83 7.2.6 Trash and Debris ...............................................................................................84 7.2.7 Benthic Community Effects ..............................................................................85 7.2.8 Dissolved Oxygen (DO) ....................................................................................86
7.3 Dry Weather Runoff ......................................................................................................87 7.4 Construction Related Impacts .......................................................................................88
7.4.1 Compliance with Construction Permit and Construction Impacts ....................88 7.5 Waste Discharge Requirements and Water Quality Control Plans ...............................89 7.6 Hydromodification Impacts ...........................................................................................89 7.7 Groundwater Impacts ....................................................................................................91
7.7.1 Groundwater Quality Impacts ...........................................................................91 7.7.2 Groundwater Recharge Impacts ........................................................................92
7.8 Cumulative Impacts .......................................................................................................92 7.8.1 Cumulative Surface Water Impacts ...................................................................92 7.8.2 Cumulative Groundwater Impacts .....................................................................93
8. CONCLUSIONS ....................................................................................................................94 8.1 Surface Water Impacts ..................................................................................................94 8.2 Groundwater Impacts ....................................................................................................96 8.3 Hydromodification Impacts ...........................................................................................96 8.4 Cumulative Impacts .......................................................................................................97
9. REFERENCES .......................................................................................................................98

SDSU Mission Valley Campus Project WQTR v August 2019
LIST OF TABLES
Table 2-1: Rain Gauge Precipitation Record Summary Table 2-2: Project Modeled Land Use Summary Table 2-3: Existing Beneficial Uses of Project Surface Water Bodies Table 2-4: Monitoring Programs, Projects, and Stations in the Vicinity of the Project Table 2-5: Monitoring Station Locations in the Vicinity of the Project Table 2-6: Monitoring Station Sample Date Range and Parameter Group Table 2-7: Wet and Dry Season Field Measurements and Conventional Parameters Table 2-8: Wet and Dry Season Nutrient Data Table 2-9: Wet and Dry Season Metals Data Table 2-10: Wet and Dry Season Pathogen Indicator Data Table 2-11: Wet and Dry Season Municipal Supply Data Table 2-12: Murphy Canyon Creek Monitoring Station Location in the Vicinity of the Project Table 2-13: Murphy Canyon Creek Monitoring Station Sample Date Range and Parameter Group Table 2-14: Murphy Canyon Creek Dry Season Field Measurements and Conventional Parameters Table 2-15: Murphy Canyon Creek Dry Season Nutrient Data Table 2-16: Murphy Canyon Creek Dry Season Metals Data Table 2-17: Well Water Quality Assumptions Table 2-18: Existing Beneficial Uses of Project Groundwater Basin Table 3-1: 2014/2016 CWA Section 303(d) Listings for the San Diego River (Lower) Table 3-2: TMDLs for San Diego River (Lower) Table 3-3: Water Quality Objectives for Inland Surface Waters Table 4-1: Water Quality Objectives, Wet Weather Table 4-2: Water Quality Objectives, Dry Weather Table 4-3: Comparison of Mineral Basin Plan Objectives with Mean Measured Values in Los Angeles County Table 4-4: Comparison of Basin Plan Mineral Groundwater Objectives with Mean Measured Values in Los Angeles County Urban Runoff and Anticipated Irrigation Water Quality Table 5-1: Small MS4 Permit Source Control BMP Requirements and Corresponding Project BMPs Table 5-2: Phase I MS4 Permit Source Control BMP Requirements and Corresponding Project BMPs Table 5-3: Small MS4 Permit and Corresponding Project Site Design Measures Table 5-4: San Diego Phase I MS4 Permit and Corresponding Project Site Design Measures Table 7-1: Average Annual Runoff Volume and Pollutant Loads for the Project Lower San Diego River Watershed (Results from Water Quality Model) Table 7-2: Average Annual Pollutant Concentrations for the Project (Results from Water Quality Model) Table 7-3: Comparison of Predicted Trace Metals Concentrations with Water Quality Criteria Table 7-4: Trends in Urban Stream Sediment PAH Concentrations

SDSU Mission Valley Campus Project WQTR vi August 2019
LIST OF FIGURES
(figures are provided at the end of the document)
Figure 2-1: Project Vicinity
Figure 2-2: Project Impact Boundary and Land Use
Figure 2-3: Soils
Figure 2-4: Regional Groundwater Basins
Figure 5-1: LID BMP Drainage Areas
Figure 5-2: Conceptual Illustration of a Bioretention Facility with Partial Retention
Figure 5-3: Conceptual Illustration of Lined Biofiltration (Planter Box)
LIST OF APPENDICES
Appendix A: Water Quality Modeling Parameters and Methodology

SDSU Mission Valley Campus Project WQTR vii August 2019
ACRONYMS AND ABBREVIATIONS
µg/L micrograms per liter AMSL Above Mean Sea Level ASCE American Society of Civil Engineers Basin Plan Water Quality Control Plan for the San Diego Basin BAT/BCT Best Available Technology Economically Achievable and Best
Conventional Pollutant Control Technology BMP Best Management Practice CASQA California Stormwater Quality Association CDFW California Department of Fish and Wildlife CEDEN California Environmental Data Exchange Network CEQA California Environmental Quality Act CFR Code of Federal Regulations CGP Construction General Permit CTR California Toxics Rule CWA Clean Water Act cy cubic yard DCV Design Control Volume DDT Dichlorodiphenyltrichloroethane DMA Drainage Management Area DO Dissolved Oxygen DPR Department of Pesticide Regulation DWQ California State Water Board Division of Water Quality DWR California Department of Water Resources EMC Event Mean Concentration FIB Fecal Indicator Bacteria HA Hydrologic Area HMP Hydromodification Management Plan KMEP Kinder Morgan Energy Partners LACDPW Los Angeles County Department of Public Works LASGRWC Los Angeles and San Gabriel Rivers Watershed Council

SDSU Mission Valley Campus Project WQTR viii August 2019
lbs/yr pounds per year LID Low Impact Development LRP Legally Responsible Person MCL Maximum Contaminant Level MGD million gallons per day mg/L milligrams per liter MPN Most Probable Number MS4 Municipal Separate Storm Sewer System MTS Metropolitan Transit System MWD Metropolitan Water District NAL Numeric Action Level NCDC National Climatic Data Center NOI Notice of Intent NPDES National Pollutant Discharge Elimination System NRCS Natural Resources Conservation Service NSQD National Stormwater Quality Database NTU Nephelometric Turbidity Units PAH Polycyclic Aromatic Hydrocarbons PDP Project Development Project POC Pollutant of Concern Porter-Cologne Act Porter-Cologne Water Quality Control Act of 1970 QSP/QSD Qualified SWPPP Practitioners/Qualified SWPPP Developers REAP Rain Event Action Plan RWQCB Regional Water Quality Control Board SCCWRP Southern California Coastal Water Research Project SDCWA San Diego County Water Authority SDRWQCB San Diego Regional Water Quality Control Board SFEP San Francisco Estuary Project SMARTS Stormwater Multiple Applications and Report Tracking System SU Standard Units SWAMP Surface Water Ambient Monitoring Program

SDSU Mission Valley Campus Project WQTR ix August 2019
SWPPP Stormwater Pollution Prevention Plan SWRCB State Water Resources Control Board TDS Total Dissolved Solids TKN Total Kjeldahl Nitrogen TMDL Total Maximum Daily Load TP Total Phosphorus TPH Total Petroleum Hydrocarbons TSS Total Suspended Solids USACE U.S. Army Corps of Engineers USEPA United States Environmental Protection Agency USGS United States Geologic Survey WDID Waste Discharge Identification WDR Waste Discharge Requirements WMA Watershed Management Area WQ Water Quality WQIP Water Quality Improvement Plan WQO Water Quality Objectives WQTR Water Quality Technical Report

SDSU Mission Valley Campus Project WQTR 1 August 2019
1. INTRODUCTION
This Water Quality Technical Report (WQTR) assesses the potential impacts of the proposed San Diego State University (SDSU) Mission Valley Campus Project (the Project) on water quality in the Project’s receiving waters. To evaluate potential impacts of the Project on water quality, pollutants of concern are identified based on regulatory and other considerations. Potential changes in water quality are addressed for pollutants of concern based on runoff water quality modeling, literature information, and professional judgment. The report also assesses the potential for post-development stormwater runoff discharge rates, velocities, and durations to cause accelerated stream erosion (i.e., hydromodification impacts). Impacts take into account Best Management Practices (BMPs) selected to be consistent with the National Pollutant Discharge Elimination System (NPDES) General Permit and Waste Discharge Requirements for Stormwater Discharges from Small Municipal Separate Storm Sewer Systems (MS4s), Order No. 2013-0001-DWQ (Small MS4 Permit).
The level of significance of impacts is evaluated using a weight of evidence approach considering significance criteria that include predicted runoff quality for proposed versus existing conditions; Small MS4 Permit and Construction General Permit requirements; and reference to receiving water quality benchmarks, including Total Maximum Daily Load (TMDL) wasteload allocations and water quality standards from the Water Quality Control Plan for the San Diego Basin (Basin Plan) (SDRWQCB, 1994, as amended) and California Toxics Rule (CTR).

SDSU Mission Valley Campus Project WQTR 2 August 2019
2. ENVIRONMENTAL SETTING
2.1 Physical Setting
2.1.1 Project Location
The proposed Project is located at 9449 Friars Road, in the City of San Diego, California. The Project is situated south of Friars Road, west of Interstate (I-) 15, north of I-8, and east of the existing Fenton Marketplace shopping center. The Project is approximately 5.25 miles from downtown San Diego and approximately 2.75 miles west of the existing SDSU main campus (Figure 1).
The Project is surrounded by major roadways, interstate freeways, existing development, and two surface water features. Existing higher-density, multifamily residential land uses are located to the northwest, southwest, and east of the Project, across I-15. The San Diego River, which flows east to west, is located along the south border of the Project. South of the San Diego River are additional office uses and I-8. To the north of Friars Road is San Diego Fire Department Fire Station 45, undeveloped hillsides, and single-family residences, which are located atop the mesa. Fenton Marketplace is located west of the Project and consists of large commercial, retail, and office uses. Murphy Canyon Creek, a partially earthen- and concrete-lined channel that conveys flow into San Diego River, is located immediately to the east of the Project. Multifamily residential uses dominate the landscape to the east of the Project, east of I-15.
The Kinder Morgan Energy Partners (KMEP) Mission Valley Terminal is located to the northeast of the Project at 9950 San Diego Mission Road in the City of San Diego. This existing facility is located on both sides of Friars Road and west of I-15.
2.1.2 Existing Land Use
Existing features within the Project include SDCCU Stadium (approximately 15 acres), a multi-use athletic field, a recycling center, and an elevated Metropolitan Transit System (MTS) trolley station and overhead trolley line to the south of SDCCU Stadium. The Project is composed of 18,870 parking spaces with landscaping around the perimeter and features associated with the MTS Trolley Green Line along the southern portion of the Project. The stadium is approximately 90 percent impervious in the existing condition .
The land areas immediately in the vicinity of the Project are dominated by mid-rise commercial, offices, and residential buildings in Mission Valley. As stated above, the industrial fuel facility, KMEP Mission Valley Terminal, is located on the northwest corner of the Project across from San Diego Mission Road.
Existing Project land uses consists of a large multi-purpose former NFL stadium and associated parking.

SDSU Mission Valley Campus Project WQTR 3 August 2019
2.1.3 Climate
The Project is located in a Mediterranean climate region with seasonally influenced precipitation. Seasons consist of hot, dry summers and cooler, wetter winters, although San Diego is more arid than most areas with a similar climate classification. Temperatures range from an average summer temperature of 75 degrees Fahrenheit (°F) to an average winter temperature of 65°F. Most of the annual precipitation occurs between December and March. The average annual rainfall at the Project is approximately 10.2 inches based upon hourly precipitation data from a 40-year period of record (January 1968 through May 2008) recorded at the Fashion Valley ALERT rain gage (Station No. 27018, see Figure 1). Rainfall data statistics for this gauge are provided in Table 2-1. Rainfall analysis was conducted using USEPA’s Synoptic Rainfall Analysis Program for two data groups: all storm events and only the storms that were expected to contribute to stormwater runoff (storms >0.1 inches).
Table 2-1: Rain Gauge Precipitation Record Summary
Storms Statistic Rain Gauge
All Storms
Average annual rainfall (in): 10.18 Total number of storms: 1474
Average number of storms per year1: 36.0 Average storm volume (in): 0.28
Average storm duration (hrs): 6.5
Average storm intensity (in/hr): 0.05
Storms >0.1 inch
Average annual rainfall (in): 10.15
Total number of storms: 1356
Average number of storms per year1: 33.1
Average storm volume (in): 0.61
Average storm duration (hrs): 14.0
Average storm intensity (in/hr): 0.10 Note: 1 Discrete storms are defined using an inter-event time of 6 hours as described in Appendix A.
The available period of record has been used in this WQTR to represent the distribution of rainfall expected for the Project because long-term trends in annual precipitation cannot be anticipated. Analysis of historical precipitation records throughout California show large year-to-year variability in the amount of annual precipitation with periods of consecutive dry or wet years and no apparent trend over the past century (CalEPA, 2013). Global climate change is expected to cause a future warming trend in southern California even under moderate emissions scenarios; however, there is no clear trend in annual precipitation. An ensemble selection of four climate models downscaled to a 6-kilometer grid show continued year-to-year variability in precipitation through 2100 (Pierce et al., 2018; Thomas et al., 2018). Under moderate emissions scenarios, there is no change in average annual precipitation between 2070-2099 compared to 1961-1990 (ibid). Under high emissions scenarios, an approximate one-inch increase in average

SDSU Mission Valley Campus Project WQTR 4 August 2019
annual precipitation is projected between 2070-2099 compared to 1961-1990 (ibid). The same suite of models shows a 5.6°F and 8.5°F rise in maximum annual temperatures under moderate and high emission scenarios, respectively (ibid). Current climate projections suggest an increase in extreme events in the San Diego region in the future with 16% fewer rainy days and 8% more rainfall during the biggest rainstorms (San Diego, 2050 is Calling). The stormwater management facilities analyzed in this WQTR are designed to collect smaller, more frequent rain events and to bypass the biggest rainstorms, thus this analysis should not be affected by potential future increases in extreme rainfall events.
2.1.4 Topography
The Project is characterized by a gentle to moderate slope toward the San Diego River, south of the Project. Existing Project elevations range from approximately 75 feet above mean sea level (AMSL) on the northeast side of the Project to 55 feet AMSL along the margin of the San Diego River at the southern edge of the Project. The steepest slopes occur at the northeast portion of the Project.
The Project is within the FEMA 100-year and 500-year floodplain with a designation of “Zone A” along the eastern perimeter adjacent to Murphy Canyon Creek and “Zone AE” along the southern perimeter adjacent to the San Diego River. The SDCCU Stadium was constructed on fill above the 100-year floodplain on a raised earthen mound, while the parking lot was constructed within the 100-year floodplain (Geosyntec Consultants, 2019a). Flooding of the Project site has been observed during winter events and occasionally in the summer during monsoonal moisture from equatorial tropical storms (City of San Diego, 2015a). Currently, in this area Murphy Canyon Creek is contained in a flood control channel, and a berm exists between the channel and the parking lot; however, during moderate storm events, water overtops the berm and floods the existing parking area (City of San Diego, 2015a).
2.1.5 Vegetation and Habitat
The following vegetation communities are located on or adjacent to the Project: southern riparian woodland, disturbed wetland, Diegan coastal sage scrub, disturbed habitat, and urban/developed. Of these vegetation communities, the southern riparian woodland, disturbed wetland, and diegan coastal sage scrub are categorized as sensitive vegetation communities (City of San Diego, 2015a). The eastern extent of the Project, located within a conservation area, is within federally designated critical habitat for the coastal California gnatcatcher (City of San Diego, 2015a).
Special status plants and wildlife are expected to reside in and utilize the San Diego River and Murphy Canyon Creek. San Diego River and Murphy Canyon Creek are located along the Pacific Flyway, a major bird migration route for bird traveling between north and south America. The San Diego River serves as a major corridor for coastal and inland habitat linkage, as it allows migration from Mission Bay Park to Mission Trails Regional Park. The San Diego River and Murphy Canyon Creek serve as stopover habitat or steppingstone corridors for avian and bat species (City of San Diego, 2015a).

SDSU Mission Valley Campus Project WQTR 5 August 2019
2.1.6 Geology and Soils
The following description of the Project geology is from the City of San Diego (2015a). The Project, located in Mission Valley along the northern margins of the former floodplains of the San Diego River, is underlain by Quaternary Terrace deposits and bedrock of the Santiago Formation in addition to younger surficial deposits, including Quaternary beach deposits, ancient landslides, colluvium/slopewash, and artificial fill. Fill soils on the Project site were placed during the construction of SDCCU Stadium in 1966. The fill is primarily composed of Stadium Conglomerate (clayey sand and gravel) and some Friars Formation (clay, silt, and sand). Alluvium deposits consisting of sandy, gravel silt, and clay sourced from the San Diego River, underlie the fill. Alluvium is approximately 55 to 60 feet thick within the vicinity of the Project. Fill and alluvium overlie the Friars Formation, which is characterized by medium-grained sandstone and some gravel layers, siltstone, and claystone beds.
According to the National Resource Conservation Service, approximately 90% of the stadium property consists of “Made Land” (i.e., fill) which does not have a reported Hydrologic Soil Group (HSG). The remaining 10% on the south side of the Project consists of River Wash soil in HSG D.
2.2 Proposed Project Development
2.2.1 Proposed Land Uses
The proposed Project consists of demolition of the existing stadium, regrading of the site, and construction of a large mixed-use development consisting of a smaller football stadium, SDSU campus buildings, hotels, and residential properties. A major characteristic of the Project will be the creation of a “River Park” along the San Diego River and Murphy Canyon Creek, which will be a major focal point of the Project that will serve as a floodplain buffer between both the San Diego River and Murphy Canyon Creek with the rest of the developed portions of the Project, while also serving as an amenity for the surrounding community.
The proposed Project would consist of approximately 34 new buildings in addition to the multipurpose stadium. The multipurpose stadium is proposed in the northwest corner of the Project. The multipurpose stadium is proposed to be 35,000 capacity and constructed with a combination of aboveground seating, and a below-grade lower bowl to reduce the overall height of the stadium while also reducing construction costs. Overall grading would include approximately 913,000 cubic yards (CY) of cut and 1,062,000 CY of fill, which would require offsite import to balance the grading quantities.
Approximately 17 buildings would serve as office, research and development, and technology uses, and convert over time into educational facilities for the future expansion of SDSU. Each building would range from approximately 50,000 gross square feet to approximately 140,000 gross square feet, and between three and five stories in height, for a total of approximately 1.6 million square feet of campus uses. These uses will be situated south and immediately east of the multi-use stadium as shown on Figure 2-2.

SDSU Mission Valley Campus Project WQTR 6 August 2019
Approximately 16 buildings would provide approximately 4,600 residential homes, including student, faculty, staff, and market-rate housing, ranging from approximately 70,000 gross square feet (Building R-9) to 490,000 gross square feet (Buildings R-6 and R-7), and between 3 and 24 stories in height, for a total of approximately 4.5 million square feet of residential uses. Residential uses will be located on the eastern half of the Project.
Two hotel buildings located on the northern edge of the Project would provide for approximately 400 hotel rooms total and range between 60,000 square feet and 156,000 square feet and 3 to 22 stories. One of these buildings would provide for a mix of both hotel and residential uses.
Parking would be provided in parking garages, surface parking, and on-street parking. Surface parking spaces would be made available on multi-use recreational fields west of the stadium to accommodate game-day parking needs. Parking in the residential areas of the proposed Project would consist of three- to five-story parking garages in each of the residential buildings. On-street parking would be located throughout the residential areas of the proposed Project. In addition, garage and on-grade parking spaces would be provided for the campus hospitality uses.
Parks, recreation, and open space would be provided throughout the Project as shown in Figure 2-2. The 34-acre River Park is proposed along the southern and eastern edge of the Project, north of the San Diego River, and would provide both passive and active recreational opportunities and stormwater treatment facilities, and act as a buffer to the San Diego River and its sensitive habitat. Additional shared SDSU/community parks and open space uses include active and passive recreation, a campus, and additional open space in the residential and other projects. Trails are proposed through the parks and open space areas and would connect through the residential and other projects, providing walking and biking opportunities and connecting to the existing Stadium trolley station. Approximately four miles of trails are proposed throughout the Project.
In addition to the onsite improvements, the adjacent improvements proposed by the Project include connections from the onsite roads to the existing offsite roads, and the roadway improvements associated with the connections including widening and restriping. The adjacent improvements proposed by the Project, from west to east, include River Park Road, Friars Road, Mission Village Road, San Diego Mission Road, and Murphy Creek Road. These adjacent improvements will generally utilize separate storm drain systems and water quality measures than those proposed by the onsite design. (Rick Engineering, 2019a).
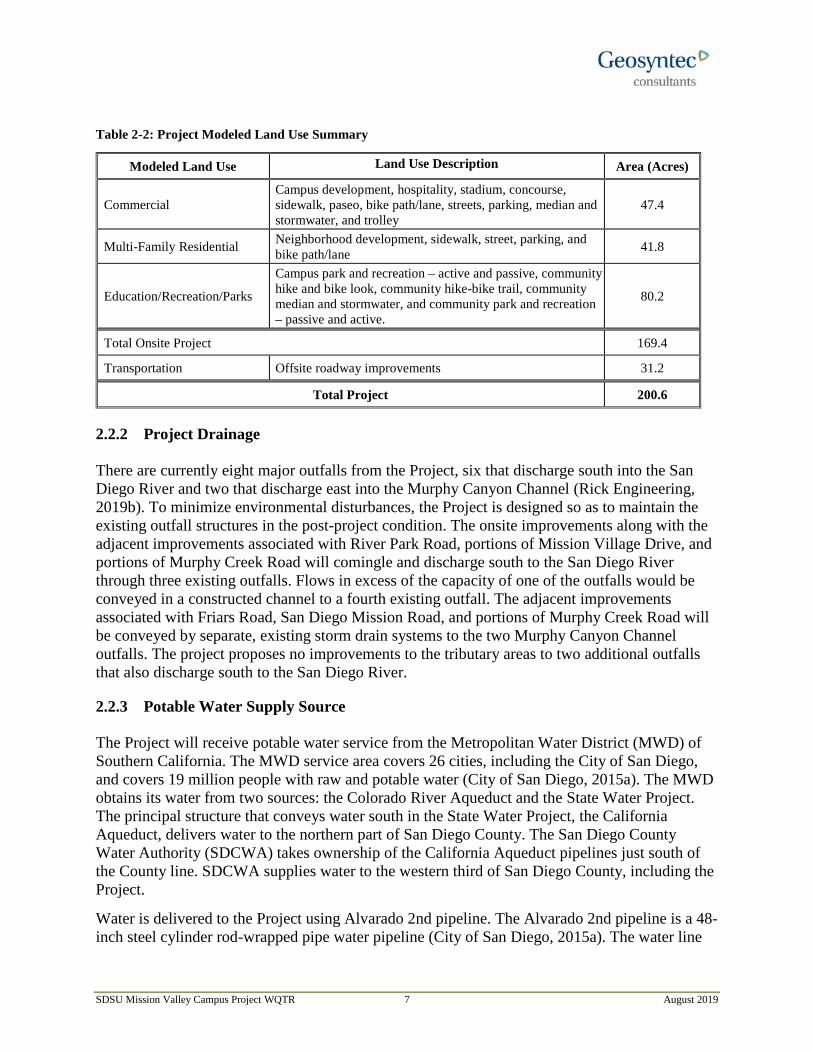
A summary of the proposed modeled land use areas for the Project are provided in Table 2-2 and illustrated in Figure 2-2.
SDSU Mission Valley Campus Project WQTR 7 August 2019
Table 2-2: Project Modeled Land Use Summary
Modeled Land Use Land Use Description Area (Acres)
Commercial Campus development, hospitality, stadium, concourse, sidewalk, paseo, bike path/lane, streets, parking, median and stormwater, and trolley
47.4
Multi-Family Residential Neighborhood development, sidewalk, street, parking, and bike path/lane 41.8
Education/Recreation/Parks
Campus park and recreation – active and passive, community hike and bike look, community hike-bike trail, community median and stormwater, and community park and recreation – passive and active.
80.2
Total Onsite Project 169.4
Transportation Offsite roadway improvements 31.2
Total Project 200.6
2.2.2 Project Drainage
There are currently eight major outfalls from the Project, six that discharge south into the San Diego River and two that discharge east into the Murphy Canyon Channel (Rick Engineering, 2019b). To minimize environmental disturbances, the Project is designed so as to maintain the existing outfall structures in the post-project condition. The onsite improvements along with the adjacent improvements associated with River Park Road, portions of Mission Village Drive, and portions of Murphy Creek Road will comingle and discharge south to the San Diego River through three existing outfalls. Flows in excess of the capacity of one of the outfalls would be conveyed in a constructed channel to a fourth existing outfall. The adjacent improvements associated with Friars Road, San Diego Mission Road, and portions of Murphy Creek Road will be conveyed by separate, existing storm drain systems to the two Murphy Canyon Channel outfalls. The project proposes no improvements to the tributary areas to two additional outfalls that also discharge south to the San Diego River.
2.2.3 Potable Water Supply Source
The Project will receive potable water service from the Metropolitan Water District (MWD) of Southern California. The MWD service area covers 26 cities, including the City of San Diego, and covers 19 million people with raw and potable water (City of San Diego, 2015a). The MWD obtains its water from two sources: the Colorado River Aqueduct and the State Water Project. The principal structure that conveys water south in the State Water Project, the California Aqueduct, delivers water to the northern part of San Diego County. The San Diego County Water Authority (SDCWA) takes ownership of the California Aqueduct pipelines just south of the County line. SDCWA supplies water to the western third of San Diego County, including the Project.
Water is delivered to the Project using Alvarado 2nd pipeline. The Alvarado 2nd pipeline is a 48-inch steel cylinder rod-wrapped pipe water pipeline (City of San Diego, 2015a). The water line

SDSU Mission Valley Campus Project WQTR 8 August 2019
runs along Friars Road and turns onto the Project along the north side of the Project boundary, west of Mission Village. The alignment turns south at the northeast corner of the Project. The transmission main exits the Project and crosses I-15 on the southeast corner of the Project.
2.2.4 Wastewater Treatment
Wastewater collection and treatment services are provided by the Wastewater Branch of the City of San Diego Public Utilities Department (City of San Diego, 2015a). The City’s wastewater facilities include the Point Loma Wastewater Treatment Plant, the North City Water Reclamation Plant, the South Bay Water Reclamation Plant, and the Metro Biosolids Center.
The current wastewater system serves the existing SDCCU Stadium demand (City of San Diego, 2015a). Seven 6-inch and 8-inch laterals exit the SDCCU Stadium. An 8-inch vitrified clay pipe that was constructed in 1966 circles the outside of SDCCU Stadium collecting wastewater from these seven locations (City of San Diego, 2015a). This pipe feeds into an 18-inch connector pipeline on the western side of stadium; this 18-inch line connects to an 8-inch connector line that resides northwest of the stadium. The 8-inch line connects to another 18-inch line along the western side of the stadium. The capacity of the 18-inch line is approximately 4.3 mgd and connects to an 84-inch trunk. The 84-inch trunk sewer, North Mission Valley Interceptor, runs easterly along the southern property line and connects to a 108-inch North Metro Interceptor that directs wastewater to Pump Station Number 2 where it is then pumped to the Point Loma Wastewater Treatment Plant for treatment (City of San Diego, 2015a).
2.3 Watershed Description
The Project is located within the San Diego River Watershed Management Area (WMA), which encompasses approximately 434 square miles. The Project’s receiving waters include the San Diego River and Murphy Canyon Creek (Figure 1). Streams within the watershed include 55 miles of the San Diego River, Boulder Creek, Cedar Creek, Conejos Creek, Chocolate Creek, Los Coches Creek, San Vicente Creek, Foster Creek, and several unnamed tributaries.
2.3.1 San Diego River
The San Diego River watershed contains the Lower San Diego, San Vicente, El Capitan, and Boulder Creek Hydrologic Areas. The San Diego River watershed is comprised of 44% undeveloped areas, 23% opens space/park and recreation areas, 19% residential, 6% transportation, and less than 2% agricultural, commercial, commercial recreation, industrial, military, public facility, and water land uses (San Diego County, 2017). Areas in the upper, eastern portion of the San Diego watershed are 58% undeveloped, while the lower, western areas are dominated by urbanized areas (14.9% residential, 5.5% freeways and roads, and 4.2 % commercial/industrial land use) (City of San Diego, 2015a).
The Project is located in the Mission San Diego Hydrologic Subarea (HAS 907.11) in the lower San Diego Hydrologic Area within the San Diego River Hydrologic Unit (HU). The San Diego River headwaters are located 50 miles east of the Project in the Cuyamaca Mountains. River
SDSU Mission Valley Campus Project WQTR 9 August 2019
flows into the Pacific Ocean five miles west of the Project in the Ocean Beach community of the City of San Diego (City of San Diego, 2015a).
2.3.2 Murphy Canyon Creek
Murphy Canyon Creek originates in multiple headwaters in the foothills, southeast of Marine Corps Air Station Miramar, flows south along the eastern boundary of the Project, and discharges to the San Diego River at the southeast corner of the Project. The Creek is a partially earthen-and concrete-lined channel with intermittent segments above and below ground. The Creek is a narrow channel west of I-15 and becomes a covered concrete trapezoidal channel for approximately 0.5 mile as it approaches the Kinder Morgan Energy Partners Mission Valley Terminal. Along the Project boundary, the Creek is characterized by an earthen trapezoidal channel with riprap slopes, approximately 1,700 feet long.
Federal Emergency Management Agency’s Flood Insurance Rate Maps (FIRM) Panel 06073C1636H delineates a 100-year floodplain along Murphy Canyon Creek (Chang Consultants, 2019). The floodplain is generally along the existing Creek channel between the SDCCU Stadium parking lot and I-15. The Murphy Canyon Creek floodplain is designated as Zone A. The Creek is periodically maintained for flood control purposes and collects stormwater from adjacent residential and commercial developments. The Creek provides wetland and riparian vegetation along its banks with minimal vegetation along the creek bed (City of San Diego, 2015a).
According to the Hydraulic Analysis for SDSU Mission Valley West Campus, 100% Design Development, dated May 9, 2019, the 100-year flow would not be not contained within the main Murphy Canyon Creek channel and would spill into the SDCCU Stadium parking lot at various locations. (Chang Consultants, 2019). The 100-year creek flow would spill out of the main creek channel north of Friars Road. A portion of the spillover flow could enter the SDCCU Stadium at a second location approximately 700 feet west of the main creek channel. The spillover flow would travel along an existing roadway and then under a Friars Road bridge to the SDCCU Stadium.
The HEC-RAS hydraulic analyses extend to the Stadium Golf Center driveway over 4,300 feet north of Friars Road in order to assess the spillover. The results indicate that the Murphy Canyon Creek 100-year flow entering the SDCCU Stadium (2,600 cfs) reduces to 838 cfs due to spill out of the existing channel (Chang Consultants, 2019). The analyses show that the current creek channel cannot contain the 100-year flows within or upstream of the Project.
2.4 Existing Surface Water Quality
A summary of available water quality data for the San Diego River and Murphy Canyon Creek is provided below. Monitoring locations are shown in Figure 1.

SDSU Mission Valley Campus Project WQTR 10 August 2019
2.4.1 Surface Water Beneficial Uses
The Basin Plan (SDRWQCB, 1994, as amended) lists beneficial uses of major water bodies within the region. San Diego River and Murphey Canyon Creek are inland surface water bodies with designated beneficial uses in the Basin Plan. Existing beneficial uses for both water bodies are summarized in Table 2-3 and descriptions of the beneficial use categories are as follows:
• AGR: Agricultural supply waters used for farming, horticulture, or ranching.
• COLD: Freshwater habitat that support cold water ecosystems including the preservation or enhancement of aquatic habitats, vegetation, fish or wildlife, and invertebrates.
• IND: Industrial activities that do not depend primarily on water quality.
• MUN: Community, military, or individual water supply systems including, but not limited to, drinking water supply.
• PROC: Industrial process supplies that includes the use of water for industrial activities that depend primarily on water quality.
• RARE: Waters that support habitats necessary, at least in part, for the survival and successful maintenance of plant or animal species established under state or federal law as rare, threatened, or endangered.
• REC1: Water contact recreation involving body contact with water and ingestion is reasonably possible.
• REC2: Non-contact water recreation for activities in proximity to water, but not involving body contact.
• WARM: Warm freshwater habitat to support warm water ecosystems.
• WILD: Wildlife habitat waters that support terrestrial or wetland ecosystems.
Table 2-3: Existing Beneficial Uses of Project Surface Water Bodies
Water Body
Beneficial Uses
MU
N
AG
R
IND
PRO
C
RE
C1
RE
C2
WA
RM
CO
LD
WIL
D
RA
RE
San Diego River X X X X X X X X X X
Murphy Canyon Creek X X X X X X X
Source: Table 2-2 of the Water Quality Control Plan for the San Diego Basin (Basin Plan) (SDRWQCB, 1994, as amended)

SDSU Mission Valley Campus Project WQTR 11 August 2019
2.4.2 San Diego River Water Quality Data
Surface water quality data in the vicinity of the Project is provided below. Surface water quality data are available on the California Environmental Data Exchange Network (CEDEN) website for multiple stations for the lower San Diego River in the vicinity of the Project. Data collected for five monitoring locations, two upstream and three downstream of the Project, were used in this water quality summary. For the five selected locations, water quality samples were collected under multiple monitoring programs including the Surface Water Ambient Monitoring Program (SWAMP), the San Diego Coastkeeper (SDCK) Monitoring Program, the San Diego River Bacteria TMDL monitoring program (Project 1) and the NPDES receiving water monitoring program. Table 2-4 provides a summary of the monitoring programs, projects, and stations along the lower San Diego River in the vicinity of the Project.
Table 2-4: Monitoring Programs, Projects, and Stations in the Vicinity of the Project
Program Parent Project Project Station Name Station Code
Surface Water Ambient Monitoring Program (SWAMP)
SDRWQCB 9 Monitoring
Rotational Monitoring 2004 San Diego River 15 907SSDR15
Stream Pollution Trends
Statewide Trends Study
San Diego River at Ward Road 907SDRWAR
San Diego Coastkeeper
Ambient Monitoring Program Monthly Monitoring Fashion Valley Road SDG-010
TMDL Revised TMDL for Indicator Bacteria,
Project 1
San Diego River Bacteria TMDL
Monitoring Program
Lower San Diego River at Camino Del
Este SDR-CDE
NPDES San Diego Region Receiving Water Monitoring
San Diego River TWAS 1 SDR-TWAS-1
The five selected stations are located with 5 miles of the Project. Two of the monitoring stations are located upstream of the Project and three of the monitoring stations are located downstream of the Project. The latitude, longitude, relative upstream or downstream location, and approximate distance of the station to the Project is provided in Table 2-5.
Table 2-5: Monitoring Station Locations in the Vicinity of the Project
Station Name Latitude (°N)
Longitude (°E)
Station Location Relative to Project
Approximate Distance to the Project1 (miles)
San Diego River 15 32.76194 -117.1927 Downstream of Project 4.5
Fashion Valley Road 32.764332 -117.17008 Downstream of Project 3.25
Lower San Diego River at Camino Del Este 32.772549 -117.14456 Downstream of Project 1.5

SDSU Mission Valley Campus Project WQTR 12 August 2019
Station Name Latitude (°N)
Longitude (°E)
Station Location Relative to Project
Approximate Distance to the Project1 (miles)
San Diego River at Ward Road 32.780319 -117.11046 Upstream of Project 0.5
San Diego River TWAS 1 32.7836 -117.104 Upstream of Project 1.0
Note: 1 Distance is measured to the centroid of the Project boundary.
Water quality data was collected from 2004 through 2018 for several pollutants of concern including conventional parameters, nutrients, metals, pathogen indicators, and municipal supply constituents. In-situ field measurements were also taken at some locations. The primary pollutant group, sample start date, and sample end date is provided in Table 2-6.
Table 2-6: Monitoring Station Sample Date Range and Parameter Group
Station Name WQTR Station ID Pollutant Group Start Date End Date
San Diego River 15 A Conventional, Field
Measurements, Municipal Supply, Nutrients, Metals
5/18/2004 4/19/2005
Fashion Valley Road B Field Measurements, Nutrients, Pathogens 1/12/2009 6/25/2016
Lower San Diego River at Camino Del Este C Pathogens 6/27/2013 9/27/2018
San Diego River at Ward Road D Field Measurements 5/15/2013 4/23/2015
San Diego River TWAS 1 E
Conventional, Field Measurements, Nutrients,
Pathogens, Metals, (Other)
11/28/2009 5/8/2014
Water quality data for the conventional parameters, selected nutrients, selected metals, pathogen indicators, and selected municipal supply constituents are summarized in Tables 2-7 through 2-11 below. See Section 4 for a discussion of pollutants of concern.
Field Measurements and Conventional Parameters The selected general constituents examined include dissolved oxygen (DO), turbidity, total dissolved solids (TDS), total suspended solids (TSS), and oil and grease. Dissolved oxygen is a measure of the amount of gaseous oxygen dissolved in the water. Turbidity is a measure of suspended matter that interferes with the passage of light through the water or in which visual depth is restricted. TDS measures the dissolved cations and anions in water, primarily inorganic salts (calcium, magnesium, potassium, sodium, chlorides and sulfates). High TDS levels can impair agricultural, municipal supply, and groundwater recharge beneficial uses. TSS measures

SDSU Mission Valley Campus Project WQTR 13 August 2019
the particulate matter suspended in water. Oil and grease is a measure of fats, oils, waxes, and other related constituents in water.
Results for DO, turbidity, TDS, TSS, and oil and grease are summarized in Table 2-7 below.
Table 2-7: Wet and Dry Season Field Measurements and Conventional Parameters
Notes: 1 For non-detect values (results qualified as “ND” or “<”), half of the detection limit was used to calculate the average concentration. For values qualified as a “DNQ,” half the reporting limit was used to calculate the average concentration. A “DNQ” value was counted as a detect. 2 Dissolved oxygen was a field measured parameter. Turbidity was a field measured parameter at Sites A and E and was measured in the laboratory at Site B. 3 Dissolved oxygen levels shall not be less than 5.0 mg/l in inland surface waters with designated MAR or WARM beneficial uses or less than 6.0 mg/l in waters with designated COLD beneficial uses. The annual mean dissolved oxygen concentration shall not be less than 7 mg/l more than 10% of the time. 4 Concentrations not to be exceeded more than 10% of the time during any one-year period (Basin Plan Water Quality Objective for Inland Surface Water for the Lower San Diego River Hydrologic Area). 5 Waters shall not contain oils, greases, waxes, or other materials in concentrations which result in a visible film or coating on the surface of the water or on objects in the water, or which cause nuisance or which otherwise adversely affect beneficial uses. -- No applicable water quality objective
Constituent
Water Quality
Objective WQTR
Station ID No. of
Samples No. of
Detects Min Avg. Max Wet Season Data (October 1 – April 30)
Dissolved Oxygen 2 (mg/L) 7 3 A, D 3 3 3.88 7.17 9.20
Turbidity (NTU) 2 20 4 A, B 22 22 0.87 4.63 29.80 Total Dissolved Solids (TDS) (mg/L) 1,0004 E 2 2 1,000 1,200 1,400
Total Suspended Solids (TSS) (mg/L) -- A, E 4 4 16.0 26.4 35.7
Oil & Grease (O&G) (mg/L) See note 5 E 2 2 2.50 2.50 2.50
Dry Season Data (May 1 – September 30) Dissolved Oxygen 2 (DO) (mg/L) 7 3 A, D, E 6 6 2.10 3.47 5.18
Turbidity 2 (NTU) 20 4 A, B, E 21 21 0.50 3.72 13.90 Total Dissolved Solids (TDS) (mg/L) 1,000 4 E 2 2 1,500 2,000 2,500
Total Suspended Solids (TSS) (mg/L) -- A, E 4 3 2.5 13.1 27.0
Oil & Grease (O&G) (mg/L) See note 5 E 2 1 0.65 1.58 2.50

SDSU Mission Valley Campus Project WQTR 14 August 2019
Selected Nutrients The major nutrients of concern (nitrogen and phosphorus compounds) are described here. Phosphorus was measured as total phosphorus and sometimes as dissolved phosphorus in existing water quality data. Dissolved phosphorus is the more bioavailable form of phosphorus compared to total phosphorus, which is often made up of a high proportion of particulate phosphorus. Nitrogen is measured variously as nitrate, nitrite, ammonia, and total Kjeldahl nitrogen (TKN). TKN is the measure of ammonia plus the organic forms of nitrogen. Nitrate, nitrite, and ammonia are the more bioavailable forms of nitrogen, and of these, nitrate (or nitrate + nitrite) has the higher concentration in natural waters and is more important than ammonia as a nutrient.
Table 2-8 summarizes data for nitrogen and phosphorus compounds.
Table 2-8: Wet and Dry Season Nutrient Data
Constituent Water Quality Objective
WQTR Station ID
No. of Samples
No. of Detects Min. Avg. Max.
Wet Season Data (October 1 – April 30) Dissolved Ammonia (NH3) as N (mg/L) --2 B 38 34 0.02 0.05 0.16
Total Ammonia (NH3) as N (mg/L) 3 --2 A, E 4 4 0.05 0.36 1.20
Dissolved Nitrate (NO3) as N (mg/L) See note 3 A, B 43 23 0.04 0.40 1.76
Total Nitrate (NO3) as N (mg/L) See note 4 E 2 2 0.33 1.02 1.70
Total Nitrogen (mg/L) See note 4, 5 -- -- -- -- -- -- Total Kjeldahl Nitrogen (TKN) (mg/L) See note 3, 4 A, E 4 4 0.78 1.56 3.30
Dissolved Phosphorus as P (mg/L) See note 3 B, E 42 39 0.05 0.14 0.59
Total Phosphorus as P (mg/L) See note 3, 4 A, E 4 4 0.12 0.20 0.28
Dry Season Data (May 1 – September 30) Dissolved Ammonia (NH3) as N (mg/L) 0.0252 B 29 23 0.02 0.06 0.33
Total Ammonia (NH3) as N (mg/L) 0.0252,3 A, E 4 4 0.05 0.15 0.44
Dissolved Nitrate (NO3) as N (mg/L) See note 3 A, B 30 10 0.05 0.26 0.68
Total Nitrate (NO3) as N (mg/L) See note 4 E 2 1 0.02 0.04 0.05
Total Nitrogen (mg/L) See note 4, 5 E 2 2 0.56 0.95 1.34 Total Kjeldahl Nitrogen (TKN) (mg/L) See note 3, 4 A, E 4 4 0.52 0.78 1.30
Dissolved Phosphorus as P (mg/L) See note 3 B, E 29 27 0.05 0.21 0.40

SDSU Mission Valley Campus Project WQTR 15 August 2019
Constituent Water Quality Objective
WQTR Station ID
No. of Samples
No. of Detects Min. Avg. Max.
Total Phosphorus as P (mg/L) See note 3, 4 A, E 4 4 0.19 0.24 0.29
Notes: 1 For non-detect values (results qualified as “ND” or “<”), half of the detection limit was used to calculate the average concentration. For values qualified as a “DNQ,” half the reporting limit was used to calculate the average concentration. A “DNQ” value was counted as a detect. 2 The water quality objective for unionized ammonia is 0.025 mg/L; there is no water quality objective for total ammonia or dissolved ammonia. 3 Detection limits varied over time as methods/technology changed for the following parameters: total ammonia (NH3) as N, dissolved nitrate (NO3) as N, total Kjeldahl nitrogen (TKN), dissolved phosphorus as P, and total phosphorus as P. 4 Concentrations of nitrogen and phosphorus, by themselves or in combination with other nutrients, shall be maintained at levels below those which stimulate algae and emergent plant growth. Threshold total Phosphorus (P) concentrations shall not exceed 0.05 mg/l in any stream at the point where it enters any standing body of water, nor 0.025 mg/l in any standing body of water. A desired goal in order to prevent plant nuisances in streams and other flowing waters appears to be 0.1 mg/L total P. These values are not to be exceeded more than 10% of the time unless studies of the specific body in question clearly show that water quality objective changes are permissible, and changes are approved by the SDRWQCB. Analogous threshold values have not been set for nitrogen compounds; however, natural ratios of nitrogen to phosphorus are to be determined by surveillance and monitoring and upheld. If data are lacking, a ratio of N:P=10:1 shall be used. (Basin Plan Water Quality Objective for Inland Surface Water for the Lower San Diego River Hydrologic Area). 5 Total nitrogen is the sum of total Kjeldahl nitrogen, total nitrite as N, and total nitrate as N. -- No applicable water quality objective
Selected Metals Metals can be measured in water samples as total metals or dissolved metals. Total metals analyses for water samples include the metals content both dissolved in the water and present in the suspended particles in the water. Typically, a dissolved metals analysis of a water sample is performed by removing the particulates with a filter, then analyzing the filtered water for dissolved metals. The most common filters used for this purpose have a 0.45 micrometer pore size. Dissolved metals are comprised of the ‘free’ ionic form plus complexed species (USEPA, 2007).
The metals cadmium, copper, lead, and zinc can be toxic at high concentrations. The bioavailability of these metals is an important factor in evaluating the potential for toxicity. Specifically, correlations have been found between toxicity and ‘free’ or weakly-complexed metal species; strongly complexed metals and metals that are absorbed into suspended particles have been found to be less toxic (USEPA, 2007).
Results for total and dissolved cadmium, copper, lead, and zinc are summarized in Table 2-9.

SDSU Mission Valley Campus Project WQTR 16 August 2019
Table 2-9: Wet and Dry Season Metals Data
Constituent Water Quality Objective
WQTR Station
ID
No. of Samples
No. of Detects Min. Avg. Max.
Wet Season Data (October 1 – April 30) Dissolved Cadmium (µg/L) 4.3 2 A, E 4 4 0.02 0.04 0.05
Total Cadmium (µg/L) 4.5 2 E 2 2 0.05 0.11 0.16
Dissolved Copper (µg/L) 13 2 E 2 2 2.80 4.85 6.90
Total Copper (µg/L) 14 2 E 2 2 4.90 10.95 17.00 Dissolved Lead (µg/L) 65 2 A, E 4 4 0.09 0.19 0.43 Total Lead (µg/L) 82 2 E 2 2 1.30 2.90 4.50 Dissolved Zinc (µg/L) 120 2 A, E 4 4 2.85 15.56 45.00 Total Zinc (µg/L) 120 2 E 2 2 17.00 46.50 76.00
Dry Season Data (May 1 – September 30)
Dissolved Cadmium (µg/L) 2.2 3 A, E 4 2 0.01 0.02 0.03
Total Cadmium (µg/L) 2.5 3 E 2 0 0.01 0.01 0.01
Dissolved Copper (µg/L) 3.0 3 E 2 2 0.25 0.57 0.88
Total Copper (µg/L) 3.3 3 E 2 2 0.58 0.74 0.90 Dissolved Lead (µg/L) 2.5 3 A, E 4 2 0.01 0.02 0.03 Total Lead (µg/L) 3.2 3 E 2 2 0.10 0.10 0.10 Dissolved Zinc (µg/L) 120 3 A, E 4 4 2.04 2.68 3.66 Total Zinc (µg/L) 120 3 E 2 2 2.50 2.50 2.50
Notes: 1 For non-detect values (results qualified as “ND”), half of the detection limit was used to calculate the average concentration. For values qualified as a “DNQ,” half the reporting limit was used to calculate the average concentration. A “DNQ” value was counted as a detect. 2 Water quality standards for metals are acute (maximum one-hour average concentration) California Toxics Rule (CTR) criteria for a hardness value of 100 mg/L. 3 Water quality standards for metals are chronic (4-day average concentration) California Toxics Rule (CTR) criteria for a hardness value of 100 mg/L. -- No applicable water quality objective
Pathogen Indicators Pathogens such as viruses, bacteria, and protozoa that cause illness in humans are difficult to measure. Fecal indicator bacteria (FIB) such as total coliform, fecal coliform and enterococci are commonly measured instead, and their presence indicates the potential for fecal contamination and the possible presence of associated pathogenic organisms. However, it does not indicate the

SDSU Mission Valley Campus Project WQTR 17 August 2019
origin of the contamination, which could be attributed to numerous natural and anthropogenic sources.
Table 2-10 summarizes data for pathogen indicators. Pathogen indicators include enterococcus, E. coli, fecal coliform and total coliform.
Table 2-10: Wet and Dry Season Pathogen Indicator Data
Constituent Water
Quality Objective
WQTR Station
ID
No. of Samples
No. of Detects Min. Avg.2 Max.
Wet Season Data (October 1 – April 30) Enterococcus (MPN/100 mL) 333 B, C, E 102 101 7 3,880 110,000
E. coli (MPN/100 mL) 1263 B, C 97 97 10 2,956 118,700 Fecal Coliform (MPN/100 mL) 2004 C, E 61 61 5 11,960 420,000
Total Coliform (MPN/100mL) -- B, E 46 45 30 10,664 170,000
Dry Season Data (May 1 – September 30) Enterococcus (MPN/100 mL) 333 B, C, E 132 126 1 296 16,000
E. coli (MPN/100 mL) 1263 B, C 119 116 2 757 36,540 Fecal Coliform (MPN/100 mL) 2004 C, E 104 101 1 917 57,000
Total Coliform (MPN/100mL) -- B, E 31 31 230 4,768 24,192
Notes: 1 It is assumed that MPN is equivalent to CFU. Enterococcus and fecal coliform were measured in units of MPN or CFU depending on the method used. The water quality objective is in units of MPN. 2 Average is a mean of all data and is not suitable for direct comparison to the water quality objectives based on a 30-day period. It is assumed that MPN is equivalent to CFU. 3 The bacteriological criteria published by the USEPA for contact recreation (REC-1) in the Federal Register, Vol. 51, No. 45, specifies a steady state concentration of Enterococcus of 33 colonies per 100 ml E. coli of 126 colonies per 100 ml for freshwater. The USEPA criteria apply to water contact recreation only. 4 The fecal coliform water quality objective for contract recreation (REC-1). The fecal coliform concentration, based on a minimum of not less than five samples for any 30-day period, shall not exceed a log mean of 200 organisms per 100 ml. In addition, the fecal coliform concentration shall not exceed 400 organisms per 100 ml for more than 10 percent of the total samples during any 30-day period. -- No applicable water quality objective
Selected Municipal Supply Constituents Results for dissolved manganese and sulfate are summarized in Table 2-11.

SDSU Mission Valley Campus Project WQTR 18 August 2019
Table 2-11: Wet and Dry Season Municipal Supply Data
Constituent Water Quality
Objective
WQTR Station ID
No. of Samples
No. of Detects Min. Avg. Max.
Wet Season Data (October 1 – April 30) Manganese, Dissolved (µg/L) 501 A 2 2 140 378 616
Sulfate, Dissolved (mg/L) 5001 A 2 2 156 222 287
Dry Season Data (May 1 – September 30) Manganese, Dissolved (µg/L) 501 A 2 2 78 100 121
Sulfate, Dissolved (mg/L) 5001 A 2 2 277 349 420
Note: 1 Concentrations not to be exceeded more than 10% of the time during any one-year period (Basin Plan Water Quality Objective for Inland Surface Water for the Lower San Diego River Hydrologic Area).
2.4.3 Murphy Canyon Creek
Surface water quality data for Murphy Canyon Creek in the vicinity of the Project is provided below. Surface water quality data are available on the California Environmental Data Exchange Network (CEDEN) website for one upstream station (SMC01990) for Murphy Canyon Creek north of the Project. Water quality samples were collected under the Stormwater Monitoring Coalition Regional Watershed Monitoring Program. The latitude, longitude, relative location, and approximate distance of the station to the Project is provided in Table 2-12.
Table 2-12: Murphy Canyon Creek Monitoring Station Location in the Vicinity of the Project
Station Name Latitude (°N)
Longitude (°E)
Station Location Relative to Project
Approximate Distance to the Project1 (miles)
SMC01990 32.7965 -117.1133 Upstream of Project 1.2
Note: 1 Distance is measured to the centroid of the Project boundary.
Water quality data was collected during three dry weather sampling events from 2009 through 2014, for several pollutants of concern including conventional parameters, nutrients, and metals. In-situ field measurements were also taken at some locations. The primary pollutant group, sample start date, and sample end date is provided in Table 2-13.

SDSU Mission Valley Campus Project WQTR 19 August 2019
Table 2-13: Murphy Canyon Creek Monitoring Station Sample Date Range and Parameter Group
Station Name WQTR Station ID Pollutant Group Start Date End Date
SMC01990 F Conventional, Field
Measurements, Nutrients, Metals
5/21/2009 7/15/2014
Water quality data for conventional parameters, selected nutrients, and selected metals are summarized in Table 2-14 through Table 2-16 below.
Field Measurements and Conventional Parameters Results for DO, turbidity and TSS are summarized in Table 2-14 below.
Table 2-14: Murphy Canyon Creek Dry Season Field Measurements and Conventional Parameters
Notes: 1 For non-detect values (results qualified as “ND” or “<”), half of the detection limit was used to calculate the average concentration. For values qualified as a “DNQ,” half the reporting limit was used to calculate the average concentration. A “DNQ” value was counted as a detect. 2 Dissolved oxygen and turbidity were field measured parameters. 3 Dissolved oxygen levels shall not be less than 5.0 mg/l in inland surface waters with designated MAR or WARM beneficial uses or less than 6.0 mg/l in waters with designated COLD beneficial uses. The annual mean dissolved oxygen concentration shall not be less than 7 mg/l more than 10% of the time. 4 Concentrations not to be exceeded more than 10% of the time during any one-year period (Basin Plan Water Quality Objective for Inland Surface Water for the Murphy Canyon Creek Hydrologic Area). -- No applicable water quality objective
Selected Nutrients Table 2-15 summarizes data for nitrogen and phosphorus compounds.
Constituent
Water Quality
Objective WQTR
Station ID No. of
Samples No. of
Detects Min Avg. Max Dry Season Data (May 1 – September 30)
Dissolved Oxygen 2 (DO) (mg/L) 7 3 F 2 2 5.62 7.26 8.90
Turbidity 2 (NTU) 20 4 F 2 2 0.00 0.20 0.40 Total Suspended Solids (TSS) (mg/L) -- F 2 2 2.5 9.3 16.0

SDSU Mission Valley Campus Project WQTR 20 August 2019
Table 2-15: Murphy Canyon Creek Dry Season Nutrient Data
Constituent Water Quality Objective
WQTR Station ID
No. of Samples
No. of Detects Min. Avg. Max.
Dry Season Data (May 1 – September 30) Total Ammonia (NH3) as N (mg/L) 0.0252,3 F 2 0 0.02 0.02 0.02
Total Nitrate (NO3) as N (mg/L) See note 4 F 2 2 0.15 0.21 0.27
Nitrate + Nitrite as N, Total (mg/L) See note 5 F 1 1 0.29 0.29 0.29
Total Nitrogen (mg/L) See note 4, 5 F 2 2 0.90 1.03 1.15 Total Kjeldahl Nitrogen (TKN) (mg/L)
See note 3, 4 F 2 2 0.62 0.81 1.00
Total Phosphorus as P (mg/L) See note 3, 4 F 2 2 0.15 0.15 0.15
Notes: 1 For non-detect values (results qualified as “ND” or “<”), half of the detection limit was used to calculate the average concentration. For values qualified as a “DNQ,” half the reporting limit was used to calculate the average concentration. A “DNQ” value was counted as a detect. 2 The water quality objective for unionized ammonia is 0.025 mg/L; there is no water quality objective for total ammonia or dissolved ammonia. 3 Detection limits varied over time as methods/technology changed for the following parameters: total ammonia (NH3) as N, dissolved nitrate (NO3) as N, total Kjeldahl nitrogen (TKN), dissolved phosphorus as P, and total phosphorus as P. 4 Concentrations of nitrogen and phosphorus, by themselves or in combination with other nutrients, shall be maintained at levels below those which stimulate algae and emergent plant growth. Threshold total Phosphorus (P) concentrations shall not exceed 0.05 mg/l in any stream at the point where it enters any standing body of water, nor 0.025 mg/l in any standing body of water. A desired goal in order to prevent plant nuisances in streams and other flowing waters appears to be 0.1 mg/L total P. These values are not to be exceeded more than 10% of the time unless studies of the specific body in question clearly show that water quality objective changes are permissible and changes are approved by the SDRWQCB. Analogous threshold values have not been set for nitrogen compounds; however, natural ratios of nitrogen to phosphorus are to be determined by surveillance and monitoring and upheld. If data are lacking, a ratio of N:P=10:1 shall be used. (Basin Plan Water Quality Objective for Inland Surface Water for the Murphy Canyon Creek Hydrologic Area). 5 Total nitrogen is the sum of total Kjeldahl nitrogen, total nitrite as N, and total nitrate as N. -- No applicable water quality objective
Selected Metals Results for total and dissolved cadmium, copper, lead, and zinc are summarized in Table 2-16.

SDSU Mission Valley Campus Project WQTR 21 August 2019
Table 2-16: Murphy Canyon Creek Dry Season Metals Data
Constituent Water Quality Objective
WQTR Station
ID
No. of Samples
No. of Detects Min. Avg. Max.
Dry Season Data (May 1 – September 30)
Dissolved Cadmium (µg/L) 2.2 3 F 1 0 0.01 0.01 0.01
Total Cadmium (µg/L) 2.5 3 F 2 1 0.05 0.08 0.10
Dissolved Copper (µg/L) 3.0 3 F 2 2 1.70 2.05 2.40
Total Copper (µg/L) 3.3 3 F 2 2 2.40 2.40 2.40 Dissolved Lead (µg/L) 2.5 3 F 1 1 0.10 0.10 0.10 Total Lead (µg/L) 3.2 3 F 2 1 0.03 0.26 0.49 Dissolved Zinc (µg/L) 120 3 F 2 2 1.80 2.15 2.50 Total Zinc (µg/L) 120 3 F 2 2 1.00 3.60 6.20
Notes: 1 For non-detect values (results qualified as “ND”), half of the detection limit was used to calculate the average concentration. For values qualified as a “DNQ,” half the reporting limit was used to calculate the average concentration. A “DNQ” value was counted as a detect. 2 Water quality standards for metals are acute (maximum one-hour average concentration) California Toxics Rule (CTR) criteria for a hardness value of 100 mg/L. 3 Water quality standards for metals are chronic (4-day average concentration) California Toxics Rule (CTR) criteria for a hardness value of 100 mg/L. -- No applicable water quality objective
2.4.4 Surface Water Quality Data Summary
The data collected along the lower San Diego River and Murphy Canyon Creek in the vicinity of the Project indicate that the lower San Diego River and Murphy Canyon Creek may not currently be meeting water quality standards for dissolved oxygen over the study period (2004-2015) and (2009-2014), respectively during the dry season. The Basin Plan objective states that the annual mean dissolved oxygen concentration should not be less than 7 mg/L more than 10% over the time. All of the dissolved oxygen measurements collected on the lower San Diego River were less than 7 mg/L; however, only six measurements were collected over the 11-year span. One of the two dissolved oxygen measurements collected in Murphy Canyon Creek were less than 7 mg/L.
Water quality data for turbidity indicate that the Basin Plan standard of 20 NTU is being met along the lower San Diego River for the wet season and the dry season and for Murphy Canyon Creek for the dry season. Average turbidity measures during the wet season and the dry season for the lower San Diego River are 4.63 and 3.72 NTU, respectively. Average turbidity measures during the dry season for Murphy Canyon Creek were 0.20 NTU. The Basin Plan does not identify a numeric standard for TSS and the available TSS data does not indicate that TSS is a

SDSU Mission Valley Campus Project WQTR 22 August 2019
cause of “nuisance or adverse effects to beneficial waters.” Oil and grease data were collected on four occasions between 2013 and 2014 at the San Diego River TWAS station upstream of the Project. All oil and grease results were below the reporting limit and indicating that concentrations are not at levels that would “cause nuisance or which otherwise adversely affect beneficial uses.”
Stations upstream (San Diego River TWAS 1, Murphy Canyon Creek SMC01990) and downstream (San Diego River 15 and Fashion Valley Road) of the Project also measured nitrogen and phosphorus concentrations. The data indicate that phosphorus may not meet the Basin Plan’s numeric water quality standards. The Basin Plan numeric objective for total phosphorus is 0.05 mg/L in any stream at the point where it enters any standing body of water. All wet weather and dry weather data exceed the Basin Plan standard for total phosphorus along the lower San Diego River and Murphy Canyon Creek in the vicinity of the Project.
Metals data are available along the lower San Diego River in the vicinity of the Project and the downstream station (San Diego River 15) and the upstream station (San Diego River TWAS 1, , Murphy Canyon Creek SMC01990). Selected metals include cadmium, copper, lead, and zinc and were collected from 2004 to 2005 at the San Diego River 15 station, from 2013 to 2014 at the San Diego River TWAS 1 station, and in 2009 and 2014 at the Murphy Canyon Creek SMC01990 station. The average and maximum wet and dry weather concentrations do not exceed the domestic or municipal water supply objectives specified in the Basin Plan. Metals concentrations are generally lower in the dry season compared to the wet season.
Indicator bacteria data were collected under the SDCK (Fashion Valley Road station), TMDL (Lower San Diego River at Camino Del Este station), and the NPDES (San Diego River TWAS 1 station) monitoring programs from 2009 through 2018. No indicator bacteria data was collected at the Murphy Canyon Creek SMC01990 station. Most of the indicator bacteria data was collected under the SDCK and the TMDL programs (samples were collected on only four days under the NPDES program). Data from the stations downstream of the Project indicate that enterococcus, E. coli, and fecal coliform may not meet the REC-1 Basin Plan objectives during the wet season and the dry season. The REC-1 Basin Plan objectives for enterococcus and E. coli are 33 and 126 colonies per 100 mL. Approximately 100 samples were collected for enterococcus and E. coli during the wet season between 2009 and 2018 and average concentrations are 3,880 and 2,956 MPN per 100 mL. Average concentrations of enterococcus and E. coli are lower during the dry season, 296 and 757 MPN per 100 mL, respectively, but still exceed the Basin Plan objectives. The lower San Diego River may not be meeting the Basin Plan criteria for fecal coliform (30-day average concentration of 2,000 organisms per 100 mL or no more than 10% of samples exceed 4,000 organisms per 100 mL in any 30-day period) during the wet season. The average concentration of fecal coliform during the wet season is 11,960 MPN/100 mL (a 30-day average concentration was not calculated). The average concentration of fecal coliform was lower during the dry season (917 MPN/mL) and may meet the Basin Plan numeric criteria. There is no applicable objective for total coliform. Average concentrations of total coliform were higher during the wet season (10,664 MPN/100 mL) compared to the dry season (4,768 MPN/100 mL).
Municipal supply data for dissolved manganese and dissolved sulfate were collected at the San Diego River 15 station downstream of the Project for four events between 2004 and 2005. No

SDSU Mission Valley Campus Project WQTR 23 August 2019
dissolved manganese and dissolved sulfate data were collected at the Murphy Canyon Creek SMC01990 station. The data for dissolved manganese indicate that the lower San Diego River may not meet the Basin Plan objective during the wet season or the dry season. All individual samples collected exceeded the objective of Basin Plan objectives of 50 µg/L, although only four events were sampled. The data for dissolved sulfate indicate that the Basin Plan objective of 500 mg/L is being met during the wet season and the dry season.
2.5 Existing Groundwater Quality
The San Diego River Watershed Management Area (WMA) contains three groundwater basins: Mission Valley, San Diego River Valley, and El Cajon Valley. The capacity of the San Diego River Valley groundwater basin is 97,000 acre-feet. Groundwater resources are limited in the downstream portions of the San Diego River WMA because of high concentrations of total dissolved solids, and groundwater contamination in the Mission Valley groundwater basin (City of San Diego, 2015a).
A portion of the Project is located within the Mission Valley Groundwater Basin. The Mission Valley Groundwater Basin is a narrow alluvial aquifer extending horizontally along the San Diego River from the bottom of Mission Gorge downstream to the river’s tidal estuary beginning approximately at I-5 (City of San Diego, 2018). The City utilized Mission Valley groundwater as a source of potable supply from 1916 to approximately 1939. During this period, the City operated up to twelve wells reaching into the gravels and alluvium of the San Diego River paleochannel, in an area extending from the Project southwest to the present river channel. The reasons for the City’s retirement of these wells in 1939 appear to have included poor quality and poor tasting water, and the advent of more economical and higher quality supplies from El Capitan Reservoir (completed 1935) and other sources. Subsequent to 1939, the City has not utilized the groundwater.
Currently no significant withdrawals are conducted due to the petroleum plume from the KMEP Mission Valley Terminal (City of San Diego, 2015a). Due to historic groundwater contamination from the KMEP MVT adjacent to the proposed Project’s northeast corner and on the north side of Friar’s Road, a groundwater plume exists under the stadium and approximately 50 percent of the area under the parking lot (City of San Diego, 2015a). The source of the contamination is associated with the 200,000-gallon gasoline release from KMEP Mission Valley Terminal between 1987 to 1991. The release of gasoline resulted in the Mission Valley groundwater contamination of methyl tertiary butyl ether (MTBE) and tert-butyl alcohol (TBA). The contamination from the terminal extends offsite approximately 2,000 feet south to southwest.
In 1992, a Cleanup and Abatement Order (CAO) 92-01 for the Mission Valley Terminal was issued to Kinder Morgan (City of San Diego, 2015a). In 1993-1994, a pump and treat system was added along the northern portion of the parking lot. The system is intended to capture and treat both the free-phase and dissolved phase petroleum hydrocarbons in groundwater. In the 2015 Post Remediation Groundwater Mission Valley Aquifer Report, results showed that the remediation effort did not meet compliance, thus KMEP continued the remediation effort onsite with oversight from the San Diego Regional Water Quality Control Board (SDRWQCB). In June 2016, the City of San Diego and Kinder Morgan signed a settlement agreement specifying

SDSU Mission Valley Campus Project WQTR 24 August 2019
conditions and arrangements for future development of the stadium area and Mission Valley groundwater (City of San Diego, 2018). Active remediation at the Mission Valley Terminal ceased in January 2019 with the approval of the SDRWQCB to transition into a passive remediation and monitoring program (Geosyntec Consultants, 2019b).
A summary of expected source water concentrations in the Mission Valley Groundwater Basin, based on available groundwater monitoring data in the vicinity of the Project, provided in the Mission Valley Groundwater Feasibility Study 2018 (City of San Diego, 2018), is summarized in Table 2-17 below.
Table 2-17: Well Water Quality Assumptions
Parameter Value(s) Range Volatile Organic Compounds
Tertiary Butyl Alcohol (TBA) (µg/L) 10, 30, 60, 160 0 – 1501 Methyl tert-butyl ether (MTBE) (µg/L) 2 0 – 5 Benzene (µg/L) 1 0 – 3 Toluene (µg/L) 0.4 0 – 0.4 Ethyl Benzene (µg/L) 0.4 0 – 0.6 m, p-Xylene (µg/L) 1 0 – 2.5 o-Xylene (µg/L) 1 0 – 1.4
General Water Characteristics (Physical and Chemical) pH (standard units) 6.7 5.7 – 7.7 Alkalinity (mg/L as CaCO3) 380 260 – 840 Temperature (⸰C) 22 20 – 25 Total Dissolved Solids (TDS) (mg/L) 1,700 1,100 – 2,000 Iron, Dissolved (mg/L) 8 0.5 – 17 Manganese, Dissolved (mg/L) 3 0.5 – 3.5 Bromide (mg/L) 2.2 0.6 – 3.8 Nitrate (mg/L as N) <0.1 <0.1 – 0.5 Total Organic Carbon (TOC) (mg/L)2 6.8 0.7 - 28
Source: Mission Valley Groundwater Feasibility Study 2018 (City of San Diego, 2018). 1 Note: three highest measured TBA levels (680, split sample 183/350 μg/L) from a limited amount of data and may not be
representative so not included in range, more sampling recommended. 2 Some measured TOC values unusually high for groundwater.
2.5.1 Groundwater Beneficial Uses
The Basin Plan designates existing or potential beneficial uses (as shown in Table 2-18 below) for the Mission Valley Groundwater Basin beneath the Project and specifies groundwater quality objectives in the Basin Plan.

SDSU Mission Valley Campus Project WQTR 25 August 2019
Table 2-18: Existing Beneficial Uses of Project Groundwater Basin
Groundwater Hydrologic Unit Basin Number
Beneficial Uses
MU
N
AG
R
IND
PRO
C
FRSH
GW
R
Lower San Diego HA 7.10 Mission1 San Diego HSA 7.11 ○ ● ● ●
Source: Table 2-5 of the Water Quality Control Plan for the San Diego Basin (Basin Plan) (SDRWQCB, 1994, as amended) Notes: ● Existing Beneficial Use ○ Potential Beneficial Use 1 These beneficial uses do not apply westerly of the easterly boundary of the right-of-way of Interstate 5 and the area is excepted from sources of drinking policy. The beneficial uses for the remainder of the hydrologic area are as shown.
2.5.2 Depth to Groundwater
The Project contains 100 to 150 monitoring and extraction wells along the parking lot of SDCCU Stadium for the KMEP Mission Valley Terminal remediation effort. Wells are located north to northeast of the Project and southwest of SDCCU Stadium. The monitoring data for the remediation effort shows a stable groundwater table elevation range of +38 to +42 feet bgs, lowest along the southwest of the Project (City of San Diego, 2015a).
Group Delta performed a geotechnical investigation at the Project consisting of 32 borings and several Cone Penetration Tests (Group Delta, 2019b). Three of the shallow borings (B-19, B-29 and B-32) were converted to infiltration test holes (I-1, I-2, and I-3). Groundwater was encountered at depths ranging from about seven to nine feet bgs (where measured) within the borings at the river park area of the Project.

SDSU Mission Valley Campus Project WQTR 26 August 2019
3. REGULATORY SETTING
3.1 Federal Regulations
3.1.1 Clean Water Act
In 1972, the Federal Water Pollution Control Act [later referred to as the Clean Water Act (CWA)] was amended to require NPDES permits for the discharge of pollutants to waters of the United States from any point source. In 1987, the CWA was amended to require that the United States Environmental Protection Agency (USEPA) establish regulations for permitting of municipal and industrial stormwater discharges under the NPDES permit program. The USEPA published final regulations regarding stormwater discharges on November 16, 1990. The regulations require that MS4 discharges to surface waters be regulated by a NPDES permit.
In addition, the CWA requires the States to adopt water quality standards for receiving water bodies and to have those standards approved by the USEPA. Water quality standards consist of designated beneficial uses for a particular receiving water body (e.g., wildlife habitat, agricultural supply, or fishing), along with water quality criteria necessary to support those uses. Water quality criteria are prescribed concentrations or levels of constituents – such as lead, suspended sediment, and fecal coliform bacteria – or narrative statements which represent the quality of water that support a particular use. Because California had not established a complete list of acceptable water quality criteria, USEPA established numeric water quality criteria for certain toxic constituents in receiving waters with human health or aquatic life designated uses in the form of the California Toxics Rule (CTR) (40 CFR 131.38).
CWA Section 303(d) - TMDLs When designated beneficial uses of a particular receiving water body are being compromised by water quality, Section 303(d) of the CWA requires identifying and listing that water body as “impaired”. Once a water body has been deemed impaired, a total maximum daily load (TMDL) must be developed for the impairing pollutant(s). A TMDL is an estimate of the total load of pollutants from point, non-point, and natural sources that a water body may receive without exceeding applicable water quality standards (with a “factor of safety” included). Once established, the TMDL allocates the loads among current and future pollutant sources to the water body. Water quality impairments at the Project location and downstream of the Project location were considered when selecting the pollutants of concern for the water quality impact analysis in this WQTR.
The Project will discharge into the San Diego River. The San Diego River (Lower) is currently listed on the 2014/2016 303(d) list for indicator bacteria, benthic community effects, cadmium, dissolved oxygen, total dissolved solids, total nitrogen as N, total phosphorus, and toxicity. The San Diego River (Lower) is designated a Category 5 reach, which means there are water segments where standards are not met and a TMDL is required, but not yet completed, for at least one of the pollutants being listed for this segment.
Table 3-1 lists the water quality impairments for the San Diego River (Lower) from the 2014/2016 CWA Section 303(d) list.

SDSU Mission Valley Campus Project WQTR 27 August 2019
Table 3-1: 2014/2016 CWA Section 303(d) Listings for the San Diego River (Lower)
Pollutant TMDL Completion Potential Sources Indicator Bacteria 2011 • Unknown Sources Benthic Community Effects 2025 • Hydromodification
• Illicit Connections/Illegal Hook-ups/ Dry Weather Flows
• Unknown Nonpoint Source • Unknown Point Source • Urban Runoff/Storm Sewers
Cadmium 2029 • Unknown Sources Dissolved Oxygen 2019 • Unknown Sources Total Dissolved Solids 2019 • Unknown Sources Total Nitrogen as N 2029 • Unknown Sources Total Phosphorus 2019 • Unknown Sources Toxicity 2025 • Unknown Sources
Revised TMDL for Indicator Bacteria Indicator bacteria is a common impairment for water bodies of the San Diego Region, including the Lower San Diego River. Indicator bacteria such as fecal coliform and enterococcus originate in the intestines of warm-blooded animals. Sources of such bacteria include leaking sewer pipes, wildlife, pet wastes, municipal wastewater treatment plants, and homeless encampments, among other sources. When present in surface water, indicator bacteria may cause gastrointestinal illnesses.
In February of 2010, the SDRWQCB adopted Resolution No. R9-2010-0001, an amendment incorporating Revised Bacterial TMDLs Project I into the San Diego Basin Plan. After being approved by the State Water Resources Control Board (SWRCB), the Office of Administrative Law, and the USEPA, this TMDL Basin Plan Amendment became fully effective in April 2011.
Bacteria TMDLs have been established under the TMDL Basin Plan Amendment for the lower six miles of the San Diego River, among twenty other waterbodies listed on the 2002 Clean Water Act Section 303(d) List of Water Quality Limited Segments. Bacteria densities in the waters of the Lower San Diego River unreasonably impair and/or threaten to impair the water quality needed to support the beneficial use of waters designated for Contact Recreation (REC-1). As discussed in Section 4 below, different REC-1 Water Quality Objectives (WQOs) were used as the basis for wet weather and dry weather allowable load because the bacteria transport mechanisms to receiving waters are different under wet and dry weather conditions. Wet weather days are defined as days with rainfall events of 0.2 inches or greater and following 72 hours of dry weather. Wet weather and dry weather numeric targets are discussed further in Section 4.
Table 3-2 below summarizes the total allowable loads for fecal coliform, total coliform, and enterococcus in the Lower San Diego River. These TMDLs also apply to the Pacific Ocean Shoreline.

SDSU Mission Valley Campus Project WQTR 28 August 2019
Table 3-2: TMDLs for San Diego River (Lower)
Indicator Bacteria
Wet Weather Total Allowable Load or TMDL
(Billion MPN / year)
Dry Weather Total Allowable Load or TMDL
(Billion MPN / year) Fecal Coliform 4,680,838 1,506 Total Coliform 66,105,222 7,529 Enterococcus1 6,590,966 248
6,595,208 N/A Notes: 1 The Wet Weather TMDL is calculated using an enterococcus numeric target of 61 MPN/mL that is conservatively protective of the REC-1 “designated beach” usage frequency for freshwater creeks and downstream beaches. If the usage frequency of the freshwater creeks can be established as “moderately to lightly used” in the Basin Plan, alternative TMDLs calculated using an enterococcus numeric target of 104 MPN/mL may be used, for a TMDL of 6,595,208 Billion MPN/year.
3.1.2 California Toxics Rule
The California Toxics Rule (CTR) is a federal regulation issued by the USEPA providing water quality criteria for potentially toxic constituents in receiving waters with human health or aquatic life designated uses in the State of California (USEPA, 2000). USEPA adopted the CTR in 2000 to create legally applicable water quality criteria for priority toxic pollutants for inland surface waters, enclosed bays, and estuaries to protect human health and the environment for all purposes and programs under the Clean Water Act. The CTR aquatic life criterion were derived using a CWA Section 304(a) method that produces an estimate of the highest concentration of a substance in water which does not present a significant risk to the aquatic organisms in the water and their uses (USEPA, 2000). The CTR water quality criteria provide a reasonable and adequate amount of protection with only a small possibility of substantial overprotection or under protection. In this document, the CTR criteria are used as one type of benchmark to evaluate the potential impacts of the Project on water quality of the receiving waters.
The CTR’s numerical aquatic life criteria are expressed as short-term (acute) and long-term (chronic) averages, rather than one number, in order that the criterion more accurately reflect toxicological and practical realities (USEPA, 2000). Due to the intermittent nature of stormwater runoff, especially in Southern California, the acute criteria are considered to be more applicable to stormwater conditions than chronic criteria and therefore are used in assessing Project impacts. For example, the average storm duration for all storms in the 41-year period of record for the Fashion Valley ALERT rain gauge is 6.5 hours (Table 2-1). Acute criteria represent the highest concentration of a pollutant to which aquatic life can be exposed for a short period of time (one hour) without deleterious effects; chronic criteria equal the highest concentration to which aquatic life can be exposed for an extended period of time (four days) without deleterious effects.
CTR freshwater criteria, which are hardness concentration-dependent criteria for certain metals, apply to the San Diego River and Murphy Canyon Creek. In the absence of receiving water-specific hardness data, the USEPA default hardness concentration of 100 mg/L was used to

SDSU Mission Valley Campus Project WQTR 29 August 2019
calculate CTR criteria that are compared to the existing metals data for both receiving water bodies (Section 2.4.2).
3.1.3 Federal Antidegradation
The Federal Antidegradation Policy (40 CFR §131.12) requires states to develop statewide antidegradation policies and identify methods for implementing them. Pursuant to the Code of Federal Regulations, state antidegradation policies and implementation methods shall, at a minimum, protect and maintain: (1) existing in-stream water uses; (2) existing water quality where the quality of the waters exceeds levels necessary to support existing beneficial uses, unless the state finds that allowing lower water quality is necessary to accommodate economic and social development in the area; and (3) water quality in waters considered an outstanding national resource. State permitting actions must be consistent with the Federal Antidegradation Policy.
3.2 State Regulations
3.2.1 California Porter-Cologne Act
The federal CWA places the primary responsibility for the control of surface water pollution and for planning the development and use of water resources with the states, although it does establish certain guidelines for the states to follow in developing their programs and allows USEPA to withdraw control from states with inadequate implementation mechanisms.
California’s primary statute governing water quality and water pollution issues with respect to both surface waters and groundwater is the Porter-Cologne Water Quality Control Act of 1970 (Porter-Cologne Act). The Porter-Cologne Act grants the SWRCB and the Regional Water Quality Control Boards (RWQCBs) power to protect water quality and is the primary vehicle for implementation of California’s responsibilities under the federal Clean Water Act. The Porter-Cologne Act grants the SWRCB and the RWQCBs authority and responsibility to adopt plans and policies, to regulate discharges of waste to surface and groundwater, to regulate waste disposal sites and to require cleanup of discharges of hazardous materials and other pollutants. The Porter-Cologne Act also establishes reporting requirements for unintended discharges of any hazardous substance, sewage, or oil or petroleum product.
Each RWQCB must formulate and adopt a water quality control plan (Basin Plan) for its region. The Basin Plan must conform to the policies set forth in the Porter-Cologne Act and established by the SWRCB in its state water policy. To implement State and Federal law, the Basin Plan establishes beneficial uses for surface and groundwaters in its region and sets forth narrative and numeric water quality standards to protect those beneficial uses. The Porter-Cologne Act also provides that a RWQCB may include within its regional plan water discharge prohibitions applicable to particular conditions, areas, or types of waste.

SDSU Mission Valley Campus Project WQTR 30 August 2019
3.2.2 California Antidegradation Policy
The California Antidegradation Policy, otherwise known as the Statement of Policy with Respect to Maintaining High Quality Water in California, was adopted by the SWRCB (State Board Resolution No. 68-16) in 1968. Unlike the Federal Antidegradation Policy, the California Anti-Degradation Policy applies to all waters of the state, not just surface waters. Under the policy, whenever the existing quality of a water body is better than the quality established in individual Basin Plans, such high quality must be maintained and discharges to that water body must not unreasonably affect any present or anticipated beneficial use of the water resource.
3.2.3 Basin Plan
The Basin Plan for the San Diego Region (SDRWQCB, 1994, as amended) provides numeric and narrative criteria for a range of water quality constituents applicable to certain receiving water bodies and groundwater basins within the region. Master criteria are provided for the larger, designated water bodies within the region, as well as general criteria or guidelines for ocean waters, bays and estuaries, inland surface waters, and groundwaters. Those waters not specifically listed (generally smaller tributaries) are assumed to have the same beneficial uses as the streams, lakes, or reservoirs to which they are tributary. In general, the narrative criteria require that degradation of water quality does not occur due to increases in pollutant loads that will adversely impact the designated beneficial uses of a water body. For example, the Basin Plan requires that inland surface “waters shall not contain suspended and settleable solids in concentrations of solids that cause nuisance or adversely affect beneficial uses”. Water quality criteria apply within receiving waters as opposed to applying directly to runoff; therefore, water quality criteria from the Basin Plan are utilized as benchmarks as one method to evaluate the potential ecological impacts of Project runoff on the receiving waters of the proposed project. Table 2-3 lists the beneficial uses of applicable surface receiving waters.
The Project is located in the Mission San Diego Hydrologic Subarea (HAS 907.11) in the Lower San Diego Hydrologic Area, which has water quality objectives in the Basin Plan, see Table 3-3 below.
Table 3-3: Water Quality Objectives for Inland Surface Waters
Inland Surface Waters
Hydrologic Unit Basin Number
Constituent (mg/L or as noted)
TD
S
Chl
orid
e
Sulfa
te
% S
odiu
m
N&
P
Iron
Man
gane
se
MB
AS
Bor
on
Odo
r
Tur
bidi
ty
Col
or U
nit
Fluo
ride
San Diego Hydrologic Unit 907.00 Lower San Diego Unit HA
7.10 1,000 400 500 60 c 0.3 0.05 0.5 1.0 None 20 20 1.0
Mission San Diego HSA
7.11 1,500 400 500 60 c 1.0 0.05 0.5 1.0 None 20 20 1.0

SDSU Mission Valley Campus Project WQTR 31 August 2019
Notes: a. Corresponds to Table 3-2 of the Basin Plan. b. Concentrations not to be exceeded more than 10% of the time during any one-year period. c. Concentrations of nitrogen and phosphorus, by themselves or in combination with other nutrients, shall be
maintained at levels below those which stimulate algae and emergent plant growth. Threshold total Phosphorus (P) concentrations shall not exceed 0.05 mg/l in any stream at the point where it enters any standing body of water, nor 0.025 mg/l in any standing body of water. A desired goal in order to prevent plant nuisances in streams and other flowing waters appears to be 0.1 mg/l total P. These values are not to be exceeded more than 10% of the time unless studies of the specific body in question clearly show that water quality objective changes are permissible, and changes are approved by the Regional Board. Analogous threshold values have not been set for nitrogen compounds; however, natural ratios of nitrogen to phosphorus are to be determined by surveillance and monitoring and upheld. If data are lacking, a ratio of N: P=10:1 shall be used. Note - Certain exceptions to the above water quality objectives are described in Chapter 4 in the sections titled Discharges to Coastal Lagoons from Pilot Water Reclamation Projects and Discharges to Surface Waters.
The Basin Plan also contains groundwater water quality objectives listed by Hydrologic Subareas. Portions of the Mission Valley Groundwater Basin lie beneath the Project, but the Basin Plan does not specifically designate existing or potential beneficial uses for the groundwater basin beneath the Project.
3.2.4 Statewide Trash Control Requirements
On April 7, 2015, the SWRCB adopted statewide requirements, referred to as the Trash Amendments, for the implementation of trash controls in priority land uses.1 The Trash Amendments do the following: (1) establish a narrative water quality objective for trash, (2) provide corresponding applicability, (3) establish a prohibition on the discharge of trash, (4) provide implementation requirements for permitted storm water and other discharges, (5) set a time schedule for compliance, and (6) provide a framework for monitoring and reporting requirements (SWRCB, 2015).
Two compliance tracks are offered, and each municipality may select either compliance track at its discretion. Track 1 requires municipalities to install and maintain full trash capture systems2 in storm drains that receive runoff from priority land uses (which include commercial development). Track 2 requires the municipality to implement a plan with a combination of full capture systems, multi-benefit projects, institutional controls, and/or other treatment controls to achieve full capture system equivalency. Any new development within the MS4 permittee’s
1 On April 7, 2015, the SWRCB adopted (1) an Amendment to the Water Quality Control Plan for the Ocean Waters of California (Ocean Plan) to Control Trash and Part 1 Trash Provisions of the Water Quality Control Plan for Inland Surface Waters, Enclosed Bays, and Estuaries of California (ISEBE Plan), collectively referred to as the “Trash Amendments”, and (2) approval of the Final Staff Report, including the Substitute Environmental Documentation. Priority land uses include commercial areas. 2 Full capture systems for storm drains are defined in the Trash Amendments as treatment controls (either a single device or a series of devices) that traps all particles that are 5 mm or greater, and has a design treatment capacity that is either: a) of not less than the peak flow rate, Q, resulting from a one-year, one-hour, storm in the subdrainage area, or b) appropriately sized to and designed to carry at least the same flows as the corresponding storm drain.

SDSU Mission Valley Campus Project WQTR 32 August 2019
jurisdiction must be built to immediately comply with the compliance track selected by the municipality.
Upon reissuance or amendment, State and RWQCBs MS4 permits will contain trash control implementation requirements and compliance milestones to demonstrate progress towards 100 percent compliance with the Trash Amendments. The General Permits for Stormwater Discharges Associated with Industrial and Construction Activities will also contain the prohibition of trash in stormwater and non-stormwater discharges when those permits are reissued.
3.2.5 Permits and Policies
California Construction General Permit Pursuant to the CWA Section 402(p), requiring regulations for permitting certain stormwater discharges, the SWRCB issued a statewide general permit for stormwater discharges from construction sites. The California NPDES Construction Stormwater General Permit (Order No. 2009-009-DWQ, as amended by Order 2010-0014-DWQ and 2012-006-DWQ; CA CGP), was adopted by the SWRCB on September 2, 2009 and became effective on July 1, 2010.
In California, any construction or demolition project or activity that results in a land disturbance of equal to or greater than one acre including, but not limited to, clearing, grading, grubbing, or excavation triggers the need for coverage under the CA CGP. This includes smaller areas that are part of a larger common plan of development and sites used for support activities related to a construction site, such as concrete or asphalt batch plants.
Projects are required to submit a Notice of Intent (NOI) to the SWRCB under the CA CGP. The NOI is submitted via an online system called the Stormwater Multiple Applications and Report Tracking System (SMARTS) by the Legally Responsible Person (LRP) as defined in the permit. As part of the obtaining coverage, a discharger must complete a construction site risk assessment to determine a project’s Risk Level; prepare a Stormwater Pollution Prevention Plan (SWPPP), including site maps, a Construction Site Monitoring Program, and sediment basin design calculations, if applicable; and for projects located outside of a Phase I or Phase II permit area, complete a post-construction water balance calculation for hydromodification controls.
Once CA CGP coverage is obtained, the SWPPP must be implemented throughout the duration of the project until a Notice of Termination (NOT) is submitted. The primary objective of the SWPPP is to identify and apply proper construction, implementation, and maintenance of BMPs to reduce and/or eliminate pollutants in stormwater discharges and authorized non-stormwater discharges from the construction site during construction. The SWPPP also outlines the monitoring and sampling program required for the construction site to verify compliance with discharge Numeric Action Levels (NALs) set by the CA CGP for the project Risk Level.
Phase II Small MS4 Permit On February 5, 2013, the SWRCB adopted Waste Discharge Requirements for Stormwater Discharges from Small Municipal Separate Storm Sewer Systems (MS4s) (Order No. 2013-0001-DWQ, NPDES Permit No. CAS000004; Small MS4 Permit), which became effective on July 1, 2013. The Small MS4s includes systems similar to separate storm sewer systems in

SDSU Mission Valley Campus Project WQTR 33 August 2019
municipalities, such as systems at universities, military bases, large hospitals or prison complexes, and highways and other thoroughfares; these systems are referred to as Non-Traditional Small MS4s. San Diego State University is listed as a Non-Traditional Small MS4 permittee in the Small MS4 Permit. Therefore, the Project is subject to the requirements for Non-Traditional Small MS4s of the Small MS4 Permit.
Non-Traditional Small MS4 permittees are required to do the following:
• Have the legal authority to meet the requirements of the Small MS4 Permit.
• Develop and implement a comprehensive stormwater Public Education and Outreach Program to develop proper procedures for reporting and responding to spills, develop a training program, draft guidance on appropriate stormwater BMPs, and annually assess trained staff.
• Develop and implement a Public Involvement and Participation Program to involve the public in the development and implementation of activities related to the program.
• Develop an Illicit Discharge Detection and Elimination Program to detect, investigate, and eliminate illicit discharges, including illegal dumping, into its system and/or coordinate with an adjacent Phase I MS4 Permittee’s existing program.
• Develop, implement, and enforce a Construction Site Runoff Program to prevent construction site discharges of pollutants and impacts on beneficial uses of receiving waters. The program shall include the development of contract language ensuring the Permittee’s in-house construction operators or outside contractors comply with the CGP.
• Develop and implement a Pollution Prevention/Good Housekeeping for Permittees Operations Program to prevent or reduce the amount of pollutant runoff from Permittee operations.
• Develop a Post-Construction Stormwater Management Program and comply with BMP sizing and BMP selection requirements for applicable projects.
• Develop and implement a Program Effectiveness Assessment and Improvement Plan to track short and long-term progress of the stormwater program.
The Small MS4 Permit details specific requirements for new development and significant redevelopment projects including selection, sizing, and design criteria for structural low impact development (LID) BMPs (in addition to site design and source control requirements)3. Structural LID BMP requirements (i.e., Project Performance Criteria) are as follows:
• LID retention BMPs must be selected to retain (i.e., intercept, store, infiltrate, evaporate, and/or evapotranspire) the volume of stormwater runoff produced from the 85th percentile, 24-hour storm event (water quality design volume) to the maximum extent feasible.
3 The Phase II Small MS4 Permit LID site design and source control requirement are described in Section 5.

SDSU Mission Valley Campus Project WQTR 34 August 2019
• If it is technically infeasible to retain all or part of the water quality design volume, LID biofiltration BMPs may be used. Volume-based biofiltration BMPs must either be sized to capture and treat approximately the 85th percentile, 24-hour storm runoff event using the WEF Manual (1998); or the volume of annual runoff to achieve 80% or more long-term capture using local rainfall data. Alternatively, flow-through biofiltration BMPs must either be sized to capture and treat the flow of runoff produced from a rain event equal to or at least 0.2 inches per hour intensity; or the flow of runoff produced from a rain event equal to at least 2 times the 85th percentile hourly rainfall intensity as determined from local rainfall records.
The Project’s LID BMPs will be sized to achieve 80% or more long-term capture using local rainfall data, which equates to the most conservative sizing method.
California Green Building Standards Code (CALGreen Code) The 2016 California Green Building Standards Code (CALGreen Code) as Part 11 of the California Building Standards Code (Title 24), became effective on January 1, 2017. The CALGreen Code measures are designed to improve public health, safety, and general welfare by utilizing design and construction methods that reduce the negative environmental impact of development and encourage sustainable construction practices.
CALGreen provides mandatory direction to developers of all new construction and renovations of residential and non-residential structures with regard to all aspects of design and construction, including but not limited to site drainage design, stormwater management, and water use efficiency. Required measures are accompanied by a set of voluntary standards that are designed to encourage developers and cities to aim for a higher standard of development.
Under CALGreen, all residential and non-residential sites are required to be planned and developed to keep surface water from entering buildings and to incorporate efficient outdoor water use measures. Construction plans are required to show appropriate grading and surface water management methods such as swales, water collection and disposal systems, French drains, water retention gardens, and other water measures which keep surface water away from buildings and aid in groundwater recharge. Plans should also include outdoor water use plans that utilize weather or soil moisture-controlled irrigation systems. In addition to the above requirements, non-residential structures are also required to develop an irrigation water budget for landscapes greater than 2,500 square feet that conforms to the local water efficient landscape ordinance or to the California Department of Water Resources (DWR) Model Water Efficient Landscape Ordinance where no local ordinance is applicable.
Model Water Efficient Landscape Ordinance (MWELO) The City adopted the DWR Model Water Efficient Landscape Ordinance (effective September 2009), which became effective in the City in June 2010. Codified in the California Code of Regulations, Title 23 (Waters) Division 2, MWELO establishes a structure for planning, designing, installing, maintaining, and managing water efficient landscapes in new construction and remodel projects, in accordance with the Water Conservation in Landscaping Act of 2006. In 2015, Executive Order B-29-15 (EO) tasked DWR with revising the 2010 updated MWELO to increase water efficiency standards for new and retrofitted landscapes through encouraging the

SDSU Mission Valley Campus Project WQTR 35 August 2019
use of more efficient irrigation systems, graywater usage, and onsite stormwater capture, and by limiting the portion of landscapes that can be covered in turf.
MWELO requires plans for onsite water management practices and waste prevention strategies that include a calculated annual “Maximum Applied Water Allowance”, geared to reduce water use and maximize onsite efficiency. The ordinance is applicable to:
• New construction projects with an aggregate landscape area equal to or greater than 500 square feet requiring a building or landscape permit, plan check, or design review.
• Rehabilitated landscape projects with an aggregate landscape area equal to or greater than 2,500 square feet requiring a building or landscape permit, plan check, or design review.
• Existing landscapes (following a local agency or water purveyor audit).
• Cemeteries (in a limited capacity).
Prior to construction, the ordinance requires property owners and developers to submit a Landscape Documentation Package to their local agency that includes, general project information, a water efficient landscape worksheet, soil management report, landscape design plan, irrigation design plan, and a grading plan. Following construction, property owners and developers are required to submit a certificate of completion and additional maintenance forms if there have been changes to the original plans.
Dewatering General Permit The SDRWQCB issued a General Waste Discharge Requirements for Groundwater Extraction Discharges to Surface Waters within the San Diego Region (Order No. R9-2015-0013, NPDES No. CAG919003) (effective October 1, 2015). The General Order regulates groundwater extraction discharges to surface water including construction dewatering, foundation drains, and groundwater extraction related to groundwater remediation cleanup projects. The Dewatering General Permit does not cover groundwater extraction discharges to land due to construction dewatering, which is regulated under a statewide general order, Statewide General Waste Discharge Requirements for Discharges to Land with a Low Threat to Water Quality (No. 2003-003-DWQ).
The General Order states for groundwater extraction discharges to surface waters, pollutant concentrations in the discharge shall not cause, have a reasonable potential to cause, or contribute to an excursion above any applicable water quality criterion established by USEPA pursuant to CWA Section 303 or adopted by the State or RWQCBs. In no case shall waste be discharged to areas designated as being of special biological significance. Pollutant concentrations in the discharge must comply with the specifications in the General Order. Effluent limitations for groundwater extraction waste discharges vary based on the receiving water type; the four categories are: freshwater inland surface waters, saltwater inland surface waters, bays and estuaries including San Diego Bay, and the surf zone of the Pacific Ocean. As part of obtaining the NOI, dischargers must include an initial sampling and monitoring report.

SDSU Mission Valley Campus Project WQTR 36 August 2019
Discharge of Fill or Dredge Materials If the Project includes any filling or dredging activities within its receiving waters (which are not anticipated), a CWA section 404 permit would be required. Section 404 of the CWA regulates the discharge of dredged and fill material into waters of the United States, including wetlands. Activities that are regulated under this program include fills for development (including physical alterations to drainages to accommodate storm drainage, stabilization, and flood control improvements), water resource projects (such as dams and levees), infrastructure development (such as highways and airports), and conversion of wetlands to uplands for farming and forestry.
USEPA and the USACE have issued Section 404(b)(1) Guidelines (40 CFR 230) that regulate dredge and fill activities, including water quality aspects of such activities. Subpart C Sections 230.20 thru 230.25 contains water quality regulations applicable to dredge and fill activities. Among other topics, these guidelines address discharges which alter substrate elevation or contours, suspended particulates, water clarity, nutrients and chemical content, current patterns and water circulation, water fluctuations (including those that alter erosion or sediment rates), and salinity gradients.
Section 401 of the CWA requires that any person applying for a federal permit or license that may result in a discharge of pollutants into waters of the United States must obtain a state water quality certification that the activity complies with all applicable water quality standards, limitations, and restrictions. Subject to certain limitations, no license or permit may be issued by a federal agency until certification required by Section 401 has been granted. Further, no license or permit may be issued if certification has been denied. CWA Section 404 permits and authorizations are subject to Section 401 certification by the RWQCBs.
Lake or Streambed Alteration Agreement The California Department of Fish and Wildlife (CDFW) is responsible for conserving, protecting, and managing California's fish, wildlife, and native plant resources. To meet this responsibility, the law requires the proponent of a project that may impact a river, stream, or lake to notify the CDFW before beginning the project. This includes rivers or streams that flow at least periodically or permanently through a bed or channel with banks that support fish or other aquatic life and watercourses having a surface or subsurface flow that support or have supported riparian vegetation.
Section 1602 of the Fish and Game Code requires any person who proposes a project that will substantially divert or obstruct the natural flow or substantially change the bed, channel, or bank of any river, stream, or lake or use materials from a streambed to notify the CDFW before beginning the project. Similarly, under section 1602 of the Fish and Game Code, before any state or local governmental agency or public utility begins a construction project that will: 1) divert, obstruct, or change the natural flow or the bed, channel, or bank of any river, stream, or lake; 2) use materials from a streambed; or 3) result in the disposal or deposition of debris, waste, or other material containing crumbled, flaked, or ground pavement where it can pass into any river, stream, or lake, it must first notify the CDFW of the proposed project. If the CDFW determines that the project may adversely affect existing fish and wildlife resources, a Lake or Streambed Alteration Agreement is required.

SDSU Mission Valley Campus Project WQTR 37 August 2019
3.3 Local Regulations
3.3.1 Phase I MS4 Permit
In 2013, the SDRWQCB adopted a NPDES Permit and Waste Discharge Requirements for Discharges from MS4s Draining the Watersheds Within the San Diego Region (Order No. R9-2013-0001, NPDES Permit No. CAS109266, as amended by Order Nos. R9-2015-0001 and R9-2015-0100; Phase I MS4 Permit), under the CWA and the Porter-Cologne Act for discharges of urban runoff in public storm drains within the San Diego Region.
Initial Permittees included 17 cities within San Diego County, County of San Diego, San Diego County Regional Airport Authority, and the San Diego Unified Port District. Order R9-2015-001 revised the Phase I MS4 Permit to enroll Orange County permittees including 11 cities in Orange County, County of Orange, and the Orange County Flood Control District. R9-2015-0100 revised the Permit to enroll three cities in Riverside County, County of Riverside and the Riverside County Flood Control and Conservation District.
The Phase I MS4 Permit regulates stormwater discharges from MS4s within the City of San Diego, outside of the Project, and thus applies to the offsite green street projects. Although the Phase I MS4 Permit requirements do not apply directly to the SDSU campus, which is regulated under the Small MS4 Permit, the Phase I MS4 Permit requirements serve as benchmarks for the entire Project.
Water Quality Improvement Plans The MS4 Permit requires copermittees to develop Water Quality Improvement Plans (WQIPs) for designated Watershed Management Areas (WMAs) that guide their respective jurisdictional runoff management programs to achieving the outcome of improved water quality in MS4 discharges and receiving waters. The basis for the WQIP is implementation of an adaptive planning and management process that identifies the highest priority water quality conditions within a watershed and implements strategies through the jurisdictional runoff management programs to achieve improvements in the quality of discharges from the MS4s and receiving waters. Designated WMAs are included in the MS4 Permit and the Project and its receiving waters are located within the San Diego River WMA.
Copermittee WQIPs are required to include the following information:
• Assessment of receiving water conditions;
• Assessment of impacts from MS4 discharges;
• Identification of priority water quality conditions;
• Identification of MS4 sources of pollutants and/or stressors;
• Identification of potential water quality improvement strategies;
• Water quality improvement goals and schedules;
• Water quality improvement strategies and schedules;

SDSU Mission Valley Campus Project WQTR 38 August 2019
• Water quality improvement monitoring and assessment program;
• Non-stormwater and stormwater numeric action levels to guide WQIP implementation; and efforts and measure progress towards goals;
• Iterative approach and adaptive management process;
• Re-evaluation of priority water quality conditions;
• Adaptation of goals, strategies and schedules; and
• Adaptation of monitoring and assessment program.
The San Diego River Watershed Management Area WQIP (City of El Cajon, et al., 2016) was accepted by the SDRWQCB in 2016.
Planning and Land Development Program Requirements The Phase I MS4 Permit details specific requirements for new development and significant redevelopment projects including selection, sizing, and design criteria for structural LID and hydromodification control BMPs (in addition to LID site design and source control requirements).4 Structural LID BMP requirements (i.e., Project Performance Criteria) are as follows:
• LID retention BMPs must be selected to retain (i.e., intercept, store, infiltrate, evaporate, and/or evapotranspire) the volume of stormwater runoff produced from the 85th percentile, 24-hour storm event (water quality design volume) to the maximum extent feasible.
• If it is technically infeasible to retain all or part of the water quality design volume, LID biofiltration BMPs may be used. Biofiltration BMPs must be sized to capture and treat 1.5 times the remaining portion of the water quality design volume. Alternatively, flow-through biofiltration BMPs that provide a total volume of at least 0.75 times the remaining water quality design volume may be used.
Although it is not anticipated to be the case for the Project, if both of these structural LID BMP options are not technically feasible (i.e., are likely to be ineffective or impermissible considering soils, geography, or other considerations), the MS4 Permit allows for onsite treatment in conjunction with offsite retention volume mitigation, provided a mitigation program is established by the City.
The Phase I MS4 Permit defines hydromodification as the change in the natural watershed hydrologic processes and runoff characteristics (i.e., interception, infiltration, overland flow, and groundwater flow) caused by urbanization or other land use changes that result in increased stream flows and sediment transport. In addition, alteration of stream and river channels, such as stream channelization, concrete lining, installation of dams and water impoundments, and excessive stream bank and shoreline erosion are also considered hydromodification, due to their disruption of natural watershed hydrologic processes. The Phase I MS4 Permit requires priority 4 The Phase I MS4 Permit LID site design and source control requirement are described in Section 5.

SDSU Mission Valley Campus Project WQTR 39 August 2019
development projects to implement hydromodification control BMPs designed and sized to maintain post-project flow rates and durations within 10 percent of pre-development conditions,5 for the range of geomorphically significant flows.6 In addition, development shall avoid critical sediment yield areas or implement measures that allow critical coarse sediment to be discharged to receiving waters, such that there is no net impact to the receiving water. The Phase I MS4 Permit also allows for alternative compliance and mitigation if post-project runoff conditions are not fully managed onsite, which is not an anticipated condition for the Project.
The Phase I MS4 Permit also allows for an exemption from hydromodification control requirements if a project site discharges runoff to receiving waters that are not susceptible to erosion (e.g., a lake, bay, or the Pacific Ocean) either directly or via hardened systems including concrete-lined channels or existing underground storm drain systems. The Final San Diego County Hydromodification Management Plan (HMP) identified certain exemptions from hydromodification management requirements and presented HMP applicability criteria (Brown and Caldwell, 2011). Another allowance for exemption is an area identified by the Copermittee as appropriate for an exemption by the optional Watershed Management Area Analysis incorporated into the WQIP.
3.3.2 City of San Diego Stormwater Standards
The City of San Diego has developed Stormwater Standards (Geosyntec Consultants, 2018) in response to the Phase I MS4 Permit requirements referenced above. The standards are organized into separate manuals as follows:
• Part 1: BMP Design Manual for permanent site design, stormwater treatment and hydromodification management.
• Part 2: Construction BMP Standards for construction-phase stormwater discharges.
• Part 3: Offsite Stormwater Alternative Compliance Program for water quality and hydromodification control post-construction stormwater discharges offsite.
These manuals dictate the considerations and requirements for controlling discharges of pollutants in stormwater associated with construction and permanent phases of development projects. Each manual indicates the applicability of the regulations to particular project types and the procedural steps to comply with the regulations. The Stormwater Standards as codified are effective as of October 1, 2018.
5 The flow control performance standard for hydromodification management is based on controlling flow to pre-development condition (natural) rather than pre-project condition. 6 Geomorphically significant flows range from a low flow boundary up to the 10-year peak flow condition. The low flow boundary must correspond with the critical channel flow that produces the critical shear stress that initiates channel bed movement or that erodes the toe of channel banks. Copermittees may use monitoring results collected pursuant to MS4 Permit Provision D.1.a.(2) to re-define the range of flows resulting in increased potential for erosion, or degraded instream habitat conditions, as warranted by the data.

SDSU Mission Valley Campus Project WQTR 40 August 2019
3.3.3 Tentative Investigative Order No. R9-2018-0021
Tentative Investigative Order No. R9-2018-0021 proposes to direct the City of San Diego, the City of Santee, the City of El Cajon, the City of La Mesa, the County of San Diego, the San Diego County Sanitation District, Padre Dam Municipal Water District, Ramona Municipal Water District, San Diego State University, Metropolitan Transit System, and California Department of Transportation to submit technical and monitoring reports to identify and quantify the sources and transport pathways of human fecal material to the San Diego River Watershed. The SDRWQCB postponed its consideration to adopt the Tentative Investigative Order at the SDRWQCB meeting in August 2018.

SDSU Mission Valley Campus Project WQTR 41 August 2019
4. POLLUTANTS OF CONCERN AND SIGNIFICANCE CRITERIA
4.1 Surface Water Quality Pollutants of Concern for MS4 Area
4.1.1 Pollutants of Concern
Pollutants of concern (POCs) for the Project consist of any pollutants that exhibit one or more of the following characteristics: current loadings or historic deposits of the pollutant are impacting the beneficial uses of a receiving water, elevated levels of the pollutant are found in sediments of a receiving water and/or have the potential to bioaccumulate in organisms therein, or the detectable inputs of the pollutant are at concentrations or loads considered potentially toxic to humans and/or flora and fauna. The POCs for the water quality analysis are those that are anticipated or potentially could be generated by the Project at concentrations, based on water quality data from land uses that are the same as those proposed by the Project, that exhibit these characteristics. Identification of the pollutants of concern also considered Basin Plan beneficial uses and water quality objectives, CTR criteria, and current 303(d) listings and TMDLs for the Lower San Diego River and Murphy Canyon Creek as well as pollutants that have the potential to cause toxicity or bioaccumulate in the receiving waters.
The following pollutants were chosen as pollutants of concern for purposes of evaluating water quality based upon the above considerations:
Sediments (Total Suspended Solids and Turbidity) – Excessive erosion, transport, and deposition of sediment in surface waters are a significant form of pollution resulting in major water quality problems. Sediment imbalances impair waters’ designated uses. Excessive sediment can impair aquatic life by filling interstitial spaces of spawning gravels, impairing fish food sources, filling rearing pools, and reducing beneficial habitat structure in stream channels. In addition, excessive sediment can cause taste and odor problems in drinking water supplies and block water intake structures. Turbidity is associated with project development primarily during the construction phase. The Basin Plan water quality objective for sediment states:
“The suspended sediment load and suspended sediment discharge rate of surface waters shall not be altered in such a manner as to cause nuisance or adversely affect beneficial uses.”
The Basin Plan water quality objective for suspended and settleable solids states:
“Waters shall not contain suspended and settleable solids in concentrations of solids that cause nuisance or adversely affect beneficial uses”.
The Basin Plan water quality objective for turbidity states:
“Waters shall be free of changes in turbidity that cause nuisance or adversely affect beneficial uses. The transparency of waters in lagoons and estuaries shall not be less than 50% of the depth at locations where measurement is made by means of a standard Secchi disk, except where lesser transparency is caused by rainfall runoff from undisturbed natural areas and dredging projects conducted in conformance with waste discharge

SDSU Mission Valley Campus Project WQTR 42 August 2019
requirements of the Regional Board. With these two exceptions, increases in turbidity attributable to controllable water quality factors shall not exceed the following limits:”
Natural Turbidity Maximum Increase 0-50 NTU 20% over natural turbidity level 50-100 NTU 10 NTU Greater than 100 NTU 10% over natural turbidity level
Total Dissolved Solids (TDS) - Total dissolved solids (TDS) comprise of inorganic salts (principally calcium, magnesium, potassium, sodium, bicarbonates, chlorides, and sulfates) and some small amounts of organic matter that are dissolved in water. The recommended secondary drinking water standard for total dissolved solids is 500 mg/L with an upper limit of 1,000 mg/L due to taste considerations. High total dissolved solids concentrations in irrigation waters can be deleterious to plants directly, or indirectly through adverse effects on soil permeability. The Basin Plan objective for TDS in the San Diego River at the Project location is 1,500 mg/L. The Lower San Diego River is listed as impaired for TDS on the 2014/2016 CWA Section 303(d) list.
Nutrients (Nitrogen and Phosphorus) – Nutrients are inorganic forms of nitrogen (nitrate, nitrite and ammonia) and phosphorus. Organic forms of nitrogen are associated with vegetative matter such as particulates from sticks and leaves. Total Nitrogen (TN) is a measure of all nitrogen present, including inorganic and particulate forms. Phosphorus can be measured as total phosphorus (TP) or as dissolved phosphorus. Dissolved phosphorus is the more bioavailable form of phosphorus. TP is often composed mostly of soil-related particulate phosphorus. There are several sources of nutrients in urban areas, mainly fertilizers in runoff from lawns, pet wastes, failing septic systems, atmospheric deposition from industry and automobile emissions, and soil erosion. Nutrient over-enrichment is especially prevalent in agricultural areas where manure and fertilizer inputs to crops significantly contribute to nitrogen and phosphorus levels in streams and other receiving waters. Eutrophication due to excessive nutrient input can lead to changes in algae, benthic, and fish communities; extreme eutrophication can cause hypoxia or anoxia, resulting in fish kills. Surface algal scum, water discoloration, and the release of toxins from sediment can also occur.
The Basin Plan has a water quality objective for un-ionized ammonia in coastal lagoons, which states:
“The discharge of wastes shall not cause concentrations of un-ionized ammonia (NH3) to exceed 0.025 mg/l (as N) in inland surface waters, enclosed bays and estuaries and coastal lagoons”.
The Basin Plan has a water quality objective for biostimulatory substances, which states:
“Concentrations of nitrogen and phosphorus, by themselves or in combination with other nutrients, shall be maintained at levels below those which stimulate algae and emergent plant growth. Threshold total phosphorus (TP) concentrations shall not exceed 0.05 mg/l in any stream at the point where it enters any standing body of water, nor 0.025 mg/l in any standing body of water. A desired goal in order to prevent plant nuisance in streams

SDSU Mission Valley Campus Project WQTR 43 August 2019
and other flowing waters appears to be 0.1 mg/l total P. These values are not to be exceeded more than 10% of the time unless studies of the specific water body in question clearly show that water quality objective changes are permissible, and changes are approved by the Regional Board. Analogous threshold values have not been set for nitrogen compounds; however, natural ratios of nitrogen to phosphorus are to be determined by surveillance and monitoring and upheld. If data are lacking, a ratio of N:P = 10:1, on a weight to weight basis shall be used.”
The Lower San Diego River is listed as impaired for total nitrogen and total phosphorus on the 2014/2016 CWA Section 303(d) list.
Trace Metals (Cadmium, Copper, Lead, Zinc) – The primary sources of trace metals in stormwater are typically commercially available metals used in transportation (e.g. automobiles), buildings, and infrastructure. Metals are also found in fuels, adhesives, paints, and other coatings. Copper, lead, and zinc are the most prevalent metals typically found in urban runoff. Other trace metals, such as cadmium, chromium, and mercury, are typically not detected in urban runoff or are detected at very low levels (LACDPW, 2000).
Metals are of concern because of the potential for toxic effects on aquatic life and the potential for groundwater contamination. High metal concentrations can lead to bioaccumulation in fish and shellfish and affect beneficial uses of receiving waters. These metals also have numeric criteria derived from the CTR. The Lower San Diego River is listed as impaired for cadmium on the 2014/2016 CWA Section 303(d) list.
Pathogens (Bacteria, Viruses, and Protozoa) – Pathogens are agents or organisms that can cause diseases or illnesses, such as bacteria, viruses, and protozoa. Routine monitoring of these organisms was historically not practical because they are usually present in small quantities and required fairly complicated and expensive sampling and analyses. Although these conditions have changed with the introduction of new technologies, current regulations continue to rely on total coliform, fecal coliform, enterococcus and E. coli bacteria as indicator organisms for pathogens. The presence of fecal indicator bacteria indicates the presence of fecal contamination, but it does not necessarily correlate with pathogen presence and therefore human health risk. Two complicating factors are that there are multiple sources of indictor bacteria, including fecal wastes from humans, domesticated animals, and wildlife. Indicator bacteria can also regenerate under some natural conditions. Fecal bacteria (e.g. fecal coliform, E. Coli, and enterococcus) are part of the intestinal biota of warm-blooded animals. Total coliform numbers can include non-fecal bacteria, so additional testing is often done to confirm the presence and numbers of fecal bacteria, specifically.
Basin Plan objectives for numbers of total coliform, fecal coliform, E. Coli, and enterococci vary with the beneficial uses of the water. WQOs are expressed in units of organisms per 100 milliliters of water. Table 4-1 and Table 4-2 below summarize WQOs from the Basin Plan for indicator bacteria in waters designated for Contact Recreation (REC-1) beneficial use.

SDSU Mission Valley Campus Project WQTR 44 August 2019
Table 4-1: Water Quality Objectives, Wet Weather
Indicator Bacteria Wet Weather Water Quality Objectives Numeric Target (MPN/100mL) Allowable Exceedance Frequency 1
Fecal Coliform 400 2 22% Total Coliform 10,000 3 22% Enterococcus 104 4 / 615 22%
Notes: 1 Percent of wet days allowed to exceed the wet weather numeric targets. Exceedance frequency based on reference system in the Los Angeles Region. 2 Fecal coliform single sample maximum WQO for REC-1 use in creeks and at beaches. 3 Total coliform single sample maximum WQO for REC-1 use at beaches and the point in creeks that discharges to beaches. 4 Enterococci single sample maximum WQO for REC-1 use in creeks established and designated as “moderately or lightly used” in the Basin Plan and at beaches downstream of those creeks, as well as all other beaches. 5 Enterococci single sample maximum WQO for REC-1 use in creeks not established and designated as “moderately or lightly used” in the Basin Plan and at beaches downstream of those creeks (“designated beach” frequency of use; applicable to San Juan Creek and downstream beach, Aliso Creek and downstream beach, Tecolote Creek, Forrester Creek, San Diego River and downstream beach, and Chollas Creek).
Table 4-2: Water Quality Objectives, Dry Weather
Indicator Bacteria Dry Weather Water Quality Objectives Numeric Target (MPN/100mL) Allowable Exceedance Frequency 1
Fecal Coliform 200 2 0% Total Coliform 1,000 3 0% Enterococcus 35 4 / 33 5 0%
Notes: 1 Percent of wet days allowed to exceed the wet weather numeric targets. 2 Fecal coliform 30-day geometric mean WQO for REC-1 use in creeks and at beaches. 3 Total coliform 30-day geometric mean WQO for REC-1 use at beaches and the point in creeks that discharges to beaches. 4 Enterococci 30-day geometric mean WQO for REC-1 at beaches. 5 Enterococci 30-day geometric mean WQO for REC-1 use in impaired creeks and beaches downstream of those creeks (applicable to San Juan Creek and downstream beach, Aliso Creek and downstream beach, Tecolote Creek, Forrester Creek, San Diego River and downstream beach, and Chollas Creek).
Lower San Diego River is listed as impaired for bacteria indicators on the on the 2014/2016 CWA Section 303(d) list and a TMDL was adopted for this pollutant (see Section 3.1.1).
Pesticides – Pesticides (including herbicides, insecticides and fungicides) are chemical compounds commonly used to control insects, rodents, plant diseases, and weeds. Excessive application of a pesticide in connection with agriculture cultivation or landscaping may result in runoff containing toxic levels of its active component. Pesticides may be classified as organochlorine pesticides or organophosphorus pesticides, the former being associated with

SDSU Mission Valley Campus Project WQTR 45 August 2019
persistent bioaccumulative pesticides (e.g., DDT and other legacy pesticides) which have been banned.
The Basin Plan states:
“No individual pesticide or combination of pesticides shall be present in the water column, sediments or biota at concentration(s) that adversely affect beneficial uses. Pesticides shall not be present at levels which will bioaccumulate in aquatic organisms to levels which are harmful to human health, wildlife or aquatic organisms”.
Petroleum Hydrocarbons (Oil and Grease and PAHs) – The sources of oil, grease, and other petroleum hydrocarbons in urban areas include spills of fuels and lubricants, discharge of domestic and industrial wastes, atmospheric deposition, and runoff. Runoff can be contaminated by leachate from asphalt roads, wearing of tires, and deposition from automobile exhaust. Also, do-it-yourself auto mechanics may dump used oil and other automobile-related fluids directly into storm drains.
Due to the historic contamination of groundwater from the KMEP Mission Valley Terminal, there were remediation efforts to monitor petroleum hydrocarbons including total petroleum hydrocarbons (TPH) (i.e. diesel and gasoline) and BTEX (benzene, toluene, ethylbenzene, and total xylenes); as well as oxygenates including methyl tertiary-butyl ether (MTBE), tertiary butyl alcohol (TBA), di-isopropyl ether (DIPE), ethyl tertiary butyl ether (ETBE), and tertiary amyl methyl ether (TAME).
Petroleum hydrocarbons, such as polycyclic aromatic hydrocarbons (PAHs), can bioaccumulate in aquatic organisms from contaminated water, sediments, and food and are toxic to aquatic life at low concentrations. Petroleum hydrocarbons can persist in sediments for long periods of time and result in adverse impacts on the diversity and abundance of benthic communities. Hydrocarbons can be measured as TPH, oil and grease, or as individual groups of hydrocarbons, such as PAHs.
The Basin Plan water quality objective for oils, grease, waxes, or other materials states:
“Waters shall not contain oils, greases, waxes, or other materials in concentrations which result in a visible film or coating on the surface of the water or on objects in the water, or which cause nuisance or which otherwise adversely affect beneficial uses”.
In addition, PAHs have human health criteria (for consumption of organisms) in the CTR.
Toxicity – Certain pollutants in stormwater runoff have the potential to be highly toxic to aquatic organisms resulting in effects such as impaired reproduction or mortality. The Basin Plan water quality objective for toxicity is:
“All waters shall be maintained free of toxic substances in concentrations that are toxic to, or that produce detrimental physiological responses in human, plant, animal, or aquatic life…The survival of aquatic life in surface waters subjected to a waste discharge or other controllable water quality factors, shall not be less than that for the same water body in areas unaffected by the waste discharge or, when necessary, for other control

SDSU Mission Valley Campus Project WQTR 46 August 2019
water that is consistent with requirements specified in USEPA, State Water Resources Control Board or other protocol authorized by the Regional Board.”
The Lower San Diego River is listed as impaired for toxicity on the 2014/2016 CWA Section 303(d) list.
Trash and Debris – Trash (such as paper, plastic, polystyrene packing foam, and aluminum materials) and biodegradable organic debris (such as leaves, grass cuttings, and food waste) are general waste products on the landscape that can be entrained in urban runoff. The presence of trash and debris may have a significant impact on the recreational value of a water body and aquatic habitat. Excess organic matter can create a high biochemical oxygen demand in a water body and thereby lower its water quality. Also, in areas where stagnant water exists, the presence of excess organic matter can promote septic conditions resulting in the growth of undesirable organisms and the release of odorous and hazardous compounds such as hydrogen sulfide.
Benthic Community Effects - A benthic community is the biological community that resides in the ecological region at the lowest level of a body of water (benthic zone) such as an ocean, lake, or stream, including the sediment surface and some sub-surface layers. Benthic community effects are characteristics that effect microorganisms and invertebrates that reside in the benthic zone. Impairments of benthic communities are a result of pollutants having a direct impact on organism abundance and taxa. The health of an ecosystem in the benthic zone is measured by conducting a benthic macroinvertebrate bioassessment. A bioassessment collects biological community information to evaluate the biological integrity of a water body and its watershed. With respect to aquatic ecosystems, bioassessment is the collection and analysis of samples of the benthic macroinvertebrate community together with physical/habitat quality measurements associated with the sampling site and the watershed to evaluate the biological condition (i.e. biotic integrity) of a water body.
The San Diego Basin Plan defines the water quality objective for benthic macroinvertebrates as the following:
“The benthic macroinvertebrates index (IBI) is a multi-metric assessment that employs biological metrics that respond to a habitat or water quality impairment. Each of the biological metrics measured at a site are converted to an IBI score then summed. These cumulative scores are then ranked. For the Southern California IBI, sites with scores below 40 are considered to have impaired conditions.”
The Lower San Diego River is listed as impaired for benthic community effects on the 2014/2016 CWA Section 303(d) list due to population and community degradation.
Dissolved Oxygen – Depression of dissolved oxygen levels can lead to fish kills and odors resulting from anaerobic decomposition. Dissolved oxygen content in water is a function of water temperature and salinity.
The Basin Plan has water quality objectives for dissolved oxygen for inland surface waters states:
“Dissolved oxygen levels shall not be less than 5.0 mg/l in inland surface waters with designated MAR or WARM beneficial uses or less than 6.0 mg/l in waters with

SDSU Mission Valley Campus Project WQTR 47 August 2019
designated COLD beneficial uses. The annual mean dissolved oxygen concentration shall not be less than 7 mg/l more than 10% of the time.”
The Lower San Diego River is listed as impaired for dissolved oxygen on the 2014/2016 CWA Section 303(d) list.
4.1.2 Other Constituents
This section discusses other constituents that are listed in the Basin Plan, but for reasons explained in this section, are not pollutants of concern for the Project.
Biostimulatory Substances – Biostimulatory substances are substances that promote growth of algae and nuisance vegetation. These include nutrients from fertilizers and organic wastes. The Basin Plan states that these substances shall not be present in concentrations that “promote aquatic growths to the extent that such growths cause nuisance of adversely affect beneficial uses.” Nutrients (nitrogen and phosphorus compounds), which are POCs, will be used as an indicator of biostimulatory substances.
Color, Taste, and Odor – The Basin Plan contains narrative objectives for color, taste, or odor that causes a nuisance or adversely affects beneficial uses. Undesirable tastes and odors in water may be a nuisance and may indicate the presence of a pollutant(s). Odor associated with water can result from decomposition of organic matter or the reduction of inorganic compounds, such as sulfate. Other potential sources of odor causing substances, such as industrial processes, will not occur as part of the Project. Color in water may arise naturally, such as from minerals, plant matter, or algae, or may be caused by industrial pollutants. It is not anticipated that Project activities will cause discoloration or changes in tastes in the Project’s receiving waters.
Methylene Blue Activated Substance (MBAS) – The methylene blue-activated substances (MBAS) test measures the presence of anionic surfactant (commercial detergent) in water. Positive test results can be used to indicate the presence of domestic wastewater. The Basin Plan water quality objective for MBAS in inland surface waters is 0.5 mg/L, which is the secondary drinking water standard. It is not anticipated that Project activities will cause MBAS transport to the Project receiving water bodies.
Mineral Quality: Boron, Chloride, Iron, Manganese, Sodium, and Sulfate. Mineral quality in natural waters is largely determined by the mineral assemblage of soils and rocks near the land surface. Elevated mineral concentrations could impact beneficial uses; however, the minerals listed in the Basin Plan, except TDS and nitrogen, are not believed to be constituents of concern due to the absence of river impairments and/or anticipated post-development runoff concentrations are well below the Basin Plan objectives (Table 4-3). Therefore, these constituents are not considered pollutants of concern for the Project.
The iron criterion of 1.0 mg/L is based on USEPA National Recommended Water Quality Criteria (1976) for freshwater aquatic life. The USEPA criterion is based on three studies that were conducted between 1948 and 1967 which observed fish toxicity effects at iron levels of 1 – 2 mg/L at low and unknown pH levels. The presence of iron in stormwater runoff is due to the fact that it is an abundant element in the earth’s crust (the fourth most abundant element by weight); iron silicate minerals are a component of most rocks, including basalt. Iron is an

SDSU Mission Valley Campus Project WQTR 48 August 2019
important component in soil adhesion and is additionally important biologically. Vertebrate animals utilize iron’s oxidation-reduction mechanisms to transport oxygen in the bloodstream. Iron pollution sources include industrial wastewater, mine leachate, and groundwaters with high iron content. As these sources are not expected for the Project, iron is not considered a pollutant of concern for the Project.
Table 4-3: Comparison of Mineral Basin Plan Objectives with Mean Measured Values in Los Angeles County
Mineral
Basin Plan Water Quality Objective for Lower San Diego
River, Mission San Diego (mg/L) Range of Mean Concentration in
Urban Runoff 1 (mg/L) Boron 1.0 0.08 – 0.2
Chlorides 400 13 - 50 Iron 1.0 0.8 – 5.3
Manganese 1.00 S.I.D. – 0.07 Sodium 60% 10 – 37 Sulfate 500 15 - 35
1 Source: LACDPW, 2000. Land uses include multi-family residential, commercial, and open space. S.I.D. = Statistically Invalid Data, not enough data above detection limit collected.
pH – The hydrogen ion activity of water (pH) is measured on a logarithmic scale, ranging from 0 to 14. While the pH of “pure” water at 25 ºC is 7.0, the pH of natural waters is usually slightly basic due to the solubility of carbon dioxide from the atmosphere. Aquatic organisms can be highly sensitive to pH. The Basin Plan objective for pH for waters designated as MAR is:
“Changes in normal ambient pH levels shall not exceed 0.2 units.”
The mean pH value in runoff from commercial land use from the Los Angeles County stormwater monitoring data is 7.0. Therefore, pH in the Lower San Diego River is not expected to be affected by runoff discharges from the Project, which are predicted to be in the neutral pH range.
Temperature – Increase in temperature can result in lower dissolved oxygen levels, impairing habitat and other beneficial uses of receiving waters. Discharges of wastewater can also cause unnatural and/or rapid changes in temperature of receiving waters, which can adversely affect aquatic life. Elevated temperatures are typically associated with cooling water discharges from power plants discharges of process wastewaters or non-contact cooling waters. This type of discharge is not associated with the Project and therefore temperature is not of concern.
4.2 Groundwater Quality Pollutants of Concern
The Project may require dewatering of shallow groundwater during the construction phase. The potential for dewatering discharges to affect surface water quality is addressed by considering surface water pollutants of concern. The Project may allow for infiltration of urban runoff to groundwater after receiving treatment in the BMPs, as well as incidental infiltration of irrigation water. Research conducted on the effects on groundwater from stormwater infiltration by Pitt et
SDSU Mission Valley Campus Project WQTR 49 August 2019
al. (1994) indicate that the potential for contamination is dependent on a number of factors including the local hydrogeology and the chemical characteristics of the pollutants of concern.
Pollutant characteristics that influence the potential for groundwater impacts include high mobility (low absorption potential), high solubility fractions, and abundance in runoff, including dry weather flows. As a class of constituents, trace metals tend to adsorb onto soil particles and are filtered out by soils. This has been confirmed by extensive data collected beneath stormwater detention/retention ponds in Fresno (conducted as part of the Nationwide Urban Runoff Program) that showed that trace metals tended to be adsorbed in the upper few feet in the bottom sediments. Bacteria are also filtered out by soils. More mobile constituents such as chloride and nitrate would have a greater potential for groundwater impacts due to infiltration.
4.2.1 Pollutants of Concern
The pollutants of concern for the groundwater quality analysis are those that are anticipated or potentially could be generated by the Project at concentrations, based on water quality data collected from land uses that are the same as those included in the Project, that exhibit these characteristics. Identification of the pollutants of concern for the Project considered proposed land uses as well as pollutants that have the potential to impair beneficial uses of the groundwaters below the Project. The Basin Plan contains numerical objectives for mineral quality, nitrogen, and various toxic chemical compounds, MBAS, and odor.
Nitrate was chosen as the pollutant of concern for purposes of evaluating groundwater quality impacts based upon the above considerations. High nitrate levels in drinking water can cause health problems in humans. Infants can develop methemoglobinemia (blue-baby syndrome). Human activities and land use practices can influence nitrogen concentrations in groundwaters. For example, irrigation water containing fertilizers can increase levels of nitrogen in groundwater. The Basin Plan objective for nitrate in groundwater in the Project area is 10 mg/L as nitrogen.
4.2.2 Other Constituents
Chemical Constituents and Radioactivity: Drinking water limits for inorganic and organic chemicals that can be toxic to human health in excessive amounts and radionuclides are contained in Title 22 of the California Code of Regulations. These chemicals and radionuclides are not expected to occur in the Project’s runoff. Title 22 specifies California’s Wastewater Reclamation Criteria (WRC) and recycled water must meet or exceed these criteria. These criteria apply to the treatment processes; treatment performance standards, such as removal efficiencies and effluent water quality; process monitoring programs, including type and frequency of monitoring; facility operation plans; and necessary reliability features. Due to compliance with these criteria, chemical constituents and radionuclides are not expected to occur in irrigation water in amounts that would impact groundwater.
Taste and Odor. The Basin Plan contains a narrative objective for taste and odor that cause a nuisance or adversely affect beneficial uses. Undesirable tastes and odors in groundwater may be a nuisance and may indicate the presence of a pollutant(s). Odor associated with water can result

SDSU Mission Valley Campus Project WQTR 50 August 2019
from natural processes, such as the decomposition of organic matter or the reduction of inorganic compounds, such as sulfate. Other potential sources of odor causing substances, such as industrial processes, will not occur as part of the Project. Therefore, taste and odor-producing substances are not pollutants of concern for the Project.
Mineral Quality: TDS, Chloride, Sulfate, Sodium, Iron, Manganese, Boron, and Fluoride. Mineral quality in groundwaters is largely influenced by the mineral assemblage of soils and rocks that it comes into contact with. Elevated mineral concentrations could impact beneficial uses; however, the minerals listed in the Basin Plan are not believed to be pollutants of concern due to the anticipated runoff concentrations, which are below the Basin Plan groundwater objectives (Table 4-4). Therefore, these constituents are not considered pollutants of concern for the Project.
Table 4-4: Comparison of Basin Plan Mineral Groundwater Objectives with Mean Measured Values in Los Angeles County Urban Runoff and Anticipated Irrigation Water Quality
Mineral Basin Plan Groundwater Quality
Objective 1 (mg/L) Range of Mean Concentrations in
Urban Runoff 2 (mg/L) Total Dissolved Solids 3,000 3 105 - 237
Chloride 800 3 13 - 50 Sulfate 600 3 15 - 35 Sodium 60% 10 - 37
Iron 0.3 3 0.8 – 5.3 Manganese 0.05 3 S.I.D. – 0.07
Boron 2.0 3 0.08 – 0.2 Fluoride 1.0 0.2 – 0.4
1 Lower San Diego HA, Mission San Diego HSA. 2 Source: LACDPW, 2000. Includes multi-family residential, commercial, and open space land uses. S.I.D. = Statistically
Invalid Data, not enough data above detection limit collected. 3 Detailed salt balance studies are recommended for this area to determine limiting mineral concentration levels for discharge.
On the basis of existing data, the tabulated objectives would probably be maintained in most areas. Upon completion of the salt balance studies, significant water quality objective revisions may be necessary. In the interim period of time, projects of groundwater recharge with water quality inferior to the tabulated numerical values may be permitted following individual review and approval by the Regional Board if such projects do not degrade existing groundwater quality to the aquifers affected by the recharge.
4.3 Hydrologic Conditions of Concern (Hydromodification)
Urbanization modifies natural watershed and geomorphic processes by introducing increased volumes and duration of flow via increased runoff from impervious surfaces and drainage infrastructure. The MS4 Permit defines hydromodification as the change in the natural watershed hydrologic processes and runoff characteristics (i.e., interception, infiltration, overland flow, and groundwater flow) caused by urbanization or other land use changes that result in increased stream flows and sediment transport. In addition, alteration of stream and river channels, such as stream channelization, concrete lining, installation of dams and water impoundments, and excessive stream bank and shoreline erosion are also considered hydromodification, due to their disruption of natural watershed hydrologic processes.

SDSU Mission Valley Campus Project WQTR 51 August 2019
4.4 Significance Criteria and Thresholds for Significance
4.4.1 Surface Water Quality Thresholds
Significance criteria and thresholds for significance are based State Guidelines and are summarized below. In this WQTR, application of the criteria to a decision regarding significance of impacts uses an integrated or “weight of evidence” approach, rather than a decision based on any one of the individual criterion.
The Project would have an impact on surface water quality if it would:
• Violate any water quality standards or waste discharge requirements or otherwise substantially degrade surface quality.
• Substantially alter the existing drainage pattern of the site or area, including through the alteration of the course of a stream or river or through the addition of impervious surfaces, in a manner which would result in substantial erosion or siltation on- or offsite.
• Conflict with or obstruct implementation of a water quality control plan.
This WQTR analyzes whether sizeable additional sources of polluted runoff may result from the Project based on the results of water quality modeling and qualitative assessments that take into account water quality BMPs. Any increases in pollutant concentrations or loads in runoff resulting from the development of the Project are considered an indication of a potentially significant adverse water quality impact. If loads and concentrations resulting from development are predicted to stay the same or to be reduced when compared with existing conditions, it is concluded that the Project will not cause a significant adverse impact to the ambient water quality of the receiving waters for that pollutant.
If pollutant loads or concentrations are expected to increase, then for both the post-development and construction phases, potential impacts are assessed by evaluating compliance of the Project with applicable regulatory requirements of the Small MS4 Permit, the Construction General Permit, and the General Dewatering Permit. Further, post-development increases in pollutant loads and concentrations are evaluated by comparing the magnitude of the increase to relevant benchmarks, including receiving water quality objectives and criteria from the Basin Plan and CTR, as described below.
Receiving Water Benchmarks Comparison of post-development water quality concentrations in the runoff discharge with benchmark numeric and narrative receiving water quality criteria as provided in the Basin Plan and the CTR facilitates analysis of the potential for runoff to result in exceedances of receiving water quality standards, adversely affect beneficial uses, or otherwise degrade receiving waters.
Water quality criteria are considered benchmarks for comparison purposes only, as such criteria apply within receiving waters as opposed to applying directly to runoff discharges. Narrative and numeric water quality objectives contained in the Basin Plan apply to the Project’s receiving water (Lower San Diego River and Murphy Canyon Creek). Water quality criteria contained in

SDSU Mission Valley Campus Project WQTR 52 August 2019
the CTR provide concentrations that are not to be exceeded in receiving waters more than once in a three-year period for those waters designated with aquatic life or human health related uses. Projections of runoff water quality are compared to the acute form of the CTR criteria (as discussed above), as stormwater runoff is associated with episodic events of limited duration, whereas chronic criteria apply to 4-day exposures which do not describe typical storm events in the Project, which last seven hours on average. If pollutant levels in runoff are not predicted to exceed receiving water benchmarks, it is one indication that no significant impacts will result from project development.
MS4 Permit Requirements for New Development Satisfaction of the post-construction stormwater management requirements of the Small MS4 Permit for the Project, satisfaction of development planning requirements of the Phase I MS4 Permit for the offsite roadway improvements, and satisfaction of construction-related requirements of the Construction General Permit and General Dewatering Permit for the entire Project, establishes compliance with water quality regulatory requirements applicable to stormwater runoff.
The Small MS4 Permit and Phase I MS4 Permit require that BMPs be implemented to reduce the discharge of pollutants in stormwater to the Maximum Extent Practicable. MS4 Permit requirements are met when new development complies with the LID requirements set forth in the MS4 Permit. The effectiveness of stormwater controls is primarily based on two factors - the amount of runoff that is captured by the controls and the selection of BMPs to address identified pollutants of concern. Selection and numerical sizing criteria for new development water quality controls are included in the Small MS4 Permit and the Phase I MS4 Permit. If Project BMPs meet MS4 Permit requirements, including sizing for water quality controls and other BMPs consistent with the LID requirements, it indicates that no significant impacts will occur as the result of MS4 Permit compliance.
Construction General Permit and General Dewatering Permit The Construction General Permit requires the development and implementation of a Stormwater Pollution Prevention Plan (SWPPP) that describes erosion and sediment control BMPs as well as material management/ non-stormwater BMPs that will be used during the construction phase of development. The General Dewatering Permit addresses discharges from permanent or temporary dewatering operations associated with construction and development and includes provisions mandating notification, sampling and analysis, and reporting of dewatering and testing-related discharges. To evaluate the significance of construction phase Project water quality impacts, this report evaluates whether water quality control is achieved by implementation of BMPs consistent with Best Available Technology Economically Achievable and Best Conventional Pollutant Control Technology (BAT/BCT)7, as required by the Construction General Permit and the General Dewatering Permit.
7 BAT/BCT are Clean Water Act technology-based standards that are applicable to construction site stormwater discharges. Federal law specifies factors relating to the assessment of BAT including: age of the equipment and facilities involved; the process employed; the engineering aspects of the application of various types of control techniques; process changes; the cost of achieving effluent reduction; non-water quality environmental impacts

SDSU Mission Valley Campus Project WQTR 53 August 2019
4.4.2 Significance Thresholds for Hydrologic Conditions of Concern (Hydromodification Impacts)
A change to the Project’s hydrologic regime would be considered a condition of concern if the change could have a significant impact on erosion within the Lower San Diego River. Thresholds of significance for evaluating hydrologic impacts and conditions of concern have been developed based on a review of the Small MS4 Permit and State Guidelines. Significant adverse impacts to natural drainage systems created by altered hydrologic conditions of concern are presumed to occur if the proposed Project would:
• Substantially alter the existing drainage pattern of the site or area, including through the alteration of the course of a stream or river or through the addition of impervious surfaces, in a manner which would result in substantial erosion or siltation on- or offsite.
Potential hydrologic impacts related to flooding on- or offsite, the capacity of existing or planned stormwater drainage systems, or risk release of pollutants due to project inundation in flood hazard, tsunami, or seiche zones are analyzed in the report: San Diego State University Mission Valley Campus Onsite Hydrology Technical Report (Geosyntec Consultants, 2019a).
4.4.3 Groundwater Impacts
Thresholds of significance for evaluating the potential impacts of the Project on groundwater have been developed based on State thresholds. Significant adverse impacts to groundwater are presumed to occur if the Project would:
• Violate any water quality standards or waste discharge requirements or otherwise substantially degrade groundwater quality.
• Substantially decrease groundwater supplies or interfere substantially with groundwater recharge such that the Project may impede sustainable groundwater management of the basin.
• Conflict with or obstruct implementation of a water quality control plan or sustainable groundwater management plan.
(including energy requirements); and other factors as the Administrator deems appropriate. Clean Water Act §304(b)(2)(B). Factors relating to the assessment of BCT include: reasonableness of the relationship between the costs of attaining a reduction in effluent and the effluent reduction benefits derived; comparison of the cost and level of reduction of such pollutants from the discharge from publicly owned treatment works to the cost and level of reduction of such pollutants from a class or category of industrial sources; the age of the equipment and facilities involved; the process employed; the engineering aspects of the application of various types of control techniques; process changes; non-water quality environmental impact (including energy requirements); and other factors as the Administrator deems appropriate. Clean Water Act §304(b)(4)(B). The Administrator of USEPA has not issued regulations specifying BAT or BCT for construction site discharges.

SDSU Mission Valley Campus Project WQTR 54 August 2019
Project groundwater pollutants of concern are identified in Section 4.2.1. Groundwater quality and recharge impacts are addressed in Section 7.7.
4.4.4 Cumulative Impacts
As required by CEQA, the focus of the cumulative impacts analysis for the Project will be on the Project's incremental contribution to significant adverse water quality and hydrologic impacts to the Lower San Diego River watershed, taking into account the reasonably foreseeable water quality and hydrologic impacts of other projects that may develop impervious surfaces and urban land uses within the watershed. The cumulative impacts analysis considers the Project’s incremental contribution to significant cumulative water quality and hydrologic impacts to the watershed in light of the water quality and hydrology impact mitigation achieved by the LID structural BMPs and other BMPs that will be implemented for the Project. The analysis will also consider whether the Project, including BMPs, and future projects will comply with the Basin Plan, the CTR, the Small MS4 Permit, the Phase I MS4 Permit, the Construction General Permit, and the Dewatering General Permit, which have been adopted for the purpose of avoiding or substantially lessening the cumulative water quality and hydrologic impact problems within the geographic area in which the Project is located.

SDSU Mission Valley Campus Project WQTR 55 August 2019
5. WATER QUALITY AND HYDROMODIFICATION CONTROL BEST MANAGEMENT PRACTICES
BMPs incorporated into the Project to address surface water and groundwater quality and hydromodification impacts include erosion and sediment control BMPs to be implemented during construction and post-development LID site design, source control, and stormwater treatment/baseline hydromodification control BMPs. These BMPs are considered a part of the Project for impact analysis.
Effective management of wet and dry weather runoff water quality begins with limiting increases in runoff pollutants and flows at the source. LID site design and source control BMPs are practices designed to minimize runoff and the introduction of pollutants into runoff. LID treatment control/baseline hydromodification control BMPs are designed to remove pollutants once they have been mobilized by rainfall and runoff and to reduce changes to runoff volume to the extent practicable. This section describes the construction-phase BMPs and post-development site design, source control, and LID treatment control/baseline hydromodification control BMPs for the Project.
5.1 Construction-Phase Controls
5.1.1 Erosion and Sediment Control BMPs to be Implemented during Construction
Erosion control BMPs are designed to prevent erosion, whereas sediment controls are designed to trap or filter sediment once it has been mobilized. As part of the build-out of the Project, a SWPPP will be developed as required by, and in compliance with, the SWRCB’s CGP and the County of San Diego’s municipal code8 and grading plan requirements. The CGP requires the SWPPP to include BMPs to be selected and implemented based on the determined project risk level to effectively control erosion and sediment to the BAT/BCT. The following types of BMPs will be implemented as needed during construction:
Erosion Control • Physical stabilization through hydraulic mulch, soil binders, straw mulch, bonded and
stabilized fiber matrices, compost blankets, and erosion control blankets (i.e., rolled erosion control products).
• Contain and securely protect stockpiled materials from wind and rain at all times, unless actively being used.
• Soil roughening of graded areas (through track walking, scarifying, sheepsfoot rolling, or imprinting) to slow runoff, enhance infiltration, and reduce erosion.
• Vegetative stabilization through temporary seeding and mulching to establish interim vegetation.
8 San Diego County Code of Regulatory Ordinances Chapter 8 Watershed Protection Stormwater Management and Discharge Control.
SDSU Mission Valley Campus Project WQTR 56 August 2019
• Wind erosion (dust) control through the application of water or other dust palliatives as necessary to prevent and alleviate dust nuisance.
Sediment Control • Perimeter protection to prevent sediment discharges (e.g., silt fences, fiber rolls,
gravel bag berms, sand bag barriers, and compost socks).
• Storm drain inlet protection.
• Sediment capture and drainage control through sediment traps and sediment basins.
• Velocity reduction through check dams, sediment basins, and outlet protection/ velocity dissipation devices.
• Reduction in offsite sediment tracking through stabilized construction entrance/exit, construction road stabilization, and/or entrance /exit tire wash.
• Slope interruption at prescribed intervals (e.g. fiber rolls, gravel bag berms, sand bag berms, compost socks, and biofilter bags).
Waste and Materials Management • Management of the following types of materials, products, and wastes: solid, liquid,
sanitary, concrete, hazardous and equipment-related wastes. Management measures include covered storage and secondary containment for material storage areas, secondary containment for portable toilets, covered dumpsters, dedicated and lined concrete washout/waste areas, proper application of chemicals, and proper disposal of all wastes.
• Protection of soil, landscaping and construction material stockpiles through covers, the application of water or soil binders, and perimeter control measures.
• A spill response and prevention program will be incorporated as part of the SWPPP and spill response materials will be available and conspicuously located at all times onsite.
Non-Stormwater Management • BMPs or good housekeeping practices to reduce or limit pollutants at their source
before they are exposed to stormwater, including such measures as: water conservation practices, vehicle and equipment cleaning and fueling practices, illicit connection/discharge elimination, and concrete curing and finishing. All such measures will be recorded and maintained as part of the project SWPPP.
Training and Education • Inclusion of CGP defined “Qualified SWPPP Developers” (QSD) and “Qualified
SWPPP Practitioners” (QSP). QSDs and QSPs shall have required certifications and shall attend State Board sponsored training.
• Training of individuals responsible for SWPPP implementation and permit compliance, including contractors and subcontractors.

SDSU Mission Valley Campus Project WQTR 57 August 2019
• Signage (bilingual, if appropriate) to address SWPPP-related issues (such as site cleanup policies, BMP protection, washout locations, etc.).
Inspections, Maintenance, Monitoring, and Sampling • Performing routine site inspections and inspections before, during (for storm events >
0.5 inches), and after storm events.
• Where applicable, preparing and implementing Rain Event Action Plans (REAPs) prior to any storm event with 50 percent probability of producing 0.5 inches of rainfall, including performing required preparatory procedures and site inspections.
• Implementing maintenance and repairs of BMPs as indicated by routine, storm-event, and REAP inspections.
• Implementation of the Construction Site Monitoring Plan for non-visible pollutants, if a leak or spill is detected.
• Where applicable, sampling of discharge points for turbidity and pH, at minimum, three times per qualifying storm event and recording and retention of results.
5.1.2 Construction BMP Implementation
During Project construction, BMPs will be implemented in compliance with the CGP and if applicable, the general waste discharge requirements in the regional Dewatering General Permit (Order No. R9-2015-0013).
The Project will reduce or prevent erosion and sediment transport and transport of other potential pollutants from the Project during the construction phase through implementation of BMPs meeting BAT/BCT in order to prevent or minimize environmental impacts and to ensure that discharges during the Project construction phase will not cause or contribute to any exceedance of water quality standards in the receiving waters. All discharges from qualifying storm events will be sampled for turbidity and pH and results will be compared to Numeric Action Levels (NALs) (250 NTU and 6.5-8.5, respectively for Risk Level 2 and 3 projects) to ensure that BMPs are functioning as intended. If discharge sample results fall outside of these NALs, a review of the pollutant sources and the existing site BMPs will be undertaken, and maintenance and repair of existing BMPs will be performed and/or additional BMPs will be provided, to ensure that future discharges meet these criteria.
Construction-phase BMPs will assure effective control of not only sediment discharge, but also of pollutants associated with sediments, such as nutrients, heavy metals, and certain pesticides, including legacy pesticides. In addition, compliance with BAT/BCT requires that BMPs used to control construction water quality are updated over time as new water quality control technologies are developed and become available for use. Therefore, compliance with the BAT/BCT performance standard ensures effective control of construction water quality impacts over time.

SDSU Mission Valley Campus Project WQTR 58 August 2019
5.2 Post-Construction Source Control BMPs
Table 5-1 summarizes the source control requirements of the Small MS4 Permit and the corresponding standard permanent and/or operational source control BMPs that are incorporated into the Project for pollutant-generating activities and sources.
Table 5-1: Small MS4 Permit Source Control BMP Requirements and Corresponding Project BMPs
Small MS4 Permit Source Control Requirement Corresponding SDSU Mission Valley Campus Project BMPs
Accidental Spills or Leaks
• SDSU or occupants/tenants of sites at which hazardous materials are stored or used will develop a spill contingency plan which mandates stockpiling of cleanup materials, notification of responsible agencies, disposal of cleanup materials, and documentation.
Interior Floor Drains • Commercial and industrial interior floor drains will be plumbed to the sanitary sewer.
Parking/Storage Areas and Maintenance
• Stormwater runoff from parking lots will be directed to LID BMPs, such as bioretention areas, in compliance with Small MS4 Permit requirements.
• Parking lots will be swept at least once before the onset of the wet season.
• Pesticides, fertilizers, paints, and other hazardous materials used for maintenance of common areas, parks, commercial areas, and multi-family residential common areas will be kept in enclosed storage areas.
Indoor and Structural Pest Control
• Integrated Pest Management information will be provided to owners, lessees, and operators.
• Building design features that discourage entry of pests will be promoted.
Landscape/Outdoor Pesticide Use
• Native climate appropriate vegetation or plants approved in the City’s River Park Master Plan will be utilized within the Project’s landscaped areas.
• Landscape watering in common areas, commercial areas, multiple family residential areas, and in parks will use efficient irrigation technology to minimize excess watering.
• Landscaping shall be maintained using minimum or no pesticides. Pesticides shall be used only after monitoring indicates they are needed according to established guidelines.
Pools, Spas, Ponds, Decorative Fountains, and Other Water Features
• When draining pools, fountains, and other water features; water will not be discharged to a street or storm drain. Water may be discharged to the sanitary sewer if permitted to do so. Pool and fountain water that is dechlorinated with a neutralizing chemical or by allowing chlorine to dissipate for a few days may be reused by draining it gradually onto a landscaped area.
Restaurants, Grocery Stores, and Other Food Service Operations
• A floor sink or other area for cleaning floor mats, containers, and equipment will be provided indoors or in a covered area outdoors.

SDSU Mission Valley Campus Project WQTR 59 August 2019
Small MS4 Permit Source Control Requirement Corresponding SDSU Mission Valley Campus Project BMPs
• The floor sink or other areas will be connected to a grease interceptor before discharging to the sanitary sewer.
Refuse Areas
• Dumpsters or other receptacles that are outdoors will be covered, graded, and paved to prevent run-on. Berms will be provided to prevent runoff from the area.
• Any drains from dumpsters, compactors, and tallow bin areas will be connected to a grease removal device before discharge to sanitary sewer.
Industrial Processes • No industrial land uses are included in the proposed Project.
Outdoor Storage of Equipment or Materials
• Outdoor storage areas for equipment or materials that could contaminate stormwater will be covered. Outdoor storage areas will be graded and bermed to prevent run-on or runoff from area.
• Storage of non-hazardous liquids will be covered by a roof and/or drain to the sanitary sewer system, and be contained by berms, dikes, liners, or vaults.
• Storage of hazardous materials and wastes will be in compliance with the local hazardous materials ordinance and a Hazardous Materials Management Plan for the site.
Vehicle and Equipment Cleaning
• Commercial facilities having vehicle/equipment cleaning needs will either provide a covered, bermed area for washing activities or discourage vehicle/equipment washing by removing hose bibs and installing signs prohibiting such uses.
• Multi-dwelling complexes will have a paved, bermed, and covered car wash area (unless car washing is prohibited onsite and hoses are provided with an automatic shutoff to discourage such use).
• Washing areas for cars, vehicles, and equipment will be paved, designed to prevent run-on to or runoff from the area, and plumbed to drain to the sanitary sewer.
Vehicle and Equipment Repair and Maintenance
• All vehicle equipment repair and maintenance will be conducted indoors or in designated outdoor work areas designed to prevent run-on and runoff of stormwater.
• Secondary containment will be provided for exterior work areas where motor oil, brake fluid, gasoline, diesel fuel, radiator fluid, acid-containing batteries or other hazardous materials or hazardous wastes are used or stored. Drains will not be installed within the secondary containment areas.

SDSU Mission Valley Campus Project WQTR 60 August 2019
Small MS4 Permit Source Control Requirement Corresponding SDSU Mission Valley Campus Project BMPs
Fuel Dispensing Areas
• Fueling areas (i.e., the area extending a minimum of 6.5 feet from the corner of each fuel dispenser or the length at which the hose and nozzle assembly may be operated plus a minimum of one foot, whichever is greater) will have impermeable floors (i.e., Portland cement concrete or an equivalent smooth impervious surface) that are: a) graded at the minimum slope necessary to prevent ponding; and b) separated from the rest of the site by a grade break that prevents run-on of stormwater to the maximum extent practicable.
• Fueling areas will be covered by a canopy that extends a minimum of ten feet in each direction from each pump. Alternatively, the fueling area will be covered and the cover’s minimum dimensions will be equal to or greater than the area within the grade break or fuel dispensing area. The canopy [or cover] will not drain onto the fueling area.
Loading Docks
• Loading docks will be covered and/or graded to minimize run-on to and runoff from the loading area. Roof downspouts shall be positioned to direct stormwater away from the loading area. Water from loading dock areas will be drained to the sanitary sewer or diverted and collected for ultimate discharge to the sanitary sewer.
• Loading dock areas draining directly to the sanitary sewer will be equipped with a spill control valve or equivalent device, which will be kept closed during periods of operation.
• A roof overhang will be provided over the loading area or door skirts (cowling) will be installed at each bay that enclose the end of the trailer.
Fire Sprinkler Test Water • Fire sprinkler test water will be drained to the sanitary sewer.
Drain or Wash Water from Boiler Drain Lines, Condensate Drain Lines, Rooftop Equipment, Drainage Sumps, and Other Sources
• Boiler drain lines will be directly or indirectly connected to the sanitary sewer system and will not discharge to the storm drain system.
• Condensate drain lines may discharge to landscaped areas if the flow is small enough that runoff will not occur. Condensate drain lines will not discharge to the storm drain system.
• Rooftop equipment with potential to produce pollutants will be roofed and/or have secondary containment.
• Any drainage sumps will feature a sediment sump to reduce the quantity of sediment in pumped water.
• Roofing, gutters, and trim made of copper or other unprotected metals that may leach into runoff will be avoided.

SDSU Mission Valley Campus Project WQTR 61 August 2019
Small MS4 Permit Source Control Requirement Corresponding SDSU Mission Valley Campus Project BMPs
Unauthorized Non-Stormwater Discharges
• All storm drain inlets and catch basins will be marked with prohibitive language and/or graphical icons to discourage illegal dumping.
• Signs and prohibitive language and/or graphical icons which prohibit illegal dumping will be posted at public access points along channels and creeks within the Project area.
• Legibility of stencils and signs will be maintained by the Community Service District or Homeowner’s Associations (HOAs).
Building and Grounds Maintenance
• In situations where soaps or detergents are needed to pressure wash commercial buildings, rooftops, and other large objects and the surrounding area is paved, pressure washers will use a water collection device that enables collection of wash water and associated solids. A sump pump, wet vacuum or similarly effective device will be used to collect the runoff and loose materials. The collected runoff and solids will be disposed of properly.
• Grass clippings, leaves, sticks, or other collected vegetation from commercial and industrial grounds maintenance will be disposed of as green waste or by composting. Collected vegetation will not be disposed of into waterways or storm drainage systems.
• Commercial building repair, remodeling, and construction will be conducted such that no toxic substance or liquid water is dumped on the pavement, the ground, or toward a storm drain.
In addition, Rick Engineering (2019c) describes the source control BMP requirements from Section 4.2 of the City of San Diego Stormwater Standards and identifies the respective source control BMPs for the Project (Table 5-2). Several source control BMP requirements are not anticipated to be necessary for the Project; however, if they are required within individual lot site plans within the Project boundary, these source control BMPs will be implemented for each applicable location.
Table 5-2: Phase I MS4 Permit Source Control BMP Requirements and Corresponding Project BMPs
Phase I MS4 Permit Source Control Requirement Corresponding SDSU Mission Valley Campus Project BMPs
Prevent Illicit Discharges into the MS4
• The Project will implement the necessary source control BMPs listed in Appendix E of the Stormwater Standards dated, October 2018 to prevent any illicit discharges into the MS4 as the individual lot site plans are developed in the future.
Identify the Storm Drain System using Stenciling or Signage
• Concrete stamping, or the equivalent with prohibitive language such as, “No Dumping-Drains to Ocean”, will be provided for curb inlets, catch basins, and any Brooks Box inlets located within the Project pursuant to the guidelines in the Stormwater Standards.
Protect Outdoor Material Storage Areas from Rainfall, Run-on, Runoff, and Wind Dispersal
• At this time there are no known outdoor material storage areas proposed as part of the Project. As the individual lot site plans are

SDSU Mission Valley Campus Project WQTR 62 August 2019
Phase I MS4 Permit Source Control Requirement Corresponding SDSU Mission Valley Campus Project BMPs
developed in the future, they will be designed pursuant to the guidelines in the Storm water Standards, if proposed.
Protect Materials Stored in Outdoor Work Areas for Rainfall, Run-on, Runoff, and Wind Dispersal
• At this time there are no known outdoor work areas proposed as part of the Project. As the individual lot site plans are developed in the future, they will be designed pursuant to the guidelines in the Stormwater Standards, if proposed.
Protect Trash Storage Areas from Rainfall, Run-on, Runoff, and Wind Dispersal
• Trash storage areas for the project will be designed pursuant to the guidelines in the Stormwater Standards.
5.3 LID BMPs
Under the Small MS4 Permit, all Regulated Projects must implement LID standards designed to reduce runoff, treat stormwater, and provide baseline hydromodification management to the extent feasible to meet the numeric sizing criteria identified in the permit. The LID BMPs that are incorporated into the Project are summarized below. These BMPs for the onsite portion of the Project are more fully described in the report Water Quality Report for SDSU Mission Valley Campus (Onsite Improvements) (Rick Engineering, 2019c). The BMPs for the offsite roadway improvements are described in a letter to the City of San Diego (Green Streets Elements for SDSU Mission Valley Campus Adjacent Improvements – PDP Exempt (Rick Engineering, 2019a)).
5.3.1 LID Site Design BMPs
The Small MS4 Permit requires that the Project implement site design measures to reduce the amount of stormwater runoff from the Project area. The site design measures that are listed in the Small MS4 Permit and the corresponding site design measures that have been incorporated into the Project are listed in Table 5-3.

SDSU Mission Valley Campus Project WQTR 63 August 2019
Table 5-3: Small MS4 Permit and Corresponding Project Site Design Measures
Small MS4 Permit Site Design Measure Description
Corresponding SDSU Mission Valley Campus Project BMPs
Site Assessment
• Define the development envelope and protected areas, identifying areas that are most suitable for development and areas to be left undisturbed.
• Concentrate development on portions of the site with less permeable soils and preserve areas that can promote infiltration.
• Limit overall impervious coverage of the site with paving and roofs.
• Set back development from creeks, wetlands, and riparian habitats.
• Preserve significant trees. • Conform the site layout
along natural landforms. • Avoid excessive grading and
disturbance of vegetation and soils.
• Replicate the site's natural drainage patterns.
• Detain and retain runoff throughout the site.
• The 34-acre River Park located along the southern and eastern edge of the Project, north of the San Diego River, will act as a buffer to the San Diego River and its sensitive habitat.
• Additional parks and open space uses include a campus mall, and additional shared parks and open space in the residential and other project areas.
• Project LID BMPs will disconnect impervious areas and reduce flows to natural channels through infiltration (where feasible) and evapotranspiration.
Stream Setbacks and Buffers
• A vegetated area including trees, shrubs, and herbaceous vegetation, that exists or is established to protect a stream system, lake reservoir, or coastal estuarine area.
• Stream setbacks and buffers have been provided for the San Diego River and Murphy’s Canyon Creek.
Soil Quality Improvement and Maintenance
• Improvement and maintenance of soil through soil amendments and creation of microbial community.
• The Project’s stormwater BMPs will incorporate soil amendments to promote healthy soils and pollutant removal.
Tree Planting and Preservation
• Planting and preservation of healthy, established trees that include both evergreens and deciduous, as applicable.
• The Project will preserve healthy, established trees in the riparian corridor and trees and other vegetation will be incorporated into landscaped areas.

SDSU Mission Valley Campus Project WQTR 64 August 2019
Small MS4 Permit Site Design Measure Description
Corresponding SDSU Mission Valley Campus Project BMPs
Rooftop and Impervious Area Disconnection
• Rerouting of rooftop drainage pipes to drain rainwater to rain barrels, cisterns, or permeable areas instead of the storm sewer.
• All impervious surfaces within the Project will drain to vegetated BMPs prior discharge.
Porous Pavement
• Pavement that allows runoff to pass through it, thereby reducing the runoff from a site and surrounding areas and filtering pollutants.
• LID BMPs will be sized to evapotranspire, infiltrate, and biotreat the volume of stormwater runoff produced from the 85th percentile, 24-hour storm event (water quality design volume). See Section 5.3.2.
Green Roofs • A vegetative layer grown on a roof (rooftop garden).
Vegetated Swales
• A vegetated, open-channel management practice designed specifically to treat and attenuate stormwater runoff.
Rain Barrels and Cisterns
• A system that collects and stores stormwater runoff from a roof or other impervious surface.
In addition, Rick Engineering (2019c) describes the site design BMP requirements from Section 4.3 of the City of San Diego Stormwater Standards and identifies the respective site design BMPs for the Project (Table 5-4).
Table 5-4: San Diego Phase I MS4 Permit and Corresponding Project Site Design Measures
Phase I MS4 Permit Site Design Measure Corresponding SDSU Mission Valley Campus Project BMPs
Maintain Natural Drainage Pathways and Hydrologic Features
The Project proposes no improvements to the San Diego River or Murphy Canyon Creek Channel and will maintain the existing natural drainage and hydrologic conditions of these water bodies.
Conserve Natural Areas within the Project Footprint including Existing Trees, Other Vegetation, and Soils
There are no existing native trees or shrubs to preserve. However, the Project will incorporate additional street trees, shrubs, and vegetation throughout the development footprint. Implementation of pervious surfaces will be considered within the individual site plans of the respective lots and the future phases.
Minimize Impervious Area
The Project includes building densities allowing for several stories that help reduce overall impervious footprint. Streets will be built to the minimum widths necessary, and landscaping/ vegetated areas are included within the public right-of-way, throughout individual lots, and the overall Project includes a “River Park” and additional shared parks and open space along the San Diego River and Murphy Canyon Creek. The Project

SDSU Mission Valley Campus Project WQTR 65 August 2019
Phase I MS4 Permit Site Design Measure Corresponding SDSU Mission Valley Campus Project BMPs will also incorporate street trees where feasible as a site design BMP for runoff volume reduction.
Minimize Soil Compaction
The Project is approximately 90% impervious in the existing condition; therefore, soil compaction has already occurred. However, soil compaction will be minimized within the biofiltration facilities.
Impervious Area Dispersion
The Project proposes landscaped vegetation to be incorporated throughout the Project site, which will reduce the directly connected impervious areas. Rooftop runoff will also be discharged through vegetated areas wherever feasible prior to entering the storm drain system. Runoff from surface parking areas will be directed, where feasible, to adjacent landscaping areas prior to discharge into the storm drain system for additional water quality pre-treatment and conveyance. Such areas may utilize zero-inch curb in combination with wheel stops (with drainage openings) to help facilitate sheet flow across vegetated strips or for locations where a 6-inch curb is desirable as part of the drive aisle configuration, curb cuts can be used to direct runoff into landscaped areas. Non-contiguous sidewalks have also been utilized for the Project.
Runoff Collection Implementation of pervious surfaces to collect runoff will be considered within the individual site plans of the respective lots and the future phases.
Landscaping with Native or Drought Tolerant Species
The Project will implement native or drought tolerant landscaping where feasible. Landscaping shall be maintained using minimum or no pesticides. Pesticides shall be used only after monitoring indicates they are needed according to established guidelines.
Harvest and Use Precipitation Harvest and use is deemed infeasible for the Project.
5.3.2 Structural LID BMPs
Structural LID BMPs have been incorporated into the Project to infiltrate, filter, and/or treat runoff from the Project footprint. The Project consists of nine Drainage Management Areas (DMAs): DMA 1A, 1B, 1C, 2, 3, 4, 5A, 5B and 5C, all of which contain impervious surfaces (Figure 5-1) (Rick Engineering, 2019c).
At this preliminary design stage, infiltration has been assumed to be infeasible and a “no infiltration” condition has been analyzed for the Project. However, during the final engineering phase of the Project, infiltration feasibility will be assessed based on the approved infiltration testing methods in Appendix C and D of the City of San Diego Stormwater Standards. The calculated reliable infiltration rate will then be used to determine the infiltration condition for the Project by the Project’s Geotechnical Engineer. The “no infiltration” assumption is conservative; if the final design incorporates partial or full infiltration, then runoff volumes and pollutants loads will decrease in the post-development condition compared to no infiltration.

SDSU Mission Valley Campus Project WQTR 66 August 2019
Biofiltration BMPs (e.g., partial retention and lined bioretention facilities (Figure 5-2 and Figure 5-3)) achieve water quality treatment by filtering captured stormwater through vegetation and layers of treatment media and drainage rock prior to controlled releases through an underdrain and surface outlet structure. Some retention may occur due to incidental evapotranspiration (or incidental infiltration in the case of unlined bioretention with a raised underdrain (Figure 5-2)), but the primary means of water quality treatment is through filtration, sedimentation, and biological treatment processes. Bioretention with an underdrain is a volume-based biofiltration BMP that is characterized by a treatment media layer, drainage layer, underdrain at the bottom of the drainage layer, inflow and outflow control structures, vegetation, and an impermeable liner when warranted by site conditions. Flow-through biofiltration BMPs include green roofs, planter boxes, tree well filters, and other types of proprietary biofilters.
The biofiltration BMPs 1A, 1B, 1C, 3, and 5C, will be designed to treat the full runoff design control volume (DCV) based on the maximum feasible footprint for DMA 1A, 1B, 1C, 3, and 5C respectively. The biofiltration BMPs 4 and 5B, however, will use the DCV reduction gained by implementing street trees in their respective DMAs 4 and 5B to satisfy the DCV requirements outlined in Worksheet B.5-1 of the San Diego Stormwater Standards. Furthermore, the excess volume provided in BMP 5C will be used to offset the remaining required volume in BMP 5B. DMA 2 consists of the lower bowl of seating and field of the proposed stadium. For DMA 2, due to the flow line of the storm drain, the finished grade of the field, and the fixed tie-in point downstream, the Project has proposed a proprietary compact biofiltration system.
The drainage design for the Project includes routing onsite runoff from the DMAs via the proposed storm drains designed to convey the peak flow rates towards the proposed River Park, where low flow structures will divert runoff for the small and more frequently occurring storms through these permanent pollutant control stormwater BMPs for water quality purposes, then discharging runoff through each of the three existing storm drain outfalls along the San Diego River. The Project’s structural LID BMPs will also incorporate full trash capture.
The bioretention facilities in the proposed River Park will be designed to create and increase habitat to the extent feasible while treating the Project’s stormwater runoff. Consultation will occur with the San Diego Management and Monitoring Program staff or the U.S. Geologic Survey (USGS) staff regarding selection of vegetation materials for the bioretention facilities to maximize habitat and biofiltration. The upper slopes will be planted with appropriate native or non-native/non-invasive, drought tolerant vegetation, and the lower portions of the bioretention facilities will be planted with plant materials that support habitat and are suitable for inundation as part of the biofiltration process. If trails are incorporated in the bioretention areas, the trails will be elevated to the maximum extent feasible.
The water quality design for the proposed roadway improvements adjacent to the Project will utilize a Green Street Approach (Rick Engineering, 2019a). The water quality treatment for the adjacent improvements will rely upon the use of biofiltration facilities, where feasible, or the use of proprietary biofiltration units.

SDSU Mission Valley Campus Project WQTR 67 August 2019
5.4 Operations and Maintenance
The owner of the Project is the site operator and will be the party responsible to ensure implementation and funding of maintenance of the permanent BMPs. Inspection and maintenance activities and frequencies for the biofiltration BMPs are described in Rick Engineering (2019c).
SDSU Mission Valley Campus Project WQTR 68 August 2019
6. SURFACE WATER QUALITY IMPACTS ASSESSMENT METHODOLOGY
6.1 Surface Water Quality Modeling
A water quality model was used to estimate pollutant loads and concentrations in Project stormwater runoff for certain pollutants of concern for pre-development conditions and post-development conditions. The water quality model is one of the few models that considers the observed variability in stormwater hydrology and water quality by characterizing the probability distribution of observed rainfall event depths, the probability distribution of event mean concentrations, and the probability distribution of the number of storm events per year. These distributions are then sampled randomly using a Monte Carlo approach to develop estimates of mean annual loads and concentrations.
A detailed description of the water quality model is presented in Appendix A. The following summarizes major features of the water quality model:
• Project Modeled: The Project and offsite green street improvements that discharge to the Lower San Diego River (Figure 2-2).
• Rainfall Data: The water quality model estimates the volume of runoff from storm events. The storm events were determined from 40 years (January 1968 through May 2008) of hourly rainfall data measured at the Fashion Valley ALERT rain gage (Station No. 27018). The rainfall analysis that is incorporated in the water quality model requires rainfall measurements at one-hour intervals and a period of record that is at least 20 to 30 years in duration; the Fashion Valley gauge meets these criteria.
• Land Use Runoff Water Quality and Representativeness to Local Conditions: The water quality model utilizes runoff water quality data obtained from tributary areas that have a predominant land use and are measured prior to discharge into a receiving water body. Currently, such data are available from stormwater programs in Los Angeles County, San Diego County, and Ventura County, although the amount of data available from San Diego County and Ventura County is small in comparison with the Los Angeles County database. Such data is often referred to as “end-of-pipe” data to distinguish it from data obtained in urban streams, for example. The water quality model estimates the concentration of pollutants in runoff from storm events based on existing and proposed land uses. The pollutant concentrations for commercial land use, in the form of event mean concentrations (EMCs), were estimated from data collected in San Diego where available, and supplemented with data collected in Los Angeles County (LACDPW, 2000). The Los Angeles County database was chosen for use in the model because: (1) it is an extensive database that is quite comprehensive, (2) it contains monitoring data from land use-specific drainage areas, and (3) the data is representative of the semi-arid conditions in southern California.

SDSU Mission Valley Campus Project WQTR 69 August 2019
• Pollutant Load: The pollutant load associated with each storm is estimated as the product of the storm event runoff times the event mean concentration. For each year in the simulation, the individual storm event loads are summed to estimate the annual load. The mean annual load is then the average of all the annual loads.
• BMPs Modeled: The modeling only considers LID structural BMPs (i.e., biofiltration) and does not consider site design and source control BMPs that would also improve water quality. In this respect, the modeling results are conservative (i.e., tend to overestimate post-development pollutant loads and concentrations).
• Treatment Effectiveness: The water quality model estimates mean pollutant concentrations and loads in stormwater following treatment. The amount of stormwater runoff that is captured by the LID structural BMPs was calculated for each storm event, taking into consideration the intensity of rainfall, duration of the storm, and duration between storm events. The mean effluent water quality for the LID structural BMPs was based on the International Stormwater BMP Database (ASCE/USEPA, 2003). The International Stormwater BMP Database was used because it is a peer reviewed database that contains a wide range of BMP effectiveness studies that are reflective of diverse land uses. The LID structural BMP modeled was biofiltration.
• Bypass Flows: The water quality model considers conditions when the BMPs are full and flows are bypassed.
• Volume Reduction: The water quality model conservatively assumes the biofiltration facilities will be lined, thus zero volume reduction would occur due to infiltration or evapotranspiration.
6.1.1 Pollutants Modeled
The appropriate form of data used to address water quality are flow composite storm event samples, which are a measure of the average water quality during the event. To obtain such data usually requires automatic samplers that collect data at a frequency that is proportionate to flow rate. The pollutants of concern for which there are sufficient flow composite sampling data in the databases used for modeling are:
• Total Suspended Solids (sediment)
• Total Dissolved Solids (TDS)
• Total Phosphorus
• Nitrate-Nitrogen, Nitrite-Nitrogen, and Ammonia
• Total Copper
• Dissolved Copper
• Total Lead
• Total Zinc

SDSU Mission Valley Campus Project WQTR 70 August 2019
• Dissolved Zinc
6.1.2 Qualitative Impact Analysis
Post development stormwater runoff water quality impacts associated with the following pollutants of concern were addressed based on literature information and professional judgment because available data were not deemed sufficient for modeling:
• Turbidity
• Pathogens (Bacteria, Viruses, and Protozoa)
• Pesticides
• Petroleum Hydrocarbons (Oil and Grease, Polycyclic Aromatic Hydrocarbons)
• Toxicity
• Trash and Debris
• Benthic Community Effects
• Cadmium
• Dissolved Oxygen
Human pathogens are usually not directly measured in stormwater monitoring programs because of the difficulty and expense involved; rather, indicator bacteria such as fecal coliform or certain strains of E. Coli are measured. Because maximum allowable holding times for bacterial samples are necessarily short, most stormwater programs do not collect flow-weighted composite samples that potentially could produce more reliable statistical estimates of indicator concentrations. Fecal coliform or E. Coli are typically measured with grab samples, making it difficult to develop reliable EMCs. Total coliform and fecal bacteria (fecal coliform, fecal streptococcus, and fecal enterococci) were detected in stormwater samples tested in Los Angeles County at highly variable densities (or most probable number, MPN) ranging between several hundred to several million cells per 100 ml (LACDPW, 2000).
Pesticides in urban runoff are often at concentrations that are below detection limits for most commercial laboratories and therefore there are limited statistically reliable data available on pesticides in urban runoff. Pesticides were not detected in Los Angeles County monitoring data for land use-based samples, except for diazinon and glyphosate, which were detected in less than 15 percent and 7 percent of samples, respectively (LACDPW, 2000).
Petroleum hydrocarbons are difficult to measure because of laboratory interference effects and sample collection issues (hydrocarbons tend to coat sample bottles). Hydrocarbons are typically measured with single grab samples, making it difficult to develop reliable EMCs.
Trash and debris and toxicity are not typically included in routine urban stormwater monitoring programs. Several studies conducted in the Los Angeles River basin have attempted to quantify trash generated from discrete areas, but the data represent relatively small areas or relatively

SDSU Mission Valley Campus Project WQTR 71 August 2019
short periods, or both. Toxicity monitoring was not included in the Los Angeles County land use-based monitoring program. Dissolved oxygen and cadmium are not typically measured in stormwater treatment BMP effectiveness studies.

SDSU Mission Valley Campus Project WQTR 72 August 2019
7. IMPACT ASSESSMENT
The modeled pollutant impact assessment is presented in Section 7.1 and the qualitative analyses of the remaining surface water pollutants of concern follow in Section 7.2. Also addressed qualitatively are potential water quality impacts from dry weather runoff (Section 7.3), runoff and dewatering discharges during construction (Section 7.4), compliance with MS4 Permit requirements (Section 7.5), hydromodification impacts (Section 7.6), and groundwater quality and recharge impacts (Section 7.7). The analyses of cumulative impacts to surface water, hydromodification, and groundwater are provided in Section 7.8. A weight of evidence approach is employed using the various thresholds and significance criteria discussed in Section 4.4.
7.1 Post-Development Stormwater Runoff Impact Assessment for Modeled Pollutants of Concern
In this section, model results for each pollutant are evaluated in relation to the following significance criteria: (1) comparison of post-development versus pre-development stormwater quality concentrations and loads; (2) comparison with Small MS4 Permit, Construction General Permit, and Dewatering General Permit requirements for new development, as applicable; and (3) evaluation in light of receiving water benchmarks. Pursuant to the third criterion, predicted runoff pollutant concentrations in the post-development condition with runoff LID structural BMPs incorporated, are compared with benchmark receiving water quality criteria as provided in the Basin Plan and the CTR. The water quality criteria and wasteload allocations are considered benchmarks for comparison purposes only, since they do not apply directly to runoff from the Project, but the comparison provides useful information to evaluate potential impacts. A weight of evidence approach is employed in this analysis considering the various significance criteria.
Results from the water quality model for significance criterion one are reported in a series of tables, organized by constituent, showing predicted mean annual pollutant loads (lbs/yr) and mean annual concentrations. Projections are made for two conditions: (1) existing condition and (2) developed conditions.
Following the tables comparing post-development and pre-development water quality loads and concentrations for each constituent (except runoff volume) is a table comparing the post-development runoff quality to the benchmark water quality objectives and criteria for the Lower San Diego River. Water quality observed in Lower San Diego River is also included on these tables as a benchmark.

SDSU Mission Valley Campus Project WQTR 73 August 2019
Table 7-1: Average Annual Runoff Volume and Pollutant Loads for the Project Lower San Diego River Watershed (Results from Water Quality Model)
Parameter Units Existing Conditions
Project Developed Condition with LID
Structural BMPs Change
Runoff Volume acre-ft 134 104 -30 TSS tons/yr 22 8 -14 TDS lbs/yr 35 22 -13 Total Phosphorous lbs/yr 133 62 -71 Nitrate-N lbs/yr 209 175 -34 Nitrite-N lbs/yr 50 30 -20 Ammonia-N lbs/yr 403 78 -325 Total Nitrogen lbs/yr 1,436 548 -888 Total Copper lbs/yr 20 4 -16 Dissolved Copper lbs/yr 7 2 -5 Total Zinc lbs/yr 166 29 -137 Dissolved Zinc lbs/yr 82 17 -65 Total Lead lbs/yr 5 1 -4
Table 7-2: Average Annual Pollutant Concentrations for the Project (Results from Water Quality Model)
Parameter Units Existing Conditions
Project Developed Condition with LID
Structural BMPs Change
TSS mg/L 121 54 -67 TDS mg/L 0.10 0.08 -0.02 Total Phosphorous mg/L 0.37 0.22 -0.15 Nitrate-N mg/L 0.57 0.62 0.05 Nitrite-N mg/L 0.14 0.11 -0.03 Ammonia-N mg/L 1.11 0.28 -0.83 Total Nitrogen mg/L 4 2 -2 Total Copper µg/L 55 16 -39 Dissolved Copper µg/L 19 8 -11 Total Zinc µg/L 456 103 -353 Dissolved Zinc µg/L 225 59 -166 Total Lead µg/L 14 4 -10

SDSU Mission Valley Campus Project WQTR 74 August 2019
7.1.1 Stormwater Runoff Volumes
As summarized in Table 7-1, average annual runoff volumes are expected to decrease within the Project with development. The can be explained by the decrease in overall percent imperviousness associated with the Project, which includes parks and landscaping that does not exist in the pre-development site condition. For water quality modeling purposes, existing site conditions, which include a stadium and its surrounding parking lot, were assumed to have an imperviousness of 90 percent. Similarly, the proposed commercial developed land uses would have an imperviousness of 90 percent (see Appendix A, Table A-7, for a summary of modeled land uses and assumed imperviousness for the Project).
Project BMPs include LID site design, source control, and LID structural BMPs, consistent with the Small MS4 Permit requirements. Site design BMPs would further reduce stormwater runoff volume. In addition, the model conservatively assumes that the LID structural BMPs would not provide any volume reduction via infiltration and evapotranspiration; implementing partially or fully infiltrating BMPs, which may occur as part of the build-out of the Project if site conditions are favorable, would result in even more runoff volume reduction from the Project compared to the pre-development condition. Therefore, Project impacts associated with runoff volume would be less than significant.
7.1.2 Total Suspended Solids (TSS)
Overall, loads and concentrations of TSS are predicted to decrease with development (Table 7-1 and Table 7-2). The decrease is largely due to the inclusion of LID BMPs incorporated int the Project.
The Basin Plan states that:
“Waters shall not contain suspended and settleable solids in concentrations of solids that cause nuisance or adversely affect beneficial uses”
Based on the LID structural treatment control strategy, which would decrease concentrations and loadings of TSS in stormwater discharges from the Project to the Lower San Diego River, and that TSS in stormwater runoff from the Project would comply with the Basin Plan water quality objective, Project impacts associated with TSS would be less than significant.
7.1.3 Total Dissolved Solids (TDS)
Loads and concentrations of total dissolved solids are predicted to decrease with development (Table 7-1 and Table 7-2). The decrease in concentration is due to the lower average TDS concentration in runoff from multi-family residential areas in the proposed Project in comparison to the average concentration in runoff from commercial areas in the existing condition (see Table A-12 in Appendix A). The decrease in load is due to the predicted decrease in runoff volume in combination with the predicted decrease in concentration.

SDSU Mission Valley Campus Project WQTR 75 August 2019
The Basin Plan objective for TDS in the San Diego River at the Project location is 1,500 mg/L. The predicted concentration in Project runoff (0.08 mg/L) is well below the water quality objective. Therefore, Project impacts associated with TDS would be less than significant.
7.1.4 Total Phosphorus
Total phosphorus loads and concentrations are predicted to decrease in the Project with development (Table 7-1 and Table 7-2). The predicted decrease is largely due to the inclusion of LID BMPs incorporated into the Project.
The Basin Plan has a water quality objective for biostimulatory substances, including total phosphorus, which states:
“Concentrations of nitrogen and phosphorus, by themselves or in combination with other nutrients, shall be maintained at levels below those which stimulate algae and emergent plant growth. Threshold total phosphorus (P) concentrations shall not exceed 0.05 mg/l in any stream at the point where it enters any standing body of water, nor 0.025 mg/l in any standing body of water. A desired goal in order to prevent plant nuisance in streams and other flowing waters appears to be 0.1 mg/l total P. These values are not to be exceeded more than 10% of the time unless studies of the specific water body in question clearly show that water quality objective changes are permissible, and changes are approved by the Regional Board. Analogous threshold values have not been set for nitrogen compounds; however, natural ratios of nitrogen to phosphorus are to be determined by surveillance and monitoring and upheld. If data are lacking, a ratio of N:P = 10:1 , on a weight to weight basis shall be used.”
Although the developed condition with BMPs has a predicted total phosphorus concentration of 0.22 mg/L, this concentration is more than a 40% decrease in concentration from the existing condition concentration of 0.37 mg/L. The modeling results are also conservative because they do not include source control BMPs that target nutrients which would further reduce concentrations and loads of total phosphorus.
The Project will decrease the discharge of total phosphorus into Lower San Diego River; therefore, potential impacts associated with total phosphorus are considered less than significant.
7.1.5 Nitrogen
All nitrogen compounds (total nitrogen, nitrite, nitrate, and ammonia) loads and concentrations are predicted to decrease with Project development, except for the concentration of nitrate, which is predicted to increase slightly.
Site design BMPs that would further reduce nitrogen compound concentrations and loadings include the use of native or other appropriate plants in development area plant palettes (reduced fertilizer usage). Source control BMPs that target nutrients include educational materials on the proper handling of fertilizers and landscape management.

SDSU Mission Valley Campus Project WQTR 76 August 2019
There is no specific water quality objective for nitrate listed in the Basin Plan. The Drinking Water Standards Maximum Contaminant Level for nitrate is 10 mg/L as nitrogen. The predicted nitrate concentration in treated stormwater (0.62 mg/L) is well below this level.
There is a numeric Basin Plan water quality objective for ammonia, which is for the un-ionized form and states:
“Waters shall not contain un-ionized ammonia in amounts which adversely affect beneficial uses. In no case shall the discharge of wastes cause concentrations of un-ionized ammonia (NH3 as N) to exceed 0.025.”
The percentage of total ammonia (which is the form of ammonia modeled for this WQTR) present in the un-ionized form may be calculated based on temperature and pH (Florida Department of Environmental Protection, 2001). Un-ionized ammonia predominates when pH is high. Assuming a pH for Project runoff of 8.0 and a temperature of 20°C, 3.8 percent of the total ammonia would be in the un-ionized form. The predicted ammonia concentration in runoff is 0.28 mg/L for the Project. This translates to un-ionized ammonia concentrations of 0.011 mg/L, which is well below the Basin Plan objective.
The Basin Plan also has a narrative objective for biostimulatory substances, as summarized above for total phosphorus. The Project would decrease loads and concentrations for all nitrogen compounds, except for nitrate concentration, which is predicted to increase slightly in Project runoff. Therefore, the Project would comply with the Basin Plan objective and potential impacts associated with nitrogen discharges to receiving waters would be less than significant.
7.1.6 Metals
Loads and concentrations for all metals (total and dissolved copper, total lead, and total and dissolved zinc) are predicted to decrease with Project development.
Although metals concentrations in Project discharges are predicted to be greater than the average observed concentrations in the Lower San Diego River, Project discharges for all metals are predicted to be less than the CTR criteria (Table 7-3).
Table 7-3: Comparison of Predicted Trace Metals Concentrations with Water Quality Criteria
Metal
Predicted Project Average Annual Concentration1
(µg/L)
Lower San Diego River Observed Average Wet Season Concentration
(µg/L) California Toxics
Rule Criteria2 (µg/L)
Dissolved Copper 8 4.9 13
Total Lead 4 2.9 82
Dissolved Zinc 59 15.6 120
Notes: 1 Modeled concentration for developed conditions with LID structural BMPs.

SDSU Mission Valley Campus Project WQTR 77 August 2019
2 Water quality standards are acute (maximum one-hour average concentration) California Toxics Rule criteria for a hardness value of 100 mg/L.
Cadmium is typically not detected in urban runoff or is detected at very low levels (LACDPW, 2000). The land use monitoring conducted in Los Angeles County did not detect cadmium in runoff from open space, had one detect out of 45 samples from multi-family residential land use, and detected an average concentration of 0.73 µg/L in runoff from commercial land uses. The acute CTR criterion for total cadmium at 100 mg/L hardness is 4.5 µg/L. Based on the reduction in loads and concentrations in Project runoff and the comparison with CTR criteria, the Project is expected to have a less than significant impact on surface water quality resulting from the discharge of metals.
7.2 Post Development Impact Assessment for Pollutants Addressed without Modeling
7.2.1 Turbidity
Turbidity is a measure of water clarity and how much the material suspended in water decreases the passage of light through the water.9 Turbidity may be caused by a wide variety of suspended materials, which range in size from colloidal to coarse dispersions, depending upon the degree of turbulence. In lakes or other waters existing under relatively quiescent conditions, most of the turbidity will be due to colloidal and extremely fine dispersions. In rivers under flood conditions, most of the turbidity will be due to relatively coarse dispersions. Erosion of clay and silt soils may contribute to receiving water turbidity. Organic materials reaching rivers serve as food for bacteria, and the resulting bacterial growth and other microorganisms that feed upon the bacteria produce additional turbidity. Nutrients in runoff may stimulate the growth of algae, which also contributes to turbidity.
Discharges of turbid runoff are primarily of concern during the construction phase of development. Construction-related impacts are addressed in Section 7.4 below. The Construction Stormwater Pollution Prevention Plan must contain sediment and erosion control BMPs pursuant to the CGP, and those BMPs must effectively control erosion and discharge of sediment, along with other pollutants, per the BAT/BCT standards. Additionally, fertilizer control and non-visible pollutant monitoring and trash control BMPs in the SWPPP will combine to help control turbidity during the construction phase.
In the post-development condition, placement of impervious surfaces will serve to stabilize soils and to reduce the amount of erosion that may occur from the Project during storm events and will therefore decrease turbidity in runoff from the Project. Project BMPs, including source controls (such as common area landscape management and common area litter control) and LID structural BMPs in compliance with the Small MS4 Permit, will prevent or reduce the release of organic materials and nutrients (which might contribute to algal blooms) to receiving waters. As shown in Section 7.1 above, post-development sediment in runoff is not expected to cause 9 http://water.epa.gov/type/rsl/monitoring/vms55.cfm

SDSU Mission Valley Campus Project WQTR 78 August 2019
significant water quality impacts. Based on implementation of the construction phase and post-construction Project BMPs, runoff discharges from the Project will not cause increases in turbidity which would result in adverse effects to beneficial uses in the receiving waters. Based on these considerations, the water quality impacts of the Project on turbidity are considered less than significant.
7.2.2 Pathogens
Background Pathogens are viruses, bacteria, and protozoa that can cause gastrointestinal and other illnesses in humans through body contact exposure. Traditionally, regulators have used fecal indicator bacteria (FIB), such as total and fecal coliform, enterococci, and E. coli, as indirect measures of the presence of pathogens, and by association, human illness risk. Representative sources of fecal indicator bacteria include sanitary sewer overflows, stormwater discharges from MS4s, illicit connections to storm sewer systems (dry weather discharges), inappropriate discharges to storm sewer systems (e.g., powerwashing), failing or improperly located onsite wastewater treatment systems (septic systems), wastewater treatment plants, wildlife, domestic pets, and agriculture. There are various confounding factors that affect the reliability of FIB as pathogen indicators, including non-anthropogenic (natural) sources posing potentially less human health risk, growth of organisms within stormwater drainage infrastructure, and different persistence characteristics of real pathogens in the environment compared to FIB.
USEPA updated its recreational water quality criteria in 2012 (last published in 1986), which recommends using FIB enterococci and E. coli as indicators of fecal contamination in fresh water. Scientific advancements in microbiological, statistical, and epidemiological methods have demonstrated that culturable enterococci and E. coli are better indicators of fecal contamination than the previously used general indicators total coliform and fecal coliform. Water quality criteria consist of a geometric mean and statistical threshold value. USEPA recommended that states make a risk management decision about illness rate that will determine which set of criteria is most appropriate for the receiving waters.
The SWRCB adopted Part 3 of the Water Quality Control Plan for Inland Surface Waters, Enclosed Bays and Estuaries of California (ISWEBE Plan) — Bacteria Provisions and a Water Quality Standards Variance Policy, and an amendment to the Water Quality Control Plan for Ocean Waters of California (Ocean Plan) — Bacteria Provisions and a Water Quality Standards Variance Policy (separately referred to as Part 3 and the Ocean Plan Amendment, respectively, and collectively referred to as the Bacteria Provisions) in August 2018. The Office of Administrative Law approved the Bacteria Provisions on February 4, 2019; this is the effective date under state law. The water quality standards and policies that generally affect the application and implementation of water quality standards will not become effective for Clean Water Act purposes until approved by the USEPA.
The Bacteria Provisions' revised water quality objectives apply to fresh, estuarine, and ocean waters for the protection of the primary contact recreation (REC-1) beneficial use based on a risk protection level of 32 illness per 1,000 recreators. The Bacteria Provisions establish E. coli as the sole indicator of pathogens in freshwater; enterococci as the sole indicator for saline inland

SDSU Mission Valley Campus Project WQTR 79 August 2019
surface waters, enclosed bays, and estuaries; and enterococci as one of the indicators in ocean waters. The Ocean Plan Amendment retains the fecal coliform objective because California-specific epidemiological studies provide data that suggest fecal coliform may be a better indicator of gastrointestinal illness than enterococci during certain types of exposure and environmental conditions. The SWRCB will consider evaluating the fecal coliform water quality objective at a later date.
The Bacteria Provisions also include implementation elements for control of bacteria, including reference system and natural sources exclusion approaches, high flow suspensions, seasonal suspensions, and a definition and provisions for designation of the limited water contact recreation (LREC-1) beneficial use. In addition, the Bacteria Provisions identify an existing mechanism for adopting water quality standards variances for pollutants and waterbodies.
The Bacteria Provisions will supersede any numeric water quality objectives for bacteria for the REC-1 beneficial use in RWQCB Basin Plans prior to the effective date of the Bacteria Provisions, except for site-specific numeric water quality objectives for bacteria.
Analysis Until recently, few epidemiological studies have tested the health effects related to exposure to the receiving waters receiving direct discharges of stormwater runoff, and these studies have found it difficult to link illness with stormwater sources of FIB. For instance, a Mission Bay epidemiological study (Colford et al., 2005) found that “only skin rash and diarrhea were consistently elevated in swimmers versus non-swimmers, the risk of illness was uncorrelated with levels of traditional water quality indicators, and State water quality thresholds were not predictive of swimming-related illnesses.”
The primary sources of pathogen indicators from the Project would likely be sediment, wildlife, and regrowth in the stormwater drainage system. The concentrations and loads of bacteria in runoff from the Project would be reduced by source controls and the LID structural BMPs. An analysis of the data from the International Stormwater BMP Database (Geosyntec Consultants and Wright Water Engineers, 2017) summarizes bioretention BMP influent and effluent data for enterococcus and E. coli. The data show a median bioretention BMP effluent value of 220 MPN/100mL (95% confidence interval about the median of 58 MPN/100mL and 440 MPN/100mL) for enterococcus and 240 MPN/100mL (95% confidence interval about the median of 77 MPN/100mL and 280 MPN/100mL) for E. coli. Statically significant reductions in effluent concentrations were observed for both indicators in bioretention BMPs.
In comparison, the Basin Plan objective for enterococcus in the San Diego River is 61 MPN/100mL, with 22% of wet days allowed to exceed this target, which is conservatively protective of the REC-1 “designated beach” usage frequency for freshwater creeks and downstream beaches.
In summary, stormwater discharges from the Project could potentially exceed the Basin Plan FIB objectives for the San Diego River and therefore impacts from FIB may be significant without BMPs. However, the FIB concentrations in runoff from the Project would be reduced through the implementation of source control and LID structural BMPs in comparison to the existing Project conditions. The Project’s sewer system will be designed to current standards which would

SDSU Mission Valley Campus Project WQTR 80 August 2019
minimize the potential for leaks. The Project, consistent with the Small MS4 Permit requirements, includes LID structural BMPs (e.g., biotreatment controls), selected to manage pollutants of concern, including pathogen indicators. With these BMPs, the Project would not result in substantial changes in pathogen indicator levels compared to the existing condition that would cause a violation of the water quality objectives or waste discharge requirements, would not create runoff that would provide substantial additional sources of bacteria, or otherwise substantially degrade water quality in the receiving waters. Project water quality impacts related to pathogens are considered less than significant.
7.2.3 Pesticides
In urban settings, pesticides are commonly applied in and around buildings (structural pest control) to control against ants and other pests and in vegetated areas to control insects, molds, and other vectors. The forms of pesticides used have evolved in response to regulatory actions. Organochlorine pesticides including chlordane, dieldrin, DDT and toxaphene were some of the earliest pesticides, applied generally in the 1940’s to 1960’s. These pesticides were found to be persistent in the environment, bioaccumulated in the food chain of various animals, and posed a health risk to humans consuming food contaminated by these pesticides. These persistent organochlorine pesticides can be of concern where past farming practices involved their application, which is not applicable to the Project.
In the post-developed condition, pesticides could be applied to common landscaped areas. The organochlorine pesticides were replaced by organophosphate pesticides, a class of pesticides that includes diazinon and chlorpyrifos, which have been commonly found in urban streams (Katznelson and Mumley, 1997). However, only zero to 13 percent of the samples in the Los Angeles County database had detectable levels of diazinon (depending on the land use), while levels of chlorpyrifos were below detection limits for all land uses in all samples taken between 1994 and 2000 (LACDPW, 2000). Other pesticides presented in the database were seldom measured above detection limits. Furthermore, these data represent flows from areas without LID or treatment controls, unlike the Project, which does incorporate LID structural BMPs.
Diazinon and chlorpyrifos are two pesticides of concern due to their potential toxicity in receiving waters. The USEPA banned all indoor uses of diazinon in 2002 and stopped all sales for all outdoor non-agricultural use in 2003 (NPIC, 2014).10 Monitoring data can still detect these pesticides in water and sediment samples, however, State-wide sampling from 2008 to 2010 conducted as part of the California Surface Water Ambient Monitoring Program (SWAMP)
10 Changes to the use of chlorpyrifos include reductions in the residue tolerances for agricultural use, phase out of nearly all indoor and outdoor residential uses, and disallowal of non-residential uses where children may be exposed. Retail sales of chlorpyrifos were stopped by December 31, 2001, and structural (e.g. construction) uses were phased out by December 31, 2005. Some continued uses will be allowed, for example public health use for fire ant eradication and mosquito control is permitted by professionals. Permissible uses of diazinon are also restricted. All indoor uses are prohibited (as of December 2002) and retailers were required to end sales for indoor use on December 2002. All outdoor non-agricultural uses were phased out by December 31, 2004. Therefore, it is likely that the USEPA ban will eliminate most of the use of diazinon within the Project. The use of diazinon for many agricultural crops has been eliminated (USEPA, 2001), while some use of this chemical will continue to be permitted for some agricultural activities.

SDSU Mission Valley Campus Project WQTR 81 August 2019
Stream Pollution Trends sampling indicates that organophosphate pesticides in sediment decreased between 2008 and 2010 (Anderson et al., 2013). For example, chlorpyrifos was detected in 12 percent of the 92 sediment sampling sites in 2008, and in none of the 95 sites sampled in 2010.
The USEPA has also phased out most indoor and outdoor residential uses of chlorpyrifos and has stopped all non-residential uses where children may be exposed. Use of chlorpyrifos in the Project is not expected.
The organophosphate pesticides have been largely replaced with a third class of pesticides, pyrethroid pesticides, which are a synthetic form of naturally occurring pyrethrins. State-wide sampling conducted as part of the SWAMP indicated 55 percent of the 92 sediment sampling sites monitored in 2008 contained pyrethroid pesticides; this percentage increased to 81 percent of the 95 samples taken in 2010. A recent survey of data from approximately 80 studies that focused on pyrethroid pesticides and fipronil in receiving waters subject to urban runoff was conducted by the California Stormwater Quality Association (CASQA) (Ruby, 2013). As part of this review, over 9,200 pyrethroid sample analysis results were compiled. Overall, pyrethroids were detected in 34 percent of the sediment samples and 25 percent of the water samples. Pyrethroids were found at concentrations exceeding levels known to cause toxicity to sensitive aquatic organisms in water. Given the concerns regarding the widespread presence of synthetic pyrethroids in sediment of both agricultural and urban dominated waterways, the California Department of Pesticide Regulation (DPR) issued new regulations affecting 17 pyrethroids on July 19, 2012, limiting applications in outdoor non-agricultural settings.11
The CASQA report also compiled over 3,200 fipronil results. The non-pyrethroid pesticide, fipronil, is a leading replacement for pyrethroid pesticides in urban areas (SFEP, 2005), but fipronil and its degradates12 are toxic and increasingly detected in water and sediment in urban watercourses. Fipronil was detected in 40 percent of the water samples and 36 percent of the sediment samples tested in studies evaluated in the CASQA report, whereas the fipronil degradates were detected in 27 percent of the water samples and 61 percent of the sediment samples. The latter results are more consistent with pyrethroids, which tend to be associated with particles and have low water solubility.
The water quality risks posed by a pesticide relate to the quantity of the pesticide used, its breakdown or degradation rate, its runoff characteristics, and its relative toxicity in water and sediment. Given that many pesticides exhibit toxicity at very low concentrations, the most effective control strategy is source control, and compliance with the DPR regulations limiting outdoor applications. Source control measures such as education programs for owners, lessees, operators, and employees in the proper application, storage, and disposal of pesticides are the most promising strategies for controlling the pesticides that will be used post-development. Structural treatment controls are less practical because of the variety of pesticides and wide range of chemical properties that affect their ability to treat these compounds. However, most
11 http://www.cdpr.ca.gov/docs/legbills/rulepkgs/11-004/text_final.pdf. 12 Fipronil is a phenylpyrazole insecticide. Studies show that fipronil is readily transformed into three degradates: fipronil desulfinyl, fipronil sulfone, and fipronil sulfide (Delgado-Moreno et al., 2011).

SDSU Mission Valley Campus Project WQTR 82 August 2019
pesticides are relatively insoluble in water and therefore tend to adsorb to the surfaces of sediment, which will be stabilized with development, or if eroded, will be settled or filtered out of the water column in the LID structural BMPs. In addition, biofiltration media contains sorption sites that would promote the removal of pesticides. Thus, treatment in the LID structural BMPs should achieve some removal of pesticides from stormwater as TSS is reduced and stormwater is biofiltered.
Based on the incorporation of site design, source control, and LID structural BMPs consistent with the Small MS4 Permit, potential post-development impacts associated with pesticides are expected to be less than significant.
Transport of legacy pesticides adsorbed to existing site sediments may be a concern during the construction phase of development. Construction-related impacts are addressed in Section 7.4 below. The Construction SWPPP must contain sediment and erosion control BMPs pursuant to the CGP, and those BMPs must effectively control erosion and the discharge of sediment along with other pollutants per the BAT/BCT standards. Based on these sediment controls, construction-related impacts associated with pesticides are considered less than significant.
7.2.4 Petroleum Hydrocarbons (PAHs)
Various forms of petroleum hydrocarbons are common constituents associated with urban runoff; however, these constituents are difficult to measure and are typically measured with grab samples, making it difficult to develop reliable EMCs for modeling. Based on this consideration, hydrocarbons were not modeled but are addressed qualitatively.
Hydrocarbons are a broad class of compounds, most of which are non-toxic. Petroleum hydrocarbons are hydrophobic (low solubility in water), have the potential to volatilize, and most forms are biodegradable. Polycyclic Aromatic Hydrocarbons (PAHs) are a class of hydrocarbons that can be toxic depending on the concentration levels, exposure history, and sensitivity of the receptor organisms, and are therefore of most interest in terms of impacts to water quality and beneficial uses.
Petroleum hydrocarbon sources in urban settings derive principally from transportation sources including emissions and leaks from vehicles and spill from fueling operations. These sources are located on impervious surfaces including roads and parking lots and, therefore, PAHs can be considered a relatively mobile source.
Concentrations in stormwater have been extensively measured and reported in the literature. Stein et al. sampled runoff at eight stations located in the Los Angeles metropolitan area from 2001 through 2004 (Stein et al., 2006). Most of the stations were located near the mouths of major channels (i.e., mass emissions stations). Samples were also obtained at fifteen land use stations. The mean flow-weighted total PAH concentration for the mass emission stations was 2,300 nanograms per liter (ng/L), compared to approximately 140 ng/L for one storm from an open space-dominated drainage. These data indicate that development may increase PAHs in runoff significantly. An analysis of selected individual PAHs indicated that the most prevalent PAHs were those having the higher molecular weights (e.g., pyrene, fluoranthene, and chrysene) and whose source is pyrogenic (related to combustion).

SDSU Mission Valley Campus Project WQTR 83 August 2019
The majority of PAHs in stormwater adsorb to the organic carbon fraction of particulates in the runoff, including soot carbon generated from vehicle exhaust (Ribes et al., 2003), so there is concern that sediments could become contaminated with PAHs and cause toxicity to benthic organisms. In a monitoring survey conducted as part of the SWAMP Stream Pollution Trends Project, average PAHs in stream sediments increased from 2008 to 2009 and then decreased in 2010 (Table 7-4). [The number of stations monitored in 2009 was about 25% of the number of stations monitored in 2008 and 2010, so the data for that year is less robust.] Overall these data suggest that PAHs in stream sediments subject to urban runoff may be showing a decreasing trend. An examination of the correlation between amphipod survival and PAHs indicated that PAHs were not statistically correlated with amphipod survival in 2008, 2009 and 2010, and therefore PAHs do not appear to be a cause of the observed toxicity in this data set.
Table 7-4: Trends in Urban Stream Sediment PAH Concentrations
Year No. of Stations Percent Detection (%) Average Detection (ng/g)
2008 92 100 757 2009 23 100 1,457 2010 95 93 293
Source: SWRCB SWAMP Stream Pollution Trends (SPoT) Second Year Report (Anderson et al., 2013)
PAHs in urban runoff are primarily associated with transportation activities. Source control BMPs that address petroleum hydrocarbons include educational materials on oil disposal and recycling programs. Supplemental to this strategy will be the utilization of LID structural BMPs that will further reduce PAH concentrations in runoff. The literature indicates that PAHs tend to be adsorbed to particulates and therefore amenable to LID structural BMPs that incorporate unit processes such as settlement, filtration and/or adsorption. The Project’s LID structural BMPs would utilize these unit processes to treat runoff from parking lots and roadways and thus would further reduce concentrations in runoff.
During the construction phase of the Project, petroleum hydrocarbons in site runoff could result from construction equipment/vehicle fueling or spills. Construction-related impacts are addressed in Section 7.4 below. However, pursuant to the CGP, the Construction SWPPP must include BMPs that address proper handling of petroleum products on the construction site, such as proper petroleum product storage and spill response practices, and those BMPs must effectively prevent the release of hydrocarbons to runoff per the BAT/BCT standards. PAHs that are adsorbed to sediment during the construction phase would be effectively controlled via the erosion and sediment control BMPs. For these reasons, construction-related impacts related to hydrocarbons on water quality are considered less than significant.
On the basis of the integrated source control and LID structural treatment strategy, the effect of the Project on petroleum hydrocarbons in the receiving waters is considered less than significant.
7.2.5 Toxicity
Pesticides, metals, PAHs, and other organic compounds (e.g., PCBs) can enter the aquatic food chain and cause acute or chronic toxicity in the form of lethal or sub-lethal effects, including

SDSU Mission Valley Campus Project WQTR 84 August 2019
survival, reproduction, prey avoidance, and others. Such effects are commonly measured by exposing sensitive organisms to water samples over a period of time and measuring the effects on the organisms.
The Lower San Diego River 303(d) listing for toxicity names the potential sources as: 1) nonpoint source, 2) other urban runoff (i.e., no urban runoff/storm sewers), and 3) unknown point source. The literature indicates that pesticides are a primary cause of most of the observed toxicity in receiving waters when organisms are exposed to urban runoff water samples or are exposed to sediments contaminated by urban runoff (Anderson et al., 2013, Amweg et al., 2006, Gan et al., 2005). Data from the SWAMP Stream Pollution Trends Second Year Report confirm that the primary class of pesticides causing toxicity are the pyrethroid pesticides (Anderson et al., 2013). This study also indicates that toxicity units are an effective measure of the cumulative toxicity associated with a mix of individual pyrethroids.
In a more focused evaluation of data from streams and other receiving water bodies subject to urban runoff, Ruby determined that pyrethroids were commonly found at concentrations exceeding levels which cause toxicity to sensitive aquatic organisms in water. The average reported concentrations of bifenthrin, cyfluthrin, cyhalothrin, cypermethrin, and permethrin in water samples range from approximately one to more than three orders of magnitude above chronic criteria values referenced in the report (Ruby, 2013). Similar conclusions were made for pyrethroid concentrations in sediment.
Thus, the literature indicates that toxicity impacts are largely related to pesticides and the potential impacts of pesticides on water quality are discussed above in this section. Other pollutants that may affect toxicity (metals and PAHs) are also addressed above. Based on the incorporation of source control, LID site design and LID structural BMPs pursuant to the Small MS4 Permit and the impact analysis results presented in these sections, potential post-development impacts associated with aquatic toxicity are considered less than significant.
7.2.6 Trash and Debris
Urban development can generate trash and debris. Trash refers to any human-derived materials including paper, plastics, metals, glass and cloth. Debris refers to any organic material transported by stormwater, including leaves, twigs, and grass clippings. Debris can be associated with the natural condition. Trash and debris can be characterized as material retained on a 5-mm mesh screen. In developed areas during rain events, trash and debris deposited on paved surfaces can be transported to storm drains, where it eventually can be discharged to receiving waters. Trash and debris can also be mobilized by wind and transported directly into waterways. The discharge of trash and debris contributes to the degradation of receiving waters by imposing an oxygen demand during decomposition, attracting pests, disturbing physical habitats, clogging storm drains and conveyance culverts, and carrying nutrients, pathogens, metals, and other pollutants that may be attached to the surfaces.
Urbanization could significantly increase trash and debris loads, if controls are not implemented. However, Project BMPs, including the installation of full trash capture devices, as well as including site design and source control and LID structural BMPs required by the Small MS4 Permit, would significantly reduce or eliminate trash and debris in Project runoff.

SDSU Mission Valley Campus Project WQTR 85 August 2019
A significant source of trash in the Lower San Diego River is homeless encampments (San Diego River Park Foundation, 2018). The City of San Diego actions to address trash in storm drain discharges and the San Diego River are described in the San Diego River Watershed Management Area Water Quality Improvement Plan (City of El Cajon et al., 2016). The City participates in a variety of trash mitigation efforts in the San Diego River Watershed including public education, facilitating organized trash clean-up and recycling events, municipal street sweeping, storm drain cleaning, encampment sweeps conducted by local law enforcement (i.e.: Sheriff, police) and the installation and maintenance of structural BMPs, such as booms, hydrodynamic separators and infiltration BMPs, that capture trash. In addition, the City supports the work of the San Diego River Park Foundation (SDRPF), I Love a Clean San Diego (ILACSD), the San Diego Urban Corps, and other civic groups that organize and conduct trash clean-up events and assessments. The City of San Diego currently sponsors trash clean ups on an annual basis. The City of San Diego plans to increase effectiveness and reach of trash/beach cleanups and community-based efforts by engaging community groups to self‐define and carry‐out trash clean‐ups. To effectively target stream clean‐up efforts, the City will focus on partnerships with community organizations which provide strong engagement with target audiences and communities. Cleanups target trash, however, a reduction in trash also reduces other pollutants such as bacteria and nutrients that can attach to food waste wrappers and yard waste. The City of San Diego will also implement a project involving restoration of native habitat and trash removal along 5,750 feet of the San Diego River covering approximately 57 acres. Work on this project is scheduled to be completed by 2022.
During the construction phase, there is potential for an increase in trash and debris loads due to poor contractor housekeeping practices. Per the Construction General Permit, the SWPPP for the site will include BMPs for trash control (catch basin inserts, good housekeeping practices, etc.). Compliance with the permit requirements and inclusion of these BMPs in the SWPPP that meet the BAT/BCT performance standard would reduce impacts from trash and debris to a less-than-significant level. See Section 7.4 for more discussion of construction phase-related impacts.
Based on these considerations, post-development trash and debris from the Project will not significantly impact the Lower San Diego River.
7.2.7 Benthic Community Effects
Benthic communities, organisms that reside in the benthic zone of a water body, respond to environmental stressors effecting the biological diversity of the stream. Urbanization is known to have a direct impact on receiving waters, thus impacting biological diversity. Potential sources for benthic community effects on the 2014/2016 303(d) list are hydromodification, illicit connections, illegal hookups, dry weather flows, nonpoint sources, urban point sources, and storm sewer sources.
To indicate an impairment of benthic community effects, regulators have established the benthic macroinvertebrate (BMI) index score (IBI) to understand the bioassessment of the organisms. Bioassessment of organisms is measured using seven metrics: EPT taxa richness (Ephemeroptera [mayflies], Plecoptera [stoneflies], and Trichoptera [caddisflies]), Coleoptera (beetle) richness, predator richness, percent of individuals in specific feeding groups (collector-filterers+ collector-

SDSU Mission Valley Campus Project WQTR 86 August 2019
gatherers), percent pollution intolerant individuals, percent non-insect taxa, and percent pollution-tolerant taxation. Results are given a score from 0-100 broken into five categories: “excellent” (81–100), “good” (61–80), “fair” (41–60), “poor” (21–40), and “very poor” (0–20) (Pearson et al., 2013).
Studies have shown a direct correlation between impervious surfaces and a decline in macroinvertebrates, resulting in a low IBI score (Pearson et. al., 2013). Effective impervious area, impervious surface directly connecting the drainage catchment and receiving waters, may serve as a good indicator for possible impairment of benthic community effects due to its clear negative effects on receiving waters caused by the transport of pollutants. Percent development and prevent impervious are good predictors of impairment and are known to have a direct correlation with decreased IBI score (Pearson et. Al, 2013).
During the construction phase, there may be a potential for increased benthic community effects if the minimum required BMPs are not implemented. Construction-related impacts are addressed in Section 7.4 below. The Construction SWPPP must contain sediment and erosion control BMPs pursuant to the CGP, and those BMPs must effectively control erosion and discharge of sediment, along with other pollutants, per the BAT/BCT standards, which will reduce potential impacts on the receiving water.
In the post-Project condition, the Project will decrease the total impervious area and increase previous area by adding LID BMPs and creating open space, parks and recreation areas. Additionally, the Project will treat stormwater runoff from the developed area in LID BMPs, while in the existing condition there is no stormwater treatment. The reduction in impervious area and treatment of Project runoff will improve water quality in stormwater runoff and in the Project’s receiving waters, thus reducing the benthic community effects from the Project.
Based on these considerations, the Project will not significantly impact benthic community effects in the Lower San Diego River.
7.2.8 Dissolved Oxygen (DO)
Dissolved oxygen (DO) is a measure of how much oxygen is dissolved in the water - the amount of oxygen available to living aquatic organisms. Oxygen demanding substances that can lower DO in receiving waters are compounds that can be biologically degraded by microorganisms. Compounds such as organic food wastes in trash and anhydrous ammonia in fertilizer are examples of the oxygen demanding compounds that may be present in urban runoff. Ammonia is typically detected at very low levels in urban runoff, likely due to the oxidation of ammonia to nitrate by bacteria in soil (nitrates are typically detected at higher concentrations than ammonia in urban runoff and do not exert an oxygen demand). Oxygen demand can be measured as “five-day biochemical oxygen demand” (BOD5). This test involves the measurement of the dissolved oxygen used by microorganisms in the biochemical oxidation of organic matter. The mean BOD5 reported in the LA County database in runoff from commercial, multi-family residential, and open space land uses was 27 mg/L, 11 mg/L, and 12 mg/L, respectively (Los Angeles County, 2000). In contrast, the typical BOD5 concentration in a medium strength untreated domestic wastewater is 220 mg/L and, after secondary treatment, is 30 mg/L (Metcalf and Eddy, 1979).

SDSU Mission Valley Campus Project WQTR 87 August 2019
Based on the incorporation of source control, LID site design, and LID structural BMPs pursuant to the Small MS4 Permit and the impact analysis results for nutrients and trash presented above, potential post-development impacts associated with dissolved oxygen are considered less than significant.
7.3 Dry Weather Runoff
Pollutants in dry weather flows could also be of concern because dry weather flow conditions occur throughout a large majority of the year, and because some of the TMDLs in the Lower Sand Diego River are applicable for dry weather conditions (e.g., bacteria).
Dry weather flows are typically low in sediment because the flows are relatively low and coarse suspended sediment tends to settle out or is filtered out by vegetation. As a consequence, pollutants that tend to be associated with suspended solids (e.g., phosphorus, some bacteria, some trace metals, and some pesticides) are typically found in very low concentrations in dry weather flows. The focus of the following discussion is therefore on constituents that tend to be dissolved, e.g., nitrate and trace metals, or constituents that are so small as to be effectively transported, e.g., pathogens and oil and grease.
In order to minimize the potential generation and transport of dissolved constituents, landscaping in public and common areas will utilize drought tolerant vegetation that requires little watering and chemical application. Landscape watering in common areas, commercial areas, multi-family residential areas, and in parks will use efficient irrigation technology utilizing evapotranspiration sensors to minimize excess watering.
In addition, educational programs and distribution of materials (source controls) will emphasize appropriate car washing locations (at commercial car washing facilities), encourage low impact landscaping and appropriate watering techniques, and discourage driveway and sidewalk washing. Illegal dumping will be discouraged by stenciling storm drain inlets and posting signs that illustrate the connection between the storm drain system and the receiving waters and natural systems downstream.
The LID BMPs will provide treatment, storage, and evaporation of dry weather flows. Water cleansing is a natural function of vegetation and biologically active media, offering a range of treatment mechanisms. Sedimentation of particulates is the major removal mechanism. However, the performance is enhanced as plant materials allow pollutants to come in contact with vegetation and soils containing bacteria that metabolize and transform pollutants, especially nutrients and trace metals. Plants also take up nutrients in their root system. Pathogens would be removed through filtration in the bioretention soils. Any petroleum hydrocarbons will be effectively adsorbed by the vegetation and soil within LID BMPs.
Based on source control BMPs reducing the amount of dry weather runoff and LID BMPs capturing and treating any dry weather runoff that does occur, the impact from dry weather flows is considered less than significant.

SDSU Mission Valley Campus Project WQTR 88 August 2019
7.4 Construction Related Impacts
The analysis of potential impacts of construction activities, construction materials, and non-stormwater runoff on water quality during the construction phase focuses primarily on sediment (TSS and turbidity) and certain non-sediment related pollutants. Construction-related activities that are primarily responsible for sediment releases are related to exposing previously stabilized soils to potential mobilization by rainfall/runoff and wind. Such activities include removal of vegetation from the site, grading of the site, and trenching for infrastructure improvements. Environmental factors that affect erosion include topographic, soil, and rainfall characteristics. Non-sediment-related pollutants that are also of concern during construction relate to construction materials and non-stormwater flows and include construction materials (e.g., paint, stucco, etc.); chemicals, liquid products, and petroleum products used in building construction or the maintenance of heavy equipment; and concrete-related pollutants are also of concern during construction.
Construction impacts due to Project development will be minimized through compliance with the Construction General Permit. This permit requires the discharger to perform a risk assessment for the proposed development (with differing requirements based upon the determined level) and to prepare and implement a SWPPP, which must include erosion and sediment control BMPs that will meet or exceed measures required by the determined risk level of the Construction General Permit, as well as BMPs that control the other potential construction-related pollutants. A Construction Site Monitoring Program that identifies monitoring and sampling requirements during construction is a required component of the SWPPP. Preliminary analysis indicates that the Project will most likely be categorized as a Risk Level 2. BMPs required by the Construction General Permit will be incorporated assuming this level of risk; if final design analysis indicates that the Project will fall under Risk Level 3, the additional Level 3 permit requirements will be implemented as necessary.
7.4.1 Compliance with Construction Permit and Construction Impacts
Prior to the issuance of preliminary or precise grading permits, the Project Proponent will provide the City with evidence that a Notice of Intent (NOI) has been filed with the SWRCB via an online system called the Stormwater Multiple Applications and Report Tracking System (SMARTS) by the Legally Responsible Person (LRP). The NOI will include the Project’s applicable Waste Discharge Identification (WDID) number.
Construction on the Project may require dewatering. For example, dewatering of captured stormwater may be needed if water has been standing onsite and needs to be removed for construction, vector control, or other reasons. Further, dewatering may be necessary if groundwater is encountered during grading, or to allow discharges associated with testing of water lines, sprinkler systems and other facilities. In general, the CGP authorizes construction dewatering activities and other construction-related non-stormwater discharges as long as they (a) comply with Section III.C of the General Permit; (b) do not cause or contribute to violation of any water quality standards, (c) do not violate any other provisions of the General Permit, (d) do not require a non-stormwater permit as issued by some RWQCBs, and (e) are not prohibited by a Basin Plan provision. Additionally, if the Project does not meet the above conditions of the CGP,

SDSU Mission Valley Campus Project WQTR 89 August 2019
construction dewatering may be covered under the regional Dewatering General Permit for discharge to surface water, the Statewide Dewatering General Permit for discharge to land, or may be contained and offhauled to an appropriate permitted disposal facility.
On this basis, the impact of Project construction-related runoff is considered less than significant.
7.5 Waste Discharge Requirements and Water Quality Control Plans
The thresholds of significance for the Project establish that the Project would have an impact on surface or groundwater quality if it would violate any waste discharge requirements or conflict with or obstruct implementation of a water quality control plan. Waste discharge requirements for the Project are established in the Small MS4 Permit and the San Diego Phase I MS4 Permit. Water quality control plan (i.e., Basin Plan) requirements are also implemented through these two MS4 Permits.
Project BMPs include source control, LID site design, and LID treatment control BMPs in compliance with the Small MS4 Permit, San Diego Phase I MS4 Permit, and the Stormwater Standards requirements, as described in Section 5. LID treatment control BMPs will collect and retain and/or biotreat runoff from the entire developed portion of the Project. Sizing criteria contained in the MS4 Permits will be met for all LID BMPs.
In summary, the proposed source control, LID site design, and LID treatment control BMPs have been selected based on:
• Effectiveness for addressing pollutants of concern in Project runoff, resulting in insignificant water quality impacts;
• Sizing and design consistent with the Small MS4 Permit, San Diego Phase I MS4 Permit, and City of San Diego Stormwater Standards requirements; and
• Hydrologic and water quality modeling to verify performance.
On this basis, the proposed Project’s BMPs meet the Small MS4 Permit, San Diego Phase I MS4 Permit, and the Stormwater Standards requirements for redevelopment, the Project would comply with all waste discharge requirements for surface water and groundwater and would not obstruct implementation of a water quality control plan.
7.6 Hydromodification Impacts
Development typically increases impervious surfaces on formerly undeveloped (or less developed) landscapes, reducing the capture and infiltration of rainfall. The result is that, as a watershed develops, a larger percentage of rainfall becomes runoff during any given storm. In addition, runoff reaches the stream channel more efficiently due to the development of storm drain systems, so that the peak discharge rates for rainfall events and floods are higher for an equivalent event than they were prior to development. Further, the introduction of irrigation and other dry weather flows can change the seasonality of runoff reaching natural receiving waters. These changes, in turn, affect the stability and habitat of natural drainages, including the physical

SDSU Mission Valley Campus Project WQTR 90 August 2019
and biological character of these drainages. This process, called “hydromodification” (SCCWRP, 2005), is addressed in this section.
Provision F.5.g.2.d of the Small MS4 Permit indicates the stormwater treatment measures and baseline hydromodification management measures applicable to the Project. This provision does not specify explicit performance standards for hydromodification beyond stating compliance with the Site Design Measure provision (i.e., Provision F.5.g.2.c.), indicating control facilities must be designed according to the numeric sizing criteria for stormwater retention and treatment (i.e., Provision F.5g.2.b), and must be at least as effective as a bioretention system having design parameters as specified in the provision.
Generally, hydromodification impacts to receiving water bodies resulting from the Project are not anticipated because the resulting impervious area over the footprint of the Project will decrease from the existing conditions. Furthermore, impervious areas in the post-project condition will be managed through disconnecting impervious areas from the drainage network. Several hydrologic source controls will be included in the Project that will limit impervious area and disconnect imperviousness:
• Site Design. Site design will help to reduce the increase in runoff volume, including the 34-acre River Park; the additional 12 acres of parks and recreation, a 2-acre mall, and 11 acres of open space in the residential and other project areas; use of native and drought tolerate plants in landscaped areas; and the use of efficient irrigation systems in common area landscaped areas.
• LID Treatment BMPs. The Project’s LID treatment BMPs will also serve as hydromodification source control BMPs. These BMPs would provide volume reduction ranging from incidental volume reduction in biofiltration BMPs (via evaporation) and up to full volume reduction of captured water in infiltration BMPs where soil and hydrogeological conditions permit. Collectively these LID BMPs are expected to provide significant reduction in wet weather runoff and will also receive and eliminate dry weather flows.
As such, provisions for LID site design and bioretention facilities (see Section 5.3) satisfy these requirements.
Local requirements to manage hydromodification impacts to natural stream systems in San Diego County are promulgated in the Phase I MS4 Permit and implemented through the applicable BMP Design Manuals. The City of San Diego Stormwater Standards require hydromodification management measures for applicable projects except those that are exempt based on discharging to downstream channels or water bodies that are not subject to erosion, as defined in either the Phase I MS4 Permit (Provision E.3.c.(2).(d)) or the Watershed Management Area Analysis (WMAA). Section 1.6 of the Stormwater Standards indicate the specific applicability of hydromodification management requirements. Priority Development Projects (PDPs) are exempt from hydromodification management measures if the direct discharge is to an exempt area identified in the WMAA. Direct discharges to the San Diego River were granted an exemption from hydromodification controls through the approved San Diego River Water

SDSU Mission Valley Campus Project WQTR 91 August 2019
Quality Improvement Plan (City of El Cajon et al., 2016) that included WMAA analysis of the San Diego River that further supported the original exemption granted with the approved County-wide HMP (Brown and Caldwell, 2011). The WMAA and HMP provided information and technical analyses proposing and supporting the assertion that the San Diego River is stable and not experiencing adverse erosive conditions or instability due to runoff from developed areas. The exemption applies to direct discharges to the San Diego River from the confluence with San Vicente Creek at the upstream limit to the outfall at the Pacific Ocean at the downstream limit.
To qualify as a direct discharge, the following criteria must be satisfied:
(a) A properly sized energy dissipation system must be provided to mitigate outlet discharge velocity from the direct discharge to the exempt river reach for the ultimate condition peak design flow of the direct discharge, and
(b) The invert elevation of the direct discharge conveyance system (at the point of discharge to the exempt river reach) should be equal to or below the 10-year floodplain elevation. Exceptions may be made at the discretion of the City Engineer but shall never exceed the 100-year floodplain elevation. The City Engineer may require additional analysis of the potential for erosion between the outfall and the 10-year floodplain elevation.
All flows generated from the Project will discharge directly to the San Diego River through existing pipe outfalls (i.e., Outfalls A, B, C) and the existing open channel outfall at Outfall D (see Figure 5-1). These outfalls are located within the San Diego River 100-year floodway or floodplain. As such, the Project discharges are exempt from hydromodification management measures subject to the discretion of the City Engineer.
7.7 Groundwater Impacts
7.7.1 Groundwater Quality Impacts
Discharge from the Project’s developed areas to groundwater may occur in two ways: (1) through infiltration of urban runoff in the proposed LID BMPs after treatment (if unlined), and (2) infiltration of urban runoff, after treatment in the Project BMPs, in the Lower San Diego River. Groundwater quality will be fully protected through implementation of the Project’s source control, LID site design, and LID treatment control BMPs prior to discharge of Project runoff to groundwater.
Stormwater infiltration poses few significant risks to underlying aquifers, as most pollutants carried by typical urban stormwater sorb to soils, accumulating in the upper layers. Metals, pathogens, hydrocarbons, and numerous organic compounds will either: 1) sorb to soil particles, 2) volatilize at the surface, or 3) degrade by microbial processes in surface and sub-surface soil layers (LASGRWC, 2005).
The pollutant of concern with respect to groundwater is nitrate. The Basin Plan groundwater quality objective for nitrate is 10 mg/L as nitrogen. The predicted nitrate concentration in runoff

SDSU Mission Valley Campus Project WQTR 92 August 2019
after treatment in the BMPs is 0.62 mg/L as nitrogen, which is well below the groundwater quality objective. Therefore, infiltration of post-development stormwater runoff would not cause significant adverse groundwater quality impacts.
7.7.2 Groundwater Recharge Impacts
The proposed Project would cause a significant adverse impact on groundwater recharge if it substantially decreased groundwater supplies or interfered substantially with groundwater recharge such that the Project impeded sustainable groundwater management of the basin.
The Project is largely dominated by paved surface parking under existing conditions and is largely impervious. Implementation of the proposed Project would reduce the impervious surface to approximately 58% of the total Project area and would result in greater opportunity for groundwater recharge to the extent feasible. Structural LID BMPs will be lined to prevent impacts to groundwater unless it is determined in the design phase of the Project that infiltration is desirable at the specific BMP locations.
The City of San Diego conducted the Mission Valley Groundwater Feasibility Study (City of San Diego, 2018) to assess the feasibility and costs of a project to develop Mission Valley Basin groundwater as a sustainable source of supply for the City’s residents (City of San Diego, 2018). The study is part of the City’s ongoing efforts to enhance water supply reliability and sustainability through the development of local supplies. In light of this effort, municipal water supply wells and associated infrastructure may be located on the Project. The structural LID BMPs, if designed to promote infiltration in the design phase of the Project, will be sited at least 100 feet horizontally from any water supply well, as required by the San Diego Phase I MS4 Permit.
Further, although the proposed Project would alter the existing drainage of the parking lot, the intent is to more closely mimic the conditions present at the Project prior to development of the current stadium and parking lot. Stormwater runoff will discharge through the same outfalls to the San Diego River as in the existing condition, so potential recharge through the San Diego River channel will also increase.
On this basis, the Project would not cause significant adverse groundwater recharge impacts.
7.8 Cumulative Impacts
7.8.1 Cumulative Surface Water Impacts
As discussed above, the anticipated quality of effluent from the Project BMPs will not contribute concentrations of pollutants of concern that would be expected to cause or contribute to a violation of the water quality objectives for the Project’s surface receiving waters. In addition, the Project’s LID BMPs would control stormwater discharges in accordance with the Small MS4 Permit and Phase I Permit requirements for hydromodification control. Therefore, the Project’s incremental effects on surface water quality and hydromodification would be less than significant.

SDSU Mission Valley Campus Project WQTR 93 August 2019
The Project’s surface runoff water quality with implementation of BMPs during both the construction and post-construction phases, is predicted to comply with adopted regulatory requirements that are designed by the SWQCB and SDRWQCB to assure that regional development does not adversely affect water quality and hydromodification in receiving waters, including the MS4 Permits; Construction General Permit and General Dewatering Permit requirements; and benchmark Basin Plan water quality objectives, CTR criteria, and CWA 303(d) listings. Any future similar development occurring in the Lower San Diego River watershed must also comply with these regulatory requirements.
By extrapolating the results of the direct impact analysis modeling done for this WQTR, it can be presumed that analysis of other proposed development combined with existing conditions would have similar water quality results.
Therefore, cumulative impacts to surface receiving water quality and hydromodification resulting from the Project and any future development similar to the Project in the watershed are addressed through compliance with the MS4 Permits; Construction General Permit; and benchmark Basin Plan water quality objectives, CTR criteria, and CWA 303(d) listings, which are intended to be protective of beneficial uses of the receiving waters. Based on compliance with these requirements designed to protect beneficial uses, the cumulative water quality and hydromodification impacts would be less than significant.
7.8.2 Cumulative Groundwater Impacts
As discussed above, groundwater quality and recharge effects resulting from the Project would not be significant because of the reduction in impervious area and inclusion of stormwater treatment, both during construction and post-development, compared to the existing condition. By extrapolating the evaluation of direct Project groundwater impacts to existing and proposed development throughout watershed, it is concluded that no adverse cumulative effects would occur to groundwaters. Therefore, the Project’s incremental effects on groundwater quality and recharge when considered together with the effects of other projects in the area are not expected to be significant.

SDSU Mission Valley Campus Project WQTR 94 August 2019
8. CONCLUSIONS
WQTR conclusions regarding surface water quality, hydromodification, groundwater quality impacts, and groundwater recharge impacts are summarized below. The conclusions consider the Project BMPs that would be incorporated to reduce impacts to a less-than-significant level.
8.1 Surface Water Impacts
Small MS4 Permit, Phase I MS4 Permit, and Construction General Permit-compliant BMPs would be incorporated into the Project to target POCs for both the construction and post-construction phases. Project impacts associated with runoff volume, sediments, dissolved solids, nutrients, and metals were evaluated using a water quality model and impacts associated with other POCs were evaluated qualitatively based on information in technical literature.
• Runoff Volume: Average annual runoff volumes are expected to decrease with Project development due to the decrease in overall imperviousness associated with the Project, which includes parks and landscaping that do not exist in the pre-development site condition. Therefore, impacts associated with runoff volume would be less than significant.
• Sediment: Small MS4 Permit and Construction General Permit-compliant BMPs will be incorporated into the Project to address sediment in both the construction and post-development phases. Loads and concentrations of TSS are predicted to decrease with Project implementation, and therefore impacts would be less than significant.
• Total Dissolved Solids: Loads and concentrations of TDS are predicted to decrease with Project implementation due to changes in land use and the predicted decrease in runoff volume, and therefore impacts would be less than significant.
• Nutrients (Phosphorus and Nitrogen Species): Small MS4 Permit and Construction General Permit-compliant BMPs will be incorporated into the Project to address nutrients in both the construction and post-development phases. Total phosphorus and nitrogen compound (total nitrogen, nitrite, nitrate, and ammonia) loads are predicted to decrease in the Project with development. Concentrations of total phosphorus, total nitrogen, nitrite, and ammonia are predicted to decrease; the concentration of nitrate is predicted to increase slightly. The projected nutrient concentrations are projected to be well below the Basin Plan objectives. The Project would comply with the Basin Plan objective for biostimulatory substances. Therefore, nutrient impacts would be less than significant.
• Trace Metals: Small MS4 Permit and Construction General Permit-compliant BMPs will be incorporated into the Project to address metals in both the construction and post-development phases. Loads and concentrations for all metals are predicted to decrease with development and concentrations are projected to be below the CTR criteria. Therefore, metals impacts would be less than significant.
• Pathogens: Project BMPs would include source controls and LID structural controls which, in combination, should help to reduce pathogen indicator levels in post-
SDSU Mission Valley Campus Project WQTR 95 August 2019
construction stormwater runoff to the maximum extent practicable. Pathogens are not expected to occur at elevated levels during the construction-phase of the Project. On this basis, the Project’s impact on pathogens would be less than significant.
• Pesticides, Petroleum Hydrocarbons, and Toxicity: Small MS4 Permit and Construction General Permit-compliant BMPs will be incorporated into the Project to address pesticides, petroleum hydrocarbons, and toxicity in both the construction and post-development phases. Constituents in urban runoff that can cause toxicity include metals (discussed above), pesticides and PAHs. Proposed pesticide management practices, including source control, and removal with sediments in structural LID BMPs, in compliance with the requirements of the MS4 Permit, will minimize the presence of pesticides in runoff. During the construction phase of the Project, erosion and sediment control BMPs implemented per CGP requirements will prevent pesticides associated with sediment from being discharged to receiving waters. Final site stabilization will limit mobility of legacy pesticides that could be present in the existing condition. Petroleum hydrocarbon concentrations will likely be present in untreated stormwater runoff with development because of vehicular emissions and leaks. In stormwater runoff, petroleum hydrocarbons are often associated with soot particles that can combine with other sediment in the runoff. Such materials are subject to removal in the structural LID BMPs. Source control BMPs incorporated in compliance with the Small MS4 Permit and the CGP will also minimize the presence of petroleum hydrocarbons in runoff. On this basis, the impact of the Project on pesticides, petroleum hydrocarbons, and toxicity would be considered less than significant.
• Trash and Debris: Trash and debris in runoff are likely to increase in the post-development condition if left unchecked. However, the Project BMPs, including source control and structural BMPs that provide full trash capture incorporated in compliance with the MS4 Permit and statewide trash control regulations, will minimize the adverse impacts of trash and debris. During the construction phase of the Project, BMPs implemented per CGP requirements will remove trash and debris, including BMPs like catch basin inserts and general good housekeeping practices. Trash and debris are not expected to significantly impact receiving waters due to the implementation of the Project BMPs.
• Benthic Community Effects: The Project will decrease the total impervious area and increase previous area by adding LID BMPs and creating open space, parks and recreation areas. Additionally, the Project will treat stormwater runoff from the developed area in LID BMPs, while in the existing condition there is no stormwater treatment. The reduction in impervious area and treatment of Project runoff will improve water quality in stormwater runoff and in the Project’s receiving waters, thus reducing the benthic community effects from the Project. Thus, the Project will not significantly impact benthic community effects.

SDSU Mission Valley Campus Project WQTR 96 August 2019
• Dissolved Oxygen: Based on the incorporation of source control, LID site design, and LID structural BMPs pursuant to the Small MS4 Permit and the impact analysis results for nutrients and trash presented above, potential post-development impacts associated with dissolved oxygen are considered less than significant.
• Construction Impacts: Construction impacts on water quality are generally caused by soil disturbance and subsequent suspended solids discharge. These impacts will be minimized through implementation of construction BMPs that would comply with the CGP, as well as BMPs that control the other potential construction-related pollutants (e.g., petroleum hydrocarbons and metals). A SWPPP specifying BMPs for the Project that meet or exceed BAT/BCT standards will be developed as required by and in compliance with the CGP. Erosion control BMPs, including but not limited to hydro-mulch, erosion control blankets, stockpile stabilization, and other physical soil stabilization techniques will be implemented to prevent erosion. Sediment control BMPs, including but not limited to silt fencing, sedimentation ponds, and secondary containment of stockpiles will be implemented to trap sediment and prevent discharge. Non-stormwater and construction waste and materials management BMPs, such as vehicle and equipment fueling and washing BMPs, nonvisible pollutant monitoring, and BMPs to manage materials, products, solid, sanitary, concrete, hazardous, and hydrocarbon wastes will also be deployed to protect construction site runoff quality. On this basis, the construction-related impact of the Project on water quality would be less than significant.
8.2 Groundwater Impacts
• Groundwater Quality Impacts: The predicted nitrate concentration in runoff after treatment in the BMPs is well below the groundwater quality objective. Therefore, infiltration of post development stormwater runoff would not cause significant adverse groundwater quality impacts.
• Groundwater Recharge Impacts: The Project is largely dominated by a paved surface parking under existing conditions and is largely impervious. Implementation of the proposed Project would reduce the impervious surface to approximately 58% of the total Project area and would result in greater opportunity for groundwater recharge to the extent feasible. Stormwater runoff will discharge through the same outfalls to the San Diego River as in the existing condition, so potential recharge through the San Diego River channel will also increase. On this basis, the Project would not cause significant adverse groundwater recharge impacts.
8.3 Hydromodification Impacts
Generally, hydromodification impacts to receiving water bodies resulting from the Project are not anticipated because the resulting impervious area over the footprint of the Project will decrease from the existing conditions. Furthermore, impervious areas in the post-project

SDSU Mission Valley Campus Project WQTR 97 August 2019
condition will be managed through disconnecting impervious areas from the drainage network. Therefore, hydromodification impacts to the San Diego River would be less than significant.
8.4 Cumulative Impacts
As discussed above, the anticipated water quality of effluent from the Project BMPs would not contribute concentrations of pollutants of concern that would be expected to cause or contribute to a violation of the water quality objectives for the Project’s surface receiving waters. In addition, the Project’s hydromodification performance standard would control the rate, volume, and duration of stormwater discharges in accordance with the Small MS4 Permit requirements. Therefore, the Project’s incremental effects on surface water quality and hydromodification would be less than significant.
Any future similar development occurring in the Lower San Diego River watershed must also comply with the regulatory requirements stated herein. By extrapolating the results of the direct impact analysis modeling done for this WQTR, it can be presumed that analysis of other proposed development combined with existing conditions would have similar water quality results. Therefore, cumulative impacts to surface receiving water quality and hydromodification are addressed through compliance with the Small MS4 Permit, CGP, benchmark Basin Plan water quality objectives, CTR criteria, and CWA 303(d) listings, all of which are intended to be protective of beneficial uses of the receiving waters. Based on compliance with these requirements, the cumulative water quality and hydromodification impacts would be less than significant.
The Project’s discharges to groundwater with implementation of BMPs, both during construction and post-construction, are predicted to comply with adopted regulatory requirements that are designed by the SDRWQCB and SWRCB to assure that regional development does not adversely affect water quality. These requirements include the Small MS4 Permit requirements, CGP requirements, and benchmark Basin Plan groundwater quality objectives (for areas within the watershed that have designated groundwater basins in the Basin Plan, which is not the case for the Project). Based on compliance with these requirements designed to protect beneficial uses, cumulative groundwater quality impacts would be less than significant.

SDSU Mission Valley Campus Project WQTR 98 August 2019
9. REFERENCES
Anderson, B.S., B.M. Phillips, K. Siegler, J. Voorhees, 2013. Initial Trends in Chemical Contamination, Toxicity and Land Use in California Watersheds, Stream Pollution Trends Monitoring Program, Second Report, Field Years 2009-2010, March 2013.
ASCE/USEPA (American Society of Civil Engineers Urban Water Resources Research Council and United States Environmental Protection Agency), 2003, International Stormwater Best Management Practices Database.
Brown and Caldwell, 2011. Final Hydromodification Management Plan. Prepared for County of San Diego, California by Brown and Caldwell. March 2011.
California Environmental Data Exchange Network (CEDEN). Accessed March 2019 and July 2018 at http://www.ceden.org/
California Environmental Protection Agency (CalEPA), 2013. Indicators of Climate Change in California. August 2013.
Chang Consultants, 2019. Hydraulic Analysis for SDSU Mission Valley West Campus, 100% Design Development. May 9, 2019.
City of El Cajon, City of La Mesa, City of San Diego, City of Santee, County of San Diego, and Caltrans, 2016. San Diego River Watershed Management Area Water Quality Improvement Plan (WQIP). Prepared by Larry Walker Associates, AMEX, and Geosyntec Consultants. January 2016.
City of San Diego, 2015a. Draft Environmental Impact Report Stadium Reconstruction Project City of San Diego Development Services Department, San Diego, California. April 11, 2015.
City of San Diego, 2015b. Notice of Preparation: El Monte Sand Mining and Nature Preserve. September 14, 2015.
City of San Diego, 2018. Mission Valley Groundwater Feasibility Study 2018, Summary Report. Prepared by Gillingham Water and CH2M for the City of San Diego Public Utilities. August 2018.
Colford Jr., J., T. Wade, K. Schiff, C. Wright, J. Griffith, S. Sandhu, and S. Weisberg, 2005. Recreational water contact and illness in Mission Bay, California. Technical Report 449. Southern California Coastal Water Research Project. Westminster, CA. Available at: http://www.sccwrp.org:8060/pub/download/DOCUMENTS/TechnicalReports/449_mb_epi.pdf
Delgado-Moreno, L., K. Lin, R. Veiga-Nascimento, and J. Gan, 2011. Occurrence and Toxicity of Three Classes of Insecticides in Water and Sediment in Two Southern California Coastal Watersheds, Journal of Agricultural and Food Chemistry, 59, 9448-9456.

SDSU Mission Valley Campus Project WQTR 99 August 2019
Florida Department of Environmental Protection, 2001. Chemistry Laboratory Methods Manual, Calculation of Un-Ionized Ammonia in Fresh Water. February 12, 2001.
Geosyntec Consultants and Wright Water Engineers, 2017. International Stormwater Best Management Practices (BMP) Database 2016 Summary Statistics. Prepared by Geosyntec Consultants, Inc. & Wright Water Engineers, Inc. 2017.
Geosyntec Consultants, 2019a. San Diego State University Mission Valley Campus Onsite Hydrology Technical Report. Prepared for Gatzke Dillon & Balance LLP by Geosyntec Consultants. May 2019.
Geosyntec Consultants, 2019b. San Diego State University Mission Valley Campus Master Plan Project, Hazards and Hazardous Materials Technical Report. Prepared for Gatzke Dillon & Balance LLP by Geosyntec Consultants. July 2019.
Geosyntec Consultants, 2018. City of San Diego Storm Wager Standards. Prepared for the City of San Diego by Geosyntec Consultants. October 2018.
Group Delta, 2019a. Report of Environmental Investigation SDSU Mission Valley, San Diego, California. Prepared by Group Delta Consultants, Inc. for Gatzke Dillon & Ballance LLP. April 5, 2019.
Group Delta, 2019b. Report of Geotechnical Investigation Aztec Stadium SDSU Mission Valley, San Diego, California. Prepared by Group Delta Consultants, Inc. for Gatzke Dillon & Ballance LLP. April 5, 2019.Katznelson, R. and T. Mumley, 1997. Diazinon in Surface Waters in the San Francisco Bay Area: Occurrence and Potential Impact. Prepared for California State Water Resources Control Board, and Alameda County Clean Water Program.
Los Angeles and San Gabriel Rivers Watershed Council (LASGRWC), 2005. Los Angeles Basin Water Augmentation Study Phase II Final Report. August 2005.
Los Angeles County Department of Public Works (LACDPW), 2000. Los Angeles County 1994-2000 Integrated Receiving Water Impacts Report. Prepared by Los Angeles County Department of Public Works.
Metcalf and Eddy, 1979. Wastewater Engineering: Treatment Disposal Reuse. Second Edition revised by George Tchobanoglous, Professor of Civil Engineering, University of California, Davis.
Natural Resources Conservation Service (NRCS), 2013. Custom Soil Resource Report for San Diego County, California. http://websoilsurvey.sc.egov.usda.gov/App/WebSoilSurvey.aspx
National Pesticide Information Center (NPIC), 2014. Diazinon Technical Fact Sheet. Accessed online at http://npic.orst.edu/factsheets/diazinontech.pdf. Accessed on March 13, 2014.
Pierce, David W., Julie F. Kalansky, Daniel R. Cayan. 2018. Climate, Drought, and Sea Level Rise Scenarios for California’s Fourth Climate Change Assessment. August. CCCA4-CEC-2018-006.

SDSU Mission Valley Campus Project WQTR 100 August 2019
Pearson, Katherine M., Sarah Sikich, Marissa Maggio, Sarah Diringer, Mar Abramson, and Mark Gold, 2013. Impact of Development on Aquatic Benthic Macroinvertebrate Communities in the Santa Monica Mountains of Southern California.
Ribes, Sandra, B. Van Drooge, J. Dachs, O. Gustafsson, and J.O. Grimalt, 2003. Influence of Soot Carbon on the Soil-Air Partitioning of Polycyclic Aromatic Hydrocarbons, Environmental Science & Technology 37, 2675-2680.
Rick Engineering, 2019a. Green Streets Elements for SDSU Mission Valley Campus Adjacent Improvements – PDP Exempt. Letter addressed to City of San Diego from Rick Engineering Company. February 12, 2019.
Rick Engineering, 2019b. Drainage Study for SDSU Mission Valley Campus (Onsite Improvements) (Preliminary Engineering/Design Development). Prepared for San Diego State University c/o Gatzke Dillon & Ballance LLP. February 12, 2019.
Rick Engineering, 2019c. Water Quality Report for SDSU Mission Valley Campus (Onsite Improvements) (Preliminary Engineering/Design Development). Prepared for San Diego State University c/o Gatzke Dillon & Ballance LLP. February 12, 2019.
Ruby. A, 2013. Review of Pyrethroid and Fipronil Monitoring Data from California Urban Watersheds. Prepared for the California Stormwater Quality Association (CASQA).
San Diego County, 2017. San Diego Region Functionally Equivalent Storm Water Resource Plan. Prepared for San Diego Region Copermittees by County of San Diego Department of Public Works. June 2017.
San Diego, 2050 is Calling. How will we answer? Facing the Future: How Science Can Help Prepare San Diego Regional Leaders for Climate Change.
San Diego Regional Water Quality Control Board (SDRWQCB), 1994. Water Quality Control Plan San Diego Region (as amended).
San Diego River Park Foundation, 2018. Heightened Media Attention on Encampments along River. Written by Rob Hutsel, President and CEO. Accessed here (5/16/2019): https://sandiegoriver.org/news.html.
San Francisco Estuary Project (SFEP), 2005. Pesticides in Urban Surface Water, Urban Pesticide Use Trends Annual Report 2005, prepared by TDC Environmental, March.
Southern California Coastal Water Research Project (SCCWRP), 2005. Effect of Increases in Peak Flows and Imperviousness on the Morphology of Southern California Streams. Technical Report 450. April 2005.
State Water Resources Control Board, 2015. Amendment to The Water Quality Control Plan for Ocean Waters of California To Control Trash and Part 1 Trash Provisions of The Water Quality Control Plan for Inland Surface Waters, Enclosed Bays, And Estuaries of California. Resolution 2019-0019. 7 April 2015.

SDSU Mission Valley Campus Project WQTR 101 August 2019
Stein, Eric, LL Tiefenthaler, K Schiff, 2006. Watershed-based Sources of Polycyclic Aromatic Hydrocarbons in Urban Stormwater. Southern California Coastal Water Research Project 2005-06 Biennial Report. pp. 33-50 in: S.B. Weisberg and K. Miller (eds.), Southern California Coastal Water Research Project. Westminster, CA.
Thomas, Nancy, Shruti Mukhtyar, Brian Galey, and Maggi Kelly, 2018. Cal-Adapt: Linking Climate Science with Energy Sector Resilience and Practitioner Need. A Report for California’s Fourth Climate Change Assessment. August. CCCA4-CEC-2018-015.
United States Environmental Protection Agency (USEPA), 2007. Aquatic Life Ambient Freshwater Quality Criteria - Copper. U.S. Environmental Protection Agency, Office of Water.
USEPA, 2012. Recreational Water Quality Criteria. Office of Water
USEPA, 2000. Water Quality Standards Establishment of Numeric Criteria for Priority Toxic Pollutants for the State of California Rule. May 18.

SDSU Mission Valley Campus Project WQTR August 2019
FIGURES

#*#*
#*
#*#*
#*#*Quivira Basin
Famosa Slough and Channel
San Diego Bay
Mission Bay 303(d) Listed
Shorelines and Bays
UV209
UV15
UV15
UV274
UV274
UV209
UV274
UV163
§̈¦8
§̈¦15
§̈¦805
§̈¦5
AB
C
DE
F
San Diego, California
Project Vicinity,Receiving Waters, andGroundwater Basins
Figure2-1SW0311 August 2019
LegendProject Boundary303(d) Listed Water Body
CA Bulletin 118 Groundwater BasinsMission Valley (9-014)Coastal Plain of San Diego (9-033)
#* Surface Water Monitoring Station#*
Fashion Valley Rain Gauge303(d) Listed Stream, Shoreline, or BayOther StreamHighwayMajor Road
0 0.75 1.5Miles ³
Main View Extents
C A L I F O R N I AC A L I F O R N I A Rose Creek
Teco lote Creek
San Die go River
Murphy CanyonCreek
San D
iego R
iver
Alvarado Creek
Pa
cifi
c O
cea
nP
aci
fic
Oce
an
Label Surface Water Monitoring StationA San Diego River 15B Fashion Valley RoadC Lower San Diego River at Camino del EsteD San Diego River at Ward RoadE San Diego River TWAS 1F Murphy Canyon Creek SMC01990

UV15
§̈¦15
§̈¦8San Diego, California
Project Modeled Land Use
Figure2-2
SW0311 August 2019
LegendProject BoundaryStream
Modeled Land UseCommercialEducation (Municipal)Multi-Family ResidentialOpen Space
0 450 900Feet ³
San Diego River
Murph
yCan
yon C
reek
River Park Road (Proposed)
Miss
ionVil
lage D
r

UV15
§̈¦15§̈¦8
UV15
§̈¦15
§̈¦8San Diego, California
Project Hydrologic Soil Groups
Figure2-3
SW0311 August 2019
LegendProject BoundaryLID BMP Drainage Area *
Hydrologic Soil Group (HSG)ACD
NRCS Map Units without HSG RatingMade Land **Gravel PitsTerrace Escarpments
0 450 900Feet ³
*See Figure 5-1 for more detail on LID BMPDrainage Areas**Artificial fill
San Diego River
Murph
yCan
yon C
reek
River Park Road (Proposed)
Miss
ionVil
lage D
r

!(!(
!(!(
§̈¦15
§̈¦15
DMA 1C
DMA 1B
DMA 2
DMA 1A
DMA 3DMA 4
DMA 5C
DMA 5B
DMA 5A
BMP 5
BMP 1C
BMP 1B
BMP 4
BMP 2
BMP 3
BMP1A
DA
B C
San Diego, California
LID BMP Drainage Areas
Figure5-1
SW0311 August 2019
LegendProject BoundaryModeled Land Use BoundaryLID BMP Drainage AreaLID BMP Footprint
!( Outfalls
0 350 700Feet ³San Diego River
Murph
y Can
yonC
reekRiver Park Road (Proposed)
Miss
io nVil
l ageD
r

Overflow Structure
Parking Lot Sheet Flow
Curb Stops
Outlet
Raised Underdrain Collection System
Stone Diaphragm
Grass Filter Strip
Inlet
Catch Basin(Pre-treatment and Energy Dissipation)
Plan View
Profile
Conceptual Illustration of a Biofiltration Facility with Partial Retention
Graded Aggregate Filter/Choking Layer
Curb StopStone Diaphragm
BiofiltrationSoil Media
Overflow Structure
Mulch Layer
Storage Below Underdrain
Raised Underdrain
SDSU Mission Valley Water Quality Technical Report
Figure
Oakland5-2
August 2019

Conceptual Illustration of Lined Biofiltration (Planter Box)
Profile
Surrounding Soil
Gravel Reservoir
Amended Soil
Impermeable Concrete Barrier or Geomembrane Liner
Sidewalk, roadway, or parking lot
Overflow Structure
Underdrain
Energy Dissipation
SDSU Mission Valley Water Quality Technical Report
Figure
Oakland5-3
August 2019

SDSU Mission Valley Campus Project WQTR
APPENDIX A Water Quality Modeling Parameters and
Methodology

SDSU Mission Valley Campus Project WQTR A-i August 2019
TABLE OF CONTENTS
APPENDIX A. Water Quality Modeling Methodology and Parameters .................................... 1
A.1. Model Description ............................................................................................................ 1 A.1.1. Model Overview ....................................................................................................... 1 A.1.2. Technical Basis for Modeling Methodology ............................................................ 2 A.1.3. Model Assumptions .................................................................................................. 4
A.2. Model Input Parameters ................................................................................................... 4 A.2.1. Storm Events ............................................................................................................. 5 A.2.2. Runoff Coefficients ................................................................................................... 6 A.2.3. Land Use ................................................................................................................. 12 A.2.4. Stormwater Runoff Pollutant Concentrations ......................................................... 13 A.2.5. Treatment Assumptions and Estimate of Treatment BMP Performance Parameters 24 A.2.6. Model Parameter Reliability & Assumptions ......................................................... 29
A.3. Model Methodology ....................................................................................................... 31 A.3.1. Storms & Stormwater Runoff (Steps 1 & 2) ........................................................... 32 A.3.2. Pollutant Loads & Concentrations (step 3 & 4) ...................................................... 34 A.3.3. Annual Pollutant Loads, Concentrations, and Distributions (steps 5, 6, & 7) ........ 36 A.3.4. Model Methodology Assumptions .......................................................................... 37
A.4. Model Reliability ............................................................................................................ 39 A.5. References ...................................................................................................................... 40

SDSU Mission Valley Campus Project WQTR A-1 August 2019
APPENDIX A. WATER QUALITY MODELING METHODOLOGY AND PARAMETERS
A.1. Model Description
A.1.1. Model Overview
The model used to assess stormwater quality impacts associated with the San Diego State University (SDSU) Mission Valley Campus Project (Project) is an empirical, volume-based pollutant loads model. This type of loadings model is generally applicable in the planning and evaluation stages of a project. The model was developed to assess the potential impact of development on water quality and to evaluate the effectiveness of the structural Best Management Practices (BMPs) that will treat stormwater runoff as part of the Project’s stormwater treatment system. Two Project conditions were evaluated with the water quality model:
1. Pre-development; and 2. Post-development with BMPs.
Measured runoff volumes and water quality characteristics of stormwater are highly variable. To account for this variability, a statistical modeling approach was used to estimate the volume of stormwater, the concentration of pollutants in stormwater, and the overall pollutant load (total mass of pollutants) in stormwater runoff. A statistical description of stormwater provides an indication of the average characteristics and variability of the water quality parameters of stormwater, and the probability of compliance with regulatory criteria. It does not forecast runoff characteristics or regulatory compliance for specific storms or monitoring periods. The statistical model is based on relatively simple expressions describing rainfall/runoff relationships and estimated concentrations in stormwater runoff. The volume of stormwater runoff is estimated using a modification to the Rational Formula, an empirical expression that relates runoff volume to the rainfall depth and the broad basin characteristics. The pollutant concentration in stormwater runoff is represented by an expected average pollutant concentration, called the event mean concentration (EMC). EMCs are estimated from available monitoring data from land use-specific monitoring stations and are considered to be dependent on land use type. The model does not incorporate the detailed hydraulics or hydrology of the site, which would be more appropriate for design stages and requires additional data and more sophisticated modeling. The model includes water quality benefits achieved by treatment control and low impact development (LID) BMPs, but not source control BMPs, because data is generally not available or is inconclusive for the latter. Model results are presented for average annual runoff volumes, pollutant loads, and pollutant concentrations.

SDSU Mission Valley Campus Project WQTR A-2 August 2019
As with all environmental modeling, the precision of results is dependent on how well the hydrologic, water quality, and BMP effectiveness data describe the actual site characteristics. Local and regional data used to the fullest extent possible, helps to minimize errors in predictions. Model results are presented for average annual runoff volumes, pollutant loads, and pollutant concentrations. The flow chart in Figure A-1 provides an overview of the modeling methodology.
A.1.2. Technical Basis for Modeling Methodology
A variety of modeling approaches are capable of meeting the technical requirements of this analysis. In general, models can be grouped into three categories:
Stochastic (or probabilistic): This type of model utilizes observed statistical patterns to produce model estimates. This type of model generally relies on empirical observations, but does not necessarily ignore causal relationships.
Deterministic (or mechanistic, physically-based): This type of model attempts to perfectly represent physical processes and mechanisms using closed form equations derived from physical phenomena. It is noted that because these models attempt to describe systems that are inherently complex and poorly defined, most deterministic models must rely in part on empirical observations to represent causal relationships.
Hybrid: This type of model combines elements of stochastic and deterministic models to provide more reliable model estimates.
The modeling methodology used for the Project incorporates stochastic and empirical elements, and is therefore most accurately described as a hybrid approach. The approach uses an empirical, stochastic water quality estimation approach (Monte Carlo) to produce water quality and pollutant loading estimates. Inputs to this model are derived from empirical sources (Los Angeles County Land Use Monitoring Program) and deterministic modeling of hydrology and hydraulics (EPA SWMM 4.4h). This approach makes use of robust land use and BMP monitoring datasets applicable to the Project and incorporates important causal relationships in hydrologic and hydraulic response that can be reliably represented with deterministic methods. This approach is believed to be most appropriate to meet the technical requirements of the impact analysis for the Project-level analysis.

SDSU Mission Valley Campus Project WQTR A-3 August 2019
Figure A-1 Overview of Water Quality Analysis Methodology
Prim
ary
Dat
a Development Plans, Drainage Areas, and Infiltration
Constraints (Soils Analysis, Shallow Groundwater)
Hourly long-term rainfall record
Regulatory requirements and
guidance (San Diego County MS4 Permit)
Site data (CIMIS ET, NRSC Soil
survey)
EMC Database
Inte
rmed
iate
Ana
lysi
s and
Sy
nthe
sis o
f Inp
uts
GIS data analysis and extraction
SWMM inputs Project areas and topography
Drainage boundary delineations Land uses and % impervious
Soils and infiltration rates Evaporation rates
BMP types, locations, and design criteria
Data Analysis Adjust for non-detect and
detection limit changes and develop descriptive statistics
using: a. Plotting position method
b. Bootstrap method
Project-Specific SWMM continuous simulation model
Proc
esse
d In
puts
Project water quality facilities, drainage areas, and land uses
Runoff coefficients for drainage area
impervious and pervious areas by
storm event
Storm event volumes
(as a statistical
distribution)
BMP capture
efficiency by storm
event
BMP volume
reduction by storm
event
EMC by land use (as statistical distributions)
Mod
el
Monte Carlo Water Quality Model
Res
ults
Water quality results as annual mean runoff volumes, loads, and concentrations for pre-and post-development conditions
Green = Data Set
Yellow = Model/Analysis

SDSU Mission Valley Campus Project WQTR A-4 August 2019
The literature studies summarized below generally support the use of an empirically-based hybrid approach for the type of analysis required for the Project:
Obropta et al. (2007) evaluated six deterministic models, three stochastic models, and three hybrid approaches. They concluded that hybrid approaches show strong potential for reducing stormwater quality model prediction error and uncertainty [improving the ability to assess] best management practice design, land use change impact assessment [and other applications].
Charbeneau and Barrett (1998) evaluated different approaches for estimating stormwater pollutant loads based on a comparison of model results to observed land use monitoring data. They found that (1) the development of accurate physically-based models remains a difficult and elusive goal, and current understanding of processes is not sufficient to accurately predict event loads, (2) a simple empirical stochastic approach is generally as reliable or more reliable than more complicated mechanistic approaches, (3) the use of land use event mean concentrations (EMCs) is appropriate for planning purposes, (4) the land use EMC approach is most reliable when land use EMCs are used as a stochastic input parameter generated from a probabilistic distribution, and (5) stormwater volume is the single most important variable in predicting pollutant loads.
The National Research Council’s (NRC) 2008 report on Urban Stormwater Management in the United States generally supports these findings regarding the appropriate use of stormwater quality and quantity models.
As with all environmental modeling, the precision of results is heavily dependent on how well the hydrologic, water quality and BMP effectiveness data describe the actual site characteristics. Local and regional data are used to the fullest extent possible to help minimize errors in predictions, but such data are limited and traditional calibration and verification of the model is not feasible. It is important to note that the predictions of relative differences should be more accurate than absolute values.
A.1.3. Model Assumptions
The water quality modeling methodology requires that some assumptions be made for both the model input parameters and the way the modeling calculations are carried out. Section A.2.6 discusses the assumptions that were made in the development of the model parameters and Section A.3.4 discusses the assumptions inherent in the modeling methodology. Section A.4 discusses the effects of the modeling assumptions on model accuracy.
A.2. Model Input Parameters
Many parameters that can affect pollutant loads and concentrations vary spatially and may not be adequately represented by stormwater monitoring data collected at discrete locations. Examples include source concentrations, topography, soil type, and rainfall characteristics, all of which can

SDSU Mission Valley Campus Project WQTR A-5 August 2019
influence the buildup and mobilization of pollutants. The following model parameters have been selected based on a review of available data to represent the existing and developed Project conditions in the water quality model.
A.2.1. Storm Events
A.2.1.1. Rainfall Gauge Selection
An evaluation of the hourly precipitation records was available through the San Diego County Project Clean Water. The Fashion Valley ALERT Station (Station No. 27018, Sensor ID 32) contains hourly precipitation data over a 40-year period of record (January 1968 through May 2008) and is located in San Diego County, CA. Figure A-2 shows the location of the Fashion Valley ALERT gauge in relation to the Project, located approximately 3.4 miles away. The gauge elevation of 20 feet above mean sea level (AMSL) is comparable to the Project elevations of approximately 50-80 ft AMSL, and the gauge location is assumed to have similar rainfall patterns as the Project due to its proximity to the coastline. The average annual rainfall depth for the Fashion Valley ALERT rain gauge is approximately 10.4 inches.
Figure A-2: Location of Fashion Valley ALERT Rainfall Gage in the Project Vicinity
Rainfall analysis was conducted for two data groups: all storm events; and only the storms that were expected to contribute to stormwater runoff (storms >0.1 inches). The rainfall data were analyzed using a code similar in performance to EPA’s Synoptic Rainfall Analysis Program

SDSU Mission Valley Campus Project WQTR A-6 August 2019
(SYNOP). The customized code (GeoSYNOP) facilitates resolving missing periods of data and is more robust when handling the date and time of storms. GeoSYNOP subdivides the rainfall record into discrete events separated by an inter-event dry period, which in this case was set to a minimum of 6 hours. Small rainfall events, which resulted in rainfall of less than or equal to 0.10 inches, were deleted from the record as such events tend to produce little if any runoff (USEPA, 1989; Schueler, 1987). Storm statistics for the full (all storms) and the trimmed (storms >0.1 inch) data sets are shown in Table A-1.
Table A-1: Precipitation Record Summary by Water Year
Storms Statistic Fashion Valley ALERT Gauge
All Storms
Average annual rainfall (in): 10.37
Total number of storms: 1455
Average number of storms per year1: 36.4
Average storm volume (in): 0.28
Average storm duration (hrs): 6.52
Average storm intensity (in/hr): 0.05
Storms >0.1 inch
Average annual rainfall (in): 9.59
Total number of storms: 726
Average number of storms per year1: 18.2
Average storm volume (in): 0.53
Average storm duration (hrs): 11.08
Average storm intensity (in/hr): 0.06 1 Defined using an inter-event time of 6 hours and obtained using GeoSYNOP analyses described in Section A.2.1.1.
A.2.2. Runoff Coefficients
The long term runoff coefficient (i.e. the fraction of precipitation that runs off as stormwater) is dependent on a number of factors, the most significant being catchment imperviousness. However, for pervious areas, soil characteristics, watershed slope, precipitation patterns, evapotranspiration rates and a variety of other factors also influence runoff coefficient. Runoff coefficients are expected to vary from storm event to storm event as a function of antecedent conditions, storm intensity distribution, storm duration, and storm depth. The following describes how runoff coefficients were estimated for use in the water quality model.
A.2.2.1. SWMM Runoff Coefficient Modeling Parameters
The water quality model uses a modification of the Rational Method, consistent with the San Diego County Hydrology Manual, to estimate a runoff coefficient for sub-basins as a function of the percent impervious for a given storm event. The format of this equation is described as:
C = Ci * i + Cp * (1-i)

SDSU Mission Valley Campus Project WQTR A-7 August 2019
Where: C = composite runoff coefficient Ci = runoff coefficient from impervious areas Cp = runoff coefficient from pervious areas i = imperviousness fraction (ranges from 0 to 1)
Various references provide estimated values for Ci and Cp. The San Diego County Hydrology Manual specifies Ci as 0.90 and bases the determination of Cp on underlying soil type and land use. However, because the pervious and impervious runoff coefficients that make up the runoff coefficient equation are dependent on many site-specific parameters, the runoff coefficient equation used in modeling was estimated using information specific to the Project. It is recognized that Cp for smaller storms may be zero, while for larger storms it may greatly exceed the long-term average. Thus, the water quality model was developed based on estimates of the Project pervious area runoff coefficients on a storm-by-storm basis, using a robust method that accounts for more detailed hydrologic processes and antecedent conditions. This method considered the range of conditions that occur and could occur within the Project and selected appropriately conservative values to account for uncertainty. Continuous simulation modeling, using the Storm Water Management Model (SWMM), was conducted for the Project to generate appropriate storm-by-storm pervious and impervious runoff coefficients to use in the runoff coefficient equation for each storm event. A modified version of SWMM 4.4h was used that segregates continuous precipitation records (discussed above) into storm events, tracks the fate of precipitation to losses (i.e. infiltration, evapotranspiration) and runoff for each storm, and tabulates runoff coefficients by storm event. Assumed flow path lengths were changed between undeveloped areas (areas where no development is expected in the proposed condition and no treatment is required) and post-construction conditions for areas proposed for development. The undeveloped areas retained the same parameters in the existing and developed model conditions. For areas proposed for development, flow path length and hydraulic conductivity were changed from the existing non-developed condition model to the proposed developed condition to reflect changes (i.e. soil compaction, etc.) due to development1. The majority of the SWMM modeling parameters assumed for this analysis are shown in Table A-2.
1 Existing development areas in the existing condition are represented in the model with reduced hydraulic conductivities in both the existing and proposed conditions to reflect compaction from the natural condition that may have occurred.

SDSU Mission Valley Campus Project WQTR A-8 August 2019
Table A-2: SWMM Version 4.4h Runoff Module Parameters
Parameter Unit Value Source/Rationale
Routing Method -- Kinematic Wave --
Reporting Time Step Minutes 60 --
Dry Weather Time Step Minutes 240 --
Wet Weather Time Step Minutes 15 --
Routing Time Step Seconds 60 --
Flow Path Length Feet
250 (Existing developed condition; Proposed developed condition; Development footprint)
Represents typical overland flow path lengths, not a very sensitive parameter
Slope % 5 Approximate average slopes based on review of topography
Manning’s N, Impervious -- 0.012 Best professional judgment
Manning’s N, Pervious -- 0.25 Median value for vegetated cover (James, 2002)
Depression Storage, Impervious Inches 0.02 Estimated value for graveled surface
(James, 2002) Depression Storage, Pervious Inches 0.06 Best professional judgment.
Infiltration in/hr 0.0375 Compacted HSG D soil
Groundwater - Not simulated --
Snowmelt - Not simulated --
A unit analysis was performed to determine pervious runoff coefficients for the areas within the Project. All the land uses in both the existing condition and proposed condition models are developed land with HSG D soils. Using a post-processing engine, SWMM output file runoff results were weighted by development type (i.e., HSG) area distribution and combined to obtain a composite pervious area runoff coefficient for the development areas for each storm event. The soils distributions assumed for this modeling effort are shown in Table A-3. Table A-3: Soils Distribution by Development Area Type
Development Area Type Existing Conditions Proposed
Conditions Percent HSG D
Undeveloped Area 0% 0% 100%
Developed Area 100% 100% 100%
Soils in the Project area will exhibit a range of infiltrative capacity, depending on soil type and condition. Soil type or group can be used to estimate a typical range in soil parameters, such as the

SDSU Mission Valley Campus Project WQTR A-9 August 2019
Green-Ampt parameters, while soil condition (undeveloped or developed) may be used to select the most appropriate parameters within the range. Hydrologic soil groups (HSG) and soil texture classes provided in the Soil Survey were used to characterize soils in the Project in Table A-3 above and assign typical ranges of soil parameters to these soil groups. Green-Ampt suction head, saturated hydraulic conductivities and initial moisture deficit values for the Project area HSG are provided in Table A-4. It has been assumed that compaction caused by construction tends to reduce the hydraulic conductivity by 25% in the post-development condition in areas where construction is planned and that a 25% reduction in the pre-development condition exists where there has already been development. Since the existing conditions of the Project are entirely developed, the result of these assumptions is that the soil condition is unchanged by the proposed project development. While localized effects of incidental compaction may be greater, this assumption is believed to represent a reasonable estimate of drainage basin-wide reduction in long term infiltration rate considering that not all pervious areas will be subjected to incidental compaction. Additionally, vegetation and other natural process tend to restore infiltration rates with time. Table A-4: Green-Ampt Soil Parameters
Hydrologic Soil Group Suction Head1
(in)
Saturated Soil Conductivity (in/hr) IMD1 (in/in) Undeveloped
Condition Developed Condition2
D 12 0.05 0.0375 0.05 1 Estimated based on texture class and HSG from Rawls, et al., (1983). 2 Determined based on an assumption of 25% reduction of conductivity due to compaction. Reference ET values for estimating actual ET rates was taken from Figure A-3, produced by the California Department of Water Resources. The Project is located in Zone 4. Reference ET values for Zone 4 are reproduced in Table A-5.

SDSU Mission Valley Campus Project WQTR A-10 August 2019
Figure A-3: Reference ET for CA Zones
A scaling factor of 0.60 was applied to the reference ET values to represent semi-arid vegetation, dry crops and bare soil that are typical of the Project area. This scaling factor can also be used to

SDSU Mission Valley Campus Project WQTR A-11 August 2019
simulate the landscaped areas in the post-development condition, which will generally be planted with predominantly drought-tolerant vegetation. Table A-5: Evaporation Parameters for Hydrology Model (from CA ETo map)
Month Evapotranspiration Rates
inch / month 60% inch / month
January 1.86 1.12 February 2.24 1.34 March 3.41 2.05 April 4.50 2.70 May 5.27 3.16 June 5.70 3.42 July 5.89 3.53 August 5.58 3.35 September 4.50 2.70 October 3.41 2.05 November 2.40 1.44 December 1.86 1.12
Total (year) 46.62 27.97
SWMM Runoff Coefficient Results
Using the SWMM inputs and methodology explained above, pervious and impervious runoff coefficients for each storm event were developed. The long-term average runoff coefficients estimated for each drainage area type are shown in Table A-6 for comparison purposes only. Event-by-event runoff coefficients were used for the Monte Carlo statistical model.

SDSU Mission Valley Campus Project WQTR A-12 August 2019
Table A-6: SWMM Runoff Coefficients for Watershed Areas
Development Category
Impervious Runoff Coefficient Pervious Runoff Coefficient
San Diego County
Hydrology Manual1
Model Methodology
San Diego County
Hydrology Manual1
Model Methodology
Existing Proposed
Developed Area 90 93 352 25 25 1 Included for comparison purposes; only includes storms that would produce runoff, i.e. those >0.1-inch. 2 Value represents runoff coefficients for permanent open space (HSG D = 35). As is evident from Table A-6, the average runoff coefficients for impervious areas calculated used in the model are similar to the runoff coefficient calculated using the San Diego County Hydrology Manual method. The pervious runoff calculations estimated using the model methodology for the undeveloped area (existing and proposed) are lower than the runoff coefficients reported to open space in the San Diego County Hydrology Manual. However, the open space coefficients reported in the hydrology manual are representative of “Rural” land uses with a reduction of 0.10 to account for pervious areas (Hill, 2002). A more representative comparison for the pervious area runoff coefficients is for “Heavy soil lawn, 2-7 percent slope”, which has a runoff coefficient range of 0.18-0.22 (Hill, 2002).
A.2.3. Land Use
The delineation of land uses and areas within the Project were determined from land use summarized in the Project area (Rick Engineering, 2019a) and subsequent GIS analysis for the developed Project condition. An additional 31 acres of Transportation land use was added to the area from the Project to account for improvements to adjacent roadways and vehicular circulation (Rick Engineering, 2019b). The existing condition land use consists of stadium, parking lots, and roadways (Rick Engineering, 2019a). Existing and developed areas and land use representations for the Project are summarized in Table A-7. The modeled land uses were based on the most representative land use within the available data sets (see Section A.2.4). Table A-7: Modeled Land Uses and Percent Imperviousness
Land Use Description Area (Acres) Imperviousness EMC Model Land Use
Existing Land Uses
On-site Stadium & Parking 169.3 90% Commercial
Off-site Roadway 31.2 65% Transportation Total 200.5 86%
Proposed Land Uses
Campus and Stadium 47.4 80% Commercial

SDSU Mission Valley Campus Project WQTR A-13 August 2019
Land Use Description Area (Acres) Imperviousness EMC Model Land Use
Neighborhood and Residential 41.8 78% Multi-Family Residential
Passive Parks and Open Space 27.3 30% Open Space
Active Parks and Recreation Areas 52.8 34% Educational Campus and Parks
Off-site Green Street Roadway Improvements 31.2 65% Transportation
Total 200.5 58%
A.2.4. Stormwater Runoff Pollutant Concentrations
Stormwater monitoring data included water quality monitoring data collected by the San Diego Municipal Stormwater Permit co-permittees. The average statistics of these monitored results were used in the model where available. Where no San Diego County-specific EMC data were available, stormwater monitoring data collected by the Los Angeles Department of Public Works (LACDPW) was used to derive estimates of pollutant concentrations.
A.2.4.1. Los Angeles County Monitoring Data
Recent and regional land-use based stormwater quality monitoring data was collected through the LA County Stormwater Monitoring Program. This program was initiated with the goal of providing technical data and information to support effective watershed stormwater quality management programs in Los Angeles County. Specific objectives of this project included monitoring and assessing pollutant concentrations from specific land uses and watershed areas. In order to achieve this objective, the County undertook an extensive stormwater sampling project that included 8 land use stations and 5 mass emission stations (located at the mouths of major streams and rivers), which were tested for 82 water quality constituents. These data are presented in Los Angeles County 1994-2000 Integrated Receiving Water Impacts Report, 2000 and Los Angeles County 2000-2001 Stormwater Monitoring Report, 2001. Stormwater quality for the Project was estimated based on the recent EMC data collected by LA County (LA County, 2000 and 2001). These data were used because of their relative proximity to the Project location and because the monitored land uses provide a relatively good representation of the proposed land uses for the Project. The monitored land uses stations are listed in Table A-8 with a brief description of the site and when the monitoring data were collected.

SDSU Mission Valley Campus Project WQTR A-14 August 2019
Table A-8: LA County Land Use Monitoring Stations Available for Water Quality Modeling
Station Name
# Modeled Land Use
Site Description1 Years
Monitoring Conducted
Santa Monica Pier S08 Commercial
The monitoring site is located near intersection of Appian Way and Moss Avenue in Santa Monica. The storm drain discharges below the Santa Monica Pier. The drainage area is approximately 81 acres. The Santa Monica Mall and Third St. Promenade dominate the watershed with remaining land uses consisting of office buildings, small shops, restaurants, hotels and high-density apartments.
1995-1999
Sawpit Creek S11 Open Space (& Parks)
Located in the Los Angeles River watershed in City of Monrovia. The monitoring station is Sawpit Creek, downstream of Monrovia Creek. Sawpit Creek is a natural watercourse at this location. The drainage area is approximately 3300 acres.
1995-2001
Project 620 S18 Single Family Residential
Located in the Los Angeles River watershed in the City of Glendale. The monitoring station is at the intersection of Glenwood Road and Cleveland Avenue. Land use is predominantly high-density, single-family residential. The drainage area is approximately 120 acres.
1995-2001
Project 1202 S24 Light Industrial
Located in the Dominguez Channel/Los Angeles Harbor Watershed in the City of Carson. The monitoring station is near the intersection of Wilmington Avenue and 220th Street. The overall watershed land use is predominantly industrial.
1995-2001
Dominguez Channel S23
Freeway (Roadways)
Located within the Dominguez Channel/Los Angeles Harbor watershed in Lennox, near LAX. The monitoring station is near the intersection of 116th Street and Isis Avenue. Land use is predominantly transportation and includes areas of LAX and Interstate 105.
1995-2001
Project 474 S25 Education (Schools)
Located in the Los Angeles River watershed in the Northridge section of the City of Los Angeles. The monitoring station is located along Lindley Avenue, one block south of Nordoff Street. The station monitors runoff from the California State University of Northridge. The drainage area is approximately 262 acres.
1997-2001
Project 404 S26 Multi-Family Residential
Located in Los Angeles River watershed in the City of Arcadia. The monitoring station is located along Duarte Road, between Holly Ave and La Cadena Ave. The drainage area is approximately 214 acres.
1997-2001
1 Los Angeles County 1999-2000 Draft Stormwater Monitoring Report (Los Angeles County, 2000).
SDSU Mission Valley Campus Project WQTR A-15 August 2019
A.2.4.2. Data Analysis for Derivation of Land Use EMCs
The Los Angeles County Department of Public Works (LACDPW) monitored stormwater runoff quality from various land uses throughout the County on an annual basis beginning in 1995 through 2001. For each year of monitoring several storm event mean concentrations (EMCs) were reported and included in the County’s annual water quality report to the Los Angeles Regional Water Quality Control Board. The convention for dealing with the censored data (e.g., data only known to be below the analytical detection limit) is to substitute half of the detection limit (DL) for all non-detects (ND). L.A. County has followed this convention when providing summary arithmetic statistics of the stormwater monitoring data. This method tends to introduce bias into the estimate of the mean and standard deviation and the summary statistics are not believed to be robust or adequately account for non-detects. To further complicate matters, the detection limit for dissolved copper and total lead has changed during the period stormwater monitoring was conducted by LACDPW.
In an effort to provide more reliable and accurate estimates of land use EMCs for the Project water quality modeling, a robust method of estimating descriptive statistics for censored data with multiple detection limits was employed. The plotting position method described in Helsel and Cohn (1988) was used to estimate censored values using the distribution of uncensored values. Descriptive statistics were then estimated using the parametric bootstrap method suggested by Singh, Singh, and Engelhardt (1997). The final land use EMC input parameters developed for the Monte Carlo water quality model include the log-normal mean and log-normal standard deviation. Analyses demonstrate that nearly all of the Los Angeles County land use data sets can be more closely represented by the log-normal distribution than the normal distribution2, which is consistent with findings by Pitt et al. (2004) based on analyses of the NSQD. Table A-10 summarizes the number of data points and the percent non-detects for the pollutants and land uses of interest that have sufficient data available for modeling based on the Los Angeles County data set. While data may be available to develop descriptive statistics for other pollutants (e.g., organics, other metal constituents, trash), reliable land use EMCs statistics could not be computed due to statistically insufficient number of detected results or due to the use sampling techniques not amenable to estimating representative EMCs (e.g., catch basin clean-outs in the case of trash). Also, the availability of BMP effluent quality data similarly limits the number of pollutants that can be effectively modeled; i.e., other pollutants (e.g., organics, other metal constituents) may have land use EMC data available but not BMP effluent data.
A.2.4.3. Example Data Set
To illustrate the statistical methods used to obtain land use EMCs, the LACDPW stormwater monitoring data collected for total lead from the transportation land use station is used. The data 2 Statistical distribution test results reported by Los Angeles County also confirm this assessment, as summarized by Table 4-14 found at http://LACDPW.org/wmd/npdes/Int_report/Tables/Table_4-14.pdf.

SDSU Mission Valley Campus Project WQTR A-16 August 2019
were collected from January 1996 to April 2001. At the beginning of March 1997, the detection limit for total lead changed from 10 to 5 μg/L. Table A-9 describes the data according to the number of censored and uncensored values in the example data set.
Table A-9: Number of Censored and Uncensored Data Points in the Total Lead Transportation Land Use Data Set
Total Lead EMC Data for Transportation Land Use
Uncensored 37 Censored < 10 μg/L 2 Censored < 5 μg/L 38 Total Data Count 77
Prior to applying the plotting position method, it is necessary to check the normality of the data. Figure A-4 shows histograms and probability plots of the transportation land use total lead data above detection limits in normal and lognormal space. As indicated in the figure, the data tends to follow a lognormal distribution, a finding that is common with many pollutants in stormwater. To verify the visual check that the data are lognormally distributed, the Shapiro-Wilk goodness-of-fit test was used (Royston, 1992). In this test, if p > 0.1, the null hypothesis that the log data follow a normal distribution cannot be rejected. For this example data set, the p-value of the log-transformed uncensored data is 0.293, which indicates that lognormal distribution is a good approximation of the distribution of the data set.

SDSU Mission Valley Campus Project WQTR A-17 August 2019
Figure A-4: Histograms and Probability Plots of Transportation Total Lead Data in Arithmetic and
Lognormal Space
Method for Dealing with Multiple Detection Limits To account for the multiple detection limits in the censored data sets, a regression on order statistics (ROS) method was employed. ROS is a category of robust methods for estimating descriptive statistics of censored data sets that utilize the normal scores for the order statistics (Shumway et al. 2002). The plotting position method by Hirsch and Stendinger (1987) (summarized by Helsel and Cohn, 1988) was the ROS method used. In this method, plotting positions are based on conditional probabilities and ranks, where the ranks of the censored (below detection) and uncensored data (above detection) related to each detection limit are ranked independently. The method is summarized in the equations below. After plotting positions for the censored and uncensored values have been calculated, the uncensored values are plotted against the z-statistic corresponding to the plotting position and the best-fit line of the known data points is derived. Using this line and the plotting positions for the uncensored data, the values for the uncensored data are extrapolated. Figure A-5 illustrates the
0
2
4
6
8
10
12
1 1.5 2 2.5 3 3.5 4
LN of Total Lead (ug/L)
Fre
qu
enc
y
0
5
10
15
20
0 10 20 30 40 50 60 70 80
Total Lead (ug/L)
Fre
qu
ency
-2
-1
0
1
2
3
1 1.5 2 2.5 3 3.5 4 4.5
LN of Total Lead (ug/L)
No
rmal
Qu
anti
le
-2
-1
0
1
2
3
4
0 10 20 30 40 50 60 70 80 90
Total Lead (ug/L)
No
rmal
Qu
anti
le

SDSU Mission Valley Campus Project WQTR A-18 August 2019
results of the application of the plotting position method on the total lead data for transportation land use.
11 1
jjj
jjj pe
BA
Apepe (1)
Where: Aj = the number of uncensored observations above the j detection limit and below the
j +1 detection limit. Bj = the number of censored and uncensored observations less than or equal to the j
detection limit. pej = the probability of exceeding the j threshold for j = m, m -1, … 2, 1 where m is
the number of thresholds; by convention pem+1 = 0. Equation 2 was used for plotting the uncensored data and equation 3 was used for plotting the censored data; the plotting positions of the data were calculated using the Weibull plotting position formula.
1
1 1
j
jjj A
rpepepeip (2)
Where: p(i) = the plotting position of the uncensored i data point. r = the rank of the ith observation of the Aj observations above the j detection limit.
1
1
j
j
n
rpeipc (3)
Where: pc(i) = the plotting position of the censored i data point. R = the rank of the ith observation of the nj censored values below the j detection
limit.

SDSU Mission Valley Campus Project WQTR A-19 August 2019
Figure A-5: Probability Plot of the Uncensored and Predicted (Censored) Total Lead Transportation EMCs
Method for Calculating Descriptive Statistics After the censored data are estimated (or for datasets without non-detects), descriptive statistics were computed using the bootstrap method (Singh et al. 1997). The bootstrap method samples from the data set with replacement several thousand times and calculates the desired descriptive statistics from the sampled data. The steps of the bootstrap estimation method are described below.
1. Take a sample of size n with replacement (the sampled data point remains in the data set for subsequent sampling) from the existing data set (Singh et al. recommends n be the same size as the original data set, this recommendation was followed for the analysis) and compute the descriptive statistic, θi, from the sampled data.
2. Repeat Step 1 independently N times (20,000 for this analysis) each time calculating a new estimate for θi.
3. Calculate the bootstrap estimate θB by averaging the θi’s for i=1 to N.
Fundamentally, the bootstrap procedure is based on the Central Limit Theorem (CLT), which suggests that even when the underlying population distribution is non-normal, averaging produces a distribution more closely approximated with normal distribution than the sampled distribution (Devore 1995). Figure A-6 compares the total lead data after estimating censored values using the ROS method described prior to applying the bootstrap method with bootstrapped means of the ROS data. Note the bootstrap means are more normally distributed than the original data and the central tendency of the data is centered near 8 µg/L.
y = 1.6144x + 1.0149R2 = 0.9884
R = 0.994 > Rcr = 0.970
-3
-2
-1
0
1
2
3
4
5
6
-2.5 -2 -1.5 -1 -0.5 0 0.5 1 1.5 2 2.5
Z-Score
Ln
(TP
b)
Actual Data Predicted TPb Linear (Actual Data)

SDSU Mission Valley Campus Project WQTR A-20 August 2019
Figure A-6: Comparison of the Distribution of ROS Method Total Lead Data and the Bootstrap Means of the
ROS Data.
The majority of the LACDPW stormwater monitoring for the pollutant land use combinations analyzed fit a lognormal distribution. The data that did not statistically fit the lognormal distribution were more closely approximated with a lognormal distribution than a normal distribution. The bootstrap method was applied differently depending on the distributional fit of the data. If the pollutant EMC data for a particular land use fit a lognormal distribution according to the Shapiro-Wilk goodness-of-fit test, the log-transformed data were bootstrapped and an estimate of the mean and standard deviation were obtained in log space and then converted to arithmetic space. The assumption of lognormality was more stringently applied than normal by using an alpha significance value of 0.1. This was done to improve the estimate of the standard deviation when the hypothesis of lognormality is rejected. When analyzing data in log space there is a tendency to overestimate the standard deviation for relatively symmetric data and underestimate the standard deviation for severely skewed data. For datasets that did not fit the lognormal distribution, the raw data were bootstrapped to obtain the mean and standard deviation statistics. Bootstrapping the data in arithmetic space assumes no distribution in those instances when a distribution could not be confirmed through goodness-of-fit testing.
Conclusions The plotting position method for multiple detection limits has been used in conjunction with the bootstrap procedure for calculating the descriptive statistics used to represent pollutant EMC
1
10
100
1000
10000
0 3 6 8 11 14 16 19 22 24 27 30 32 35 38 40 43 46 48 51 54 56 59 62
Total Lead (ug/L)
Fre
qu
ency
of
Occ
ure
nce
0
0.1
0.2
0.3
0.4
0.5
0.6
0.7
0.8
0.9
1
Pro
bab
ilit
y o
f V
alu
e F
alli
ng
in
Bin
R
ang
e
ROS HistogramBoot Mean HistogramROS Prob PlotBoot Mean Prob Plot

SDSU Mission Valley Campus Project WQTR A-21 August 2019
distributions in the water quality model. Table A-10 summarizes the number of data points and detects for the land use specific pollutant EMC data. Table A-11 summarizes lognormal descriptive statistics, and Table A-12 summarizes the resulting arithmetic means. The latter data represent the land use specific pollutant EMCs in the Monte Carlo water quality model.

SDSU Mission Valley Campus Project WQTR A-22 August 2019
Table A-10: Summary of Number of Data Points and Percent Non-Detects for Land Use EMC Data.
Land Use TSS TP NH3-N NO3-N NO2-N TKN DCu TCu TPb DZn TZn TDS
SD Commercial Count 6 6 NA NA NA NA 6 6 6 6 6 NA
% ND 0% 0% NA NA NA NA 0% 0% 0% 0% 0% NA
SD Educational Campus and Parks Count 2 2 NA NA NA NA 2 2 2 2 2 NA
% ND 0% 0% NA NA NA NA 0% 0% 0% 0% 0% NA
LA Commercial Count 31 32 33 33 7 36 40 40 40 40 40 31
% ND 0% 3% 21% 21% 0% 3% 15% 0% 45% 10% 10% 0%
LA Transportation Count 75 71 74 75 10 75 77 77 77 77 77 75
% ND 0% 1% 27% 20% 0% 0% 1% 0% 52% 6% 6% 0%
LA Multi-Family Residential Count 48 46 48 50 35 50 52 52 57 52 52 42
% ND 2% 41% 67% 2% 70% 0% 90% 38% 88% 96% 96% 0%
LA Open Space Count 48 46 48 50 35 50 52 52 57 52 52 45
% ND 2% 41% 67% 2% 70% 0% 90% 38% 88% 96% 96% 0%
LA Educational Campus and Parks Count 51 49 52 51 15 51 54 54 54 54 54 51
% ND 0% 0% 35% 24% 0% 0% 19% 0% 76% 39% 35% 0%

SDSU Mission Valley Campus Project WQTR A-23 August 2019
Table A-11: Lognormal Statistics for Modeling Pollutant Concentrations from Land Uses.
Land Use TSS TP NH3 NO3 NO2 TKN DCu TCu TPb DZn TZn TDS
Units mg/L mg/L mg/L mg/L mg/L mg/L µg/L µg/L µg/L µg/L µg/L mg/L
Commercial Mean 4.65 -1.41 -1.09 -0.94 -2.63 0.70 2.55 3.75 1.59 5.25 6.01 4.92
St. Dev 0.63 0.73 1.60 0.83 1.17 1.04 0.72 0.72 1.47 0.58 0.58 0.93
Transportation Mean 3.97 -0.92 -1.73 -0.85 -2.69 0.37 3.24 3.75 1.60 5.10 5.46 4.04
St. Dev 0.88 1.03 1.22 1.05 0.76 0.69 0.69 0.65 1.12 0.78 0.66 0.57
Multi-Family Residential Mean 3.20 -1.77 -1.27 -0.40 -2.94 0.39 1.77 2.40 0.81 3.96 4.58 4.27
St. Dev 0.99 0.78 1.08 1.28 1.20 0.62 0.68 0.44 1.18 0.88 0.71 1.11
Open Space Mean 3.44 -3.14 -3.12 -0.03 -3.95 -0.36 -1.71 1.44 -0.40 3.24 2.23 5.46
St. Dev 1.97 1.43 1.35 0.61 0.49 0.79 1.55 1.36 1.73 0.44 1.44 0.09
Educational Campus and Parks Mean 4.42 -0.92 -1.90 -0.89 -3.05 0.36 1.42 2.30 1.48 4.10 4.96 4.53
St. Dev 0.96 0.53 1.40 0.89 1.22 0.60 0.77 0.62 1.02 0.63 0.64 0.85
Note: values in Blue are derived from San Diego Specific land use monitoring efforts. Table A-12: Resulting Arithmetic Means from Lognormal Statistics used for Modeling Pollutant Concentrations
Land Use TSS TP NH3 NO3 NO2 TKN DCu TCu TPb DZn TZn TDS
Units mg/L mg/L mg/L mg/L mg/L mg/L µg/L µg/L µg/L µg/L µg/L mg/L
Commercial 127.6 0.32 1.21 0.55 0.55 3.44 16.62 54.84 14.40 224.4 483.7 226.0
Transportation 77.8 0.68 0.37 0.74 0.09 1.84 32.40 52.20 9.20 222.0 292.9 62.0
Multi-Family Residential 39.9 0.23 0.50 1.51 0.11 1.80 7.40 12.10 4.50 77.5 125.1 105.0
Open Space 216.6 0.12 0.11 1.17 0.02 0.96 0.60 10.60 3.00 28.1 26.3 237.0
Educational Campus and Parks 132.1 0.46 0.40 0.61 0.10 1.71 5.58 12.02 7.43 73.1 174.1 147.0
Note: Values in blue are derived from San Diego Specific land use monitoring efforts.

SDSU Mission Valley Campus Project WQTR A-24 August 2019
A.2.5. Treatment Assumptions and Estimate of Treatment BMP Performance Parameters
BMP performance is a function of three factors: (1) the fraction of stormwater runoff receiving treatment (often referred to as percent of runoff captured, or simply percent capture); (2) the pollutant removal achieved in the unit by virtue of infiltration and/or evapotranspiration (generically referred to as volume reduction); and (3) the pollutant removal achieved in the treatment unit by virtue of improved water quality. Capture efficiency calculations used to estimate results for the individual storms and volume reduction estimates are discussed in Section A.2.5.1, and pollutant removal estimates are described in Section A.2.5.2.
A.2.5.1. BMP Capture Efficiency and Volume Reduction
The developed areas within the Project are proposed to be treated by distributed biofiltration BMPs, as described in Section 5 of the WQTR. The Monte Carlo model utilizes event-by-event estimates of BMP capture efficiencies and volume reduction to describe the hydrologic and hydraulic performance of the Project BMPs. The event-based inputs were developed using SWMM simulations, using inputs described above in Table A-2. Results from the SWMM simulations are post-processed in a modified SWMM engine (SWMM 4.4h) to yield capture efficiency and volume reduction for each storm in the record. The modified SWMM engine tracks rainfall, runoff, and treatment system routing in the context of individual storm events. In the Rain block, storm events are delineated from within the continuous rainfall record using algorithms identical in performance to GeoSYNOP, described herein; depth and start and stop times of each event are recorded. In the Runoff block, the rainfall volume associated with each event is tracked between the volume lost and that which runs off; start and stop times of runoff for each storm are recorded for later use. Volume reduction which occurs in parcel-based BMPs which drain to a regional facility is also accounted for in the Runoff block, as described in subsequent sections. Finally, in the Storage/Treatment block, the runoff volume associated with each storm event is tracked between treated volume, bypassed volume, infiltrated volume and evaporated volume. This constitutes a volume-tracking approach of calculating capture efficiency and volume reduction by storm event. The result of these algorithms is a capture efficiency and volume reduction for each storm in the period of record. The volume reduction achieved by a BMP is a function of the capture efficiency and the fraction of captured stormwater runoff that is infiltrated, evaporated, or transpired by vegetation.

SDSU Mission Valley Campus Project WQTR A-25 August 2019
“Bubble Level Model” Biofiltration BMP Representation The developed areas within the Project will be treated in a “bubble level” model that assumes that 80% of the long-term runoff from the treated areas within the Project will be treated by a biofiltration LID BMP. The exact location and routing for the developed areas to distributed biofiltration LID BMPs within the Project has not yet been finalized, so the “bubble level” model represents the cumulative performance and water quality benefits that will be achieved by all of the Project BMPs. Actual long-term capture performance of the biofiltration BMPs is expected to exceed 80% treatment of long-term runoff based upon the preliminary BMP sizing performed by Rick Engineering (2019a). The model BMP configuration was developed to produce a long term average treatment performance of 80% for each storm event in the rainfall record on a unit acre of impervious area. The total area and imperviousness routed to the modeled BMP is provided in Table A-13. Table A-13: Tributary Area and Imperviousness to Modeled BMP
Tributary to BMP Area, ac Imperviousness (%)
Developed Area 1 100 The “bubble level” BMP was analyzed as volume-based, and was designed as a biofiltration BMP with no infiltration. The hydraulic representation for the biofiltration BMP was developed in the SWMM Storage/Treatment block based on a standard BMP profile that meets the biofiltration design criteria specified in the San Diego Regional MS4 Permit (order R9-2013-0001) and the 2018 City of San Diego Storm Water Standards Manual (City of San Diego, 2018). The BMP modeling assumptions and hydraulic representations are described in Table A-14 below. These inputs were used to develop capture efficiency and volume reduction estimates for use in water quality modeling; however alternative configurations can be used to achieve comparable results. Table A-14: BMP Modeling Assumptions and Hydraulic Representations
BMP Parameter
Storage Volume Sized to achieve 80% of long-term runoff capture from a 100% impervious tributary area
BMP Type Biofiltration Planning Level BMP Configuration
Treatment discharge only; no infiltration modeled
Surface Ponding Drain Time < 24 hours Media Filtration Rate (controls underdrain discharge) 5 inches per hour Height of Underdrain Invert Elevation above Bottom of BMP 0 ft; no infiltration modeled
Aggregate Storage 9 inches

SDSU Mission Valley Campus Project WQTR A-26 August 2019
BMP Parameter
Aggregate Storage Porosity 0.4 in/in Media Depth 18 inches Media Available Porosity 0.5 in/in Surface Ponding Depth 6 inches
The storm-by-storm capture efficiency and volume reduction estimated from the BMP simulation was extracted from SWMM model output and used to represent the hydraulic performance of the biofiltration BMP in the Monte Carlo model. Table A-15 reports the long-term hydrologic performance of the BMP (capture efficiency and volume reduction). Table A-15: BMP Hydraulic Performance
Developed Area Capture Efficiency Volume Reduction1
Biofiltration BMP 80% 0% 1 Expressed as a portion of captured water.
A.2.5.2. BMP Pollutant Removal
BMP effluent quality, like land use EMCs, is highly variable. To account for this variability, effluent quality data were analyzed and descriptive statistics were generated by means of a technique similar to that used to generate land use EMCs. The descriptive statistics generated were used as BMP effectiveness inputs to the Monte Carlo model. The International Stormwater BMP Database (www.bmpdatabase.org) is a comprehensive source of BMP performance information. The BMP Database is comprised of carefully examined data from a peer-reviewed collection of studies that have monitored the effectiveness of a variety of BMPs in treating water quality pollutants for a variety of land use types. Research on characterizing BMP performance suggests that effluent quality rather than percent removal is more reliable in modeling stormwater treatment (Strecker et al. 2001). Schueler (1996) also found in his evaluation of detention basins and stormwater wetlands that BMP performance is often limited by an achievable effluent quality, or "irreducible pollutant concentration;” acknowledging that a practical lower limit exists to which stormwater pollutants can be removed by a given technology. While there is likely a relationship between influent and effluent for some BMPs and some constituent concentrations, the analyses that have been conducted to-date do not support flat percent removal values relative to influent quality. As such, the distribution of effluent concentrations of stormwater BMPs reported in the BMP Database are used to estimate BMP performance for water quality modeling of the proposed conditions. Future studies may support a refinement to the approach of effluent concentration-based BMP performance modeling, such as the development of more complex influent-effluent relationships. However, it should be noted that the stochastic modeling approach accounts for, at least in part, the uncertainty of not knowing the relationship between influent and effluent concentrations since

SDSU Mission Valley Campus Project WQTR A-27 August 2019
the BMP effluent distributions are based on a variety of BMP studies with a wide-range of influent concentrations, representing a variety of tributary drainage area land use characteristics. Furthermore, the Monte Carlo model employed only accounts for pollutant reductions if the predicted influent is greater than the achievable effluent quality estimated for the modeled BMP (i.e. effluent equals influent [or land use-based] concentrations up until the influent concentration exceeds the effluent concentration). Therefore, influent (or land use EMC-based) concentrations are considered by the model since they are directly used to determine whether or not treatment occurs. Similar to the estimation of land use EMCs, final BMP effluent values used were determined using a combination of regression-on-order statistics and the “bootstrap” method. Log-normality was assumed for BMP effluent concentrations. Discharge from the Project “bubble level” BMP was assumed to have effluent quality equivalent to a ‘biofiltration’ BMP. ‘Biofiltration’ effluent values were estimated by combining data from both bioretention-type BMPs and media filters, which utilize similar mechanisms to remove pollutants and are both incorporated into biotreatment BMP design. The data is combined to represent the best performing mean effluent concentrations achievable by these BMP types. Bioretention, media filter, and the combined ‘biofiltration’ type BMP effluent values are included in the tables below. Table A-16 summarizes the number of data points (individual storm events) and percent non-detects for the pollutants and biotreatment BMP types listed above. Table A-17 summarizes the log-normal statistics of the biotreatment BMP types as well as the statistics that were used in the water quality model (representing the lowest performance for each pollutant), and Table A-18 summarizes arithmetic descriptive statistics for those data sets. BMP effluent concentrations are assumed to be limited by an “irreducible effluent concentration,” or a minimum achievable concentration. Lower limits are currently set at the 10th percentile effluent concentration of BMP data in the International BMP Database for each modeled BMP type for which the BMP data show statistically significant differences in influent and effluent means. If the differences are not statistically significant, the 90th percentile is used as the minimum achievable effluent concentration, which essentially assumes no treatment. Table A-19 summarizes the irreducible effluent concentration estimates used by for water quality modeling of the proposed condition. No treatment was assumed for nitrite (NO2), Total Dissolved Solids (TDS), and chloride, so these constituents are not included on the following summary tables even though they were included in the model.

SDSU Mission Valley Campus Project WQTR A-28 August 2019
Table A-16: Summary of Number of Data Points and Percent Non-Detects for BMP Effluent Concentration Data from the International BMP Database
BMP TSS TP NH3 NO3 TKN DCu TCu TPb DZn TZn
Biofilters Count 332 325 187 174 314 150 305 291 149 332 % ND 6% 10% 6% 3% 9% 9% 14% 13% 26% 15%
Table A-17: International BMP Database Lognormal Statistics of BMP Effluent Concentrations
BMP TSS TP NH3 NO3 TKN DCu TCu TPb DZn TZn
Biofilters Mean 2.166 -2.434 -2.354 -0.748 -0.615 1.257 1.662 0.405 2.089 2.557
St. Dev 1.308 0.942 1.164 1.102 0.944 1.033 1.036 1.226 1.423 1.315
Table A-18: International BMP Database Arithmetic Estimates of BMP Effluent Concentrations
BMP TSS TP NH3 NO3 TKN DCu TCu TPb DZn TZn
units mg/L mg/L mg/L mg/L mg/L ug/L ug/L ug/L ug/L ug/L
Biofilters Mean 20.5 0.14 0.19 0.87 0.84 6.00 9.02 3.18 22.2 30.6
St. Dev 43.6 0.16 0.32 1.34 1.01 8.29 12.5 5.94 57.0 65.9
Table A-19: International BMP Database Arithmetic Irreducible Effluent Concentration Estimates
BMP TSS TP NH3 NO3 TKN DCu TCu TPb DZn TZn mg/L mg/L mg/L mg/L mg/L ug/L ug/L ug/L ug/L ug/L
Biofilters 1.24 0.022 0.021 0.133 0.18 0.85 1.20 0.30 1.28 2.32
SDSU Mission Valley Campus Project WQTR A-29 August 2019
A.2.6. Model Parameter Reliability & Assumptions
The input parameters for the water quality model fall into five main categories shown below. Each of the categories of input data is evaluated for accuracy reflecting the Project site conditions:
Precipitation data; Runoff coefficients; Land use data; Stormwater pollutant EMCs; and BMP performance estimates.
A.2.6.1. Precipitation Data
The precipitation record used for the Project was the Fashion Valley ALERT gauge, which is located approximately 3.4 miles west of the Project. The gauge elevation of 20 feet AMSL is comparable to the Project elevations of approximately 50-80 ft AMSL, and the gauge location is assumed to have similar rainfall patterns as the Project due to their close proximity to one another. The San Diego County Hydrology Manual (2003) contains an 85th Percentile Precipitation Isopluvial Map from June 2001 that estimates that the 85th percentile, 24-hour storm event for the Project is between 0.6 and 0.65 inches. The 85th percentile, 24-hour storm event for the record used for the model is 0.60 inches, which does not include storm events that are not anticipated to produce runoff (<0.1-inch) and is based off of an hourly rainfall record that extends over 40 years. Therefore, the record used in the modeling is considered reliable and representative of the Project, using the most recent data available.
A.2.6.2. Runoff Coefficients
The estimation of runoff coefficients, described in Section A.2.2, is highly dependent on soil properties (i.e. infiltration potential) and less dependent on parameters such as ET rates, slopes, and depression storage. Soil properties are estimated as accurately as possible from available data such as soil surveys and site-specific geotechnical studies. However, runoff coefficients estimates may somewhat overestimate or underestimate stormwater runoff. The net result on the water quality model is that this parameter is not conservatively estimated; however, it is estimated as accurately as the available information permits.
A.2.6.3. Land Use Data
The land use data for the existing and developed conditions has a high level of accuracy for classifying land use type and maximum area of disturbance. The percent impervious values used in the water quality model for the urban land uses in the developed condition are based upon anticipated development patterns for the land use type. These percent impervious values assigned to types of urban land uses are somewhat conservative to provide a margin of safety when estimating flow rates for flood control analysis. These same percent impervious values are used

SDSU Mission Valley Campus Project WQTR A-30 August 2019
for calculating runoff coefficients estimates which results in a conservative estimate of stormwater runoff volumes.
A.2.6.4. Stormwater Pollutant EMCs
Stormwater pollutant EMCs are estimated from monitoring data collected by the LADPW from land use characterization stations that do not have the same level (if any) of site design and source control BMPs that will be implemented for the Project. Therefore, the stormwater pollutant EMCs estimated from the LADPW data is probably somewhat conservative compared to the pollutant concentrations in stormwater runoff that will occur from the developed conditions of the Project.
A.2.6.5. BMP Capture Efficiency & Effluent Concentrations
Stormwater capture efficiency estimates were calculated in SWMM to provide results on a storm-by-storm basis for input into the water quality model, to accurately reflect the anticipated performance of the biofiltration BMPs for the Project. Evapotranspiration and flows out of the BMPs were estimated based on planning level representation of anticipated facility type and geometry. Because specific BMP designs have not been developed, model representations have been developed to approximately represent BMP performance and have tended to err on the side of lower performance where appropriate. BMP effluent concentrations are based on studies contained in the International Stormwater BMP Database. These studies are screened to remove data for undersized (i.e., inadequate design criteria) BMPs that are likely to have pollutant removal performance substantially less than the BMPs to be constructed for the Project. This screening is believed to improve the accuracy of BMP performance estimates; however it is only intended to remove BMPs that are clearly unrepresentative in terms of sizing. The screening process is intended to include BMPs with adequate performance that may not be as well designed or maintained as the structural BMPs that will be part of the Project. Three specific assumptions tend to introduce considerable conservatism into the modeling results for capture efficiency and treatment performance:
BMP sizing assumptions used for capture efficiency calculations are based on sizing for water quality treatment only. Therefore, the capture efficiency estimates for BMPs are likely considerably understated in this analysis.
It is assumed that there will be no volume reduction in the BMPs because no infiltration was assumed. There may be some incidental infiltration within the BMPs or partial infiltration if site-specific investigations allow.
Additionally, the BMP effluent statistics used to model biofiltration represent the lowest performance of the menu of biotreatment BMPs that may be implemented in the Project. It is anticipated that average biofiltration BMP effluent quality will likely be better than was assumed for modeling purposes.

SDSU Mission Valley Campus Project WQTR A-31 August 2019
A.2.6.6. Conclusions
The precipitation data, runoff coefficient, land use type and area, and land use percent imperviousness are thought to be reasonably accurate representations of the site conditions and do not considerably increase the conservativeness of the water quality model. The stormwater pollutant EMC estimates are believed to result in conservative estimates of pollutant concentrations and pollutant loads because they do no account for source control and site design practices that will be implemented by the Project. The water quality estimates for the developed condition are believed to be moderately conservative (i.e., tend to overestimate loads and concentrations) due to pollutant concentration estimates, and BMP performance estimates that in general do not include the benefits of site design or source control BMPs that are planned to be implemented in the Project and are based on the lowest performing BMP options.
A.3. Model Methodology
A Monte Carlo simulation method was used to develop the statistical description for stormwater quality. In this approach, the stormwater characteristics from a single storm event are first estimated. The storm depth was determined by randomly sampling from the historical storm depth frequency distribution. Similarly, an EMC was determined by randomly sampling from the frequency distribution of EMCs. The precipitation volume and EMC were used to determine runoff volume, pollutant concentration, and pollutant load of the single storm event. BMP volume reduction and performance (effluent quality), determined by randomly sampling from the developed frequency distributions, were used to calculate the pollutant removal resulting from treatment in the BMP system. This procedure was then repeated thousands of times (20,000), recording the volume, EMC, and load from each randomly selected storm event, including treatment for the developed condition. The statistics of these recorded results provide a description of the average characteristics and variability of the volume and water quality of storm water runoff. This method was applied to the Project using the Project-specific inputs as described above. The modeled pollutants for the Project were the following:
Total Suspended Solids (TSS) (sediment); Total Phosphorus (TP); Ammonia (NH3); Nitrate (NO3); Nitrite (NO2); Total Nitrogen (TN)3; Dissolved Copper (DCu); Total Copper (TCu); Total Lead (TPb);
3 TKN is modeled, but the results are not reported. Total Nitrogen results are reported from the sum of Nitrate, Nitrite, and TKN.

SDSU Mission Valley Campus Project WQTR A-32 August 2019
Dissolved Zinc (DZn); Total Zinc (TZn); and Total Dissolved Solids (TDS).
The steps in the Monte Carlo Water Quality Model are as follows:
1. Develop a statistical description of the number of storm events per year, and randomly select a number, Nstorms.
2. Estimate the volume of storm runoff for each land use area from a randomly selected storm event.
3. Randomly select a pollutant concentration in storm runoff for each land-use area and each pollutant.
4. Calculate the total runoff volume, pollutant load, and concentration in runoff from the modeled portion of the Project, for both existing and developed conditions.
5. Calculate a total annual pollutant load by repeating Steps 2-4 Nstorms times, where Nstorms is the number of storms per year, randomly selected in Step 1.
6. Repeat Steps 1 - 6 a total of 20,000 times for each pollutant modeled, recording the estimated pollutant concentration and annual load for each iteration.
7. Develop a statistical representation (mean annual value) of the recorded storm water pollutant loads and concentrations.
Each of the seven steps is described below.
A.3.1. Storms & Stormwater Runoff (Steps 1 & 2)
Step 1 – Statistical Representation of Number of Storm Events per Water Year
Number of Storms per Water Year
The number of storm events per water year was calculated for the precipitation record used for the model. The modeled average number of storm events per water year (>0.1 inches, defined using an inter-event time of 6 hours and obtained using GeoSYNOP) and standard deviation for the rainfall record is included in Table A-20 below. Table A-20: Number of Storm Events1 per Water Year and Standard Deviation by Record
Rainfall Record Number of Storm Events1 (N) Standard Deviation (SD)
Fashion Valley ALERT gauge 18.2 6.4 1 Defined using an inter-event time of 6 hours and obtained using GeoSYNOP analyses.

SDSU Mission Valley Campus Project WQTR A-33 August 2019
Figure A-7 illustrates a frequency histogram of the number of storm events per water year at the Fashion Valley ALERT gauge. The number of storm events per water year was modeled with a normal distribution. In the simulation, the number of storms per water year was determined by randomly sampling from the normal distribution and rounding to the nearest whole number, using the equation:
Nstorms = 18.2 + 6.4 RN
where: RN = a standard normal variant with a mean of 0 and a standard deviation of 1.
If the arbitrary number of storms per year was zero or negative, then the normal distribution was re-sampled until a positive number was obtained.
Figure A-7: Distribution of Storms per Water Year at the Fashion Valley ALERT Gauge
Step 2 – Estimate the Volume of Storm Runoff from a Storm Event.
The runoff volume from each storm was estimated using the following equation: V = RvPA (5)
where: V = the stormwater runoff volume (ft3) P = the precipitation depth of the storm (ft) A = the drainage area (ft2) Rv = the volumetric runoff coefficient for each storm event, a unit-less value that is a
function of the imperviousness of the drainage.
0
1
2
3
4
5
6
7
1 3 5 7 9 11 13 15 17 19 21 23 25 27 29 31 33 35 37
Freq
uenc
y of
Occ
uran
ce
Number of Storms Per Water Year

SDSU Mission Valley Campus Project WQTR A-34 August 2019
To address runoff from multiple land-use types, the total stormwater runoff volume is determined as the sum of runoff from each land-use type:
Vwshed = Σlu Vlu = Σlu (Rv luPAlu) (6) where lu designates the land-use type. It is assumed that rain falls uniformly over all land-uses. The steps used to calculate the volume of runoff from a randomly selected storm event were: Step 2a : Obtain a storm depth by randomly sampling from all storm events in the record. Step 2b: For each land-use area, calculate a runoff volume using equation (5). The same
storm depth is applied to each land-use area. Step 2c: Sum the runoff volumes from each land-use area to obtain the total runoff from the
watershed for a particular storm event with equation (6).
A.3.2. Pollutant Loads & Concentrations (step 3 & 4)
Step 3 – Estimate a Pollutant Concentration in Storm Runoff from Each Land Use Area
Runoff Concentration
The distribution of land use-based pollutant concentration in storm runoff was developed based on the process described in Section A.2.4. For each storm event, stormwater EMCs were sampled randomly for each modeled land use and water quality parameter. The runoff concentration from each land-use area was evaluated with the expression: Nxxuseland RC lnlnexp (7) where:
xln = the log-normal mean
xln = the log-normal standard deviation
NR = a standard normal random variable
Step 4 – Calculate the Total Runoff Volume, Pollutant Load, and Pollutant Concentration in a Storm Event
Step 4a: The total runoff volume in the watershed was calculated with equation (6) as discussed in Step 2: useilanduselanduselandwshed VVVV 21 (8) where the same randomly selected storm event was used to calculate runoff volume in each of the land-use areas. Step 4b: The total pollutant load from the watershed was calculated by:

SDSU Mission Valley Campus Project WQTR A-35 August 2019
useilanduseilanduselanduselandwshed CVCVL 11 (9) where the concentration in each individual land-use area was calculated with equation (7) discussed in step 3. Step 4c: The average pollutant concentration in runoff from the entire watershed from a single storm event was calculated by dividing the total watershed load (Step 4b) by the total watershed runoff volume (Step 4a): wshedwshedwshed VLC / (10) Model steps up to 4c (Eq 10) were used in the model calculations for catchments with and without modeled BMPs. The resulting values from Equation 9 and Equation 10 represent the end model output for catchments without modeled BMPs and represent intermediate calculations for catchments with modeled BMPs. Catchments with treatment BMPs used additional calculations to determine the reduction in pollutant load and concentration achieved with treatment BMPs. The fraction of stormwater runoff receiving treatment was calculated for each storm event, using the capture efficiency associated with that event, as described in Section A.2.5. BMP performance was modeled using a randomly selected effluent concentration achieved within the BMP for each water quality pollutant. Step 4d: The total pollutant load from watersheds with treatment BMPs was calculated by: wshedwshedeffwshedBMPswshed CVCapVRCVCapL %%_ 1%1 (11)
where:
%Cap = the volumetric percent capture of the BMP. Ceff = the randomly determined effluent concentration from the BMP. VR% = the percent reduction in effluent volume achieved by the BMP (see Section
A.2.5.1). Ceff was determined from sampling from the lognormal distribution described by the parameters contained in Table A-11. Vwshed and Cwshed were calculated per Steps 4A and 4C, respectively.
Step 4e: The average pollutant concentration in runoff from the entire watershed with treatment from a single storm event was calculated by dividing the total watershed load with treatment by the total watershed runoff volume less the volume lost in BMPs: BMPswshedBMPswshedBMPswshed VLC ___ / (12) where: %1 %_ VRCapVV wshedBMPswshed (13)
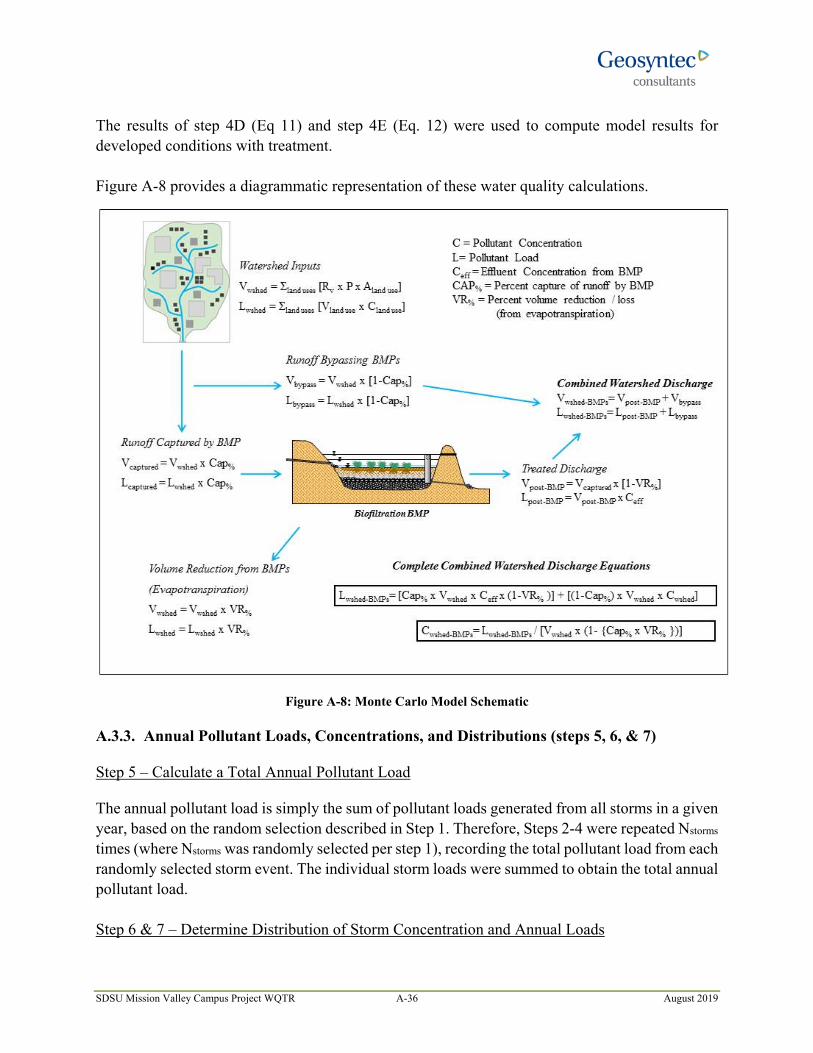
SDSU Mission Valley Campus Project WQTR A-36 August 2019
The results of step 4D (Eq 11) and step 4E (Eq. 12) were used to compute model results for developed conditions with treatment. Figure A-8 provides a diagrammatic representation of these water quality calculations.
Figure A-8: Monte Carlo Model Schematic
A.3.3. Annual Pollutant Loads, Concentrations, and Distributions (steps 5, 6, & 7)
Step 5 – Calculate a Total Annual Pollutant Load
The annual pollutant load is simply the sum of pollutant loads generated from all storms in a given year, based on the random selection described in Step 1. Therefore, Steps 2-4 were repeated Nstorms times (where Nstorms was randomly selected per step 1), recording the total pollutant load from each randomly selected storm event. The individual storm loads were summed to obtain the total annual pollutant load. Step 6 & 7 – Determine Distribution of Storm Concentration and Annual Loads

SDSU Mission Valley Campus Project WQTR A-37 August 2019
Steps 1-5 were repeated a total of 20,000 times, recording the pollutant concentration and annual load from each iteration. The resultant distributions can be used to present a frequency distribution for pollutant concentrations or loads using statistics calculated from the 20,000 Monte-Carlo iterations.
A.3.4. Model Methodology Assumptions
The following five key assumptions are made for the Monte Carlo water quality modeling methodology:
1. The assumed probability distributions of model parameters;
2. The assumption of independence between model parameters (i.e. no correlation between randomly determined variables);
3. Assigning a lower limit to BMP effluent concentrations;
4. Limiting pollutant removals to pollutants with data; and
5. Modeling structural BMPs to only remove pollutants and not acting as a source.
The implications of each of these assumptions to the water quality projections are discussed below. 1) Distribution Assumptions: Probability distributions are assumed to represent the number of storms per year, stormwater pollutant concentrations, and BMP effluent concentrations. Observed precipitation data (i.e., storm frequency) and stormwater monitoring data are fit with either a normal or lognormal distribution using standard statistical procedures. The values of storms per year, storm depth, runoff pollutant concentration, and BMP effluent concentrations used in given iteration in the Monte Carlo analysis are governed by the selected distributions. Large samples of these estimated variables will approximate the assumed distributions and will have the same mean and variance that was observed in the precipitation and monitoring data. The following describes the distributions for various input parameters. Storms per Year: Figure A-7 shows the number of storms per year occurring at the Fashion Valley ALERT gauge. The number of storms occurring per year for the Project record appears to lie between the normal and lognormal distributions. The normal distribution was used to determine the number of storms per year simulated in the water quality model, as use of the lognormal distribution would overestimate the average annual precipitation, as well as its variability, when the distribution of the data are not heavily skewed. Stormwater Pollutant Concentrations: The Shapiro-Wilk Test was used to determine the statistical distribution that best represents the raw stormwater runoff monitoring data collected in Los Angeles County. In most instances the data were found to be log-normally distributed at a confidence level of 0.10. In some instances, the data were not well fit by either the normal or lognormal distributions, but were found to be more closely approximated by the log-normal
SDSU Mission Valley Campus Project WQTR A-38 August 2019
distribution. For data sets with greater than 50 percent non-detects or that were not log-normally distributed according to the Shapiro-Wilk test, data were analyzed (ROS and bootstrap) in arithmetic space as to not unreasonably overestimate the standard deviation of the data set. Since stormwater pollutant concentrations, in general, tend to be well approximated by the lognormal distribution (Helsel and Hirsh, 2002), the data sets that did not meet the lognormal criterion are still believed to belong to a log-normally distributed population, but the number of data points is too few to statistically confirm that this is the case. Therefore, simulations of stormwater concentrations in the water quality model were still conducted in lognormal space. This assumption is believed to result in a more accurate prediction than would the application of the normal distribution. BMP Effluent Concentrations: Goodness-of-fit tests have been conducted on the raw BMP effluent monitoring data from the International BMP Database with the Shapiro-Wilk Test. Results of these tests either resulted in (1) confirmation of the appropriateness of the lognormal distribution for the data; or (2) in the instances when the data did not meet the significance criteria of a p value > 0.1, that the data were more closely approximated with the lognormal distribution than the normal. The use of the lognormal distribution to represent BMP effluent concentrations results in higher average estimates of BMP effluent concentration. This is believed to be a more accurate estimation of BMP performance than use of the normal distribution, and is considered a more conservative assumption (leading if anything to higher than anticipated effluent concentrations). 2) Assumption of No Correlation between Model Parameters: The water quality model randomly selects stormwater pollutant concentrations independent of the storm depth or antecedent dry period for each storm event modeled. The validity of the assumption of independence between variables is supported by analyses conducted by Environmental Defense Sciences (2002), who did not find a strong correlation between storm volume and event mean concentrations (EMCs) in the LA County data for the education land-use site. Data analyses for the single family residential land use were found to be weakly correlated (R2 of 0.6 0.1) for some pollutants with storm depth; however some pollutant showed little correlation between these variables. Where weak correlations were present, stormwater pollutant concentrations tended to decrease with storm size. Correlations between pollutant concentration and antecedent dry period were similarly variable. For the single family land use, correlations between pollutant concentration and antecedent dry period were moderately significant for a few pollutants (R2 of 0.8 0.03), and weak for other pollutants. Correlations between pollutant concentration and antecedent dry period varied widely for the educational and multi-family land uses. The results of these analyses indicated that no consistent level of correlation has been demonstrated between the stormwater EMCs and the storm depth or the antecedent dry period, with weak or no correlation observed for most pollutants and land-uses. On this basis, random selection of stormwater pollutant concentrations, independent of storm depth and antecedent dry period, is warranted for the water quality model.

SDSU Mission Valley Campus Project WQTR A-39 August 2019
Effluent concentrations are considered a more reliable estimator of treatment performance than percent removal (Strecker et al. 2001). BMP effluent concentrations were sampled independently of stormwater concentrations (i.e. influent concentration to the BMP) in the water quality model. As with the pollutant EMCs, independent sampling of effluent concentrations preserves the mean and standard deviation in the monitoring data. 3) BMP Performance – Irreducible Pollutant Effluent Concentrations: When sampling from the lognormal distribution to estimate BMP performance with an effluent concentration it is possible to select values approaching or equal to zero. While well-functioning BMPs are capable of achieving high rates of pollutant removal, it is generally accepted that BMPs cannot completely remove pollutants from the water column. In effect BMPs, at best, can achieve what is called an "irreducible pollutant concentration" (Schueler, 1996). In an effort to prevent overestimating BMP performance in the model, lower limits were set for the effluent concentrations of each modeled pollutant and BMP as described in Section A.2.5. 4) BMP Performance – Limiting Pollutant Removal Estimates to Available Data: Table A-16 and Table A-19 present model parameters used for estimating BMP pollutant effluent concentrations. Pollutant removal is only simulated for those pollutants, which have available data in the IBMPDB. In instances where data is not available for a parameter, no treatment is assumed for that parameter. This does not prevent the model from calculating load reductions of the pollutant as a result of volume reduction (i.e., hydrologic source control). 5) BMP Performance – BMPs are not a Source of Pollutants: In instances when the randomly determined BMP effluent concentration exceeds the modeled influent concentration, no pollutant removal occurs and the effluent concentration is modified to equal the influent concentration. This prevents BMPs from acting as a source of pollutants in the water quality modeling. The commitment to regular and effective maintenance of the stormwater BMPs provides support for this assumption. Conclusions: The above assumptions are expected to improve the accuracy of the water quality model estimates. The net result for the model outputs are somewhat conservative estimates of pollutant loads and concentrations due to estimation of model input parameters that are not compromised by the model methodology.
A.4. Model Reliability
Factors that affect model reliability include variability in environmental conditions and model error. To account for environmental variability, a statistical modeling approach was used that takes into account the observed variability in precipitation from storm to storm and from year to year. The model also considers the observed variability in water quality from storm to storm, and for different types of land uses. One way to express this variability is the coefficient of variation

SDSU Mission Valley Campus Project WQTR A-40 August 2019
(COV) which is the ratio of the standard deviation of the variable to the mean value. Based on the statistical model, the range of COVs for annual pollutant loads ranged from 0.45 to 1.13 on an average annual basis, depending on the pollutant. This variability, or greater, is expected in typical storm water runoff, particularly for highly variable processes such as sediment load generation from open space watersheds. Model error relates to the ability of the model to properly simulate the processes that affect storm water runoff, concentrations, and loads. Ideally model error is measured through calibration, but calibration is not feasible when considering a future condition. The model is a reasonable reflection of stormwater processes because the model relies largely on measured regional data. For example, the runoff water quality data are obtained from a comprehensive monitoring program conducted by LA County that has measured runoff concentrations from a variety of land use catchments and for a statistically reliable number of storm events. In addition parameter estimation is fairly conservative resulting in moderately conservative estimates of changes in pollutant concentrations and loads.
A.5. References
ASCE/EPA (American Society of Civil Engineers Urban Water Resources Research Council and United States Environmental Protection Agency) 2003, International Stormwater Best Management Practices Database (www.bmpdatabase.org).
County of San Diego, 2003. San Diego County Hydrology Manual. Prepared by the County of San
Diego Department of Public Works Flood Control Section. June 2003. County of San Diego, 2014. Prepared by the County of San Diego Department of Public Works.
Low Impact Development Handbook. July 2014. City of San Diego, 2018. The City of San Diego Storm Water Standards. Prepared by Geosyntec.
October 2018. Devore, J.L., 1995. Probability and Statistics for Engineering and the Sciences. Fourth Ed.
Brooks/Cole Publishing Co., Pacific Grove, CA. Federal Highway Administration (FHWA), 1990. “Pollutant Loadings and Impacts from
Stormwater Runoff, Volume III: Analytical Investigations and Research Report,” Prepared by Woodward-Clyde Consultants: E.D. Driscoll, P.E. Shelley, and E.W. Strecker. FHWA-RD-88-008.
Helsel, D.R. and T. A. Cohn, 1988. "Estimation of descriptive statistics for multiply censored
water quality data." Wat. Resour. Res. 24, 1997-2004.

SDSU Mission Valley Campus Project WQTR A-41 August 2019
Helsel, D.R. and Hirsch, R.M., 2002. Statistical Methods in Water Resources. U.S. Geological Survey, Techniques of Water-Resources Investigations Book 4, Chapter A3. Water Resources Division, USGS. Reston, VA
Hill, J., 2002. “Evaluation of Rational Method “C” Values”. Prepared for San Diego County. June
2002. Hirsch, R.M., and J. R. Stedinger 1987. "Plotting positions for historical floods and their
precision," Wat. Resour. Res., 23(4), 715-727 James, W. and R. C. James 2002. Hydrology: A Guide to the Rain, Temperature and Runoff,
Combine and Statistics Modules of the USEPA SWMM4. Computational Hydraulics International, Ontario, Canada. October 2002.
Jennings, G., Line, D., Hunt, W., Osmond, D., and White, N., 2002. “Neuse River Basin Pollution
Sources and Best Management Practices,” Proceedings from the AWRA Specialty Conference on Coastal Water Resources, New Orleans, LA. www.bae.ncsu.edu/people/faculty/jennings/AWRA02_Jennings.htm
Los Angeles County (LA County), 1991. Los Angeles County Hydrology Manual, Department of
Public Works, Alhambra, California, December. Maidment, D.R. (ed.), Handbook of Hydrology. McGraw-Hill Inc., New York, NY (1993). NRCS, 2013. Custom Soil Resource Report for San Diego County, California.
http://websoilsurvey.sc.egov.usda.gov/App/WebSoilSurvey.aspx Rick Engineering Company, 2019a. Water Quality Report for the SDSU Mission Valley Campus
(Onsite Improvements), (Preliminary Engineering/Design Development), Job Number 18150. 12 February.
Rick Engineering, 2019b. Green Streets Elements for SDSU Mission Valley Campus Adjacent
Improvements – PDP Exempt. Letter addressed to City of San Diego from Rick Engineering Company. February 12, 2019.
Royston, P. 1992. "Approximating the Shapiro-Wilk W test for Non-Normality." Statistics and
Computing; 2:117-119.
Schueler, T., 1987. “Controlling Urban Runoff: A Practical Manual for Planning and Designing Urban BMPs,” Publication No. 87703, Metropolitan Washington Council of Governments, Washington, DC.

SDSU Mission Valley Campus Project WQTR A-42 August 2019
Schueler, T. 1996. Irreducible Pollutant Concentrations Discharged from Urban BMPs. Watershed
Protection Techniques, 1(3): 100-111. Watershed Protection Techniques 2(2): 361-363. Shumway, R.H., Azari, R.S., and Kayhanian, M. 2002. "Statistical approaches to estimating mean
water quality concentrations with detection limits." Environ. Sci. Technol. 36, 3345-3353. Singh, A.K., A. Singh, and M. Engelhardt 1997. "The lognormal distribution in environmental
applications." EPA Technology Support Center Issue, EPA 600-R-97-006. Strecker, E., Quigley, M., Urbonas, B., Jones, J., and Clary, J., 2001. “Determining Urban
Stormwater BMP Effectiveness,” Journal of Water Resources Planning and Management May/June 2001.
Strecker, E.W., Quigley, M.M., Urbonas, B. and J. Jones., 2004. Analyses of the Expanded
EPA/ASCE International BMP Database and Potential Implications for BMP Design, In Proceedings of the World Water and Environmental Resources Congress, Salt Lake City, Utah, American Society of Civil Engineers.
United States Environmental Protection Agency (USEPA), 1989. Analysis of Storm Event
Characteristics for Selected Rainfall Gages throughout the United States, Prepared by Woodward-Clyde Consultants: E.D. Driscoll, G.E. Palhegyi, E.W. Strecker, and P.E. Shelley.
Water Environment Federation (WEF), 1998. WEF Manual of Practice No. 23/ASCE Manual of
Practice No. 87, Urban Runoff Quality Management.


![mission valley premium2006oct[1] - oaklines.com · Mission Valley / Bay Cities Cocker Spaniel Clubs Ernie Domondon - show secretary 931 Richard Lane, Danville, CA 94526 MISSION VALLEY](https://static.fdocuments.us/doc/165x107/5add31337f8b9a4a268d395d/mission-valley-premium2006oct1-valley-bay-cities-cocker-spaniel-clubs-ernie.jpg)