
Water-Quality Constituents, Dissolved-Organic … Constituents, Dissolved-Organic-Carbon Fractions,...
65
U.S. Department of the Interior U.S. Geological Survey Scientific Investigations Report 2006-5260 Prepared in cooperation with the N.J. Department of Environmental Protection Water-Quality Constituents, Dissolved-Organic-Carbon Fractions, and Disinfection By-Product Formation in Water from Community Water-Supply Wells in New Jersey, 1998-99
Transcript of Water-Quality Constituents, Dissolved-Organic … Constituents, Dissolved-Organic-Carbon Fractions,...

U.S. Department of the InteriorU.S. Geological Survey
Scientific Investigations Report 2006-5260
Prepared in cooperation with the N.J. Department of Environmental Protection
Water-Quality Constituents, Dissolved-Organic-Carbon Fractions, and Disinfection By-Product Formation in Water from Community Water-Supply Wells in New Jersey, 1998-99


Water-Quality Constituents, Dissolved-Organic-Carbon Fractions, and Disinfection By-Product Formation in Water from Community Water-Supply Wells in New Jersey, 1998-99
By Jessica A. Hopple, Julia L. Barringer, and Janece Koleis
Prepared in cooperation with the N.J. Department of Environmental Protection
Scientific Investigations Report 2006-5260
U.S. Department of the InteriorU.S. Geological Survey

U.S. Department of the InteriorDIRK KEMPTHORNE, Secretary
U.S. Geological SurveyMark D. Myers, Director
U.S. Geological Survey, Reston, Virginia 2007
For product and ordering information: World Wide Web: http://www.usgs.gov/pubprod Telephone: 1-888-ASK-USGS
For more information on the USGS—the Federal source for science about the Earth, its natural and living resources, natural hazards, and the environment: World Wide Web: http://www.usgs.gov Telephone: 1-888-ASK-USGS
Hopple, Jessica A., Barringer, Julia L. and Koleis, Janece, 2007, Water-Quality Constituents, Dissolved-Organic-Car-bon Fractions, and Disinfection By-Product Formation in Water from Community Water-Supply Wells in New Jersey, 1998-99, U.S Geological Survey Scientific Investigations Report 2006-5260, p. 53
Any use of trade, product, or firm names is for descriptive purposes only and does not imply endorsement by the U.S. Government. Use of company names is for identification purposes only and does not imply responsibility.
Although this report is in the public domain, permission must be secured from the individual copyright owners to reproduce any copyrighted material contained within this report.

iii
Contents
Abstract ...........................................................................................................................................................1Introduction.....................................................................................................................................................2
Background............................................................................................................................................2Purpose and Scope ..............................................................................................................................2Description of Study Area ...................................................................................................................2Water Use and Land Use .....................................................................................................................4Previous Investigations of Ground-Water Quality in New Jersey ................................................4
Sources of Water-Quality Constituents and Characteristics .................................................................4Volatile Organic Compounds ...............................................................................................................6Nutrients .................................................................................................................................................6Major and Minor Ions, Trace Elements, and pH ..............................................................................7Organic Carbon .....................................................................................................................................7
Methods of Investigation ..............................................................................................................................8Well Selection .......................................................................................................................................8Collection and Processing of Samples .............................................................................................8Analysis of Samples .............................................................................................................................8
Water-Quality Constituents ........................................................................................................8Organic Carbon Fractionation ...................................................................................................9Disinfection By-Product Formation ........................................................................................10Carbon Fraction Preparation for Determination of Disinfection By-Product Formation.....................................................................................................................................10Ultraviolet Absorbance Measurements .................................................................................11
Quality Assurance Program ..............................................................................................................13Quality of Source Water to Community Water-Supply Wells ...............................................................15
Volatile Organic Compounds .............................................................................................................15Nutrients ...............................................................................................................................................17 Major and Minor Ions, Trace Elements, and pH ...........................................................................18Organic Carbon ...................................................................................................................................20
Dissolved Organic Carbon Fractions and Disinfection By-Products ..................................................20Organic Carbon Fractions .................................................................................................................20Disinfection By-Products ..................................................................................................................21
Sources........................................................................................................................................21Formation of Disinfection By-Products During the Laboratory Incubation Study ..........21Formation of Disinfection By-Products in Dissolved-Organic-Carbon Fractions ...........24Laboratory Determined Formation Rates of Disinfection By-Products in Treated Water from Community Water-Supply Wells ....................................................................................26
Differences in Disinfection By-Product Formation Potential in Water from Different Aquifer Types .................................................................................................................................................29
Possible Bias in Disinfection By-Product Data .............................................................................29Relations Among Disinfection By-Product Formation Potentials ...............................................30Origins of Selected Chemical Characteristics and Constituents and Their Effects on Disinfection By-Product Formation Potential ................................................................................31

iv
Dissolved Organic Carbon ........................................................................................................31Bromide .......................................................................................................................................34Iron, Manganese, and Ammonia .............................................................................................34Indicators of Disinfection By-Product Formation Potential ................................................36
Summary and Conclusions .........................................................................................................................36Acknowledgments .......................................................................................................................................37References Cited..........................................................................................................................................37Appendix 1. Quality-assurance data (blanks, replicates, and related environmental samples)
for 1) water samples and 2) chlorinated water samples from community water-supply wells, New Jersey, 1998-99 ..........................................................................................................41
Appendix 2. Constituent concentrations in, and characteristics of, water samples from 20 community water-supply wells, New Jersey, 1998-99 .............................................................47
Appendix 3. Concentrations of disinfection by-products formed in chlorinated water from seven selected community water-supply wells in New Jersey, 1998-99, during three periods of incubation .....................................................................................................................52
Figures 1-2. Maps showing— 1. Physiographic provinces of New Jersey and locations of community water-supply wells sampled during 1998-99 .............................................................................................3 2. Geologic and hydrogeologic features of New Jersey ...................................................5 3. Schematic diagram of organic compounds isolated using XA-8 and XAD-4 resin
columns during the fractionation procedure .........................................................................12 4-21. Graphs showing— 4. Concentrations of (a) methyl tert-butyl ether (MTBE), (b) trichloroethylene (TCE), (c) tetrachloroethylene (PCE), and (d) chloroform in water from 20 community water-supply wells in New Jersey, by aquifer type, 1998-99 ......................................16 5. Concentrations of (a) ammonia and (b) nitrite + nitrate in water from 20 community water-supply wells in New Jersey, by aquifer type, 1998-99 .......................................17 6. Concentrations of (a) chloride, (b) sodium, and (c) sulfate in water from 20 community water-supply wells in New Jersey, by aquifer type, 1998-99 ..................19 7. Relation of concentrations of bromide to concentrations of chloride in water from 20 community water-supply wells in New Jersey, 1998-99 ..........................................19 8. Values of ultraviolet absorbance at 254 nanometers (UV-254) in water from 20 community water-supply wells in New Jersey, by aquifer type, 1998-99 ..................20 9. Relation of trihalomethane formation potential (THMFP) to ultraviolet absorbance at 254 (UV-254) nanometers in water from 20 community water-supply wells in New Jersey, 1998-99 ...........................................................................................................24 10. Relation of concentrations of (a) bromoform (CHBr3), (b) bromodichloromethane (CHBrCl2), (c) chloroform (CHCl3), and (d) dibromochloromethane (CHBr2Cl) to specific ultraviolet absorbance (SUVA) in water from 20 community water-supply wells in New Jersey, 1998-99 ............................................................................................25 11. Relation of concentrations of (a) bromodichloromethane (CHBrCl2), (b) dibromochloromethane (CHBr2Cl), and (c) chloroform (CHCl3) in chlorinated water to concentrations of dissolved organic carbon (DOC) in source water from 20 community water-supply wells in New Jersey, 1998-99 ..........................................27

v
12. Relation of concentrations of (a) bromoform (CHBr3) and (b) dibromochloromethane (CHBr2Cl) in chlorinated water to concentrations of bromide in source water from 20 community water-supply wells in New Jersey, 1998-99 ...................................................................................................................................27 13. Trihalomethane formation over time in water from (a) well 230195, completed in a Coastal Plain aquifer, (b) well 390451, completed in a glacial aquifer, and (c) well 350083, completed in a bedrock aquifer in New Jersey, 1998-99 ................................28 14. Haloacetic acid formation over time in water from (a) well 390451, completed in a glacial aquifer, and (b) well 230195, completed in a Coastal Plain aquifer in New Jersey, 1998-99 .....................................................................................................................30 15. Trihalomethane formation potential (THMFP) in water from 20 community water- supply wells in New Jersey, by aquifer type, 1998-99 ...................................................32 16. Total haloacetic acids (HAAs) in water from 20 community water-supply wells in New Jersey, by aquifer type, 1998-99 ..............................................................................33 17. Relation of total haloacetic acid concentration (HAA) to trihalomethane formation potential (THMFP) in treated water from 20 community water-supply wells in New Jersey, 1998-99 ...........................................................................................................33 18. Relation of dissolved organic carbon (DOC) concentration to trihalomethane formation potential (THMFP) in water from 20 community water-supply wells in New Jersey, 1998-99 ...........................................................................................................34 19. Relation of total haloacetic acid (HAA) concentration to ultraviolet absorbance at 254 nanometers (UV-254) in water from 20 community water-supply wells in New Jersey, 1998-99 ...........................................................................................................34 20. Concentrations of bromide in water from 20 community water-supply wells in New Jersey, by aquifer type, 1998-99 ........................................................................................35 21. Relation of concentrations of dissolved organic carbon (DOC) to concentrations of ammonia in water from 20 community water-supply wells in New Jersey Coastal Plain aquifers, 1998-99 ........................................................................................................35
Tables 1. Maximum contaminant levels and maximum residual levels goals for the Disinfection
By-Product Rule. ...........................................................................................................................2 2. Selected New Jersey State Primary and Secondary Drinking Water Standards .............6 3. Well identification, aquifer information, and well-construction data for 20 community
water-supply wells, New Jersey ................................................................................................9 4. Water-quality characteristics and constituents, analytical or measurement methods,
and analyzing laboratory for samples from 20 community water-supply wells, New Jersey, 1998-99 ............................................................................................................................10
5. Minimum reporting limits for water-quality constituents ....................................................11 6. Summary of organic carbon fractions isolated using XAD-8 and XAD-4 resin columns
during fractionation procedure ................................................................................................13 7. Summary of types, purpose, and results of quality-assurance and quality-control
analyses for water-quality samples from 20 community water-supply wells, New Jersey, 1998-99 ............................................................................................................................14

vi
8. Concentrations of dissolved organic carbon fractions in water samples from 20 community water-supply wells, New Jersey, 1998-99 .........................................................22
9. Concentrations of trihalomethanes in laboratory chlorinated ground-water samples from 20 community water-supply wells, New Jersey, 1998-99, following a 7-day incubation period ........................................................................................................................23
10. Measurements of ultraviolet absorbance at 254 nanometers (UV-254) and calculations of specific ultraviolet absorbance (SUVA) for water from 20 community water-supply wells, New Jersey, 1998-99 .......................................................................................................26
11. Concentrations of haloacetic acids in chlorinated ground-water samples from 20 community water-supply wells, New Jersey, 1998-99, following a 7-day incubation period ............................................................................................................................................29
12. Concentrations of haloacetonitriles in chlorinated ground-water samples from 20 community water-supply wells, New Jersey, 1998-99, following a 7-day incubation period ............................................................................................................................................30
13. Concentrations of disinfection by-products in dissolved-organic-matter fractions in water samples from 20 community water-supply wells, New Jersey, 1998-99 ................31

vii
Conversion Factors and DatumMultiply By To obtain
Length
centimeter (cm) 0.3937 inch (in.)
millimeter (mm) 0.03937 inch (in.)
meter (m) 3.281 foot (ft)
Volume
cubic meter (m3) 6.290 barrel (petroleum, 1 barrel = 42 gal)
liter (L) 33.82 ounce, fluid (fl. oz)
liter (L) 2.113 pint (pt)
liter (L) 1.057 quart (qt)
liter (L) 0.2642 gallon (gal)
liter (L) 61.02 cubic inch (in3)
Temperature in degrees Celsius (°C) may be converted to degrees Fahrenheit (°F) as follows:
°F=(1.8×°C)+32
Vertical coordinate information is referenced to the “The National Geodetic Vertical Datum of 1929: (NGVD 1929).”
Altitude, as used in this report, refers to distance above the vertical datum.
Specific conductance is given in microsiemens per centimeter at 25 degrees Celsius (µS/cm at 25 °C).
Concentrations of chemical constituents in water are given either in milligrams per liter (mg/L) or micrograms per liter (µg/L).


Water-Quality Constituents, Dissolved-Organic-Carbon Fractions, and Disinfection By-Product Formation in Water from Community Water-Supply Wells in New Jersey, 1998-99
By Jessica A. Hopple, Julia L. Barringer, and Janece Koleis
Abstract Water samples were collected from 20 community water-
supply wells in New Jersey to assess the chemical quality of the water before and after chlorination, to characterize the types of organic carbon present, and to determine the disinfec-tion by-product formation potential. Water from the selected wells previously had been shown to contain concentrations of dissolved organic carbon (DOC) that were greater than 0.2 mg/L. Of the selected wells, five are completed in unconfined (or semi-confined) glacial-sediment aquifers of the Piedmont and Highlands (New England) Physiographic Provinces, five are completed in unconfined bedrock aquifers of the Piedmont Physiographic Province, and ten are completed in unconsoli-dated sediments of the Coastal Plain Physiographic Province. Four of the ten wells in the Coastal Plain are completed in confined parts of the aquifers; the other six are in unconfined aquifers.
One or more volatile organic compounds (VOCs) were detected in untreated water from all of the 16 wells in uncon-fined aquifers, some at concentrations greater than maximum contaminant levels. Those compounds detected included aliphatic compounds such as trichloroethylene and 1,1,1-tri-chloroethane, aromatic compounds such as benzene, the triha-lomethane compound, chloroform, and the gasoline additive methyl tert-butyl ether (MTBE).
Concentrations of sodium and chloride in water from one well in a bedrock aquifer and sulfate in water from another exceeded New Jersey secondary standards for drinking water. The source of the sulfate was geologic materials, but the sodium and chloride probably were derived from human inputs.
DOC fractions were separated by passing water samples through XAD resin columns to determine hydrophobic frac-tions from hydrophilic fractions. Concentrations of hydropho-bic acids were slightly lower than those of combined hydro-philic acids, neutral compounds, and low molecular weight compounds in most samples.
Water samples from the 20 wells were adjusted to a pH of 7, dosed with sodium hypochlorite, and incubated for 168 hours (seven days) at 25 °C to form disinfection by-products (DBPs). Concentrations of the DBPs—trihalomethanes, halo-acetic acids, haloacetonitriles, and chlorate—were measured. Concentrations of these compounds, with few exceptions, were higher in water from Coastal Plain wells than from wells in glacial and bedrock aquifers.
The organic-carbon fractions were dosed with sodium hypochlorite, incubated for 168 hours at 25 ºC, and analyzed for trihalomethanes, haloacetic acids, haloacetonitriles, and chlorate. Concentrations of trihalomethanes and haloacetic acids were higher in most of the hydrophobic organic-acid fractions than in the hydrophilic fractions, with the highest concentrations in samples from Coastal Plain aquifers. Traces of haloacetonitriles were measured, mostly in the hydrophilic fraction.
The aromaticity of the precursor DOC, as estimated by measurements of the absorbance of ultraviolet light at 254 nanometers, apparently is a factor in the DBP forma-tion potentials determined, as aromaticity was greater in the samples that developed high concentrations of DBPs. VOCs may have contributed to the organic carbon present in some of the samples, but much of the DOC present in water from the 20 wells appeared to be natural in origin. The sediments of the Coastal Plain aquifers, in particular, contain substantial amounts of organic matter, which contribute ammonia, organic nitrogen, and aromatic DOC compounds to the ground water. Thus, the geologic characteristics of the aquifers appear to be a major factor in the potential for ground water to form DBPs when chlorinated.

Introduction
Background
The chemical quality of a ground-water source is a primary concern when that source is used for public and domestic supply. Regulations enacted by the U.S. Environ-mental Protection Agency (USEPA) (U.S. Environmental Protection Agency, 1994) and the New Jersey Department of Environmental Protection (NJDEP) (New Jersey Depart-ment of Environmental Protection, 1997) require community water-supply purveyors to monitor ground water for a variety of contaminants that include radionuclides, trace elements, and volatile organic compounds (VOCs) (for example, Louis and others, 1994). The U.S. Geological Survey (USGS), in cooperation with NJDEP, has participated in several research projects investigating the relation of the chemical quality of water to hydrogeology and to land use. These studies have been designed to assess the vulnerability of the source waters of community water-supply wells to contamination by pes-ticides, radionuclides, VOCs, and compounds that form as a result of disinfection of drinking water, known as disinfection by-products (DBPs).
The results of the vulnerability studies can be used by water-supply managers to evaluate strategies for monitoring the quality of water in community water-supply wells. Moni-toring requirements for certain constituents could be waived or reduced for wells that are not vulnerable to human or natural sources of contamination.
New regulations adopted by USEPA, with respect to the Disinfection By-Products Rule (DBPR) and the Infor-mation Collection Rule (ICR), increased the requirements for water purveyors to collect detailed information on both source waters and treated waters. The DBPR, which sets maximum contaminant levels (MCLs) for trihalomethanes (THMs), haloacetic acids (HAAs), bromate, and chlorite, and maximum residual disinfection concentrations for chlorine, chloramines, and chlorine dioxide (table 1), was established in 1994 (U.S. Environmental Protection Agency, 1994). Stage 1 of the DBPR took effect in November 1998 when the MCL for THMs was lowered from 100 µg/L to 80 µg/L and an MCL for HAAs at 60 µg/L was established.
The ICR requires utilities that get their water from ground-water sources and that serve populations greater than 50,000 to start monitoring for DBPs and microbial contaminants. A method is needed to determine whether the vulnerability of water from community water-supply wells to contamination from DBPs can be predicted on the basis of source-water chemical constituents derived from human or natural inputs. This method could be used by water mangers to assess the need for chemical analyses of water supplies that may be of low vulnerability. This vulnerability study was conducted by USGS, in cooperation with NJDEP, to determine
the quality of source water to 20 community supply wells and to investigate a method for predicting the formation of DBPs.
Purpose and Scope
This report describes a study to determine (1) whether the quality of source water to 20 community water-supply wells across New Jersey was compromised by contaminants, and (2) whether the vulnerability of water from community water-supply wells to contamination by the formation of DBPs can be predicted on the basis of hydrogeologic and water-quality indicators. The quality of water withdrawn from the supply wells was determined and is assessed in light of contaminant inputs to ground water from natural sources and human activ-ity. As possible precursors to DBP formation, various types of organic carbon are identified and their relation to the potential for DBP formation in water from confined and unconfined aquifers is evaluated. Water-quality and quality-assurance data are presented and discussed.
Description of Study Area
New Jersey has a humid, temperate climate; average annual precipitation is about 45 inches. The State contains parts of four major physiographic regions or provinces known as the Coastal Plain, the Piedmont, the Highlands (otherwise known as the New England Province), and the Valley and Ridge provinces (fig. 1). Within these provinces, different geologic settings create a variety of aquifer types.
Aquifers consisting of unconsolidated sediments underlie most of the Coastal Plain Physiographic Province in southern New Jersey and are present in glacial deposits in northern New Jersey. The aquifers of the Coastal Plain vary in areal extent and thickness and consist of permeable units of sand and gravel that are separated from one another by less perme-able confining units of silt and clay. Sediments of the predomi-
Table 1. Maximum contaminant levels and maximum residual levels goals for the Disinfection By-Product Rule. 1
[MCL, maximum contaminant level; MRLG, maximum residual levels goal; µg/L, micrograms per liter; mg/L, milligrams per liter]
Constituent/Constituent group Concentration
Disinfection by-products MCLTrihalomethanes 80 µg/LHaloacetic acids 60 µg/LBromate 10 µg/LChlorite 1.0 µg/L
Residual disinfectant MRLGChlorine 4 mg/LChloramines 4 mg/LChlorine dioxide 0.8 mg/L
1 U.S. Environmental Protection Agency, 1994
� Water-Quality, Organic Carbon, and Disinfection By-Product, Water-Supply Wells, New Jersey, 1998-99

150207
150276
090136
070368
070177
050039
010039
010600
291264
230195
210402
130098
030301
030460
390451
270182270155
270147
270080
350083
COASTAL PLAIN
PIEDMONT
NEW ENGLAND (HIGHLANDS)
VALLEY AND RID
GE
EXPLANATION
Glacial
Coastal Plain, unconfined
Coastal Plain, confined
Bedrock
291264 WELL LOCATION AND NUMBER--Color identifies type of aquifer:
7475
41
40
39
0 20 MILES10
0 30 KILOMETERS15
Figure 1. Physiographic provinces of New Jersey and locations of community water-supply wells sampled during 1998-99.
Introduction �
nantly unconfined Kirkwood-Cohansey aquifer system crop out over 3,000 mi2 of the Coastal Plain. The aquifer system is confined on the Cape May peninsula at the southern tip of the State and near the Atlantic coastline (Zapecza, 1989). Five other major aquifers or aquifer systems composed of uncon-solidated sediments underlie the Kirkwood-Cohansey aquifer system; these are mostly confined except in areas along the western and northern parts of the Coastal Plain, where their sediments are at land surface (fig. 2). The glacial aquifers typically are composed of valley-fill sediments, are mostly unconfined, and generally are present north of the terminal moraine of the last (Wisconsin) period of glaciation. Bedrock aquifers, which are mostly unconfined, occur in fractured shales and sandstones in the Piedmont Province, in weathered and fractured crystalline rocks of the Highlands Province, and in porous limestones and dolomites, and fractured conglomer-ates, sandstones, siltstones, and shales of the Valley and Ridge Province.
Water Use and Land Use
Freshwater use in New Jersey, the most populous of the 50 United States, currently is estimated at about 2,200 mil-lion gallons per day. About 27 percent of this volume comes from ground water, of which about 67 percent is provided by community water-supply wells (John Nawyn, U.S. Geological Survey, written commun., 2003).
The quality of the water provided by wells completed in unconfined aquifers can be affected by contaminants introduced at or near the land surface by human activities. Confined aquifers, which can contain water that entered as recharge hundreds to thousands of years ago, are less vulner-able to this type of contamination. Water in both aquifer types, however, can be affected by naturally occurring contaminants released by the aquifer materials.
Agricultural, residential, and urban developments consti-tute the predominant uses of land in New Jersey. A substantial increase in residential development since World War II has occurred largely, although not entirely, at the expense of agri-cultural land. Land development brings with it the potential for contamination of ground water. Agricultural practices can contribute contaminants through use of fertilizers and pesti-cides; residential, commercial, and industrial activities can contribute contaminants through the use of septic tanks and releases of fuels, solvents, and other chemicals. Large tracts of undeveloped land remain, primarily in southern New Jersey. Ground-water quality is less likely to be adversely affected in these areas than in developed parts of the State, unless ground-water flow moves contaminants from parts of the aquifers underlying developed land to those parts underlying adjacent undeveloped areas.
Previous Investigations of Ground-Water Quality in New Jersey
A summary of the quality of New Jersey ground water and a discussion of the vulnerability of water supplies to contamination is presented in Ayers and Pustay (1988) as part of the U.S. Geological Survey National Water Summary. Pesticides and nutrients were measured in water from 90 com-munity water-supply wells during 1994-95 (Clawges and oth-ers, 1998). The occurrence of nitrates, pesticides, and VOCs in ground water in southern New Jersey was determined by Stackelberg and others (1997). THM formation potential, how-ever, has not been studied previously in New Jersey ground waters, but an investigation of the formation potential in water in Kansas aquifers has been reported by Miller and others (1990).
Sources of Water-Quality Constituents and Characteristics
The concentrations of chemical constituents in ground water are related to the sources of the constituents and to the physical, biological, and chemical processes that have occurred along ground-water flow paths. Some sources of con-stituents occur naturally; others result from human activities. Natural sources of constituents include those in precipitation entering aquifers as recharge, minerals and organic matter in soils, and the minerals and organic matter that compose the aquifer matrix. In some hydrogeologic settings, surface water also can provide recharge and can contribute constituents to ground water. Human-induced sources from the land surface and subsurface include applications of agricultural chemi-cals, and disposal of industrial chemicals and other wastes. Natural processes affect the concentrations of both natural and human-induced constituents—these processes include biological degradation of organic matter, mineral dissolution and precipitation, ion exchange, oxidation-reduction reactions, adsorption and desorption of solutes, and generation/coagula-tion of colloids.
Because certain constituents in drinking water are known to pose human health hazards, standards have been set for these constituents by the USEPA and by State agencies such as NJDEP (U.S. Environmental Protection Agency, 2001; New Jersey Department of Environmental Protection, 1997). The National Primary Drinking Water Regulations set either a maximum contaminant level (MCL), which is the maxi-mum permissible level of a contaminant in water delivered to a public system, or an Action Level (AL), the concentration at which remedial action must take place. A health advisory level (HAL) has been promulgated for a few constituents; this is a nonregulatory estimate of the concentration that, over a lifetime of exposure, would result in no known or anticipated health effect. The standards set by NJDEP are, in some cases,
� Water-Quality, Organic Carbon, and Disinfection By-Product, Water-Supply Wells, New Jersey, 1998-99

7475
41
40
39
0 20 MILES10
0 30 KILOMETERS15
130098
030301
030460
390451
350083
291264
270182270155
270147
270080
230195
210402
150207
150276
070368070177
050039
090136
010039
010600
Glacial
Coastal Plain, unconfined
Coastal Plain, confined
Bedrock
291264WELL LOCATION AND NUMBER--Color identifies type of aquifer:
EXPLANATION
GEOLOGIC UNITS
Crystalline Rocks
Passaic Formation
Glacial sediment
Extent of Terminal Moraine
Other bedrock Formations
Boonton Formation
Stockton Formation
Other unconsolidated sedimentary Formations
Potomac, Raritan, and Magothy Formations
Mt. Laurel and Wenonah Formations
Kirkwood and Cohansey Formations
Holocene age sediments of the Coastal Plain
Figure �. Geologic and hydrogeologic features of New Jersey.
Sources of Water-Quality Constituents and Characteristics �

more stringent than the Federal standards and include second-ary maximum contaminant levels (SMCLs), which are not based on health issues, but on the aesthetic issues of smell, taste, foaming, staining, and corrosiveness to plumbing. The NJDEP drinking-water standards for the constituents analyzed during this investigation are listed in table 2.
Volatile Organic Compounds
VOCs are a class of organic compounds, primarily halogenated aliphatic and monocyclic aromatic hydrocarbons, that are characterized by high vapor pressures; that is, they volatilize easily, and they are highly soluble (Smith and others, 1988).
VOCs have a multitude of uses in modern society. VOCs are present in fuels and the exhaust from their combustion. They are found in common household products such as air fresheners, perfumes, bathroom deodorants, cleaning and pol-ishing products, paints, solvents, adhesives, and ink. They also are widely used in industrial applications as degreasers and refrigerants, in the dry-cleaning industry, in the manufacture of pharmaceutical products and plastics, in a process used to decaffeinate coffee, and in agricultural applications as active and inactive components of pesticides and fumigants (Bloe-
men and Burn, 1993; Smith and others, 1988; Verschueren, 1983).
Some VOCs occur naturally; the ethylene emitted as gas by ripening fruit is an example. Of the trihalomethanes, chlo-roform has been shown to form naturally (Hoekstra and others 1998). Nevertheless, at the levels at which contamination of soils and water occurs, the sources of VOCs are derived from human activities. VOC use, improper storage, and (or) disposal at the land surface or in the subsurface can lead to contamination of underlying aquifer systems, and, in some instances, to contamination of water tapped by community water-supply wells.
Many VOCs are toxic and (or) carcinogenic; conse-quently, MCLs have been developed for these compounds. MCLs range from 1 to 1,000 µg/L, depending on the toxicity of the compound (table 2) (New Jersey Department of Envi-ronmental Protection, 1997).
Nutrients
Nutrients, which include nitrogen and phosphorus and their compounds, are essential for animal and plant growth. Natural sources of nutrients include wet and dry atmospheric deposition, biologically-mediated fixation, and the dissolution
Table �. Selected New Jersey State Primary and Secondary Drinking Water Standards.
[MCL, maximum contaminant level; SMCL, secondary MCL (recommended upper limit or optimum range); µg/L, micrograms per liter; mg/L, milligrams per liter; prefixes in parentheses ( ) are alternate or additional prefixes]
Constituent Standard (units) Constituent or characteristic Standard (units)
Volatile Organic Compounds MCL (µg/L) Volatile Organic Compounds MCL (µg/L)Benzene 1 Trichloroethylene 1Carbon Tetrachloride 2 Vinyl chloride 2(meta) 1,3-Dichlorobenzene 600 Xylenes [total] 1,000(ortho) 1,2-Dichlorobenzene 600 Trihalomethanes [total]1 80(para) 1,4-Dichlorobenzene 75 Inorganic Constituents MCL (mg/L)1,1-Dichloroethane 50 Fluoride 41,2-Dichloroethane 2 Nitrate [as nitrogen] 101,1-Dichloroethylene 2 Nitrite [as nitrogen] 1cis-1,2-Dichloroethylene 70 Characteristics SMCLtrans-1,2-Dichloroethylene 100 pH 6.5-8.5 optimum1,2-Dichloropropane 5 Inorganic Constituents SMCL (mg/L)Ethylbenzene 700 Chloride 250Methyl tert-Butyl Ether 70 Fluoride 2Methylene Chloride 3 Hardness2 [as CaCO3] 250(Mono) Chlorobenzene 50 Iron 0.3Styrene 100 Manganese 0.05Tetrachloroethylene 1 Sodium 50Toluene 1,000 Sulfate 2501,1,1-Trichloroethane 30 Total dissolved solids 500
1 Total trihalomethanes are the sum of concentrations of bromoform, bromodichloromethane, dibromochloromethane, and chloroform.2 Hardness is the sum of milliequivalents per liter of calcium and magnesium, and is multiplied by 50 to express as CaCO3. (New Jersey Depart-
ment of Environmental Protection, 1997)
� Water-Quality, Organic Carbon, and Disinfection By-Product, Water-Supply Wells, New Jersey, 1998-99

or precipitation of organic matter. Anthropogenic point sources of nitrogen and phosphorus, as elements or compounds, include municipal and industrial discharges and effluent from individual septic systems or cess pools. Anthropogenic nonpoint sources include leaching of domestic and agricultural fertilizers, manure deposited on or applied to the land sur-face, and effluent from leaking sewer lines or groups of septic systems.
Ammonia is generally the predominant form of nitro-gen in agricultural fertilizers and septic-system effluents. Ammonia (or ammonium ion) is volatile and, therefore, can be transported through the atmosphere and deposited in wet or dry form. In the presence of oxygen it is converted to nitrite, then to nitrate through a microbiologically mediated process called nitrification. The ammonium ion also adsorbs to miner-als (Hem, 1992), and thus is retarded as it moves through soils and aquifer materials. Consequently, because of oxidation (nitrification) and (or) retardation through adsorption, concen-trations of ammonia in ground water are usually low, unless the geochemical environment of the aquifer is reducing (little or no oxygen). Furthermore, because nitrite quickly oxidizes to nitrate, nitrite also generally remains at low concentrations in both surface and ground water. Nitrate is present in some fertilizers and enters the atmosphere from auto exhaust and industrial smokestacks. Consequently, infiltration of precipita-tion can be a source of ammonia, nitrite, and nitrate ions to ground water. Nitrate from fertilizer, and animal (and human) wastes leaches easily through soils (Hem, 1992); as a result, concentrations in ground water can exceed 10 mg/L, particu-larly in agricultural areas. In reducing parts of an aquifer, however, nitrate may not be detected, whereas ammonia (and perhaps nitrite) are likely to be detected.
An MCL (10 mg/L as N) has been promulgated for nitrate in drinking water because high concentrations can cause the potentially fatal blood disorder called methemoglobinemia, or “blue baby disease;” this primarily affects children under 6 months of age. High concentrations of nitrite can cause the same disorder. As a result, an MCL (1 mg/L as N) has been developed for nitrite as well (table 2). No MCL for ammonia has been developed.
Phosphorus is an essential element in metabolism. Organic phosphorus species synthesized by plants and animals constitute a significant fraction of phosphorus in many natural waters (Hem, 1992), where it is usually found in concentra-tions less than a few tenths of a part per million. Large quanti-ties of phosphorus are introduced to the environment through the use of fertilizers; because phosphorus binds strongly to fine-grained soils and organic material, phosphate from fertilizer or organic wastes typically does not leach easily into ground water.
Major and Minor Ions, Trace Elements, and pH
Major ions (calcium, magnesium, sodium, potassium, chloride, and sulfate) and trace elements (arsenic and metals
such as iron and manganese) are contributed to ground water mainly through weathering processes that result in dissolu-tion of minerals in soils, sediments, and bedrock. Major ions such as calcium, magnesium, potassium, chloride, and sulfate also can be contributed to ground water by land application of agricultural chemicals. Wastewater discharges contribute major ions, particularly sodium, chloride, bicarbonate, and sulfate, and trace elements. In some areas, use of road salt during winter can lead to increases in sodium and chloride in ground water.
There also are inputs to the land surface from atmo-spheric deposition, both wet (precipitation) and dry deposi-tion. Mineral sources of chloride, for example, generally are not abundant, but precipitation can be an important source of this ion; concentrations of sodium and calcium also tend to be high in precipitation in New Jersey (Graedel and Reiss, 1985). Because chloride tends not to adsorb to soil materials, it can move easily from the land surface to the water table.
Bromide and fluoride typically are present in minor amounts in ground water. Bromide is contributed primarily by precipitation and can be of natural origin (for example, salt spray, which also contributes chloride) or from anthropogenic sources. Fluoride typically is derived from dissolution of min-erals in the aquifer matrix (Hem, 1992).
Most of the trace elements in ground water are metal and metalloid ions such as aluminum, arsenic, copper, lead, iron, and manganese. Minerals in the aquifer matrix typically contribute metals such as aluminum, iron, and manganese; other metals and metalloids also can be derived from mineral sources. Industrial releases to the land surface and subsurface, also pesticide use, can contribute metallic and metalloid trace elements, sometimes at high concentrations, to ground water (Hem, 1992). Metals emitted by industrial activities also are deposited from the atmosphere to the land surface. Manga-nese, for example, is present mostly in particulate form, and is deposited near its sources (Adriano, 1986). Acidic precipi-tation can leach metals from soils, but some, such as lead, with an affinity for soil organic matter and clays, tend to be adsorbed (Adriano, 1986) and thus retained in the soils.
Ground-water pH (hydrogen-ion activity) is controlled by a variety of chemical reactions that consume or produce hydrogen ions. These reactions include dissociation of water, interactions between water and gases, dissolution of miner-als, hydrolysis of metal ions, and oxidation/reduction (redox) reactions (Hem, 1992). These reactions take place in the soil, between recharge waters and soil constituents, and in the aqui-fer, between water and aquifer materials. Insofar as chemicals of anthropogenic origin can be involved in some of these reac-tions, the pH of ground water, on a local scale, can be affected by human activities.
Organic Carbon
Natural sources of organic carbon in ground water include (1) decomposing plants and other organic matter that
Sources of Water-Quality Constituents and Characteristics �
infiltrate in recharge from soils, or are carried in recharge by surface waters to ground water, and (2) altered (in some cases, fossilized) remnants of organic matter, such as lignite and kerogen, in the geologic materials that compose aquifers (Thurman, 1985). Anthropogenic sources of organic carbon include septic-system effluent, animal feedlots, and compost-ing facilities. Decomposing VOCs also can contribute organic carbon to ground water.
Organic carbon can be measured as total organic car-bon (TOC), which includes particulate and dissolved organic carbon (DOC), which is defined as the organic carbon that passes through a 0.45 µm pore-size silver or 0.7 µm pore-size glass-fiber filter. DOC has been considered the chemically reactive fraction and is composed mostly of humic substances and hydrophilic acids (Thurman, 1985). Nevertheless, because colloids are increasingly found to be involved in contami-nant transport in aquifers, organic carbon (humic substances, lignin) as colloids or as coatings on inorganic colloids can play a role in both soil and ground-water contaminant mobility (McCarthy and Zachara, 1989; Kretzschmar and others, 1995). Consequently, determinations of TOC can be useful to the understanding of transport of adsorbed constituents in ground water.
Methods of Investigation
Well Selection
Wells to be sampled were selected on the basis of previ-ous water-quality results reported in the USGS National Water Information System database. An emphasis was placed on wells completed in unconfined aquifers because the vulner-ability of those wells to human-induced contaminants was considered high relative to that of wells completed in confined aquifers or in confined parts of aquifers. Existing water-qual-ity data for the chosen wells indicated that those in the Coastal Plain generally yielded water containing higher concentrations of DOC, and thus, the water could have a higher potential for forming DBPs than water from the other physiographic provinces. Wells yielding water with low DOC concentrations (less than 0.2 mg/L) were not chosen for sampling because carbon-fractionation and analytical problems were anticipated for such samples. Locations of the selected wells are shown in figure 1, and well-construction data are presented in table 3.
Collection and Processing of Samples
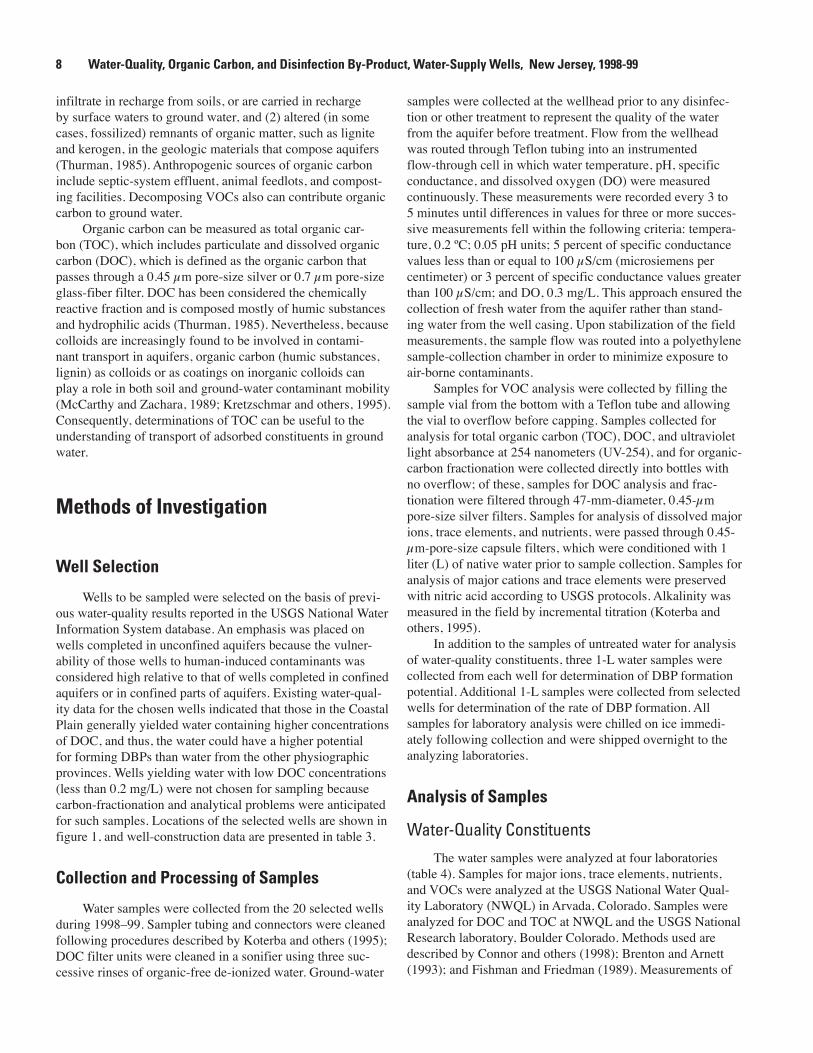
Water samples were collected from the 20 selected wells during 1998–99. Sampler tubing and connectors were cleaned following procedures described by Koterba and others (1995); DOC filter units were cleaned in a sonifier using three suc-cessive rinses of organic-free de-ionized water. Ground-water
samples were collected at the wellhead prior to any disinfec-tion or other treatment to represent the quality of the water from the aquifer before treatment. Flow from the wellhead was routed through Teflon tubing into an instrumented flow-through cell in which water temperature, pH, specific conductance, and dissolved oxygen (DO) were measured continuously. These measurements were recorded every 3 to 5 minutes until differences in values for three or more succes-sive measurements fell within the following criteria: tempera-ture, 0.2 ºC; 0.05 pH units; 5 percent of specific conductance values less than or equal to 100 µS/cm (microsiemens per centimeter) or 3 percent of specific conductance values greater than 100 µS/cm; and DO, 0.3 mg/L. This approach ensured the collection of fresh water from the aquifer rather than stand-ing water from the well casing. Upon stabilization of the field measurements, the sample flow was routed into a polyethylene sample-collection chamber in order to minimize exposure to air-borne contaminants.
Samples for VOC analysis were collected by filling the sample vial from the bottom with a Teflon tube and allowing the vial to overflow before capping. Samples collected for analysis for total organic carbon (TOC), DOC, and ultraviolet light absorbance at 254 nanometers (UV-254), and for organic-carbon fractionation were collected directly into bottles with no overflow; of these, samples for DOC analysis and frac-tionation were filtered through 47-mm-diameter, 0.45-µm pore-size silver filters. Samples for analysis of dissolved major ions, trace elements, and nutrients, were passed through 0.45-µm-pore-size capsule filters, which were conditioned with 1 liter (L) of native water prior to sample collection. Samples for analysis of major cations and trace elements were preserved with nitric acid according to USGS protocols. Alkalinity was measured in the field by incremental titration (Koterba and others, 1995).
In addition to the samples of untreated water for analysis of water-quality constituents, three 1-L water samples were collected from each well for determination of DBP formation potential. Additional 1-L samples were collected from selected wells for determination of the rate of DBP formation. All samples for laboratory analysis were chilled on ice immedi-ately following collection and were shipped overnight to the analyzing laboratories.
Analysis of Samples
Water-Quality ConstituentsThe water samples were analyzed at four laboratories
(table 4). Samples for major ions, trace elements, nutrients, and VOCs were analyzed at the USGS National Water Qual-ity Laboratory (NWQL) in Arvada, Colorado. Samples were analyzed for DOC and TOC at NWQL and the USGS National Research laboratory, Boulder Colorado. Methods used are described by Connor and others (1998); Brenton and Arnett (1993); and Fishman and Friedman (1989). Measurements of
8 Water-Quality, Organic Carbon, and Disinfection By-Product, Water-Supply Wells, New Jersey, 1998-99
UV-254 were made at the National Research laboratory in Boulder and at the USGS New Jersey Water Science Cen-ter laboratory in West Trenton, New Jersey, using Standard Method 5910 (Eaton and others, 1995). Incubation studies and DBP analysis using USEPA Standard Methods (table 4) were performed at the Environmental Health Laboratory (EHL), in South Bend, Indiana. The minimum reporting limit (MRL), which is the minimum concentration of an analyte that can be reliably measured by the laboratory using a given analytical method, is shown for each constituent in table 5. (For VOCs, some detections are reported as estimated concentrations below an MRL of 0.2 µg/L, however, and the actual estimated values do not appear in data tables in appendix 2.)
Organic Carbon FractionationBecause organic acids are absorbed in the proton-
ated form (Thurman, 1985), DOC samples were acidified, using hydrochloric acid (HCl), to a pH between 1.90 and
1.99. Columns containing non-ionic acrylic-ester copoly-mer resins XAD-8 and XAD-4 were connected in series and used to extract hydrophobic and hydrophilic carbon frac-tions in selected samples (fig. 3). Hydrophobic organic acids were extracted onto the XAD-8 resin in the first column and retrieved by back-eluting with 0.1 N sodium hydroxide (NaOH) for all samples. The hydrophilic organic acids, which passed through the first column, were retained on the XAD-4 resin, and, for six samples, were retrieved by again back-elut-ing with NaOH. Both eluates were immediately acidified with HCl to a pH between 1.90 and 1.99 to prevent organic carbon degradation (Aiken and others, 1992). The low-molecular-weight hydrophilic (transphilic) compounds passed through both columns.
Both the hydrophobic organic acids and the hydrophilic organic acids then were further concentrated on the XAD-8 and XAD-4 columns, respectively. The columns were desalted with deionized water and the samples back-eluted with NaOH onto separate cation-exchange resins to hydrogen-saturate the
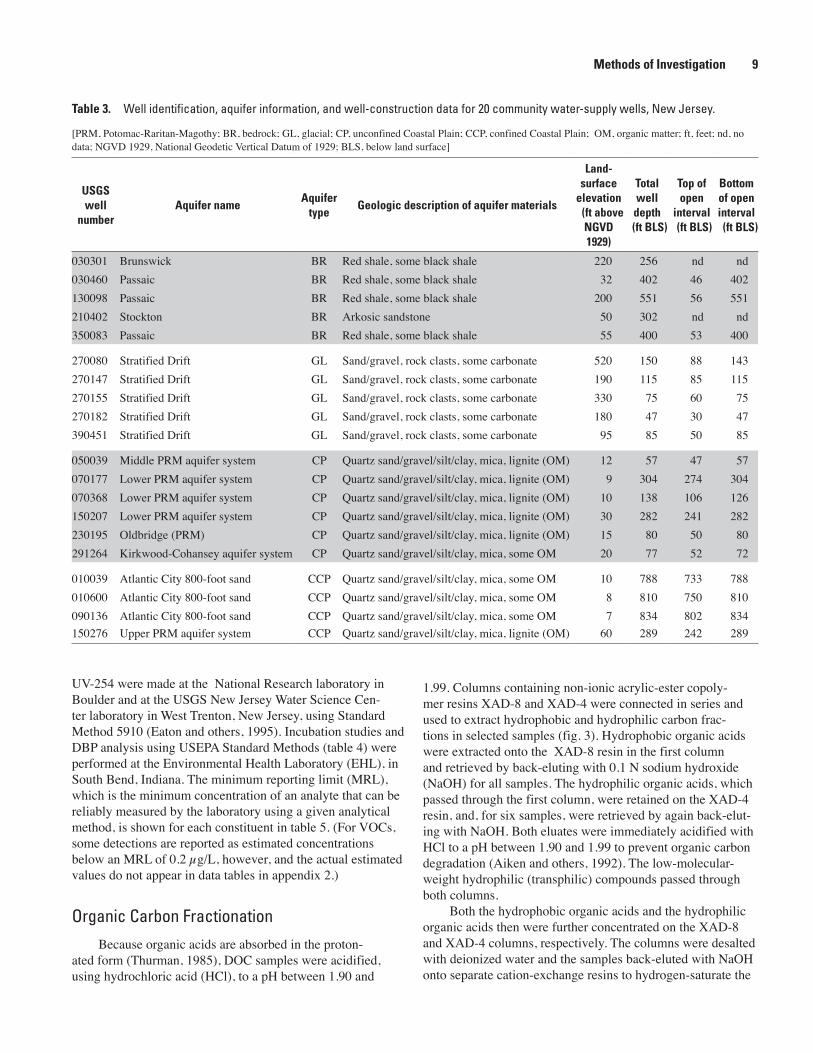
Table �. Well identification, aquifer information, and well-construction data for 20 community water-supply wells, New Jersey.
[PRM, Potomac-Raritan-Magothy; BR, bedrock; GL, glacial; CP, unconfined Coastal Plain; CCP, confined Coastal Plain; OM, organic matter; ft, feet; nd, no data; NGVD 1929, National Geodetic Vertical Datum of 1929; BLS, below land surface]
USGSwell
numberAquifer name
Aquifer type
Geologic description of aquifer materials
Land-surface
elevation (ft above
NGVD 19�9)
Total well depth
(ft BLS)
Top of open
interval (ft BLS)
Bottom of open interval
(ft BLS)
030301 Brunswick BR Red shale, some black shale 220 256 nd nd030460 Passaic BR Red shale, some black shale 32 402 46 402130098 Passaic BR Red shale, some black shale 200 551 56 551210402 Stockton BR Arkosic sandstone 50 302 nd nd350083 Passaic BR Red shale, some black shale 55 400 53 400
270080 Stratified Drift GL Sand/gravel, rock clasts, some carbonate 520 150 88 143270147 Stratified Drift GL Sand/gravel, rock clasts, some carbonate 190 115 85 115270155 Stratified Drift GL Sand/gravel, rock clasts, some carbonate 330 75 60 75270182 Stratified Drift GL Sand/gravel, rock clasts, some carbonate 180 47 30 47390451 Stratified Drift GL Sand/gravel, rock clasts, some carbonate 95 85 50 85
050039 Middle PRM aquifer system CP Quartz sand/gravel/silt/clay, mica, lignite (OM) 12 57 47 57070177 Lower PRM aquifer system CP Quartz sand/gravel/silt/clay, mica, lignite (OM) 9 304 274 304070368 Lower PRM aquifer system CP Quartz sand/gravel/silt/clay, mica, lignite (OM) 10 138 106 126150207 Lower PRM aquifer system CP Quartz sand/gravel/silt/clay, mica, lignite (OM) 30 282 241 282230195 Oldbridge (PRM) CP Quartz sand/gravel/silt/clay, mica, lignite (OM) 15 80 50 80291264 Kirkwood-Cohansey aquifer system CP Quartz sand/gravel/silt/clay, mica, some OM 20 77 52 72
010039 Atlantic City 800-foot sand CCP Quartz sand/gravel/silt/clay, mica, some OM 10 788 733 788010600 Atlantic City 800-foot sand CCP Quartz sand/gravel/silt/clay, mica, some OM 8 810 750 810090136 Atlantic City 800-foot sand CCP Quartz sand/gravel/silt/clay, mica, some OM 7 834 802 834150276 Upper PRM aquifer system CCP Quartz sand/gravel/silt/clay, mica, lignite (OM) 60 289 242 289
Methods of Investigation 9

samples. The desalted samples then were acidified to a pH between 1.90 and 1.99 to prevent degradation.
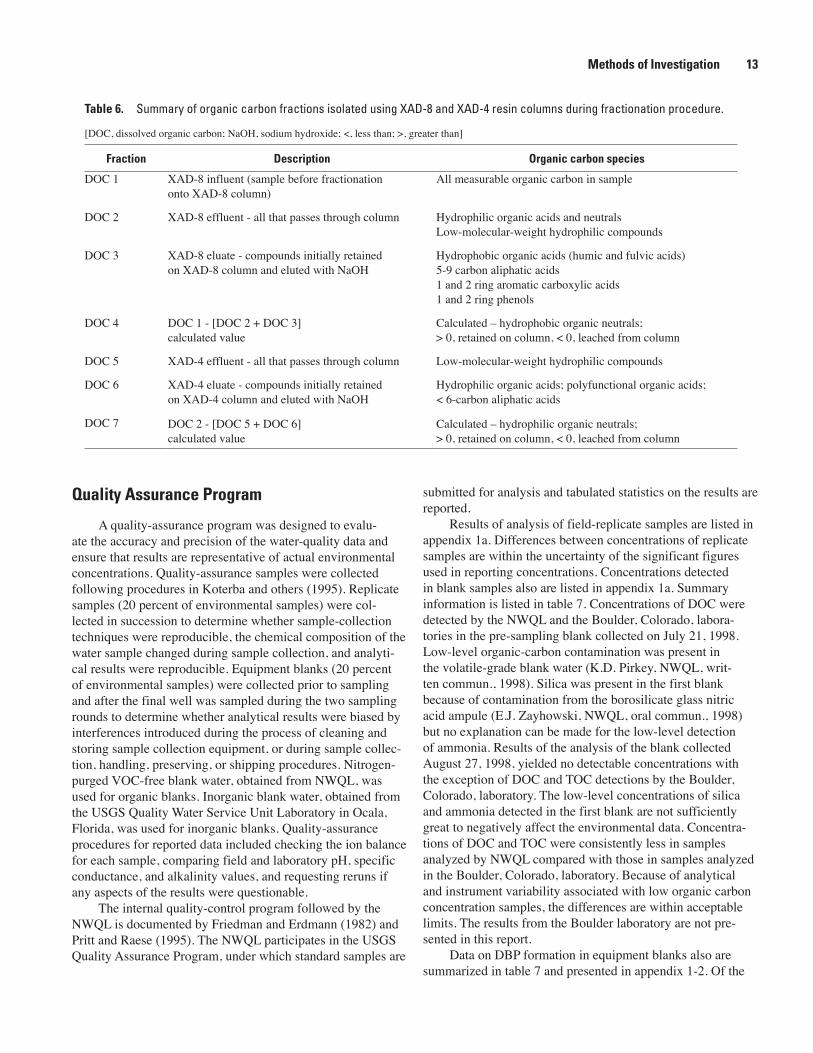
The hydrophobic fraction was isolated from all the hydrophilic fractions in the remainder (14) of the samples, using only the XAD-8 resin columns. For these samples, only the fractions DOC 1 (the influent solution), DOC 2 (hydro-philic organic acids), DOC 3 (hydrophobic organic acids), and DOC 4 (hydrophobic organic neutrals) are available (fig. 3). The concentration of hydrophobic neutral compounds, which are retained on the XAD-8 resin, can be calculated (table 5), as can the hydrophilic neutral compounds (fraction DOC 7), which are retained on the XAD-4 resin columns used in most of the fractionations.
These calculated concentrations should have a positive or zero value. A positive value represents the concentration of neutral compounds retained on one or the other resin columns, whereas a zero value indicates that no neutral compounds are present. A negative value indicates that leaching of organic carbon from the resin column has occurred. Such leaching is not uncommon in samples containing low (about 0.2 mg/L or less) concentrations of DOC. The full fractionation method is summarized in table 6.
Disinfection By-Product FormationUpon arrival at the analyzing laboratory, the 1-L water
samples collected for determination of DBP formation were adjusted to pH 7. The three samples from each site were dosed with sodium hypochlorite (NaOCl), one bottle each at 5, 7.5, and 10 mg/L, respectively, following EPA Standard
Methods listed in table 4. The dosed samples were incubated for 168 hours (seven days) at 25 ºC; then the samples were analyzed for residual chlorine. The sample of each set of three in which the concentration of residual chlorine was closest to 5 mg/L then was analyzed for chlorate (EPA Method 300.0) and four types of post-chlorination DBPs—THMs (EPA Method 524.2), haloacetic acids (HAAs) (EPA Method 552.2), haloacetonitriles (HANs), and chloral hydrate (EPA Method 551.1). The additional 1-L samples collected from selected wells for determination of DBP formation rate were treated as above, but concentrations of DBP were measured after 6-hour and 24-hour incubation periods.
Carbon Fraction Preparation for Determination of Disinfection By-Product Formation
The 1-L samples collected for both fractionation and determination of DBP formation were fractionated onto 20-mL columns according to the procedure described above. DOC and UV-254 were measured following each step in the fractionation procedure (described in figure 3 and table 6). Following the desalting step, these samples were acidified using phosphoric acid (H3PO4) to avoid interferences in the organic-carbon analyzer caused by the presence of HCl.
Splits of the fractionated samples were sent to EHL to be dosed with NaOCl, incubated, and analyzed for DBPs. The concentrations of NaOCl needed to obtain a residual chlorine concentration of 5 mg/L were estimated by laboratory person-nel from the amount of NaOCl with which the corresponding whole-water sample was dosed. After a 168-hour incubation
Table �. Water-quality characteristics and constituents, analytical or measurement methods, and analyzing laboratory for samples from 20 community water-supply wells, New Jersey, 1998-99.
[UV; ultraviolet; nm, nanometers; GC/MS, gas chromatography/mass spectrometry; USEPA, U.S. Environmental Protection Agency; NWQL, National Water Quality Laboratory; NJWSC; New Jersey Water Science Center laboratory; EHL, Environmental Health Laboratory]
Characteristic or constituent Instrumentation and (or) method Laboratory
Temperature Meter FieldpH Meter FieldSpecific conductance Meter FieldDissolved oxygen Meter FieldAlkalinity Incremental titration FieldVolatile organic compounds Purge and trap GC/MS NWQL Nutrients Colorimetry NWQL Major ions; trace elements Inductively coupled plasma spectroscopy NWQLTotal organic carbon Persulfate oxidation NWQL; USGS Boulder, Colo.Dissolved organic carbon UV/persulfate oxidation; persulfate oxidation NWQL; USGS Boulder, Colo.UV absorbance at 254 nm Spectrophotometry –Standard Method 59101 NJWSC; USGS Boulder, Colo.Trihalomethanes USEPA Standard Method 524.21 EHLHaloacetic acids USEPA Standard Method 552.21 EHLHaloacetonitriles USEPA Standard Method 551.11 EHLChlorate USEPA Standard Method 300.01 EHLChloral hydrate USEPA Standard Method 551.11 EHL
1 Eaton and others, 1995
10 Water-Quality, Organic Carbon, and Disinfection By-Product, Water-Supply Wells, New Jersey, 1998-99

period at 25 ºC, the fractions were analyzed for THMs, HAAs, HANs, and total chlorine residual.
Ultraviolet Absorbance MeasurementsOrganic constituents absorb ultraviolet (UV) light in
proportion to their concentration. Measurements of UV-254 are directly related to concentration and the aromaticity of a compound (Eaton and others, 1995). Specific UV absorbance, which is UV-254 normalized to the concentration of DOC (SUVA = UV-254/DOC x 100), relates to the aromaticity. Water samples for UV-254 analysis typically are filtered in
order to avoid absorption interferences by particulate mat-ter. Other interferences in UV absorption may arise from the presence of large concentrations of ferrous iron, nitrate, nitrite, bromide, chlorate, chlorite, and chloramines, as noted in EPA Method 415.3 (Eaton and others, 1995). Consequently, sam-ples with high iron concentrations (> 1,000 µg/L) were filtered twice to remove any iron-bearing particulates. Measurements are made, using a spectrophotometer, by placing an aliquot of sample in a quartz glass cuvette and measuring the absorbance at 254 nanometers. The absorbance value is compared with a standard curve developed by determining absorbance of solu-tions of known, standard concentration.
Table �. Minimum reporting limits for water-quality constituents.
[MRL, minimum reporting limit; mg/L, milligrams per liter; µg/L, micrograms per liter; N, nitrogen; P, phosphorus; DBPs, disin-fection by-products; EHL, Environmental Health Laboratory]
Constituent MRL Constituent MRL
Major ions and trace elements Volatile organic compounds -- continued
Calcium 0.2 mg/L trans-1,2-Dichloroethylene 0.2 µg/L Magnesium 0.004 mg/L Dichloromethane 0.2 µg/L Potassium 0.1 mg/L Dichloropropane 0.2 µg/L Sodium 0.1 mg/L Ethylbenzene 0.2 µg/L Chloride 0.1 mg/L Methyl tert-butyl ether 0.1 µg/L Sulfate 0.1 mg/L Styrene 0.2 µg/L Bromide 0.01 mg/L Tetrachloroethylene 0.2 µg/L Fluoride 0.1 mg/L Tetrachloromethane 0.2 µg/L Iron 10 µg/L Toluene 0.2 µg/L Manganese 4 µg/L 1,1,1-Trichloroethane 0.2 µg/L Silica 0.1 mg/L Trichloroethylene 0.2 µg/L
Nutrients Trichlorofluoromethane 0.2 µg/L Ammonia (as N) 0.02 mg/L 1,1,2-Trichlorotrifluoroethane 0.2 µg/L Ammonia + organic N 0.1 mg/L Vinyl chloride 0.2 µg/L Nitrite (as N) 0.01 mg/L Xylene 0.2 µg/L Nitrite + nitrate (as N) 0.05 mg/L DBPs (analyzed by EHL) Orthophosphorus (as P) 0.01 mg/L Trihalomethanes
Organic carbon Bromoform 0.1 µg/L Dissolved organic carbon 0.1 mg/L Bromodichloromethane 0.1 µg/L Total organic carbon 0.1 mg/L Chloroform 0.1 µg/L
Volatile organic compounds Dibromochloromethane 0.1 µg/L Benzene 0.2 µg/L Haloacetic acids Bromodichloromethane 0.2 µg/L Bromochloroacetic acid 1.0 µg/L Bromoform 0.2 µg/L Dibromoacetic acid 1.0 µg/L Chlorobenzene 0.2 µg/L Dichloroacetic acid 1.0 µg/L Chloroform 0.2 µg/L Monochloroacetic acid 1.0 µg/L Dibromochloromethane 0.2 µg/L Trichloroacetic acid 1.0 µg/L 1,2-Dichlorobenzene 0.2 µg/L Haloacetonitriles 1,3-Dichlorobenzene 0.2 µg/L Bromochloroacetonitrile 0.5 µg/L 1,4-Dichlorobenzene 0.2 µg/L Dibromoacetonitrile 0.5 µg/L Dichlorodifluoromethane 0.2 µg/L Dichloroacetonitrile 0.5 µg/L 1,1-Dichloroethane 0.2 µg/L Trichloroacetonitrile 0.5 µg/L 1,2-Dichloroethane 0.2 µg/L Inorganic compounds 1,1-Dichloroethylene 0.2 µg/L Chloral hydrate 0.5 µg/L cis-1,2-Dichloroethylene 0.2 µg/L Chlorate 10 µg/L
Methods of Investigation 11

XAD-8Column
DOC4
sorbed onto or leached from column
Hydrophobicneutrals
XAD-4Column
DOC7
sorbed onto or leached from column
Hydrophilicneutrals
XAD-4 Eluate - DOC6
XAD-4 Effluent - DOC5
NaOH
Hydrophilic organic acids
Low molecular weight hydrophiliccompounds
XAD-8 Eluate - DOC3NaOH
XAD-8 Effluent - DOC2
Hydrophobic organic acids
Sample In - DOC1
Figure �. Schematic diagram of organic compounds isolated using XAD-8 and XAD-4 resin columns during the fractionation procedure. (DOC, dissolved organic carbon; NaOH, sodium hydroxide)
1� Water-Quality, Organic Carbon, and Disinfection By-Product, Water-Supply Wells, New Jersey, 1998-99
Quality Assurance Program
A quality-assurance program was designed to evalu-ate the accuracy and precision of the water-quality data and ensure that results are representative of actual environmental concentrations. Quality-assurance samples were collected following procedures in Koterba and others (1995). Replicate samples (20 percent of environmental samples) were col-lected in succession to determine whether sample-collection techniques were reproducible, the chemical composition of the water sample changed during sample collection, and analyti-cal results were reproducible. Equipment blanks (20 percent of environmental samples) were collected prior to sampling and after the final well was sampled during the two sampling rounds to determine whether analytical results were biased by interferences introduced during the process of cleaning and storing sample collection equipment, or during sample collec-tion, handling, preserving, or shipping procedures. Nitrogen-purged VOC-free blank water, obtained from NWQL, was used for organic blanks. Inorganic blank water, obtained from the USGS Quality Water Service Unit Laboratory in Ocala, Florida, was used for inorganic blanks. Quality-assurance procedures for reported data included checking the ion balance for each sample, comparing field and laboratory pH, specific conductance, and alkalinity values, and requesting reruns if any aspects of the results were questionable.
The internal quality-control program followed by the NWQL is documented by Friedman and Erdmann (1982) and Pritt and Raese (1995). The NWQL participates in the USGS Quality Assurance Program, under which standard samples are
submitted for analysis and tabulated statistics on the results are reported.
Results of analysis of field-replicate samples are listed in appendix 1a. Differences between concentrations of replicate samples are within the uncertainty of the significant figures used in reporting concentrations. Concentrations detected in blank samples also are listed in appendix 1a. Summary information is listed in table 7. Concentrations of DOC were detected by the NWQL and the Boulder, Colorado, labora-tories in the pre-sampling blank collected on July 21, 1998. Low-level organic-carbon contamination was present in the volatile-grade blank water (K.D. Pirkey, NWQL, writ-ten commun., 1998). Silica was present in the first blank because of contamination from the borosilicate glass nitric acid ampule (E.J. Zayhowski, NWQL, oral commun., 1998) but no explanation can be made for the low-level detection of ammonia. Results of the analysis of the blank collected August 27, 1998, yielded no detectable concentrations with the exception of DOC and TOC detections by the Boulder, Colorado, laboratory. The low-level concentrations of silica and ammonia detected in the first blank are not sufficiently great to negatively affect the environmental data. Concentra-tions of DOC and TOC were consistently less in samples analyzed by NWQL compared with those in samples analyzed in the Boulder, Colorado, laboratory. Because of analytical and instrument variability associated with low organic carbon concentration samples, the differences are within acceptable limits. The results from the Boulder laboratory are not pre-sented in this report.
Data on DBP formation in equipment blanks also are summarized in table 7 and presented in appendix 1-2. Of the
Table �. Summary of organic carbon fractions isolated using XAD-8 and XAD-4 resin columns during fractionation procedure.
[DOC, dissolved organic carbon; NaOH, sodium hydroxide; <, less than; >, greater than]
Fraction Description Organic carbon species
DOC 1 XAD-8 influent (sample before fractionation onto XAD-8 column)
All measurable organic carbon in sample
DOC 2 XAD-8 effluent - all that passes through column Hydrophilic organic acids and neutralsLow-molecular-weight hydrophilic compounds
DOC 3 XAD-8 eluate - compounds initially retained on XAD-8 column and eluted with NaOH
Hydrophobic organic acids (humic and fulvic acids)5-9 carbon aliphatic acids1 and 2 ring aromatic carboxylic acids1 and 2 ring phenols
DOC 4 DOC 1 - [DOC 2 + DOC 3] calculated value
Calculated – hydrophobic organic neutrals; > 0, retained on column, < 0, leached from column
DOC 5 XAD-4 effluent - all that passes through column Low-molecular-weight hydrophilic compounds
DOC 6 XAD-4 eluate - compounds initially retained on XAD-4 column and eluted with NaOH
Hydrophilic organic acids; polyfunctional organic acids;< 6-carbon aliphatic acids
DOC 7 DOC 2 - [DOC 5 + DOC 6] calculated value
Calculated – hydrophilic organic neutrals;> 0, retained on column, < 0, leached from column
Methods of Investigation 1�

Table �. Summary of types, purpose, and results of quality-assurance and quality-control analyses for water-quality samples from 20 community water-supply wells, New Jersey, 1998-99.
[NWQL, U.S. Geological Survey National Water Quality Laboratory; NJWSC, New Jersey Water Science Center; EHL, Environmental Health Laboratory; VOC, volatile organic compound; DOC, dissolved organic carbon; TOC, total organic carbon; mg/L, milligrams per liter; MRL, method reporting limit; DBPs, disinfection by-products; THMs, trihalomethanes; HAAs, haloacetic acids; UV-254, ultraviolet absorbance at 254 nanometers]
Type of sample: Laboratory used and number of samples
(x)
Purpose, results, and conclusions
Blanks Purpose: To determine whether analytical results may be biased by interferences introduced during equipment cleaning and storage, sampling procedures, shipping, or laboratory analysis.
Source Water: NWQL(2)
Results: Organics: No VOCs detected in blank. NWQL: DOC and TOC detected at 0.2 mg/L in one sample using VOC blank water assayed at 0.2 mg/L DOC. Inorganics: Ammonia detected at 0.022 mg/L, MRL 0.02 mg/L; silica 0.14 mg/L, MRL, 0.10 mg/L in one sample. Silica source
is borosilicate glass nitric acid ampule.Conclusions: Equipment cleaning and storage, field-sampling methods, and laboratory analytical techniques did not introduce
any significant biases in the results.Boulder, Colorado (2)
Results: Organics: Concentrations of DOC and TOC were from 0.4 to 0.5 mg/L for blanks. No absorbance was measured in UV-254
analysis. Conclusions: Organics: Boulder, Colorado: Concentrations of TOC and DOC were consistently greater than those determined by NWQL.
Detections of DOC and TOC in blanks from 1998 may explain some DBP detections in blanks chlorinated by EHL. UV-254 results were reproducible; no bias is introduced.
New Jersey Water Science Center laboratory (2)
Results: One UV-254 of 0.002, less than any environmental samples.Conclusions: UV-254 results were reproducible; no bias is introduced.
Disinfection by-products:EHL (2)
Results: Organics: THMs and HAAs were detected in blanks; some detections may result from organic carbon contamination of blank
water.Inorganics: High concentrations of chlorate and chloral hydrate were detected in several blanks; all blanks contained detectable
levels of these two constituents.Conclusions: Organics: Concentrations of organic DBPs were less than some of the environmental concentrations. If the detections result
from organic carbon contamination of the blank water, then environmental sample concentrations are presumed to be unaffected. Inorganics: The environmental data cannot be interpreted because of the high concentrations of both chlorate and chloral
hydrate in the blanks.
Replicates Purpose: To determine whether samples collected in succession are homogeneous, sample collection techniques and laboratory analytical techniques are reproducible.
Source Water:NWQL, (2)
Results: Organics and Inorganics: Replicates were within expected range of reproducibility.Conclusions: Analytical results were reproducible, no bias is introduced.
Boulder, Colorado(2)
Results: Organics: Organic-carbon replicates were within expected range of reproducibility; one UV-254 replicate had 40 percent variability.Conclusions: Organic-carbon results were reproducible; no bias is introduced. Some UV-254 measurements may be affected by high iron concentrations.
New Jersey Water Science Center laboratory (2)
Results: Replicates were within expected range of reproducibility.Conclusions: Analytical results were reproducible; no bias is introduced.
Disinfection by-products:EHL(2)
Results:Organics: High variability in concentrations of HAA in three of four replicate sets.Inorganics: Replicates were within expected range of reproducibility.Conclusions: Organics: HAA data need to be interpreted qualitatively.Inorganics: Analytical results were reproducible, but interpretation is not possible because of high concentrations in blanks.
1� Water-Quality, Organic Carbon, and Disinfection By-Product, Water-Supply Wells, New Jersey, 1998-99
THMs, chloroform was detected in all blanks at concentra-tions ranging from 0.7 to 6.8 µg/L; bromodichloromethane and dibromochloromethane were detected at 0.8 and 0.1 µg/L, respectively, in one blank. Eight environmental samples contained chloroform at a concentrations less than the high blank concentration. Four of the five HAAs (bromochloro-acetic acid, dichloroacetic acid, monochloroacetic acid, and trichloroacetic acid) were detected in from one to three of the four blank samples. Some of the HAA detections in the blanks were less than the environmental samples, but many were at similar levels. Low-level organic carbon contamina-tion of the blank water may be the cause of the detections of chloroform and HAAs in the blanks from 1998. No HANs were detected in the blank samples. Chlorate was detected in the blank samples at concentrations ranging from 95 to 2,100 µg/L. Chloral hydrate was detected in the blank samples at concentrations ranging from 1.2 to 120 µg/L—the concentra-tion of 120 µg/L was reported as “high biased,” being more than an order of magnitude greater than the high concentration in the environmental samples. Because of the wide range and high bias of concentrations in the blanks, interpretation of the chlorate and chloral hydrate data for environmental samples is not possible; thus, chlorate and chloral hydrate incubation data for environmental samples are not reported.
Quality of Source Water to Community Water-Supply Wells
The water samples that were collected from the 20 com-munity water-supply wells are representative of the water withdrawn from the well before treatment. The water that reaches the open interval of a large-volume well, such as a supply well, may originate, in part or entirely, from areas outside the immediate area of the wellhead, depending upon factors such as well depth, aquifer characteristics, location of the well in the local flow system, and stresses created on that flow system by other pumped wells. Because supply wells withdraw large volumes of water, water containing contami-nants originating in part of the contributing area to the well may be diluted by uncontaminated water from other parts of the contributing area as mixing of water takes place in the immediate vicinity of, or within, the well bore. Consequently, concentrations of contaminants in water from supply wells may not represent the maximum concentrations in at least some part of the source water.
Results of the water-quality analyses indicate that con-taminants are present at concentrations that exceed MCLs in water from some of the wells sampled, and pH and constitu-ents exceed New Jersey SMCLs in water from several wells. In other wells, however, several constituents that are consid-ered contaminants were present at elevated levels that did not exceed established water-quality standards.
Volatile Organic Compounds
No VOCs were detected in water from the wells in confined aquifers of the Coastal Plain (app. 2), an anticipated result, as the four wells are located more than 30 mi down-gradient from the outcrop areas of the aquifers and withdraw water that is several thousands of years old. VOCs were detected in water from all the wells in unconfined aquifers, however. Of the aromatic VOCs (those containing one or more benzene rings), the most common are components of gasoline and other petroleum compounds; these often are referred to as BTEX—for benzene, toluene, ethylbenzene, and xylenes. Ben-zene was the only BTEX compound detected; it was detected in water from wells in the unconfined aquifers. Benzene was detected at a concentration less than the MRL in water from a well (030460) completed in a bedrock aquifer and a concentra-tion of 0.5 µg/L—less than the MCL of 1 µg/L—in water from a well (291264) completed in a Coastal Plain aquifer. Other aromatic VOCs—1,2-dichlorobenzene, 1,3-dichlorobenzene, and 1,4-dichlorobenzene—were detected, but only in water from the Coastal Plain well (291264) in which benzene was detected (app. 2).
Commonly detected aliphatic compounds include chlo-rinated solvents such as tetrachloroethylene (PCE), trichloro-ethylene (TCE), and the compound currently used to oxygen-ate gasoline— methyl tert-butyl ether (MTBE). At least one aliphatic VOC was detected in water from each well in the unconfined aquifers (app. 2). The most commonly detected aliphatic VOC was MTBE, in water from 13 of the 16 wells in unconfined aquifers (fig. 4a); none of the concentrations exceeded the MCL of 70 µg/L, however. TCE, the next most commonly detected compound, was present in water from 11 of the 16 wells in the unconfined aquifers. Concentrations of TCE exceeded the MCL (1 µg/L) in water from six wells, ranging from 1.32 to 43 µg/L (fig. 4b). Other compounds with high detection frequencies in water from the wells in unconfined aquifers were 1,1,1-trichloroethane (10 wells), 1,1-dichloroethane and cis-1,2-dichloroethylene (9 wells each), and PCE (8 wells). None of the first three compounds were present at concentrations that exceeded MCLs (30, 50, 70, and 1 µg/L, respectively), but concentrations of PCE exceeded the MCL in water from five of the eight wells (fig. 4c). TCE and PCE exceeded MCLs in water from more wells in bedrock aquifers than in water from wells in either glacial or Coastal Plain aquifers. The concentration of 1,2-dichloro-ethane exceeded the MCL (2µg/L) in water from one Coastal Plain well, but not in water from the other six wells in which it was detected. Carbon tetrachloride was detected in water from three wells, exceeding the MCL (2µg/L) in water from one well (030460) in a bedrock aquifer.
The compound cis-1,2-dichloroethylene is a degradation product of PCE and TCE; its presence, therefore, indicates that biodegradation of the parent compounds is occurring in the aquifers. A further degradation product, vinyl chloride, was not detected in water from any of the sampled wells, however.
Quality of Source Water to Community Water-Supply Wells 1�

Glac
ial
Unco
nfin
ed C
oast
al
Plai
n
Bedr
ock
Conf
ined
Coa
stal
Pl
ain
EXPL
ANAT
ION
AQUI
FER
TYPE
2700
80 2701
47 2701
55 2701
82 3904
51 0500
3907
0177 07
0368 15
0207 23
0195 29
1264 01
0039 01
0600 09
0136 15
0276 03
0301 03
0460 13
0098 21
0402 35
0083
0.00
1
0.010.1110
CONCENTRATION OF CHLOROFORM, IN MICROGRAMS PER LITER
WEL
L N
UM
BER
100
dc
2700
80 2701
47 2701
55 2701
82 3904
51 0500
3907
0177 07
0368 15
0207 23
0195 29
1264 01
0039 01
0600 09
0136 15
0276 03
0301 03
0460 13
0098 21
0402 35
0083
0.00
1
0.1110100
CONCENTRATION OF PCE, IN MICROGRAMS PER LITER
WEL
L N
UM
BER
0.01
b
2700
80 2701
47 2701
55 2701
82 3904
51 0500
3907
0177 07
0368 15
0207 23
0195 29
1264 01
0039 01
0600 09
0136 15
0276 03
0301 03
0460 13
0098 21
0402 35
0083
0.00
1
0.010.1110
CONCENTRATION OF TCE, IN MICROGRAMS PER LITER
WEL
L N
UM
BER
100
aN
ew J
erse
y D
rinki
ng W
ater
Sta
ndar
d =
70 m
icro
gram
s pe
r lite
r
2700
80 2701
47 2701
55 2701
82 3904
51 0500
3907
0177 07
0368 15
0207 23
0195 29
1264 01
0039 01
0600 09
0136 15
0276 03
0301 03
0460 13
0098 21
0402 35
0083
0.00
1
0.1110100
CONCENTRATION OF MTBE, IN MICROGRAMS PER LITER
WEL
L N
UM
BER
0.01
MCL
= 1
mic
rogr
am p
er li
ter
MCL
= 1
mic
rogr
am p
er li
ter
TTH
M M
CL =
80
mic
rogr
ams
per l
iter
Figu
re �
. Co
ncen
tratio
ns o
f (a)
met
hyl t
ert-b
utyl
eth
er (M
TBE)
, (b)
tric
hlor
oeth
ylen
e (T
CE),
(c) t
etra
chlo
roet
hyle
ne (P
CE),
and
(d) c
hlor
ofor
m in
wat
er fr
om 2
0 co
mm
unity
w
ater
-sup
ply
wel
ls in
New
Jer
sey,
by
aqui
fer t
ype,
199
8-99
. (M
CL, m
axim
um c
onta
min
ant l
evel
; TTH
M, t
otal
trih
alom
etha
nes;
TTH
M M
CL is
the
sum
of b
rom
ofor
m,
brom
odic
hlor
omrth
ane,
dib
rom
ochl
orom
etha
ne, a
nd c
hlor
ofor
m c
once
ntra
tions
)
1� Water-Quality, Organic Carbon, and Disinfection By-Product, Water-Supply Wells, New Jersey, 1998-99

Of the THMs, chloroform was detected in water from 12 wells completed in unconfined aquifers. Most detections were at low concentrations (0.05-0.93 µg/L) in samples from nine of the wells, but this compound was present at a concentration of 2.4 µg/L in water from a well in a bedrock aquifer, at 4.10 µg/L in water from a well in a glacial aquifer, and at 37.9 µg/L in water from a well in a Coastal Plain aquifer (fig. 4d). In addition, a low concentration of bromodichloromethane (0.5 µg/L) was detected in water from one Coastal Plain well—and at estimated concentrations less than the MRL in water from two other wells. Thus, two compounds that occur as DBPs in treated drinking water also are present in the untreated water.
Nutrients
Nutrients is a term that includes compounds such as ammonia, nitrate, and phosphate. Ammonia was not detected in water from wells in the bedrock and glacial aquifers, but was detected in water from all sampled wells in the Coastal Plain aquifers (fig. 5a). Overall, water from wells in the unconfined aquifers contained higher concentrations of ammonia than did water from wells in the confined aquifers; the median concentrations were 0.54 and 0.16 mg/L, respec-tively. Concentrations of ammonia in water from the uncon-fined aquifers are a likely indication of anthropogenic inputs. The presence of ammonia in water from wells in the confined aquifers is indicative of a nitrogen source in the aquifer, as the water tapped by these wells is too old to have been affected by human activities. Naturally occurring organic materials in the sediments, which have been converted to lignite during the millions of years since deposition, are a likely source of nutrients. (The detections of orthophosphate in water from wells in the confined aquifers (app. 2) also could be indicative of organic matter in the aquifers.) Reducing conditions exist in the parts of the confined aquifers tapped by the sampled wells, as there is little if any DO present in the water; thus, the nitrogen in these aquifers is not oxidized to nitrate, but is present as ammonia. There is no New Jersey or Federal MCL for ammonia in drinking water, but its presence in drinking water is of interest because, under oxidizing conditions, it can be converted to nitrate.
Nitrite (as N) was detected in water from only one well in a glacial aquifer, at a concentration of 0.03 mg/L, which does not exceed the MCL (1 mg/L as N). Nitrate was not detected in water from any of the wells in confined aquifers, but was detected in water from five of the six wells in unconfined Coastal Plain aquifers and in water from all wells in bedrock and glacial aquifers. Concentrations of nitrate were less than the drinking water MCL of 10 mg/L as N in all samples; the highest concentrations—3.63 and 4.86 mg/L—were in water from wells in bedrock aquifers; one well in a Coastal Plain aquifer yielded water containing 3.19 mg/L (fig. 5b). Madison and Brunett (1985) indicate that concentrations of nitrate in ground water that exceed 3 mg/L represent effects of human activities, whereas Perlmutter and Koch (1972) state that
concentrations in excess of 1 mg/L are indications of nitrogen inputs by human activities. Using the latter criterion, water from all wells in the bedrock aquifers, from three of the five wells in glacial aquifers, and from two wells in the unconfined Coastal Plain aquifers has been affected by inputs of nitrogen resulting from human activities. Although concentrations of nitrate were low in three other wells in unconfined Coastal
Glacial
Unconfined Coastal Plain
Bedrock
Confined Coastal Plain
EXPLANATION
AQUIFER TYPE
0.001
0.01
0.1
1
10
CON
CEN
TRAT
ION
OF
AMM
ONIA
, IN
MIL
LIGR
AMS
PER
LITE
R
WELL NUMBER
2700
80
2701
47
2701
55
2701
82
3904
51
0500
39
0701
77
0703
68
1502
07
2301
95
2912
64
0100
39
0106
00
0901
36
1502
76
0303
01
0304
60
1300
98
2104
02
3500
83
a
2700
80
2701
47
2701
55
2701
82
3904
51
0500
39
0701
77
0703
68
1502
07
2301
95
2912
64
0100
39
0106
00
0901
36
1502
76
0303
01
0304
60
1300
98
2104
02
3500
830.001
0.01
0.1
1
10
CON
CEN
TRAT
ION
OF
NIT
RITE
+ N
ITRA
TE, I
N
MIL
LIGR
AMS
PER
LITE
R
b
WELL NUMBER
Maximum contaminant level = 10 milligrams per liter
Figure �. Concentrations of (a) ammonia and (b) nitrite + nitrate in water from 20 community water-supply wells in New Jersey, by aquifer type, 1998-99.
Quality of Source Water to Community Water-Supply Wells 1�
Plain aquifers, concentrations of DO also were low (0.1 mg/L) in water from those wells, and concentrations of ammonia were high (0.72-1.35 mg/L). Consequently, nitrate probably had been reduced (or ammonia never oxidized), and nitrogen inputs likely were in the range indicating human activities rather than natural conditions.
Concentrations of phosphate ranged from undetectable (at 0.01 mg/L as P) to 0.29 mg/L as P. The highest concen-trations were in water from wells completed in the confined Coastal Plain aquifers, the lowest (undetected) in water from wells in three unconfined Coastal Plain aquifers (app. 2). The materials that compose two of these latter unconfined Coastal Plain aquifers (the Kirkwood Formation and Cohansey Sand; and the Oldbridge Formation, part of the Potomac-Raritan-Magothy aquifer system) are primarily quartz sand with minor amounts of organic matter. The third, the unconfined updip part of the Lower Potomac-Raritan-Magothy aquifer system, is also primarily quartz sand. Within this lower part of the aquifer system, silt and clay layers contain sporadic occur-rences of organic materials, including woody fragments, but wells are unlikely to be completed in these layers. The other Coastal Plain formations (Magothy, sand units of the Raritan, Lower Kirkwood) that form unconfined and confined aquifers all contain carbonaceous materials (Owens and Sohl, 1969). The highest concentrations of phosphate were in water from the downdip (confined) Lower Kirkwood aquifer, which con-tains not only finely comminuted carbonaceous material, but fossils that indicate a marine origin. Thus, it is likely that the concentrations of phosphate in the Coastal Plain aquifers are mainly related to the abundance, or lack thereof, of naturally occurring organic materials.
Concentrations of phosphate in water from wells com-pleted in the bedrock aquifers were low but detectable. The soils developed on the bedrock formations are, for the most part, rich in clays to which anthropogenic phosphate from land-surface or subsurface sources would likely adsorb. Phos-phorus apparently is present in these sedimentary formations, because the mineral apatite (Ca5(PO4)3) is reported in contact-metamorphosed rocks adjacent to diabase intrusions (Van Houten, 1969). The concentrations of phosphate in water from the bedrock wells may derive, at least in part, from naturally occurring materials.
Concentrations of phosphate in water from the gla-cial-aquifer wells were in the same range (0.01-0.10 mg/L) as those in water from the bedrock wells. Both natural and anthropogenic sources are possible; assessing potential geo-logic inputs is complicated by the heterogeneous nature of geologic sources for the glacial deposits.
Major and Minor Ions, Trace Elements, and pH
Concentrations of chloride in water from wells completed in the Coastal Plain aquifers were all less than 50 mg/L; the lowest concentrations (less than 10 mg/L) were in water from three of the four wells completed in the confined Atlantic City
800-foot sand (a unit within the Kirkwood-Cohansey aquifer system). Concentrations in water from four of the five wells in glacial aquifers exceeded 50 mg/L; the concentrations of chloride in one sample was 113 mg/L. Concentrations of chlo-ride in water from three of the five wells in bedrock aquifers exceeded 50 mg/L; the concentration in water from one well (030301) was 634 mg/L (fig. 6a), more than twice the SMCL of 250 mg/L, and substantially higher than concentrations of chloride previously reported for ground water in northeastern New Jersey (Szabo and others, 1989). The concentrations of sodium in water from this well was 209 mg/L—more than 4 times the SMCL of 50 mg/L. Water from this well also contained concentrations of PCE and TCE that exceeded their respective MCLs; clearly, contaminants from human activi-ties have affected the quality of water that is being withdrawn from this well. These results indicate that anthropogenic inputs also could account for the elevated concentrations of sodium and chloride.
Concentrations of sodium in water from 15 of the 16 wells completed in unconfined aquifers, and 3 of the 4 wells in confined aquifers were less than 50 mg/L (fig. 6b). Water from the well (150276) in the confined Potomac-Raritan-Magothy aquifer system contained sodium at a concentration of 67.3 mg/L, however, with a corresponding chloride concentration of 27.9 mg/L. Additionally, the concentration of fluoride in water from this well was the highest (1.4 mg/L) measured in the water sampled during this study; this concentration did not exceed the MCL. The concentrations of fluoride in water from well 150276 undoubtedly are derived from natural sources.
Concentrations of sulfate, with one exception, were less than 60 mg/L in water from wells in all the unconfined aquifers and less than 20 mg/L in water from two Coastal Plain wells in unconfined aquifers. The water from the wells in confined Coastal Plain aquifers contained concentrations of sulfate at less than 20 mg/L. The highest concentration (623 mg/L) was measured in water from a well (350083) in a northeastern New Jersey bedrock aquifer, and exceeded the SMCL of 250 mg/L (fig. 6c; app. 2). In this aquifer (part of the Passaic Formation), concentrations of this magnitude are most likely to be natural, resulting from dissolution of sulfate min-erals such as gypsum (Szabo and others, 1989). The concen-tration of calcium in the sample from this well also was high (271 mg/L), supporting the likelihood that aquifer minerals (gypsum, in this case) substantially affect the chemistry of the ground water.
Fluoride was detected in water from only one well in the bedrock aquifers, from two wells in unconfined Coastal Plain aquifers, and in none of the wells in glacial aquifers. Water from all four of the confined Coastal Plain aquifers contained fluoride at detectable concentrations (0.2-1.4 mg/L). No con-centrations were greater than the MCL.
Bromide was detected in water from all 18 wells for which it was analyzed. For the entire set of 20 wells, concen-trations of bromide tended to increase as concentrations of chloride increased (r2 = 0.38, p = 0.006); for wells in a par-ticular aquifer type, the relation was strongest for the wells in
18 Water-Quality, Organic Carbon, and Disinfection By-Product, Water-Supply Wells, New Jersey, 1998-99

confined Coastal Plain aquifers (fig. 7). The concentration of bromide can affect the concentration of the bromide-contain-ing species of the THMs.
Concentrations of iron in water from the 20 wells ranged widely—from less than the MRL (10 µg/L) to nearly 7,000 µg/L. Although soils and aquifer materials may contain sub-stantial amounts of iron, it is commonly present in minerals of low solubility. Low pH and reducing conditions in the aquifer can promote dissolution of minerals and solubilization of iron, however. The highest concentrations of iron, which exceeded the SMCL (0.3 mg/L), were in acidic water from four wells in unconfined Coastal Plain aquifers where the concentrations of DO (and nitrate) were low. Concentrations of iron in water from the confined Coastal Plain aquifers were at least an order of magnitude less than those in water from the unconfined Coastal Plain aquifers. Iron was not detected (reported as <10 µg/L) in water from all wells in the bedrock aquifers, one well in unconfined Coastal Plain aquifers, and two wells in glacial aquifers; concentrations were estimated at less than 10 µg/L in water from two other glacial-aquifer wells (app. 2).
The chemical behavior of manganese shows some simi-larities to that of iron. Concentrations of manganese were low (estimated at 2-3 µg/L) or not detected in water from all wells
c
1
10
100
1000
WELL NUMBER
CON
CEN
TRAT
ION
OF
SULF
ATE,
IN
MIL
LIGR
AMS
PER
LITE
R
2700
80
2701
47
2701
55
2701
82
3904
51
0500
39
0701
77
0703
68
1502
07
2301
95
2912
64
0100
39
0106
00
0901
36
1502
76
0303
01
0304
60
1300
98
2104
02
3500
83
Secondary maximum contaminant level = 250 milligrams per liter
b
1
10
100
1000
WELL NUMBER
CON
CEN
TRAT
ION
OF
SODI
UM, I
N
MIL
LIGR
AMS
PER
LITE
R
2700
80
2701
47
2701
55
2701
82
3904
51
0500
39
0701
77
0703
68
1502
07
2301
95
2912
64
0100
39
0106
00
0901
36
1502
76
0303
01
0304
60
1300
98
2104
02
3500
83
Secondary maximum contaminant level = 50 milligrams per liter
Glacial
Unconfined Coastal Plain
Bedrock
Confined Coastal Plain
EXPLANATION
AQUIFER TYPE
a
1
10
100
1000
WELL NUMBER
CON
CEN
TRAT
ION
OF
CHLO
RIDE
, IN
M
ILLI
GRAM
S PE
R LI
TER
2700
80
2701
47
2701
55
2701
82
3904
51
0500
39
0701
77
0703
68
1502
07
2301
95
2912
64
0100
39
0106
00
0901
36
1502
76
0303
01
0304
60
1300
98
2104
02
3500
83
Secondary maximum contaminant level = 250 milligrams per liter
Figure �. Concentrations of (a) chloride, (b) sodium, and (c) sulfate in water from 20 community water-supply wells in New Jersey, by aquifer type, 1998-99.
0.25
0.20
0.15
0.10
0.05
0.00
BRO
MID
E CO
NCE
NTR
ATIO
N, I
N M
ILLI
GRA
MS
PER
LITE
R
CHLORIDE CONCENTRATION, IN MILLIGRAMS PER LITER
1 10 100 1,000
Glacial
Unconfined Coastal Plain
Bedrock
Confined Coastal Plain
EXPLANATION
R2 = 0.38p-value = 0.006
AQUIFER TYPE
Figure �. Relation of concentrations of bromide to concentrations of chloride in water from 20 community water-supply wells in New Jersey, 1998-99.
Quality of Source Water to Community Water-Supply Wells 19

in the bedrock aquifers, one well in an unconfined Coastal Plain aquifer, and four wells in glacial aquifers. Concentra-tions also were generally low (20 µg/L or less) in water from the confined aquifers, but were high (70-1,830 µg/L) in water from five wells in unconfined Coastal Plain aquifers, including the four yielding water with high concentrations of iron (app. 2). The high concentrations of manganese all exceeded the SMCL of 50 µg/L.
The pH of water from 14 of the 20 wells was generally near neutral to slightly alkaline (6.7-8.1; median 7.4), but water from wells in the unconfined Coastal Plain aquifers was strongly to slightly acidic (pH 4.7-6.5). The pH of water from five of the six wells in the unconfined Coastal Plain aquifers was outside the New Jersey optimum range for pH in drinking water (6.5-8.5; table 2).
Organic Carbon
Concentrations of DOC in the ground-water samples were about the same as those of TOC, indicating that there was little particulate organic matter present. Water from wells with high-volume output is less likely to be turbid (contain-ing particles) because there is less opportunity for particles to accumulate than in water from wells pumped only sporadi-cally. Concentrations of both TOC and DOC were less than 2 mg/L in all samples, with the highest values being measured in water from several wells in unconfined Coastal Plain and glacial aquifers (app. 2). The sample from one glacial-aquifer well (270147) contained not only high concentrations of DOC (1.40 mg/L), but several VOCs, with some concentrations exceeding MCLs.
UV-254 values were generally higher in ground water from the Coastal Plain aquifers, both confined and unconfined, than those in water from the bedrock and glacial aquifers, in some cases by an order of magnitude (fig. 8). Only for the sample from one glacial-aquifer well (270147) was the UV-254 value comparable to the UV-254 measurements for samples from the Coastal Plain wells.
Dissolved Organic Carbon Fractions and Disinfection By-Products
DOC consists of a variety of compounds that can be grouped by fractionation techniques on the basis of their chemical behavior. Interactions of DOC and its groups of com-pounds with chlorine to form DBPs can be examined through laboratory incubation studies.
Organic Carbon Fractions
Humic substances constitute the largest proportion of the compounds that compose DOC. They are found in all terres-trial and aquatic environments. Humic substances constitute
a class of yellow-black decomposition products of plant and animal organic matter; they are refractory and resistant to deg-radation (Aiken, 1985). The physical and chemical characteris-tics of humic substances are, as yet, not well defined, but they have been shown to have high molecular weights and carbon skeletons with a high degree of aromaticity. Humic substances typically are divided into operationally defined fractions on the basis of their solubility in dilute acids and bases. Fulvic acids are soluble at any pH; humic acids precipitate from aqueous solutions at a pH less than 2, and humin is insoluble at any pH. Both humic and fulvic acids are strong complexing agents; fulvic acid is a stronger reducing agent than is humic acid (Thurman, 1985). Humic substances are hydrophobic, thus they are able to transport other organic contaminants that also are hydrophobic (Wong and others, 2002). Moreover, humic substances are involved in the generation of DBPs (Rook, 1974): in fact, they are considered primary precursors of DBPs (Liang and Singer, 2003). Hydrophobic compounds are mostly removed, however, if water is treated with metal salts that coagulate much of the organic matter present (Wong and others, 2002).
Glacial
Unconfined Coastal Plain
Bedrock
Confined Coastal Plain
EXPLANATION
2700
80
2701
47
2701
55
2701
82
3904
51
0500
39
0701
77
0703
68
1502
07
2301
95
2912
64
0100
39
0106
00
0901
36
1502
76
0303
01
0304
60
1300
98
2104
02
3500
83
WELL NUMBER
0.02
0.025
0.03
0.035
0.04
UV-2
54 A
BSOR
BAN
CE, A
S 1/
CEN
TIM
ETER
S0.00
0.005
0.01
0.015
AQUIFER TYPE
Figure 8. Values of ultraviolet absorbance at 254 nanometers (UV-254) in water from 20 community water-supply wells in New Jersey, by aquifer type, 1998-99.
�0 Water-Quality, Organic Carbon, and Disinfection By-Product, Water-Supply Wells, New Jersey, 1998-99

Hydrophilic acids constitute the other major component of DOC; carbohydrates, carboxylic acids, and amino acids are present in lesser amounts (Thurman, 1985). Hydrophilic acids are a complex mixture of organic acids, and are mostly anionic, although some are uncharged.
Because concentrations of DOC in the ground-water samples were low (generally about 1 mg/L or less), differ-ences in the DOC fractions in most water samples were small. Concentrations that differ by only 0.1 mg/L actually may not be different, as there is some analytical error associated with each determination. For water from the wells in Coastal Plain aquifers, concentrations of combined hydrophilic acids and neutrals, and low-molecular-weight hydrophilic compounds (the XAD-8 effluent (passes through the XAD8 column)—DOC 2) generally were as high as, or slightly higher than, those of the hydrophobic acids (the XAD-8 eluate (retained on the XAD-8 resin)—DOC 3). In samples from two wells (150207, 150276), however, concentrations of hydrophobic acids were slightly higher than concentrations of the combined hydrophilic/neutral/low-molecular weight fractions. In those samples where the hydrophilic acid fraction (passes through the XAD-8 and is retained on XAD-4 resin—DOC 6) was determined, however, concentrations of hydrophilic acids were less than those of hydrophobic acids (table 8).
Concentrations of combined hydrophilic acids and neu-trals and low-molecular-weight hydrophilic compounds (DOC 2) also were higher than those of hydrophobic acids (DOC 3) in water from wells in bedrock and glacial aquifers, with one exception (well 390451; table 8). In all water samples, the hydrophobic neutral fraction (DOC 4) was negligible. Fractions DOC 5-7 were not determined for samples from the bedrock and glacial wells.
Disinfection By-Products
SourcesFormation of DBPs was attributed to the use of chlorine
in drinking water for the first time in 1974 (Rook, 1974). The DBPs are formed when organic matter in the water reacts with the chlorine (NaOCl) used to disinfect the water used for public supply against disease-causing water-borne organisms, such as E. coli, Cryptosporidium, and Giardia. When first studied, natural organic matter was found to be an important component of the organic material that reacted with chlorine to form DBPs (Stevens and others, 1976). The major chemical species formed by the chlorination are THMs, HAAs, HANs, and chloral hydrate. Inorganic by-products, such as chlorates, also were found to form (Andrews and Ferguson, 1996).
DBPs are formed in a series of steps involving oxida-tion of organic compounds and incorporation of chlorine (and other halogens such as bromine) into the organic matter. The rates of these reactions vary. Studies indicate that some of the more likely organic compounds involved in the reactions that produce DBPs (in particular, THMs) are diketones and phe-
nols (Larson and Weber, 1994). The rate of THM formation is affected by chlorine concentration, bromide concentration, pH, and temperature (Adin and others, 1991).
Formation of Disinfection By-Products During the Laboratory Incubation Study
The concentration of THMs formed as a result of the disinfection of water supplies is known as the trihalomethane formation potential (THMFP) and is defined as the difference in concentration measured after treatment and the concentra-tion (if any) measured in the source water, as in the following equation:
THMFP = THM treated water – THM source water (1)
The concentrations of the THMs measured after a 7-day incubation of the treated water samples (table 9) varied by about two orders of magnitude, depending in part on the initial concentration of one or more THMs in the source water, but mostly on the chemical characteristics of the ground water, which are derived, in part, from characteristics and materials inherent to the aquifer from which the water was drawn.
Although chloroform was detected in source water from 12 of the 20 wells sampled, most concentrations were less than 1 µg/L. Chloroform was not detected in source water from the wells in confined aquifers or in four of the six Coastal Plain wells in unconfined aquifers. Bromodichloromethane was the only other THM detected in source water; it was present at 0.5 µg/L in the sample containing the highest concentration of chloroform (app. 2). Consequently, in most cases, the THMFP reflects all or nearly all of the THMs measured following incubation of the chlorinated water samples. In general, higher concentrations of THMs tend to form in water from the Coastal Plain aquifers than from the other aquifers from which samples were collected. Water from two wells in unconfined Coastal Plain aquifers contained total THMs at concentrations that exceed the Disinfection By-Product Rule MCL of 80 µg/L (table 1).
Using data for all wells, the concentrations of THMs, expressed as THMFP, tended to increase as UV-254 increased (r2 = 0.59) (fig. 9). The trend is controlled mainly by data for wells in glacial and unconfined Coastal Plain aquifers; data for the confined Coastal Plain and bedrock wells showed little or no trend. Regarding data for wells in unconfined Coastal Plain aquifers, concentrations of the individual THMs also tended to increase as specific UV-254 absorbance (UV-254 normalized to the concentration of DOC, or SUVA) increased (fig. 10a, b, c, d); data for wells in other aquifer types showed no trend, or positive or negative trends controlled by outliers. The relation between SUVA and chloroform (fig. 10c) was clearer; data for wells in both unconfined and confined Coastal Plain aquifers showed positive, but different trends.
In 1998, USEPA promulgated a criterion of 2.0 L/mg-m (liter per milligram-meter) for SUVA, which is calculated
Dissolved Organic Carbon Fractions and Disinfection By-Products �1

SUVA (L/mg-m) = [UV-254 (1/cm)/DOC (mg/L)] (2) x 100 (cm/m),
for a supply system’s source water prior to, and after treat-ment (U.S. Environmental Protection Agency, 1998). SUVA calculated for source water from 8 of the 20 wells equaled or exceeded the criterion (table 10). All but one of the eight wells is completed in a Coastal Plain aquifer.
The magnitude of UV-254 is related, not only to con-centration of DOC, but to the degree of aromaticity of the compounds that make up DOC. Measurements of UV-254 generally were larger in water from wells in the Coastal Plain aquifers than from wells in the bedrock aquifers and most of the wells in glacial aquifers. On the basis of the calculated SUVA value, (table 10) the DOC of Coastal Plain ground waters contains more aromatic compounds, in general, than does the DOC in water from the glacial or bedrock aquifers from which water samples were collected. Only one bedrock well (030301) yielded water of substantial aromaticity (but
low concentrations of DOC—hence high SUVA). Water from one well (270147) completed in a glacial aquifer developed high concentrations of THMs, comparable to those in water from the Coastal Plain aquifers. The UV-254 measurement for the sample from that well was high (as was the concentration of DOC); thus, the SUVA value for that sample was compa-rable to SUVA values calculated for samples from the Coastal Plain aquifers. It appears that, with both higher THMFP and higher SUVA values (tables 9 and 10), waters from the Coastal Plain aquifers generally contain more aromatic DOC and gen-erally are more prone to THM formation than water from most of the other aquifers from which samples were drawn. This indicates that, at a first approximation, measurements of UV-254 could be useful in predicting the potential of New Jersey ground water for developing THMs.
Of the THMs formed after chlorination, bromodichloro-methane (CHBrCl2), chloroform (CHCl3), and dibromochlo-romethane (CHBr2Cl) generally were present at comparable concentrations (table 9). Concentrations of bromoform
Table 8. Concentrations of dissolved organic carbon fractions in water samples from 20 community water-supply wells, New Jersey, 1998-99.
[DOC, dissolved organic carbon; mg/L, milligrams per liter; BR, bedrock; GL, glacial; CP, unconfined coastal Plain; CCP, confined Coastal Plain; nf, no fraction determined]
USGS well
number
Aquifer type
Influent, all fractions:
DOC 11 (mg/L)
Hydro-philic acids, neutrals, low
molecular weight compounds: DOC �1
(mg/L)
Hydro-phobic acids:DOC �1
(mg/L)
Hydro-phobic
neutrals: DOC �1
(mg/L)
Low molecular weight com-
pounds:DOC �1
(mg/L)
Hydro-philic acids:DOC �1
(mg/L)
Hydro-philic
neutrals:DOC �1
(mg/L)
030301 BR 1.0 0.6 0.4 0 nf nf nf030460 BR 1.0 0.6 0.3 0.1 nf nf nf130098 BR 1.0 0.6 0.4 0 nf nf nf210402 BR 0.7 0.5 0.4 2-0.2 nf nf nf350083 BR 0.7 0.6 0.3 2-0.2 nf nf nf
270080 GL 1.0 0.7 0.4 2-0.1 nf nf nf270147 GL 1.5 0.8 0.7 0 nf nf nf270155 GL 0.8 0.6 0.3 2-0.1 nf nf nf270182 GL 0.7 0.7 0.2 2-0.2 nf nf nf390451 GL 1.0 0.3 0.4 0.3 nf nf nf
050039 CP 0.8 0.7 0.3 2-0.2 0.5 0.1 0.2070177 CP 1.2 0.6 0.4 0.2 nf nf nf070368 CP 1.1 0.7 0.6 2-0.1 0.2 0.2 0.3150207 CP 1.6 0.7 0.8 2 0.1 0.5 0.3 2-0.2230195 CP 1.5 0.8 0.7 0 0.4 0.2 0.2291264 CP 1.1 0.9 0.5 2-0.3 nf nf nf
010039 CCP 0.9 0.5 0.3 0.1 nf nf nf010600 CCP 0.6 0.4 0.3 2-0.1 nf nf nf090136 CCP 0.8 0.3 0.3 0.2 nf nf nf150276 CCP 0.9 0.4 0.5 0 nf nf nf
1 See table 6 and figure 3 for full description of each DOC fraction.2 Mathematical artifact of the bias and precision of DOC fractionation and analysis scheme mass balance.
�� Water-Quality, Organic Carbon, and Disinfection By-Product, Water-Supply Wells, New Jersey, 1998-99

(CHBr3) were consistently lower than those of the other THMs formed; water from several bedrock aquifers developed higher concentrations than did water from most of the other aqui-fer types. Overall, concentrations of CHBr2Cl and CHBrCl2 generally increased as concentrations of DOC increased (fig. 11a, b), with the trend largely controlled by relations between DOC and concentrations of the brominated compounds in water from glacial and the Coastal Plain aquifers. Relations between CHBr3 and DOC were unclear; only data for the unconfined Coastal Plain wells showed a discernible positive linear trend (not illustrated). Regarding the data for all wells, virtually no relation was observed for the CHCl3 formed after treatment and concentration of DOC (fig. 11c); CHCl3 in water from confined Coastal Plain aquifers showed a negative trend with concentration of DOC. Concentrations of CHCl3 in the incubated samples are considered with caution, however, as this compound was detected in all four blanks chlorinated in 1998 and 1999. It is likely that concentrations of CHCl3 in the
Table 9. Concentrations of trihalomethanes in laboratory chlorinated ground-water samples from 20 community water-supply wells, New Jersey, 1998-99, following a 7-day incubation period.
[Total THMs, sum of bromodichloromethane, bromoform, chloroform, and dibromochloromethane; THMFP, trihalomethane formation potential (Total THMs – Total environmental THMs); BR, bedrock; GL glacial; CP, unconfined Coastal Plain; CCP, confined Coastal Plain; THMs, trihalomethanes; µg/L, micrograms per liter; mg/L, milligrams per liter; nd, no data; Number in parentheses is parameter code used to identify the constituent, property, or character-istic in the U.S. Geological Survey National Water Information System (NWIS) database.]
USGS well
number
Aquifer type
Bromodi-chloro
methane(CHBrCl�)
(µg/L)(99�0�)
Bromoform (CHBr�)
(µg/L)(99�0�)
Chloroform(CHCl�)(µg/L)
(99�0�)
Dibromo-chloro-
methane(CHBr�Cl)
(µg/L)(99�0�)
TotalTHMs(µg/L)
THMFP (µg/L)
Bromide(mg/L)(�18�0)
030301 BR 7.7 5.7 4.8 8.5 27 27 0.19030460 BR 5.7 2.5 6.5 4.9 20 17 0.058130098 BR 4.4 3.1 2.6 5.6 16 15 0.18210402 BR 6.7 3.7 4.9 6.3 22 22 0.083350083 BR 3.2 0.6 3.1 2.5 9.4 9.1 0.098
270080 GL 7.2 1.4 8.2 4.7 21 21 0.048270147 GL 15 1.1 29 7.9 53 53 0.043270155 GL 5.8 2.5 7.5 5.4 21 17 0.053270182 GL 2.8 1.1 2.2 2.8 8.9 8.9 0.062390451 GL 9.4 1.8 6.5 8.2 26 25 0.086
050039 CP 9.1 0.4 54 3.8 67 29 0.045070177 CP 15 1.0 17 7.1 40 40 0.12070368 CP 3.7 1.0 6.2 2.2 13 13 0.051150207 CP 40 5.9 32 30 110 110 0.15230195 CP 29 2.2 35 17 83 83 nd291264 CP 17 0.4 34 5.8 57 56 nd
010039 CCP 8.6 0.2 31 3.2 43 43 0.021010600 CCP 8.8 <0.1 30 2.3 41 41 0.026090136 CCP 14 1.9 22 10 48 48 0.036150276 CCP 17 1.7 18 12 49 49 0.11
chlorinated samples from the community water-supply wells are actually slightly lower than reported.
The chlorine added to disinfect water oxidizes bromide to hypobromous acid, which reacts with components of DOC to produce the bromine-containing DBPs (Liang and Singer, 2003). The concentrations of CHBr3 formed in the treated water samples from 18 of the community water-supply wells increased as the concentrations of bromide in the untreated (source) water increased (bromide was not measured in samples from two wells); the individual trends for samples from the different aquifer types were all generally positive (fig. 12a). Relations with source-water bromide were less strong for the other two bromine-containing THMs, CHBr2Cl (fig. 12b) and CHBrCl2 (not shown). The masses of bromide in the source-water samples are sufficient to produce the amounts of bromine-containing THMs measured in the chlorinated and incubated samples.
Concentrations of HAAs were, in general, lower by factors of 2 to 3 than those of the THMs. As with the THMs,
Dissolved Organic Carbon Fractions and Disinfection By-Products ��

however, concentrations of HAAs were higher in water from wells in the Coastal Plain than in water from wells in bedrock or glacial aquifers, with few exceptions (table 11). Concentra-tions of HAAs in water from well 210402 in a bedrock aquifer were comparable to those in water from the Coastal Plain wells, as were those in water from well 270147 in a glacial aquifer. Water from this latter well also developed high con-centrations of THMs (and contained VOCs at concentrations exceeding MCLs). Of the various HAAs, concentrations of the more highly chlorinated acids were highest; there were few detections of monochloroacetic acid. Because of detections of HAAs in field blanks that were chlorinated and incubated in the laboratory at EHL, concentrations of these compounds in the treated samples from the community water-supply wells are viewed with caution.
Concentrations of the bromine-containing HAAs were comparable to those of the highly chlorinated HAAs in water from most of the wells in bedrock and glacial aquifers, but tended to be lower than those of the highly chlorinated HAAs in water from the Coastal Plain wells. For all wells, relations between concentrations of bromine-containing HAAs such as
bromochloroacetic acid and bromide (r2 = 0.01) were weak, unlike relations between concentrations of CHBr3 and bromide (r2 = 0.49). Relations between bromide and bromochloroacetic acid for samples from wells in the different aquifer types were generally unclear or dominated by outliers.
Concentrations of HANs were undetected in water from several wells. Concentrations of individual HANs were generally less than 4 µg/L. Concentrations of dibromoaceto-nitrile generally were similar to or slightly higher than those of bromochloroacetonitrile and substantially higher than the most highly chlorinated HAN (dichloroacetonitrile), which was detected in water from only four wells (table 12). It would appear that the formation of HANs is driven more by the availability of bromide than that of chlorine. Overall, concen-trations of HANs were substantially lower than those of THMs and HAAs; higher concentrations of HANs tended to develop in water from Coastal Plain wells.
Formation of Disinfection By-Products in Dissolved-Organic-Carbon Fractions
Solutions of DOC fractions in water from some or all of the 20 wells were chlorinated and incubated for seven days: fractions DOC 2 (hydrophilic organic acids and neutrals, and low-molecular-weight hydrophilic compounds), DOC 3 (hydrophobic organic acids), and DOC 6 (hydrophilic organic acids) were determined. Fraction DOC 6 was not isolated in water from the bedrock and glacial wells or six of the Coastal Plain wells; therefore, only the DOC 3 fractions from these wells were chlorinated and incubated. DOC 2 fractions for several Coastal Plain wells also were not chlorinated and incu-bated (table 13). In treated DOC fractions from those selected wells in the Coastal Plain aquifers, concentrations of THMs and HAAs were higher in the DOC 3 fraction, which contains the hydrophobic humic substances, than in the DOC 6 frac-tion, which contains the hydrophilic humic acids (table 13). (Liang and Singer (2003) obtained similar results for selected surface-water drinking supplies.) Concentrations of HANs were negligible in all fractions in which they were determined. In samples from the bedrock and glacial wells, however, concentrations of total THMs in the DOC 3 and DOC 2 frac-tions were generally comparable, within a few micrograms per liter. Concentrations of total HAAs were slightly higher in the DOC 3 fraction than in the DOC 2 fraction in samples from bedrock wells and substantially higher (by factors of 1.5 to 4) in samples from confined Coastal Plain aquifers. Concentrations of total HANs generally were higher in the DOC 2 fraction than the DOC 3 fraction except for sam-ples from glacial aquifers. Overall, concentrations of total THMs were substantially higher in the DOC 3 fraction (the hydrophobic acids) from Coastal Plain water samples (median = 31.6 µg/L) than in the same fraction from bedrock and glacial water samples (respective medians = 16.3 and 15.7 µg/L). The total THM concentration in the DOC 3 fraction of the sample from glacial well 270147 was large (35.2 µg/L),
120
100
80
60
40
0
THM
FP, I
N M
ICRO
GRA
MS
PER
LITE
R
UV-254 ABSORBANCE, IN 1/CENTIMETERS
0 0.01 0.02 0.04
Glacial
Unconfined Coastal Plain
Bedrock
Confined Coastal Plain
EXPLANATION
20
0.03
R2 = 0.59p-value = 0.000
AQUIFER TYPE
Figure 9. Relation of trihalomethane formation potential (THMFP) to ultraviolet absorbance at 254 (UV-254) nanometers in water from 20 community water-supply wells in New Jersey, 1998-99.
�� Water-Quality, Organic Carbon, and Disinfection By-Product, Water-Supply Wells, New Jersey, 1998-99

EXPL
ANAT
ION
Glac
ial
Unco
nfin
ed C
oast
al
Plai
n
Conf
ined
Coa
stal
Pl
ain
Bedr
ock
AQUI
FER
TYPE
d35 30 25 20 15 10 0
02
46
8
SUVA
, IN
LIT
ERS
PER
MIL
LIG
RAM
-MET
ER
CHBr2Cl CONCENTRATION, IN MICROGRAMS PER LITERS
5
0102030405060
CHCl3 CONCENTRATION, IN MICROGRAMS PER LITERS
02
46
8
c
SUVA
, IN
LIT
ERS
PER
MIL
LIG
RAM
-MET
ER
b45 40 35 30 25 20 15 0
02
46
8
SUVA
, IN
LIT
ERS
PER
MIL
LIG
RAM
-MET
ER
CHBrCl2 CONCENTRATION, IN MICROGRAMS PER LITERS
10 5
a7 6 5 4 3 2 1 0
02
46
8
SUVA
, IN
LIT
ERS
PER
MIL
LIG
RAM
-MET
ER
CHBr3 CONCENTRATION, IN MICROGRAMS PER LITERS
Figu
re 1
0.
Rela
tion
of c
once
ntra
tions
of (
a) b
rom
ofor
m (C
HBr 3),
(b) b
rom
odic
hlor
omet
hane
(CHB
rCl 2),
(c) c
hlor
ofor
m (C
HCl 3),
and
(d) d
ibro
moc
hlor
omet
hane
(CHB
r 2Cl) t
o sp
ecifi
c ul
travi
olet
abs
orba
nce
(SUV
A) in
wat
er fr
om 2
0 co
mm
unity
wat
er-s
uppl
y w
ells
in N
ew J
erse
y, 1
998-
99.
Dissolved Organic Carbon Fractions and Disinfection By-Products ��
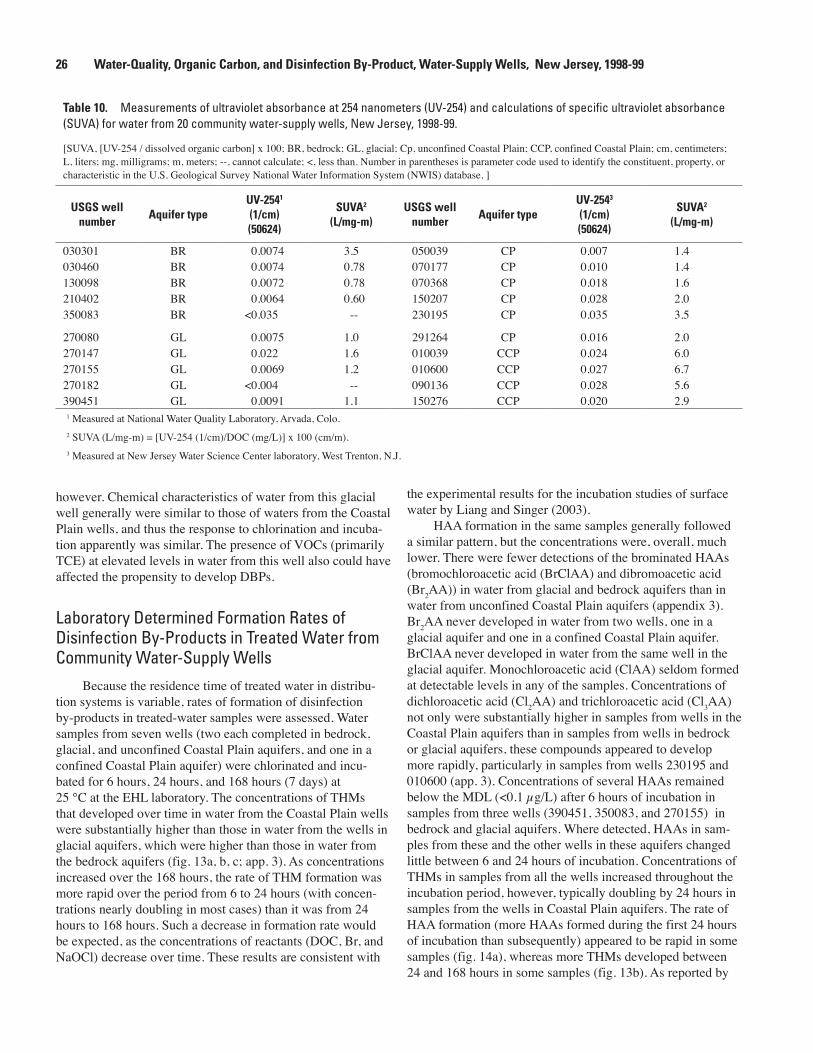
however. Chemical characteristics of water from this glacial well generally were similar to those of waters from the Coastal Plain wells, and thus the response to chlorination and incuba-tion apparently was similar. The presence of VOCs (primarily TCE) at elevated levels in water from this well also could have affected the propensity to develop DBPs.
Laboratory Determined Formation Rates of Disinfection By-Products in Treated Water from Community Water-Supply Wells
Because the residence time of treated water in distribu-tion systems is variable, rates of formation of disinfection by-products in treated-water samples were assessed. Water samples from seven wells (two each completed in bedrock, glacial, and unconfined Coastal Plain aquifers, and one in a confined Coastal Plain aquifer) were chlorinated and incu-bated for 6 hours, 24 hours, and 168 hours (7 days) at 25 °C at the EHL laboratory. The concentrations of THMs that developed over time in water from the Coastal Plain wells were substantially higher than those in water from the wells in glacial aquifers, which were higher than those in water from the bedrock aquifers (fig. 13a, b, c; app. 3). As concentrations increased over the 168 hours, the rate of THM formation was more rapid over the period from 6 to 24 hours (with concen-trations nearly doubling in most cases) than it was from 24 hours to 168 hours. Such a decrease in formation rate would be expected, as the concentrations of reactants (DOC, Br, and NaOCl) decrease over time. These results are consistent with
the experimental results for the incubation studies of surface water by Liang and Singer (2003).
HAA formation in the same samples generally followed a similar pattern, but the concentrations were, overall, much lower. There were fewer detections of the brominated HAAs (bromochloroacetic acid (BrClAA) and dibromoacetic acid (Br2AA)) in water from glacial and bedrock aquifers than in water from unconfined Coastal Plain aquifers (appendix 3). Br2AA never developed in water from two wells, one in a glacial aquifer and one in a confined Coastal Plain aquifer. BrClAA never developed in water from the same well in the glacial aquifer. Monochloroacetic acid (ClAA) seldom formed at detectable levels in any of the samples. Concentrations of dichloroacetic acid (Cl2AA) and trichloroacetic acid (Cl3AA) not only were substantially higher in samples from wells in the Coastal Plain aquifers than in samples from wells in bedrock or glacial aquifers, these compounds appeared to develop more rapidly, particularly in samples from wells 230195 and 010600 (app. 3). Concentrations of several HAAs remained below the MDL (<0.1 µg/L) after 6 hours of incubation in samples from three wells (390451, 350083, and 270155) in bedrock and glacial aquifers. Where detected, HAAs in sam-ples from these and the other wells in these aquifers changed little between 6 and 24 hours of incubation. Concentrations of THMs in samples from all the wells increased throughout the incubation period, however, typically doubling by 24 hours in samples from the wells in Coastal Plain aquifers. The rate of HAA formation (more HAAs formed during the first 24 hours of incubation than subsequently) appeared to be rapid in some samples (fig. 14a), whereas more THMs developed between 24 and 168 hours in some samples (fig. 13b). As reported by
Table 10. Measurements of ultraviolet absorbance at 254 nanometers (UV-254) and calculations of specific ultraviolet absorbance (SUVA) for water from 20 community water-supply wells, New Jersey, 1998-99.
[SUVA, [UV-254 / dissolved organic carbon] x 100; BR, bedrock; GL, glacial; Cp, unconfined Coastal Plain; CCP, confined Coastal Plain; cm, centimeters; L, liters; mg, milligrams; m, meters; --, cannot calculate; <, less than. Number in parentheses is parameter code used to identify the constituent, property, or characteristic in the U.S. Geological Survey National Water Information System (NWIS) database. ]
USGS well number
Aquifer typeUV-���1
(1/cm)(�0���)
SUVA�
(L/mg-m)USGS well
numberAquifer type
UV-����
(1/cm)(�0���)
SUVA�
(L/mg-m)
030301 BR 0.0074 3.5 050039 CP 0.007 1.4030460 BR 0.0074 0.78 070177 CP 0.010 1.4130098 BR 0.0072 0.78 070368 CP 0.018 1.6210402 BR 0.0064 0.60 150207 CP 0.028 2.0350083 BR <0.035 -- 230195 CP 0.035 3.5
270080 GL 0.0075 1.0 291264 CP 0.016 2.0270147 GL 0.022 1.6 010039 CCP 0.024 6.0270155 GL 0.0069 1.2 010600 CCP 0.027 6.7270182 GL <0.004 -- 090136 CCP 0.028 5.6390451 GL 0.0091 1.1 150276 CCP 0.020 2.9
1 Measured at National Water Quality Laboratory, Arvada, Colo.2 SUVA (L/mg-m) = [UV-254 (1/cm)/DOC (mg/L)] x 100 (cm/m).3 Measured at New Jersey Water Science Center laboratory, West Trenton, N.J.
�� Water-Quality, Organic Carbon, and Disinfection By-Product, Water-Supply Wells, New Jersey, 1998-99

Liang and Singer (2003), other researchers have found that HAAs form more rapidly than do THMs; the results in this study indicate that rates of formation of the THMs and HAAs were variable.
Of the HANs, trichloroacetonitrile (Cl3AN) was detected in no samples, regardless of incubation time. Dichloroace-tonitrile (Cl2AN) formed during the three incubation times in sample sets from the two wells (230195 and 150207) in unconfined Coastal Plain aquifers, and was detected in one of three samples in the sets from a well in a bedrock aquifer (210402) and the well in a confined Coastal Plain aquifer (010600) (app. 3). The brominated HANs, bromochloroaceto-nitrile (BrClAN) and dibromoacetonitrile (Br2AN), formed in
c35
30
25
40
20
15
10
5
00.5 1 1.5
CH
Cl 3 C
ON
CEN
TRA
TIO
N, I
N
MIC
RO
GR
AM
S P
ER L
ITER
DOC CONCENTRATION, IN MILLIGRAMS PER LITER
0
Glacial
Unconfined Coastal Plain
Bedrock
Confined Coastal Plain
EXPLANATION
b30
25
35
20
15
10
5
00.5 1 1.5
CH
Br 2C
l CO
NC
ENTR
ATI
ON
, IN
M
ICR
OG
RA
MS
PER
LIT
ER
DOC CONCENTRATION, IN MILLIGRAMS PER LITER
0
a40
35
30
45
25
20
15
10
5
00 0.5 1 1.5
CH
BrC
l 2 CO
NC
ENTR
ATI
ON
, IN
M
ICR
OG
RA
MS
PER
LIT
ER
DOC CONCENTRATION, IN MILLIGRAMS PER LITER
AQUIFER TYPE
Figure 11. Relation of concentrations of (a) bromodichloromethane (CHBrCl2), (b) dibromochloromethane (CHBr2Cl), and (c) chloroform (CHCl3) in chlorinated water to concentrations of dissolved organic carbon (DOC) in source water from 20 community water-supply wells in New Jersey, 1998-99.
30.0
25.0
20.0
35.0
15.0
10.0
5.0
0.00.00 0.05 0.10 0.15
CH
Br 2C
l CO
NC
ENTR
ATI
ON
, IN
M
ICR
OG
RA
MS
PER
LIT
ER
BROMIDE CONCENTRATION, IN MILLIGRAMS PER LITER
0.20 0.25
b
6.0
5.0
4.0
7.0
3.0
2.0
1.0
0.00.00 0.05 0.10 0.15
CH
Br 3 C
ON
CEN
TRA
TIO
N, I
N M
ICR
OG
RA
MS
PER
LIT
ER
BROMIDE CONCENTRATION, IN MILLIGRAMS PER LITER
0.20 0.25
a
R2 = 0.21p-value = 0.056
R2 = 0.49p-value = 0.002
AQUIFER TYPE
Glacial
Unconfined Coastal Plain
Bedrock
Confined Coastal Plain
EXPLANATION
Figure 1�. Relation of concentrations of (a) bromoform (CHBr3) and (b) dibromochloromethane (CHBr2Cl) in chlorinated water to concentrations of bromide in source water from 20 community water-supply wells in New Jersey, 1998-99.
Dissolved Organic Carbon Fractions and Disinfection By-Products ��

c
0.1110100
CHBr
2Cl
WEL
L 35
0083
- BE
DROC
K
CONCENTRATION, IN MICROGRAMS PER LITER
CHBr
Cl2
CHBr
3CH
Cl3
b
0.1110100
CHBr
2Cl
WEL
L 39
0451
- GL
ACIA
L
CONCENTRATION, IN MILLIGRAMS PER LITER
CHBr
Cl2
CHBr
3CH
Cl3
6 ho
urs
24 h
ours
168
hour
s
EXPL
ANAT
ION
INCU
BATI
ON T
IME
a
0.1110100
CHBr
2Cl
WEL
L 23
0195
- UN
CON
FIN
ED C
OAST
AL P
LAIN
CONCENTRATION, IN MICROGRAMS PER LITER
CHBr
Cl2
CHBr
3CH
Cl3
Figu
re 1
�.
Trih
alom
etha
ne fo
rmat
ion
over
tim
e in
wat
er fr
om (a
) wel
l 230
195,
com
plet
ed in
a C
oast
al P
lain
aqu
ifer,
(b) w
ell 3
9045
1, c
ompl
eted
in a
gla
cial
aqu
ifer,
and
(c) w
ell
3500
83, c
ompl
eted
in a
bed
rock
aqu
ifer i
n N
ew J
erse
y, 1
998-
99. (
CHBr
3, bro
mof
orm
; CHB
r 2Cl, d
ibro
moc
hlor
omet
hane
; CHB
rCl 2, b
rom
odic
hlor
omet
hane
; CHC
l 3, chl
orof
orm
).
�8 Water-Quality, Organic Carbon, and Disinfection By-Product, Water-Supply Wells, New Jersey, 1998-99

the sample sets from most of the wells, with the highest con-centrations developed in water from the unconfined Coastal Plain aquifers. The formation rate generally was greatest dur-ing the first 6 hours of incubation, with relatively little change in concentration occurring during the period from 24 to 168 hours of incubation.
Differences in Disinfection By-Product Formation Potential in Water from Different Aquifer Types
The differences observed in DBP formation potentials can result from various causes. Relations among the observed DBP formation potentials can be affected by bias in the data and the origins of factors, primarily concentrations of constitu-ents, that could affect how DBPs form.
Possible Bias in Disinfection By-Product Data
The actual concentrations of the various DBPs in chlori-nated and incubated water samples from the 20 wells could be biased high because THMs and HAAs were detected in treated field blanks. The presence of trace amounts of organic carbon in the blank water used in 1998 could, however, have caused the THMs and HAAs to form in the blanks. This would indi-cate that the concentrations of the DBPs measured in treated water from wells in the Coastal Plain aquifers (sampled during 1998) are not biased high because the contaminated blank water was not part of the processing of samples. Thus the dif-ference in concentrations of DBPs in water samples from the Coastal Plain aquifers and those from the bedrock and glacial aquifers may be at least as large as that shown by the data. Furthermore, the concentrations of DBPs in the treated blanks are lower than those that formed in many of the environmental samples, primarily those from Coastal Plain aquifers. Should there be a systematic and uniform bias in the data caused by laboratory contamination, as opposed to contaminated blank
Table 11. Concentrations of haloacetic acids in chlorinated ground-water samples from 20 community water-supply wells, New Jersey, 1998-99, following a 7-day incubation period.
[Total HAAs, sum of bromochloroacetic acid, dibromoacetic acid, dichloroacetic acid, monochloroacetic acid, and trichloroacetic acid; µg/L, microgram per liter; BR, bedrock; GL, glacial; CP, unconfined Coastal Plain; CCP, confined Coastal Plain; HAAs, haloacetic acids; <, less than. Number in parentheses is parameter code used to identify the constituent, property, or characteristic in the U.S. Geological Survey National Water Information System (NWIS) database.]
USGS well number
Aquifer type
Bromo-chloro-
acetic acid(BrClAA)
(µg/L)(99���)
Dibromo-acetic acid
(Br�AA)(µg/L)
(99�1�)
Dichloro-acetic acid
(Cl�AA)(µg/L)
(99�09)
Mono-chloro-
acetic acid(ClAA)(µg/L)
(99�08)
Trichloro-acetic acid
(Cl�AA)(µg/L)
(99�10)
Total HAAs(µg/L)
030301 BR 2.1 1.9 2.5 <0.1 1.9 8.4030460 BR 1.5 1.4 1.6 <0.1 1.4 5.9130098 BR 1.2 1.5 <0.1 <0.1 1.3 4.0210402 BR 3.2 3.7 3.2 3.8 1.7 16350083 BR <0.1 <0.1 2.0 <0.1 2.6 4.6
270080 GL 1.9 1.4 4.3 <0.1 2.3 9.9270147 GL 5.3 2.2 12 2.3 9.6 31270155 GL 2.3 2.5 2.1 2.8 1.7 11.4270182 GL 1.2 <0.1 1.5 <0.1 1.7 4.4390451 GL 2.3 1.5 2.4 <0.1 1.8 8.0
050039 CP 2.5 11 5.5 <0.1 2.7 22070177 CP 3.1 1.4 6.9 <0.1 4.0 15070368 CP 2.2 1.2 8.3 <0.1 4.8 17150207 CP 9.3 6.1 9.6 <0.1 6.9 32230195 CP 8.5 4.1 15 2.3 13 43291264 CP 3.1 1.0 10 <0.1 7.0 21
010039 CCP 3.4 <0.1 14 <0.1 18 35010600 CCP 2.5 <0.1 9.8 <0.1 4.0 16090136 CCP 4.0 2.5 6.7 <0.1 3.2 16150276 CCP 5.1 2.4 9.5 <0.1 6.9 24
Differences in Disinfection By-Product Formation Potential in Water from Different Aquifer Types �9

water, the relations between concentration and groups of wells (by aquifer type) could still be valid.
Relations Among Disinfection By-Product Formation Potentials
With few exceptions, the THMFP for water from the Coastal Plain aquifers was greater (by factors of 1.5 to 4) than that for water in bedrock and glacial aquifers (fig. 15). A true haloacetic acid formation potential (HAAFP) could not be calculated, however, because HAAs were not measured in the source water. As chloroform is the only THM that is found routinely in source water, and typically at low concentrations, HAAs probably can be assumed to be absent until the water
is treated. The total concentrations of HAAs, which probably represent the HAAFP (fig. 16), were distributed among the aquifer types in a pattern similar to that of the THMFP, and there was a strong positive linear relation (r2 = 0.65) between THMFP and concentrations of total HAAs (fig. 17). Relations between total HANs and THMs (r2 = 0.39), and total HANs and total HAAs (r2 = 0.11) were substantially weaker.
Table 1�. Concentrations of haloacetonitriles in chlorinated ground-water samples from 20 community water-supply wells, New Jersey, 1998-99, following a 7-day incubation period.
[Total HANs, sum of bromochloroacetonitrile, dibromoacetonitrile, and dichloroacetonitrile; BR, bedrock; GL, glacial; CP, unconfined Coastal Plain; CCP, confined Coastal Plain; µg/L, microgram per liter; HANs, haloacetonitriles. Number in parentheses is parameter code used to identify the constituent, property, or characteristic in the U.S. Geological Survey National Water Information System (NWIS) database.]
USGS well
number
Aquifer type
Bromo-chloro-
acetoni-trile
(BrClAN)(µg/L)
(99�1�)
Dibromo-acetoni-
trile(Br�AN)(µg/L)
(99�1�)
Dichloro-acetoni-
trile(Cl�AN)(µg/L)
(99�1�)
Total HANs(µg/L)
030301 BR 0.7 1.3 <0.1 2.0030460 BR 0.7 1.2 <0.1 1.9130098 BR 0.6 1.1 <0.1 1.7210402 BR 0.6 1.0 <0.1 1.6350083 BR 0.6 <0.1 <0.1 0.6
270080 GL <0.1 0.6 <0.1 0.6270147 GL 0.9 0.7 0.5 2.1270155 GL 0.6 0.9 <0.1 1.5270182 GL <0.1 <0.1 <0.1 <0.1390451 GL 1.5 1.5 <0.1 3.0
050039 CP 0.5 1.0 <0.1 1.5070177 CP <0.1 1.1 <0.1 1.1070368 CP 0.9 0.8 0.8 2.5150207 CP 3.7 5.0 1.2 9.9230195 CP 3.0 3.1 2.0 8.1291264 CP <0.1 1.1 <0.1 1.1
010039 CCP <0.1 <0.1 <0.1 <0.1010600 CCP <0.1 <0.1 <0.1 <0.1090136 CCP 12 <0.1 <0.1 12150276 CCP 0.7 1.6 <0.1 2.3
1
10
100
BrCIAA
CON
CEN
TRAT
ION
, IN
MIC
ROGR
AMS
PER
LITE
R
CIAABr2AA CI2AA CI3AA
WELL 230195 - UNCONFINED COASTAL PLAIN
b
a
1
10
100
BrCIAA
WELL 390451 - GLACIAL
CON
CEN
TRAT
ION
, IN
MIC
ROGR
AMS
PER
LITE
R
CIAABr2AA CI2AA CI3AA
6 hours
24 hours
168 hours
INCUBATION TIME
EXPLANATION
Figure 1�. Haloacetic acid formation over time in water from (a) well 390451, completed in a glacial aquifer, and (b) well 230195, completed in a Coastal Plain aquifer in New Jersey, 1998-99. (Br2AA, dibromoacetic acid; BrClAA, bromochloroacetic acid; ClAA, cloroacetic acid; Cl2AA, dichloroacetic acid; Cl3AA, trichloroacetic acid)
�0 Water-Quality, Organic Carbon, and Disinfection By-Product, Water-Supply Wells, New Jersey, 1998-99

Origins of Selected Chemical Characteristics and Constituents and Their Effects on Disinfection By-Product Formation Potential
Several factors potentially can affect DBP formation potentials. These include concentrations and characteristics of DOC, and concentrations of bromide. Concentrations of iron, manganese, and ammonia, which may be indicative of redox conditions, presence of colloids, or complexation with organic matter, also could be factors. The origins of these constituents, and the conditions under which they are present, vary among the aquifers studied.
Dissolved Organic CarbonThe amount of DOC present in the water is not the only
determining factor in DBP formation potential. Although there is a semblance of a positive relation between concentrations of DOC and THMFP, using data for all wells (fig. 18), the two highest concentrations of THMFP (for water samples from
Coastal Plain wells) dominate, and the r2 for the entire data set is low (0.19). Linear relations are not apparent for the data points for wells grouped by aquifer type except those for wells completed in glacial aquifers. A stronger linear relation is pres-ent between UV-254 in untreated water and THMFP (shown in fig. 9), and the strongest relation is between UV-254 and total HAA concentration (fig. 19). Thus, it appears that the aromatic character of the DOC is an important factor in determining the DBP formation potential in ground water in New Jersey.
DOC in ground-water samples from the Coastal Plain is, for most samples, more aromatic than the DOC in samples from the bedrock and glacial aquifers, as indicated by SUVA calculations as well as the UV-254 measurements. The hydro-phobic fraction of DOC (DOC 3), which includes humic sub-stances, contains more aromatic compounds than the hydro-philic fraction. Concentrations of fraction DOC 3 were, in four of six samples from unconfined Coastal Plain aquifers, about twice as high as those in samples from bedrock or glacial aqui-fers (table 8). Higher concentrations of DBPs developed in the DOC 3 fractions in samples from the unconfined Coastal Plain
Table 1�. Concentrations of disinfection by-products in dissolved-organic-matter fractions in water samples from 20 community water-supply wells, New Jersey, 1998-99.
[BR, bedrock; GL, glacial; CP, unconfined Coastal Plain; CCP, confined Coastal Plain; THMs, trihalomethanes; HAAs, haloacetic acids; HANS, haloaceto-nitriles; DOC, dissolved organic carbon; DOC 2, hydrophilic organic acids and neutrals and low-molecular-weight hydrophilic compounds fraction; DOC 3, hydrophobic organic acid fraction; DOC 6, hydrophilic organic acid fraction; µg/L, micrograms per liter; nf, no fraction isolated]
Total THMs Total HAAs Total HANs
USGS well
number
Aquifer type
DOC �1
(µg/L)DOC �1
(µg/L)DOC �1
(µg/L)DOC �1
(µg/L)DOC �1
(µg/L)DOC �1
(µg/L)DOC �1
(µg/L)DOC �1
(µg/L)DOC �1
(µg/L)
030301 BR 22.0 nf 19.1 21.6 nf 13.7 0.0 nf 0.6030460 BR 16.1 nf 14.4 20.1 nf 18.2 0.0 nf 0.6130098 BR 12.7 nf 15.1 16.1 nf 8.4 0.2 nf 0.8210402 BR 16.5 nf 19.2 21.1 nf 11.5 0.2 nf 1.0350083 BR nf nf 15.2 nf nf 0.0 nf nf 2.4
270080 GL 21.8 nf 18.4 23.8 nf 12.7 0.2 nf 0.0270147 GL 35.2 nf 32.2 31.9 nf 20.6 0.4 nf 1.6270155 GL 15.7 nf 14.5 16.3 nf 10.8 0.3 nf 0.3270182 GL 9.6 nf 10.2 7.3 nf 8.7 nf nf 0.0390451 GL 15.6 nf 17.4 15.0 nf 8.8 0.3 nf 1.6
050039 CP 16.8 nf nf 12.0 nf nf 0.0 nf nf070177 CP 29.3 nf 29.4 26.0 nf 31.0 0.0 nf 0.0070368 CP 31.4 14.8 nf 35.3 8.8 nf 0.0 0.0 nf150207 CP 54.5 15.5 nf 44.7 14.5 nf 0.0 0.0 nf230195 CP 59.5 16.1 nf 67.1 16.9 nf 0.0 0.0 nf291264 CP 31.8 nf 26.1 22.6 nf 21.8 0.0 nf 0.0
010039 CCP 23.9 nf 11.3 27.7 nf 8.4 0.3 nf nf010600 CCP 32.9 nf 9.6 39.9 nf 7.4 0.0 nf 0.0090136 CCP 27.2 nf 17.8 30.7 nf 9.4 0.0 nf 0.7150276 CCP 31.9 nf 25.3 37.5 nf 16.0 0.0 nf 0.6
1 See table 6 and figure 3 for full description of each DOC fraction.
Differences in Disinfection By-Product Formation Potential in Water from Different Aquifer Types �1

than in DOC 3 fractions in samples from bedrock and glacial aquifers. For samples from the unconfined Coastal Plain aqui-fers, relations of both total THMs and total HAAs in the DOC 3 fraction with SUVA were strong (r2 = 0.58 and 0.68, respec-tively). Overall, the data indicate that DOC, particularly the hydrophobic acids, in unconfined Coastal Plain ground water is more aromatic than those in water from the bedrock and glacial aquifers. Thus, for these ground waters, DOC with high aromaticity, presumably the hydrophobic fraction, appears to be an important precursor for DBP formation. Concentrations of THMs and HAAs in the DOC 3 fraction in water from the confined Coastal Plain aquifers also tended to be higher than those from bedrock and glacial aquifers, and were clearly higher than they were in the DOC 2 fraction (hydrophilic and neutral compounds) (table 13). Relations of THMs in samples from the confined Coastal Plain aquifers with SUVA show a virtually flat trend, although SUVA values, indicating aroma-ticity, for these samples are high. HAN development, on the other hand, was greater in the DOC 2 fraction than the DOC 3 fraction, although concentrations were much lower than those of the THMs and HAAs. Apparently, HAN development is not promoted by greater aromaticity.
Within the hydrophobic fraction, the proportions of aromatic and aliphatic compounds can vary substantially, arising from the origin of the DOC. Pomes and others (2000) indicate that aquatic humic substances with a predominance of aromatic compounds derive from terrestrial plant sources, and those with a predominance of aliphatic compounds derive from algal or bacterial sources. If most of the DOC present in ground water from a given aquifer is derived from materials within the aquifer matrix or matrixes through which recharge passes, then it appears likely that the age and geologic set-ting in which the aquifer materials were formed could have a bearing on how strong an effect DOC has as a precursor to DBP formation. Younger (Late Paleozoic to Cenozoic) sediments in which land-plant remains are present would be likely to contain water with more aromatic DOC and, prob-ably, a higher potential for DBP formation than older (early Paleozoic) sediments, particularly if the aquifers are confined. (DOC in water from aquifers composed of fractured igneous and metamorphic rocks would be derived only from the land surface in recharge.)
The aquifers sampled during the present study are all sedimentary in origin; the water samples with the highest DBP formation potentials (THMFP, total HAAs, and HANs), with few exceptions, come either from deep confined Coastal Plain aquifers or unconfined Coastal Plain aquifers (the Potomac-Raritan-Magothy and Kirkwood-Cohansey aquifer systems). The sediments of the Potomac-Raritan-Magothy aquifer system contain lignite; these identifiable plant remains occur as dispersed fragments and in thin layers, particularly in the upper part of the system. Sediments of the Kirkwood-Cohan-sey aquifer system contain fine-grained carbonaceous mate-rial, in dark-gray clays and dark, sometimes fossiliferous, silts (Owens and Sohl, 1969). Where the aquifer is confined, Lower Kirkwood sediments are overlain by a thick diatomaceous
clay bed (Zapecza, 1989). Plant material and phytoplankton would likely have been abundant in the marginal-marine (with the Mesozoic equivalent of mangrove swamps) and Cenozoic deltaic environments in which these Cretaceous and Tertiary sediments were deposited.
Only one well (270147) completed in a glacial aquifer yielded water with a comparably high DBP formation poten-tial. Some of the morainal deposits in northern New Jersey contain peat (Minard and Rhodehamel, 1969). Organic materi-als in sediment could supply precursor DOC for DBP forma-tion in water from parts of some of the glacial aquifers.
The other, obvious source of DOC in the unconfined aquifers is land-surface inputs to recharge from both natural and anthropogenic sources. Plant materials at land surface could be the major source of natural DOC in recharge waters. Anthropogenic sources of carbon compounds in recharge could include septic systems, composting facilities, and vari-ous land-surface and subsurface discharges of VOCs.
For those water samples from the 20 wells that contained detectable VOCs, neither MTBE nor PCE concentrations
Glacial
Unconfined Coastal Plain
Bedrock
Confined Coastal Plain
EXPLANATION
2700
80
2701
47
2701
55
2701
82
3904
51
0500
39
0701
77
0703
68
1502
07
2301
95
2912
64
0100
39
0106
00
0901
36
1502
76
0303
01
0304
60
1300
98
2104
02
3500
83
WELL NUMBER
60
80
100
120
0
20
40
THM
FP, I
N M
ICRO
GRAM
S PE
R LI
TER
AQUIFER TYPE
Maximum contaminant level = 80 micrograms per liter
Figure 1�. Trihalomethane formation potential (THMFP) in water from 20 community water-supply wells in New Jersey, by aquifer type, 1998-99.
�� Water-Quality, Organic Carbon, and Disinfection By-Product, Water-Supply Wells, New Jersey, 1998-99
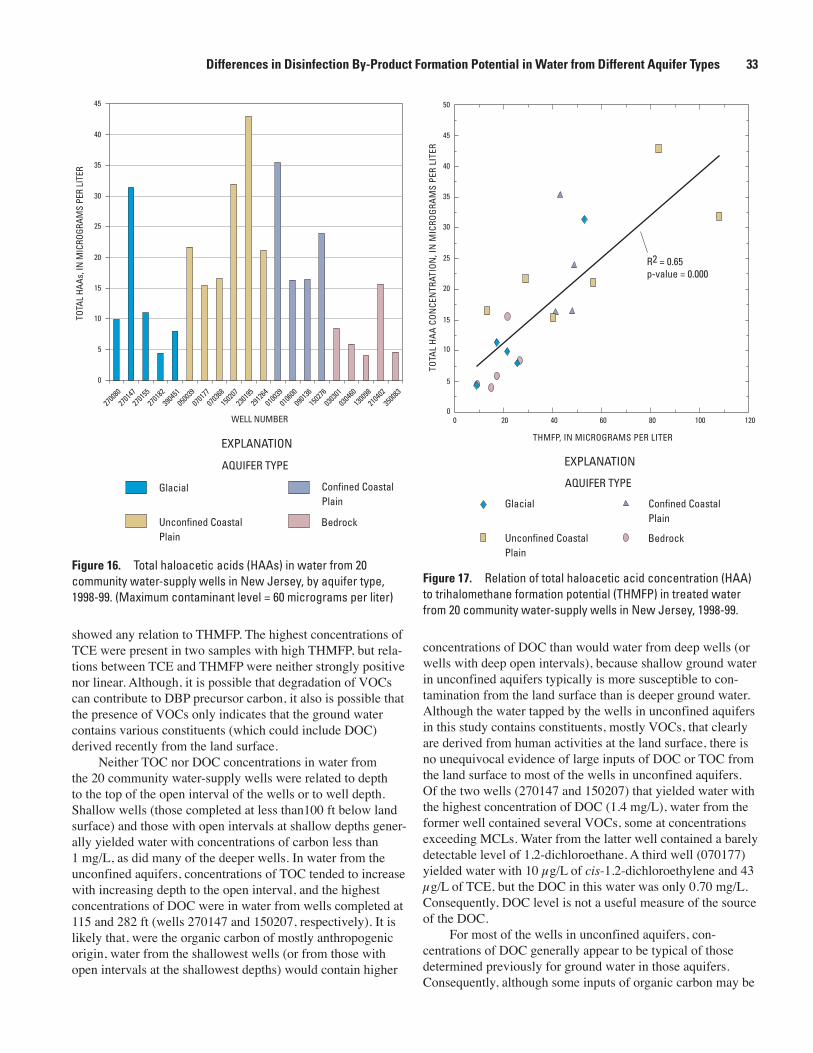
showed any relation to THMFP. The highest concentrations of TCE were present in two samples with high THMFP, but rela-tions between TCE and THMFP were neither strongly positive nor linear. Although, it is possible that degradation of VOCs can contribute to DBP precursor carbon, it also is possible that the presence of VOCs only indicates that the ground water contains various constituents (which could include DOC) derived recently from the land surface.
Neither TOC nor DOC concentrations in water from the 20 community water-supply wells were related to depth to the top of the open interval of the wells or to well depth. Shallow wells (those completed at less than100 ft below land surface) and those with open intervals at shallow depths gener-ally yielded water with concentrations of carbon less than 1 mg/L, as did many of the deeper wells. In water from the unconfined aquifers, concentrations of TOC tended to increase with increasing depth to the open interval, and the highest concentrations of DOC were in water from wells completed at 115 and 282 ft (wells 270147 and 150207, respectively). It is likely that, were the organic carbon of mostly anthropogenic origin, water from the shallowest wells (or from those with open intervals at the shallowest depths) would contain higher
concentrations of DOC than would water from deep wells (or wells with deep open intervals), because shallow ground water in unconfined aquifers typically is more susceptible to con-tamination from the land surface than is deeper ground water. Although the water tapped by the wells in unconfined aquifers in this study contains constituents, mostly VOCs, that clearly are derived from human activities at the land surface, there is no unequivocal evidence of large inputs of DOC or TOC from the land surface to most of the wells in unconfined aquifers. Of the two wells (270147 and 150207) that yielded water with the highest concentration of DOC (1.4 mg/L), water from the former well contained several VOCs, some at concentrations exceeding MCLs. Water from the latter well contained a barely detectable level of 1,2-dichloroethane. A third well (070177) yielded water with 10 µg/L of cis-1.2-dichloroethylene and 43 µg/L of TCE, but the DOC in this water was only 0.70 mg/L. Consequently, DOC level is not a useful measure of the source of the DOC.
For most of the wells in unconfined aquifers, con-centrations of DOC generally appear to be typical of those determined previously for ground water in those aquifers. Consequently, although some inputs of organic carbon may be
Glacial
Unconfined Coastal Plain
Bedrock
Confined Coastal Plain
EXPLANATION
2700
80
2701
47
2701
55
2701
82
3904
51
0500
39
0701
77
0703
68
1502
07
2301
95
2912
64
0100
39
0106
00
0901
36
1502
76
0303
01
0304
60
1300
98
2104
02
3500
83
WELL NUMBER
30
35
40
45
0
15
20
25
10
5
TOTA
L HA
As, I
N M
ICRO
GRAM
S PE
R LI
TER
AQUIFER TYPE
Figure 1�. Total haloacetic acids (HAAs) in water from 20 community water-supply wells in New Jersey, by aquifer type, 1998-99. (Maximum contaminant level = 60 micrograms per liter)
Glacial
Unconfined Coastal Plain
Bedrock
Confined Coastal Plain
EXPLANATION
50
45
40
35
30
TOTA
L H
AA
CO
NCE
NTR
ATIO
N, I
N M
ICRO
GRA
MS
PER
LITE
RTHMFP, IN MICROGRAMS PER LITER
0 20 40 80
25
60
20
15
10
5
0120100
R2 = 0.65p-value = 0.000
AQUIFER TYPE
Figure 1�. Relation of total haloacetic acid concentration (HAA) to trihalomethane formation potential (THMFP) in treated water from 20 community water-supply wells in New Jersey, 1998-99.
Differences in Disinfection By-Product Formation Potential in Water from Different Aquifer Types ��

anthropogenic, on the basis of the existing data, such inputs cannot be separated from naturally occurring organic carbon which, in some cases, is known to be substantial. In the case of water in the confined aquifers, all of the organic carbon in the water is derived from natural sources, because anthropogenic inputs to unconfined parts of the aquifers have had insufficient time to travel far downgradient beneath the overlying confin-ing units.
BromideConcentrations of bromide in source water to the 20 wells
varied substantially (fig. 20). In some cases, high concentra-tions (greater than 0.1 mg/L) likely were of anthropogenic origin—in particular, in water from well 030301, completed in a bedrock aquifer, where concentrations of sodium and chloride were highly elevated (209 and 634 mg/L, respec-tively). Concentrations of bromide in the confined aquifers, on the other hand, are natural. Concentrations of the brominated
THMs and HAAs in treated waters did not appear to be related to concentrations of bromide, however, with the exception of CHBr3. The concentrations of CHBr3 were higher in treated water from most of the wells in the bedrock aquifers than in treated water from most of the wells in the other aquifers (table 9). Source waters from the bedrock aquifers generally were as rich or richer in bromide as source water to wells in the other aquifers (fig. 20). Concentrations of the other bro-minated compounds commonly were higher in treated water from wells in Coastal Plain aquifers than in treated water from wells in the other aquifers. Thus, the magnitude of the bromide concentration is not the sole factor in formation of some of the brominated DBPs. Nevertheless, where concentrations of bromide either are high naturally, or are enhanced by anthro-pogenic inputs (as in water from well 030301), concentrations of CHBr3 are likely to be high in treated water.
Iron, Manganese, and AmmoniaMiller and others (1990) found, in a study of organic car-
bon and THMFP in Kansas aquifers, that THMFP was strongly
120
100
80
60
40
THM
FP, I
N M
ICRO
GRA
MS
PER
LITE
R
DOC CONCENTRATION, IN MILLIGRAMS PER LITER
0.0 0.2 0.4 0.8
20
0.60
1.21.0 1.61.4
R2 = 0.19p-value = 0.054
Glacial
Unconfined Coastal Plain
Bedrock
Confined Coastal Plain
EXPLANATION
AQUIFER TYPE
Figure 18. Relation of dissolved organic carbon (DOC) concentration to trihalomethane formation potential (THMFP) in water from 20 community water-supply wells in New Jersey, 1998-99.
50
40
30
20
TOTA
L H
AA
CO
NCE
NTR
ATIO
N, I
N M
ICRO
GRA
MS
PER
LITE
R
UV-254, IN 1/CENTIMETERS
0.00 0.01 0.02
10
00.03 0.04
R2 = 0.60p-value = 0.000
Glacial
Unconfined Coastal Plain
Bedrock
Confined Coastal Plain
EXPLANATION
AQUIFER TYPE
Figure 19. Relation of total haloacetic acid (HAA) concentration to ultraviolet absorbance at 254 nanometers (UV-254) in water from 20 community water-supply wells in New Jersey, 1998-99.
�� Water-Quality, Organic Carbon, and Disinfection By-Product, Water-Supply Wells, New Jersey, 1998-99

related to ground-water concentrations of TOC, which, in turn, were related to concentrations of iron, manganese, and ammo-nia. Causes suggested for these relations include (1) reducing conditions under which less TOC was microbially metabo-lized, (2) presence of colloids with which TOC and the other three constituents are associated, and (3) complexation of iron and manganese by organic matter. In this study, concentrations of iron and manganese, which likely are derived mostly from minerals in the aquifers, varied by three orders of magnitude. The higher concentrations of iron and manganese typically occurred in water with low oxygen content. Concentrations of iron and manganese were not related to concentrations of TOC or DOC. Because the concentrations of iron and manganese reported in this study are for filtered samples, whereas the samples in the study of Miller and others (1990) apparently were not filtered, comparisons of results are viewed with cau-tion. Furthermore, in this study, ammonia was not detected in any water samples from the bedrock or glacial aquifers. For the water samples from the Coastal Plain aquifers, however, in which ammonia was detected, relations between concentra-tions of ammonia and DOC were positive (r2 = 0.58) (fig. 21) and similar to results from Miller and others (1990).
Nearly all of the ammonia + organic nitrogen measured in water samples from the Coastal Plain aquifers was ammo-
nia, whereas essentially none of the ammonia + organic nitro-gen measured in water samples from the bedrock and glacial aquifers was ammonia. The relation between organic carbon and ammonia in water from the Coastal Plain aquifers may be, in part, a result of the character of the organic carbon pres-ent in the ground water. In particular, in the confined Coastal Plain aquifers, the ammonia probably derives mostly from the microbial decomposition of organic matter in the aquifers. Brown coal (lignite), for example, can contain more than 5 weight-percent of nitrogen (Muller-Wegener, 1988); lignite is ubiquitous in sediments of the Potomac-Raritan-Magothy aquifer system of the New Jersey Coastal Plain. Most of the water samples from the Coastal Plain aquifers had low oxygen content; therefore, any inputs of nitrogen to the ground water at the sampling points would be in a reduced form, such as ammonia.
Reckow and others (1990) found a positive relation between organic N and production of Cl2AN. In this study, concentrations of ammonia + organic nitrogen for all wells showed only a weak positive relation with concentrations of total HANs (r2 = 0.17). Cl2AN developed in water from unconfined Coastal Plain wells, but there were insufficient
Glacial
Unconfined Coastal Plain
Bedrock
Confined Coastal Plain
EXPLANATION
2700
80
2701
47
2701
55
2701
82
3904
51
0500
39
0701
77
0703
68
1502
07
2301
95
2912
64
0100
39
0106
00
0901
36
1502
76
0303
01
0304
60
1300
98
2104
02
3500
83
WELL NUMBER
0.15
0.20
0.00
0.10
0.05
CON
CEN
TRAT
ION
OF
BROM
IDE,
IN M
ILLI
GRAM
S PE
R LI
TER
AQUIFER TYPE
Figure �0. Concentrations of bromide in water from 20 community water-supply wells in New Jersey, by aquifer type, 1998-99.
Unconfined Coastal Plain
Confined Coastal Plain
EXPLANATION
1.6
1.2
0.8
DO
C CO
NCE
NTR
ATIO
N, I
N M
ILLI
GRA
MS
PER
LITE
R
AMMONIA CONCENTRATION, IN MILLIGRAMS PER LITER AS N
0.0 0.4 0.8
0.4
0.0
1.2 1.6
R2 = 0.58p-value = 0.010
AQUIFER TYPE
Figure �1. Relation of concentrations of dissolved organic carbon (DOC) to concentrations of ammonia in water from 20 community water-supply wells in New Jersey Coastal Plain aquifers, 1998-99.
Differences in Disinfection By-Product Formation Potential in Water from Different Aquifer Types ��

detections to draw any conclusions about relations with concentrations of ammonia + organic nitrogen. Using data for all 20 wells, the reduced species (ammonia + organic N) did not relate strongly to concentrations of THMs (r2 =0.10) either. The possibility that concentrations of the reduced nitrogen species might be higher as the aromatic content of the organic carbon increased was explored because the nitrogen in ammonia and amino compounds can become covalently linked to various aromatic structures (Anderson and others, 1989). Using the data for all 20 wells, the relation between UV-254 measurements and ammonia + organic nitrogen was not strong (r2 = 0.16). It was only slightly stronger for water from the unconfined Coastal Plain wells (r2 = 0.31). Relations between SUVA and ammonia + organic nitrogen were weaker than those between UV-254 measurements and ammonia + organic nitrogen.
Indicators of Disinfection By-Product Formation Potential
Overall, it appears that the aromatic character of the organic matter is an important factor in DBP production in the ground water sampled during this study. UV-254 measure-ments likely could be used to predict the potential of ground water to DBP formation upon chlorination because they would be indicative of both the magnitude of concentrations of DOC and the aromaticity of the DOC. Chemical constituents other than DOC appear to be poor indicators of DBP formation potential. Nevertheless, because the pHs of the treated water samples in this study were adjusted to 7 before chlorination, relations between THMFP and various constituents may be different for waters chlorinated prior to pH adjustment.
The presence of ammonia in source water to the wells in the Coastal Plain aquifers raises the issue of the effectiveness of chlorination. Reactions between chlorine and ammonia result in compounds that are less effective as disinfectants, although this can be overcome by increases in the chlorine dose (McClanahan, 1977).
Summary and ConclusionsWater samples were collected from 20 community water-
supply wells in New Jersey, of which 16 were completed in unconfined bedrock, glacial, and Coastal Plain aquifers, and 4 were completed in confined Coastal Plain aquifers. The samples were analyzed for major and minor ions, selected trace elements, total organic carbon (TOC), dissolved organic carbon (DOC), and volatile organic compounds (VOCs). DOC fractions were determined. Raw water samples were chlo-rinated, the pH adjusted to 7, and analyzed for the common groups of disinfection by-products (DBPs): trihalomethanes (THMs), haloacetic acids (HAAs), and haloacetonitriles (HANs) after incubation for 168 hours (7 days). Selected chlo-rinated samples also were incubated for 6 and 24 hours.
Water from all wells completed in unconfined aquifers contained one or more VOCs, some at concentrations exceed-ing maximum contaminant levels (MCL). High concentra-tions of sodium, chloride, and sulfate were present in water samples from several wells completed in unconfined aquifers at levels exceeding secondary maximum contaminant levels (SMCLs) of 50, 250, and 250 mg/L, respectively. Although the high levels of sulfate were natural, the high concentrations of sodium and chloride were indicative of anthropogenic inputs to ground water.
Concentrations of nitrate exceeding 1 mg/L as N were present in samples from most of the wells in bedrock and glacial aquifers, although none exceeded the MCL of 10 mg/L as N. Because water from most of the Coastal Plain wells had low oxygen contents, no nitrate was detected in samples from several wells completed in unconfined Coastal Plain aquifers and all wells completed in confined Coastal Plain aquifers. Water from all wells completed in the Coastal Plain aquifers contained detectable concentrations of ammonia, however.
Water from the 20 wells was chlorinated and incubated for 7 days. With few exceptions, higher concentrations of DBPs were formed in water from the wells in Coastal Plain aquifers than in water from wells in bedrock or glacial aqui-fers. A positive relation was observed between the formation potentials for the classes of DBPs and the aromaticity of the precursor DOC, as estimated by measurements of ultraviolet absorption at 254 nanometers. Water samples from seven selected wells were chlorinated and incubated for 6, 24, and 168 hours. Water from Coastal Plain wells, in general, devel-oped higher concentrations of THMs, HAAs, and HANs than did the samples from bedrock and glacial aquifers. Rates of formation were variable.
DOC in water samples was fractionated to determine hydrophobic and hydrophilic fractions. DOC in water from the wells in Coastal Plain aquifers contained, in some cases, slightly larger concentrations of hydrophobic organic acids than did DOC in water from wells in the bedrock and glacial aquifers. When treated with chlorine, both the hydrophobic and hydrophilic acid fractions developed DBPs. Concentra-tions of THMs and HAAs generally were higher in the hydro-phobic fraction of DOC from Coastal Plain aquifers than in the same fractions from bedrock and glacial aquifers.
DOC in water from wells in unconfined aquifers may derive partly from the VOCs that are present, but concentra-tions of DOC in most of these water samples were typical of DOC levels in the unconfined aquifers. Water from one well in a glacial aquifer contained several VOCs, some at concen-trations exceeding MCLs, and the concentration of DOC was high relative to concentrations in samples from most other wells. Another well in an unconfined Coastal Plain aquifer yielded water with an equally high concentration of DOC, but only one VOC was detected at a low concentration. The sediments of the Coastal Plain aquifers contain substantial amounts of organic matter that can contribute aromatic DOC compounds to the ground water. Thus, much of the DOC in water from the wells in unconfined Coastal Plain aquifers
�� Water-Quality, Organic Carbon, and Disinfection By-Product, Water-Supply Wells, New Jersey, 1998-99

probably was natural. The DOC in water from the wells in the confined Coastal Plain aquifers was wholly natural in origin, as the wells are too far downgradient beneath confining units to receive anthropogenic inputs.
Organic material is present in some of the sedimentary rocks of the bedrock aquifers, but it may not be readily incor-porated into the ground water. Organic matter in the unconsol-idated materials of the glacial aquifers probably occurs sporad-ically. The geologic characteristics of the aquifers do appear to be an important factor in the supply of organic carbon to the ground water, and thus can play a role in the potential of ground water to form DBPs when chlorinated.
AcknowledgmentsThe authors thank the water purveyors for allowing
access to their wells and express appreciation to Judy Louis of NJDEP for assistance with study design. Thanks are due also to USGS colleagues: George R. Aiken for his guidance in fractionation techniques, and Jacob Gibs and Gary K. Speiran for insightful comments that greatly improved the manuscript.
References Cited
Adin, A., Katzhendler, J., Alkaslassy, D., Rav-Acha, C., 1991, Trihalomethane formation in chlorinated drinking water: a kinetic model: Water Research, v. 25, no. 7, p. 797-805
Adriano, D.C., 1986, Trace elements in the terrestrial environ-ment: New York, Springer-Verlag, 533 p.
Aiken, G.R., 1985 Isolation and concentration techniques for aquatic humic substances, in Aiken, G.R., McKnight, D.M., Wershaw, R.L., and MacCarthy, P., eds., Humic substances in soil, sediment, and water: New York, Wiley, p. 363-385.
Aiken, G.R., McKnight, D.M., Thorn, K.A., and Thurman, E.M., 1992, Isolation of hydrophilic organic acids from water using nonionic macroporous resins: Organic Geo-chemistry, v. 18, p. 567-573.
Anderson, H.A., Bick, W., Hepburn, A, and Stewart, M., 1989, Nitrogen in humic substances, in Hayes, M.H.B., Mac-Carthy, P., Malcolm, R.L., and Swift, R.S., eds., Humic Substances II: Chichester, England, John Wiley and Sons Ltd., p. 223-253.
Andrews, R.C., and Ferguson, M.J., 1996, Minimizing disinfection by-product formation while ensuring Giardia control, in Minear, R.A., and Amy, G.L , eds., Disinfection by-products in water treatment, the chemistry of their for-mation and control: New York, Lewis Publishers, p. 17-58.
Ayers, M.A., and Pustay, E.A., 1988, New Jersey Ground-water quality, in Moody, D.W., Carr, Jerry, Chase, E.B., and Paulson, R.W., National Water Summary 1986; Hydrologic events and ground-water quality: U.S. Geological Survey Water-Supply Paper 2325, 506 p.
Bloemen, H.J. Th., and Burn, J., eds. 1993, Chemistry and analyses of volatile organic compounds in the environment: Glasgow, Scotland, Blackie Academic and Professional, 290 p.
Brenton, R.W., and Arnett, T.L., 1993, Methods of analysis by the U.S. Geological Survey National Water Quality Labora-tory—Determination of dissolved organic carbon by UV-promoted persulfate oxidation and infrared spectrometry: U.S. Geological Survey Open-File Report 92-480, 12 p.
Clawges, R.M., Oden, T.D., and Vowinkel, E.F., 1998, Water-quality data for 90 community water-supply wells in New Jersey, 1994-95: U.S. Geological Survey Open-File Report 97-625, 31 p.
Connor, B.F., Rose, D.L., Noriega, M.C., Murtagh, L.K., and Abney, S.R., 1998, Methods of analysis by the U. S. Geo-logical Survey National Water Quality Laboratory—Deter-mination of 86 volatile organic compounds in water by purge and trap capillary-column gas chromatography mass spectrometry, reporting results at low microgram-per-liter concentrations: U.S. Geological Survey Open-File Report 97-829.
Eaton, A.D., Clesceri, L.S., and Greenberg, A.E., 1995, Stan-dard methods for the examination of water and wastewater (19th ed.): Washington, D.C., American Public Health Association, 949 p.
Fishman, M.J., and Friedman, L.C., 1989, Methods for determination of inorganic substances in water and fluvial sediments: U.S. Geological Survey Techniques of Water Resources Investigations, book 5, chap. A1, 545 p.
Friedman, L.C., and Erdmann, D.E., 1982, Quality assurance practices for the chemical and biological analyses of water and fluvial sediments: U.S. Geological Survey Techniques of Water Resources Investigations, book 5, chap. A6, 181 p.
Graedel, T.E., and Reiss, N.M. 1985, Chapter I, Atmospheric Processes, in Panel on Acidic Deposition in New Jersey, ed., Acidic Deposition in New Jersey, A report to the Governor and Legislature of New Jersey, The Governor’s Science Advisory Committee: On file at New Jersey Department of Environmental Protection, Trenton, New Jersey; p. 19-52.
Hem, J.D., 1992, Study and interpretation of the chemical characteristics of natural water: U.S. Geological Survey Water-Supply Paper 2254, 264 p.
References Cited ��

Hoekstra, E.J., De Leer, E.W.B., and Brinkman, U.A. Th., 1998, Natural formation of chloroform and brominated tri-halomethanes in soil: Environmental Science and Technol-ogy, v. 32, p. 3724-3729.
Koterba, M.T., Wilde, F.D., and Lapham, W.W., 1995, Ground-water data-collection protocols and procedures for the National Water-Quality Assessment Program: Collection and documentation of water-quality samples and related data: U.S. Geological Survey Open-File Report 95-399, 113 p.
Kretzschmar, Ruben, Robarge, W.P., and Amoozegar, Aziz., 1995, Influence of natural organic matter on colloid trans-port through saprolite: Water Resources Research, v. 31, p. 435-445.
Larson, R.A., and Weber, E.J., 1994, Reaction mechanisms in environmental organic chemistry: Boca Raton, Fla., Lewis Publishers, 433 p.
Liang, Lin, and Singer, P.C., 2003, Factors influencing the formation and relative distribution of haloacetic acids and trihalomethanes in drinking water: Environmental Science and Technology, v. 37, p. 2920-2928.
Louis, J.B., Sanders, P.F., and Bono, P.M., 1994, Implementa-tion of a program to assess the vulnerability of New Jersey’s drinking water supplies to pesticide contamination, in Weig-mann, D.L, ed., Proceedings of the Fourth National Confer-ence on Pesticides, November 1-3, 1993—New Directions in pesticide research, management, and policy: Blacksburg, Va., Virginia Resources Research Center, p. 167-183.
Madison, R.J. and Brunett, J.O., 1985, Overview of the occur-rence of nitrate in ground water of the United States, in National Water Summary 1984; hydrologic events, selected water-quality trends, and ground-water resources: U.S. Geo-logical Survey Water-Supply Paper 2275, p. 93-105.
McCarthy, J.F., and Zachara, J.M., 1989, Subsurface transport of contaminants: Environmental Science and Technology, v. 23, p. 496-502.
McClanahan, M.A., 1977, Recycle—what disinfectant for safe water then?, in Johnson, J.D., ed., Disinfection, water and wastewater: Ann Arbor, Mich., Ann Arbor Science Publish-ers, Inc., p. 49-65.
Miller, R.E., Randtke, S.J., Hathaway, L.R., and Denne, J.E., 1990, Organic carbon and THM formation potential in Kan-sas groundwaters: Journal of the AWWA, v. 82, p. 49-62.
Minard, J.P., and Rhodehamel, E.C., 1969, Quaternary geol-ogy in part of northern New Jersey and the Trenton area, in Subitsky, Seymour, ed., Geology of selected areas in New Jersey and eastern Pennsylvania and guidebook of excur-sions: New Brunswick, N. J., Rutgers University Press, p. 279-313.
Muller-Wegener, U., 1988, Interaction of humic substances with biota, in Frimmel, F.H., and Christman, R.F., eds., Humic substances and their role in the environment: Chich-ester, England, John Wiley and Sons, p. 179-192.
New Jersey Department of Environmental Protection, 1997, Standards for safe drinking water in New Jersey: Trenton, N. J., New Jersey Department of Environmental Protection, November 1997.
Owens, J.P., and Sohl, N.F., 1969, Shelf and deltaic paleoenvi-ronments in the Cretaceous-Tertiary formations of the New Jersey Coastal Plain, in Subitsky, Seymour, ed., Geology of selected areas in New Jersey and eastern Pennsylvania and guidebook of excursions: New Brunswick, N.J., Rutgers University Press, p. 235-278.
Perlmutter, N.M., and Koch, E., 1972, Preliminary hydro-geologic appraisal of nitrate in ground water and streams, southern Nassau County, Long Island, New York: U.S. Geological Survey Professional Paper 800-B, p. 225-235.
Pomes, M.L., Larive, C.K., Thurman, E.M., Green, W.R., Orem, W.H., Rostad, C.E., Coplen, T.B., Cutak, B.J., and Dixon, A.M., 2000, Sources and haloacetic acid/trihalo-methane formation potentials of aquatic humic substances in the Wakarusa River and Clinton Lake near Lawrence, Kansas: Environmental Science and Technology, v. 34, p. 4278-4286.
Pritt, J.W. and Raese, J.W., 1995, Quality assurance/qual-ity control manual—National Water Quality Laboratory: U.S.Geological Survey Open-File Report 95-443, 35 p.
Reckow, D.A., Singer, P.C., and Malcolm, R.L., 1990, Chlori-nation of humic materials: Byproduct formation and chemi-cal interpretations: Environmental Science and Technology, v. 24, p. 1655-1664.
Rook, J.J., 1974, Formation of haloforms during chlorination of natural water: Water Treatment Examiner, v. 23, p. 234-243.
Smith, J.A., Witkowski, P.J., and Fusillo, T.V., 1988, Man-made organic compounds in the surface waters of the United States—a review of current understanding: U.S. Geological Survey Circular 1007, 92 p.
Stackelberg, P.E., Hopple, J.A., and Kauffman, L.J., 1997, Occurrence of nitrate, pesticides, and volatile organic com-pounds in the Kirkwood-Cohansey aquifer system, South-ern New Jersey: U.S. Geological Survey Water-Resources Investigations Report 97-4241.
Stevens, A.A., Slocum, C.J., Seeger, D.P., and Roebeck, G.G., 1976, Chlorination of organics in drinking water: Journal of the American Water Works Association, v. 68, p. 615.
�8 Water-Quality, Organic Carbon, and Disinfection By-Product, Water-Supply Wells, New Jersey, 1998-99

Szabo, Zoltan, Zapecza, O.S., and Nawyn, J.P., 1989, Effects of ground-water chemistry on the distribution of dissolved uranium and radium-226 in the Newark Basin, New Jersey, in Daniel, C.C., III, White, R.K., and Stone, P.A., eds., Ground water in the Piedmont: Proceedings of a confer-ence on ground water in the Piedmont of the Eastern United States: Clemson, S. C., Clemson University Press, p. 566-586.
Thurman, E.M., 1985, Organic geochemistry of natural waters: Dordrecht, Holland, Martinus Nijhoff/Dr W. Junk Publishers., 497 p.
U.S. Environmental Protection Agency, 1994, National primary drinking water regulations: monitoring require-ments for public drinking water supplies: Cryptosporidium, Giardia, viruses, disinfection by-products, water treatment plant data and other information requirements; proposed rule: Federal Register 59 (28), 6332.
U.S. Environmental Protection Agency, 1998, National Primary Drinking Water regulations: Disinfectants and dis-infection byproducts, Final rule: Federal Register 63 (241) Wed. Dec. 16, 69413.
U.S. Environmental Protection Agency, 2001, National Pri-mary Drinking Water Standards: Office of Water, Washing-ton, D.C., EPA 816-F-01-007, March 2001.
Van Houten, F.B., 1969, Late Triassic Newark Group, north-central New Jersey and adjacent New York and Pennsylva-nia, in Subitsky, Seymour, ed., Geology of selected areas in New Jersey and eastern Pennsylvania and guidebook of excursions: New Brunswick, N. J., Rutgers University Press, p. 314-347.
Verschueren, K., 1983, Handbook of environmental data on organic chemicals: New York, N.Y., Van Nostrand Reinhold Company, Inc., 1310 p.
Wong, S., Hanna, J.V., King, S., Carroll, T.J., Eldridge, R.J., Dixon, D.R., Bolto, B.A., Hesse, S., Abbt-Braun, G., and Frimmel, F.H., 2002, Fractionation of natural organic matter in drinking water and characterization of 13C cross-polar-ization magic-angle spinning NMR spectroscopy and size exclusion chromatography: Environmental Science and Technology, v. 36, p. 3497-3503.
Zapecza, O.S., 1989, Hydrogeologic framework of the New Jersey Coastal Plain, Regional Aquifer-System Analysis—northern Atlantic Coastal Plain: U.S. Geological Survey Professional Paper 1404-B, 49 p., 24 pl.
References Cited �9

�0 Water-Quality, Organic Carbon, and Disinfection By-Product, Water-Supply Wells, New Jersey, 1998-99
Appendixes

App
endi
x 1-
1 Qu
ality
-ass
uran
ce d
ata
(bla
nks,
repl
icat
es, a
nd re
late
d en
viro
nmen
tal s
ampl
es) f
or w
ater
sam
ples
from
com
mun
ity w
ater
-sup
ply
wel
ls, N
ew J
erse
y, 1
998-
99.
[BR
, bed
rock
; GL,
gla
cial
; CP,
unc
onfin
ed C
oast
al P
lain
; CC
P, c
onfin
ed C
oast
al P
lain
; AN
C, a
cid-
neut
raliz
ing
capa
city
; Lab
, lab
orat
ory;
µS/
cm, m
icro
siem
ens p
er c
entim
eter
at 2
5o Cel
sius
; mg/
L, m
illig
ram
s pe
r lite
r; µg
/L, m
icro
gram
s per
lite
r; nd
, no
data
; <, l
ess t
han;
E, e
stim
ated
; M, p
rese
nce
verif
ied
but n
ot q
uant
ified
. Num
ber i
n pa
rent
hese
s is p
aram
eter
cod
e us
ed to
iden
tify
the
cons
titue
nt, p
rope
rty, o
r cha
r-ac
teris
tic in
the
U.S
. Geo
logi
cal S
urve
y N
atio
nal W
ater
Info
rmat
ion
Syst
em (N
WIS
) dat
abas
e.]
USG
S w
ell
num
ber
Aqu
ifer
type
Dat
e sa
mpl
ed
Stat
ion
iden
tific
atio
n nu
mbe
rSa
mpl
e ty
pe
Lab
AN
C (m
g/L
as
CaCO
�) (9
0�10
)
Lab
pH
(00�
0�)
Lab
spec
ific
cond
uc-
tanc
e (µ
S/cm
) (9
009�
)
Dis
solv
ed
orga
nic
carb
on
(mg/
L)
(00�
81)
Tota
l or
gani
c ca
rbon
(m
g/L)
(0
0�80
)
Calc
ium
(m
g/L)
(0
091�
)
Mag
nesi
um
(mg/
L)
(009
��)
Sodi
um
(mg/
L)
(009
�0)
Pota
ssiu
m
(mg/
L)
(009
��)
2104
02B
R09
/15/
9940
1936
0743
9300
5En
viro
nmen
tal
218
6.9
571
1.0
1.0
68.2
23.0
15.9
1.67
2104
02B
R09
/15/
9940
1936
0743
9300
5R
eplic
ate
219
6.9
573
11
6823
.015
.71.
7027
0155
GL
09/1
6/99
4050
1807
4274
501
Envi
ronm
enta
l15
77.
371
00.
60.
673
.826
.321
.91.
3927
0155
GL
09/1
6/99
4050
1807
4274
501
Rep
licat
e15
77.
371
90.
70.
873
.926
.322
.11.
4207
0177
CP
07/2
4/98
3955
2107
5043
501
Envi
ronm
enta
l45
6.3
344
0.7
1.0
36.0
8.52
9.55
5.62
0701
77C
P07
/24/
9839
5521
0750
4350
1R
eplic
ate
456.
234
20.
70.
736
.18.
529.
475.
46
0100
39C
CP
07/3
0/98
3923
2407
4231
401
Envi
ronm
enta
l53
7.3
149
0.4
0.6
5.40
1.84
20.5
3.01
0100
39C
CP
07/3
0/98
3923
2407
4231
401
Rep
licat
e53
7.3
147
0.4
0.5
5.45
1.85
20.7
3.05
3500
83B
R10
/12/
9940
3557
0742
7550
3B
lank
28.
3 E
2<0
.33
<0.3
<0.0
2<0
.014
<0.0
9<0
.24
2301
95C
P07
/21/
9840
2537
0742
0020
1B
lank
26.
8
20.
20.
2<0
.02
<0.0
04<0
.10
<0.1
2104
02B
R09
/14/
9940
1936
0743
9300
5B
lank
27.
8
2<0
.1<0
.3<0
.02
<0.1
20<0
.09
<0.1
0901
36C
CP
08/2
7/98
3911
5207
4392
701
Bla
nk2
7.9
2
<0.0
1<0
.1<0
.02
<0.0
04<0
.10
<0.1
Appendixes �1
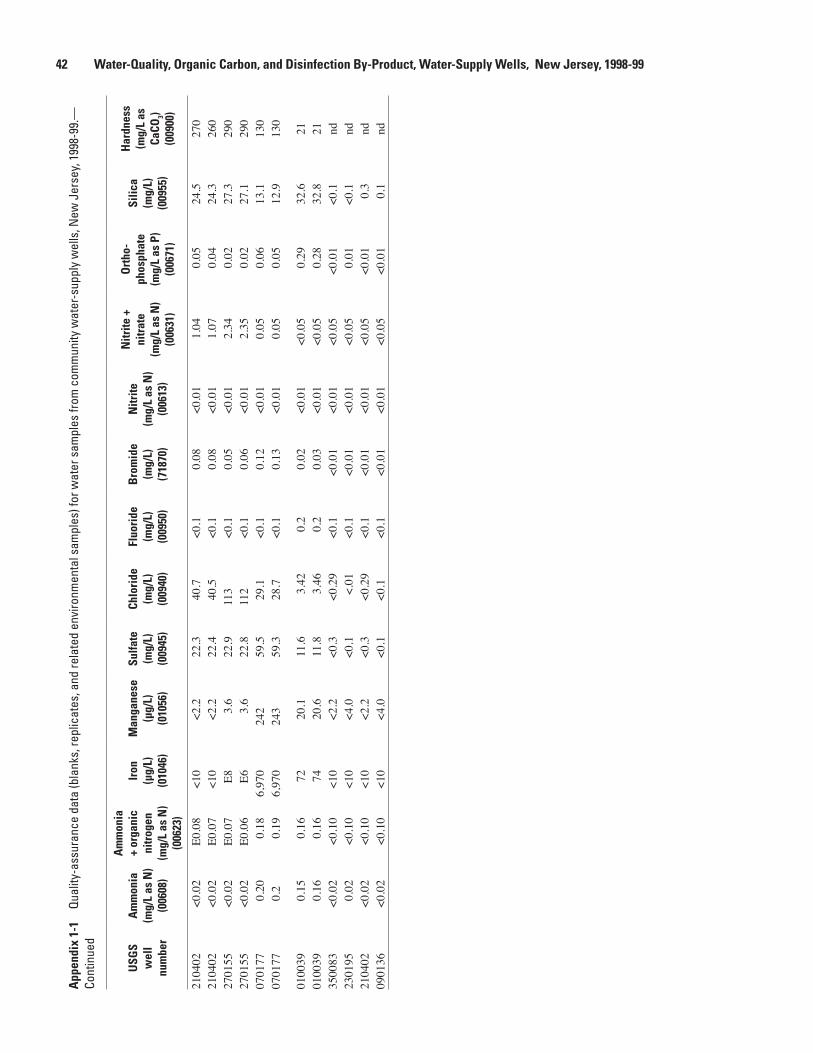
App
endi
x 1-
1 Qu
ality
-ass
uran
ce d
ata
(bla
nks,
repl
icat
es, a
nd re
late
d en
viro
nmen
tal s
ampl
es) f
or w
ater
sam
ples
from
com
mun
ity w
ater
-sup
ply
wel
ls, N
ew J
erse
y, 1
998-
99.—
Cont
inue
d
USG
S w
ell
num
ber
Am
mon
ia
(mg/
L as
N)
(00�
08)
Am
mon
ia
+ or
gani
c ni
trog
en
(mg/
L as
N)
(00�
��)
Iron
(µ
g/L)
(0
10��
)
Man
gane
se
(µg/
L)
(010
��)
Sulfa
te
(mg/
L)
(009
��)
Chlo
ride
(m
g/L)
(0
09�0
)
Fluo
ride
(m
g/L)
(0
09�0
)
Bro
mid
e (m
g/L)
(�
18�0
)
Nitr
ite
(mg/
L as
N)
(00�
1�)
Nitr
ite +
ni
trat
e (m
g/L
as N
) (0
0��1
)
Ort
ho-
phos
phat
e (m
g/L
as P
) (0
0��1
)
Silic
a (m
g/L)
(0
09��
)
Har
dnes
s (m
g/L
as
CaCO
�) (0
0900
)
2104
02<0
.02
E0.0
8<1
0<2
.222
.340
.7<0
.10.
08<0
.01
1.04
0.05
24.5
270
2104
02<0
.02
E0.0
7<1
0<2
.222
.440
.5<0
.10.
08<0
.01
1.07
0.04
24.3
260
2701
55<0
.02
E0.0
7E8
3.6
22.9
113
<0.1
0.05
<0.0
12.
340.
0227
.329
027
0155
<0.0
2E0
.06
E63.
622
.811
2<0
.10.
06<0
.01
2.35
0.02
27.1
290
0701
770.
200.
186,
970
242
59.5
29.1
<0.1
0.12
<0.0
10.
050.
0613
.113
007
0177
0.2
0.19
6,97
024
359
.328
.7<0
.10.
13<0
.01
0.05
0.05
12.9
130
0100
390.
150.
1672
20.1
11.6
3.42
0.2
0.02
<0.0
1<0
.05
0.29
32.6
2101
0039
0.16
0.16
7420
.611
.83.
460.
20.
03<0
.01
<0.0
50.
2832
.821
3500
83<0
.02
<0.1
0<1
0<2
.2<0
.3<0
.29
<0.1
<0.0
1<0
.01
<0.0
5<0
.01
<0.1
nd23
0195
0.02
<0.1
0<1
0<4
.0<0
.1<.
01<0
.1<0
.01
<0.0
1<0
.05
0.01
<0.1
nd21
0402
<0.0
2<0
.10
<10
<2.2
<0.3
<0.2
9<0
.1<0
.01
<0.0
1<0
.05
<0.0
10.
3nd
0901
36<0
.02
<0.1
0<1
0<4
.0<0
.1<0
.1<0
.1<0
.01
<0.0
1<0
.05
<0.0
10.
1nd
�� Water-Quality, Organic Carbon, and Disinfection By-Product, Water-Supply Wells, New Jersey, 1998-99

App
endi
x 1-
1 Qu
ality
-ass
uran
ce d
ata
(bla
nks,
repl
icat
es, a
nd re
late
d en
viro
nmen
tal s
ampl
es) f
or w
ater
sam
ples
from
com
mun
ity w
ater
-sup
ply
wel
ls, N
ew J
erse
y, 1
998-
99.—
Cont
inue
d
USG
S w
ell
num
ber
Dis
solv
ed
solid
s (m
g/L)
(�
0�01
)
Ben
zene
(µ
g/L)
(�
�0�0
)
Bro
mo-
dich
loro
-m
etha
ne
(µg/
L)
(��1
01)
Bro
mo-
form
(µ
g/L)
(�
�10�
)
Carb
on
tetr
a-ch
lori
de
(µg/
L)
(��1
0�)
Chlo
ro-
benz
ene
(µg/
L)
(���
01)
Chlo
rofo
rm
(µg/
L)
(��1
0�)
Dib
rom
o-ch
loro
-m
etha
ne
(µg/
L)
(��1
0�)
1,�-
Dic
hlor
o-be
nzen
e (µ
g/L)
(�
����
)
1,�-
Dic
hlor
o-be
nzen
e (µ
g/L)
(�
����
)
1,�-
Dic
hlor
o-be
nzen
e (µ
g/L)
(�
���1
)
Dic
hlor
o-di
fluor
o-m
etha
ne
(µg/
L)
(���
�8)
1,1-
Dic
hlor
o-et
hane
(µ
g/L)
(�
��9�
)
2104
0232
5<0
.10
<0.0
5<0
.10
<0.0
9<0
.03
E0.0
5<0
.2<0
.05
<0.0
5<0
.05
<0.1
4<0
.07
2104
0233
1<0
.10
<0.0
5<0
.10
<0.0
9<0
.03
E0.0
5<0
.2<0
.05
<0.0
5<0
.05
<0.1
4<0
.07
2701
5538
7<0
.04
E0.0
4<0
.06
<0.0
6<0
.03
4.10
<0.2
<0.0
5<0
.05
<0.0
5<0
.27
E0.0
527
0155
391
<0.0
4E0
.03
<0.0
6<0
.06
<0.0
33.
98<0
.2<0
.05
<0.0
5<0
.05
<0.2
7E0
.05
0701
7720
4<0
.2<0
.2<0
.2<0
.2<0
.2<0
.2<0
.2<0
.2<0
.2<0
.2<0
.2<0
.207
0177
203
<0.2
<0.2
<0.2
<0.2
<0.2
<0.2
<0.2
<0.2
<0.2
<0.2
<0.2
<0.2
0100
3910
9<0
.2<0
.2<0
.2<0
.2<0
.2<0
.2<0
.2<0
.2<0
.2<0
.2<0
.2<0
.201
0039
110
<0.2
<0.2
<0.2
<0.2
<0.2
<0.2
<0.2
<0.2
<0.2
<0.2
<0.2
<0.2
3500
83nd
<0.0
4<0
.05
<0.0
6<0
.06
<0.0
3<0
.05
<0.2
<0.0
5<0
.05
<0.0
5<0
.27
<0.0
723
0195
nd<0
.2<0
.2<0
.2<0
.2<0
.2<0
.2<0
.2<0
.2<0
.2<0
.2<0
.2<0
.221
0402
nd<0
.10
<0.0
5<0
.10
<0.0
9<0
.03
<0.0
5<0
.2<0
.05
<0.0
5<0
.05
<0.1
4<0
.07
0901
36nd
<0.2
<0.2
<0.2
<0.2
<0.2
<0.2
<0.2
<0.2
<0.2
<0.2
<0.2
<0.2
Appendixes ��

App
endi
x 1-
1 Qu
ality
-ass
uran
ce d
ata
(bla
nks,
repl
icat
es, a
nd re
late
d en
viro
nmen
tal s
ampl
es) f
or w
ater
sam
ples
from
com
mun
ity w
ater
-sup
ply
wel
ls, N
ew
Jers
ey, 1
998-
99.—
Cont
inue
d
USG
S w
ell
num
ber
1,�-
Dic
hlor
o-et
hane
(µ
g/L)
(�
�10�
)
1,1-
Dic
hlor
o-et
hyle
ne
(µg/
L)
(���
01)
cis-
1,�-
Dic
hlor
o-et
hyle
ne
(µg/
L)
(��0
9�)
tran
s-1,
�-D
ichl
oro-
ethy
lene
(µ
g/L)
(�
����
)
1,�-
Dic
hlor
o-pr
opan
e (µ
g/L)
(�
���1
)
Ethy
l-be
nzen
e (µ
g/L)
(�
���1
)
Met
hyle
ne
chlo
ride
(µ
g/L)
(�
����
)
Met
hyl
tert
-but
yl
ethe
r (µ
g/L)
(�
80��
)
Styr
ene
(µg/
L)
(��1
�8)
Tetr
achl
ro-
ethy
lene
(µ
gL)
(���
��)
Tolu
ene
(µg/
L)
(��0
10)
1,1,
1-Tr
i-ch
loro
-et
hane
(µ
g/L)
(�
��0�
)
Tric
hlor
o-et
hyle
ne
(µg/
L)
(�91
80)
2104
02<0
.1<0
.04
<0.0
4<0
.03
<0.0
7<0
.03
<0.4
M<0
.04
<0.1
0<0
.05
<0.0
3<0
.04
2104
02<0
.1<0
.04
<0.0
4<0
.03
<0.0
7<0
.03
<0.4
M<0
.04
<0.1
0<0
.05
<0.0
3<0
.04
2701
55<0
.1<0
.04
<0.0
4<0
.03
<0.0
7<0
.03
<0.4
0.7
<0.0
4<0
.10
<0.0
50.
25<0
.04
2701
55<0
.1<0
.04
<0.0
4<0
.03
<0.0
7<0
.03
<0.4
0.7
<0.0
4<0
.10
<0.0
50.
26<0
.04
0701
772.
9<0
.210
.0<0
.2<0
.2<0
.2<0
.2<0
.2<0
.21.
9<0
.2<0
.243
.007
0177
3<0
.210
.4<0
.2<0
.2<0
.2<0
.2<0
.2<0
.22
<0.2
<0.2
40.0
0100
39<0
.2<0
.2<0
.2<0
.2<0
.2<0
.2<0
.2<0
.2<0
.2<0
.2<0
.2<0
.2<0
.201
0039
<0.2
<0.2
<0.2
<0.2
<0.2
<0.2
<0.2
<0.2
<0.2
<0.2
<0.2
<0.2
<0.2
3500
83<0
.1<0
.04
<0.0
4<0
.03
<0.0
7<0
.03
<0.4
<0.2
<0.0
4<0
.10
E0.0
8<0
.03
<0.0
423
0195
<0.2
<0.2
<0.2
<0.2
<0.2
<0.2
<0.2
<0.2
<0.2
<0.2
<0.2
<0.2
<0.2
2104
02<0
.1<0
.04
<0.0
4<0
.03
<0.0
7<0
.03
<0.4
<0.2
<0.0
4<0
.10
E0.0
2<0
.03
<0.0
409
0136
<0.2
<0.2
<0.2
<0.2
<0.2
<0.2
<0.2
<0.2
<0.2
<0.2
<0.2
<0.2
<0.2
App
endi
x 1-
1 Qu
ality
-ass
uran
ce d
ata
(bla
nks,
repl
icat
es, a
nd re
late
d en
viro
nmen
tal s
ampl
es) f
or w
ater
sa
mpl
es fr
om c
omm
unity
wat
er-s
uppl
y w
ells
, New
Jer
sey,
199
8-99
.—Co
ntin
ued
USG
S w
ell
num
ber
Tric
hlor
o-flu
oro-
met
hane
(µ
g/L)
(�
��88
)
Viny
l ch
lori
de
(µg/
L)
(�91
��)
m, p
-Xy
lene
(µ
g/L)
(8
��9�
)
o-Xy
lene
(µ
g/L)
(�
�1��
)
Xyle
ne
(µg/
L)
(81�
�1)
2104
02<0
.09
<0.1
<0.0
6<0
.06
nd21
0402
<0.0
9<0
.1<0
.06
<0.0
6nd
2701
550.
18<0
.1<0
.06
<0.0
4nd
2701
550.
18<0
.1<0
.06
<0.0
4nd
0701
77<0
.2<0
.2nd
nd<0
.207
0177
<0.2
<0.2
ndnd
<0.2
0100
39<0
.2<0
.2nd
nd<0
.201
0039
<0.2
<0.2
ndnd
<0.2
3500
83<0
.09
<0.1
<0.0
6<0
.04
nd23
0195
<0.2
<0.2
ndnd
<0.2
2104
02<0
.09
<0.1
<0.0
6<0
.06
nd09
0136
<0.2
<0.2
ndnd
<0.2
�� Water-Quality, Organic Carbon, and Disinfection By-Product, Water-Supply Wells, New Jersey, 1998-99

App
endi
x 1-
� Qu
ality
-ass
uran
ce d
ata
(bla
nks,
repl
icat
es, a
nd re
late
d en
viro
nmen
tal s
ampl
es) f
or c
hlor
inat
ed w
ater
sam
ples
from
com
mun
ity w
ater
-sup
ply
wel
ls, N
ew
Jers
ey, 1
998-
99.
[BR
, bed
rock
; GL,
gla
cial
; CP,
unc
onfin
ed C
oast
al P
lain
; CC
P, c
onfin
ed C
oast
al P
lain
; mg/
L, m
illig
ram
s per
lite
r; µg
/L, m
icro
gram
s per
lite
r; nd
, no
data
; <, l
ess t
han.
Num
ber i
n pa
rent
hese
s is p
aram
eter
co
de u
sed
to id
entif
y th
e co
nstit
uent
, pro
perty
, or c
hara
cter
istic
in th
e U
.S. G
eolo
gica
l Sur
vey
Nat
iona
l Wat
er In
form
atio
n Sy
stem
(NW
IS) d
atab
ase.
]
USG
S w
ell
num
ber
Aqu
ifer
type
Dat
e co
llect
edTi
me
colle
cted
Sam
ple
type
Incu
-ba
tion
time
(hou
rs)
Chlo
rine
do
se
(mg/
L)
(99�
00)
Chlo
rine
re
sidu
al
(mg/
L)
(99�
01)
Chlo
rate
(m
g/L)
(9
9��0
)
Bro
mo-
dich
loro
-m
etha
ne
(µg/
L)
(99�
0�)
Bro
mo-
form
(µ
g/L)
(9
9�0�
)
Chlo
ro-
form
(µ
g/L)
(9
9�0�
)
Dib
rom
o-ch
loro
-m
etha
ne
(µg/
L)
(99�
0�)
Chlo
ral
hydr
ate
(µg/
L)
(99�
�1)
Bro
mo-
chlo
ro-
acet
ic
acid
(µg/
L)
(99�
��)
2104
02B
R09
/15/
9990
0En
viro
nmen
tal
168
55
1,80
06.
73.
74.
96.
31.
53.
221
0402
BR
09/1
5/99
901
Rep
licat
e16
85
51,
800
6.4
44.
66.
21.
73.
327
0155
GL
09/1
6/99
900
Envi
ronm
enta
l16
85
41,
800
5.8
2.5
7.5
5.4
1.8
2.3
2701
55G
L09
/16/
9990
1R
eplic
ate
168
55
1,90
05
2.4
6.9
4.9
1.3
1.7
0701
77C
P07
/24/
9890
0En
viro
nmen
tal
168
104
1,60
015
117
7.1
2.7
3.1
0701
77C
P07
/24/
9890
1R
eplic
ate
168
104
1,70
014
116
6.9
2.3
4.1
0100
39C
CP
07/2
8/98
900
Envi
ronm
enta
l16
8nd
nd
850
8.6
0.2
313.
2<0
.13.
401
0039
CC
P07
/28/
9890
1R
eplic
ate
168
7.5
4
790
8.8
0.2
323.
4<0
.13.
235
0083
BR
10/1
2/99
1005
Bla
nk16
85
42,
000
<0.1
<0.1
3<0
.13.
7<0
.123
0195
CP
07/2
1/98
1005
Bla
nk16
87.
56
9
5<0
.1<0
.16.
8<0
.112
01.
121
0402
BR
09/1
4/99
905
Bla
nk16
85
42,
100
0.8
<0.1
4.8
0.1
5.8
<0.1
0901
36C
CP
08/2
7/98
1005
Bla
nk16
87.
54
59
0<0
.1<0
.10.
7<0
.11.
2<0
.1
Appendixes ��

App
endi
x 1-
� Qu
ality
-ass
uran
ce d
ata
(bla
nks,
repl
icat
es, a
nd re
late
d en
viro
nmen
tal s
ampl
es) f
or c
hlor
inat
ed w
ater
sam
ples
from
com
mun
ity w
ater
-sup
ply
wel
ls,
New
Jer
sey,
199
8-99
.—Co
ntin
ued
USG
S w
ell
num
ber
Aqu
ifer
type
Dib
rom
o-ac
etic
ac
id
(µg/
L)
(99�
1�)
Dic
hlor
o-ac
etic
ac
id
(µg/
L)
(99�
09)
Mon
o-ch
loro
-ac
etic
ac
id (µ
g/L)
(9
9�08
)
Tric
hlor
o-ac
etic
ac
id
(µg/
L)
(99�
10)
Dic
hlor
o-ac
eto-
nitr
ile
(µg/
L)
(99�
1�)
Bro
mo-
chlo
ro-
acet
onitr
ile
(µg/
L)
(99�
1�)
Dib
rom
o-ac
eto-
nitr
ile
(µg/
L)
(99�
1�)
Tric
hlor
o-ac
eto-
nitr
ile
(µg/
L)
(99�
1�)
Chlo
ro-
picr
in
(µg/
L)
(99�
19)
1,1,
1-Tr
ichl
oro-
�-pr
opan
one
(µg/
L)
(99�
1�)
1,1-
Dic
hlor
o-�-
prop
anon
e (µ
g/L)
(9
9�18
)
2104
02B
R3.
73.
23.
81.
7<0
.10.
61.
0<0
.1nd
ndnd
2104
02B
R4.
13
<0.1
1.8
<0.1
0.6
1.1
<0.1
ndnd
nd27
0155
GL
2.5
2.1
2.8
1.7
<0.1
0.6
0.9
<0.1
ndnd
nd27
0155
GL
1.9
1.2
<0.1
1.2
<0.1
0.6
<0.1
<0.1
ndnd
nd07
0177
CP
1.4
6.9
<0.1
4.0
<0.1
<0.1
1.1
<0.1
ndnd
nd07
0177
CP
29.
2<0
.15.
4<0
.1<0
.11
<0.1
ndnd
nd
0100
39C
CP
<0.1
14<0
.118
.0<0
.1<0
.1<0
.1<0
.1nd
ndnd
0100
39C
CP
<0.1
14<0
.116
<0.1
<0.1
<0.1
<0.1
ndnd
nd35
0083
BR
<0.1
1.9
<0.1
3.3
<0.1
<0.1
<0.1
<0.1
ndnd
nd23
0195
CP
<0.1
3<0
.11.
8<0
.1<0
.1<0
.1<0
.1nd
ndnd
2104
02B
R<0
.12.
94.
13.
4<0
.1<0
.1<0
.1<0
.1nd
nd0.
509
0136
CC
P<0
.1<0
.1<0
.1<0
.1<0
.1<0
.1<0
.1<0
.1nd
ndnd
�� Water-Quality, Organic Carbon, and Disinfection By-Product, Water-Supply Wells, New Jersey, 1998-99

App
endi
x �
Cons
titue
nt c
once
ntra
tions
in, a
nd c
hara
cter
istic
s of
, wat
er s
ampl
es fr
om 2
0 co
mm
unity
wat
er-s
uppl
y w
ells
, New
Jer
sey
1998
-99.
[BR
CKS
, Bru
nsw
ick;
PSS
C, P
assa
ic; S
CKN
, Sto
ckto
n; S
FDF,
Stra
tifie
d D
rift;
MR
PAU
, Upp
er P
otom
ac-R
arita
n-M
agot
hy; M
RPA
M, M
iddl
e Po
tom
ac-R
arita
n-M
agot
hy; M
RPA
L, L
ower
Pot
omac
-Rar
itan-
Mag
othy
; OD
BG, O
ldbr
idge
; C
KKD
, Kirk
woo
d-C
ohan
sey;
KR
KDL,
Low
er K
irkw
ood;
BR
, bed
rock
; GL,
gla
cial
; CP,
unc
onfin
ed C
oast
al P
lain
; CC
P, c
onfin
ed C
oast
al P
lain
; Lab
, lab
orat
ory;
AN
C, a
cid-
neut
raliz
ing
capa
city
; µS/
cm, m
icro
siem
ens
per c
entim
eter
at
25o C
elsi
us; o C
, deg
rees
Cel
sius
; mg/
L, m
illigr
ams
per l
iter;
µg/L
, mic
rogr
ams
per l
iter,
nd, n
o da
ta; <
, les
s th
an; E
, est
imat
ed; M
, pre
senc
e ve
rifie
d bu
t not
qua
ntifi
ed. N
umbe
r in
pare
nthe
ses
is p
aram
eter
cod
e us
ed to
iden
tify
the
cons
titue
nt, p
rope
rty, o
r cha
ract
eris
tic in
the
U.S
. Geo
logi
cal S
urve
y N
atio
nal W
ater
Info
rmat
ion
Syst
em (N
WIS
) dat
abas
e.]
USG
S w
ell
num
ber
Aqu
ifer
code
Aqu
ifer
type
Dat
e sa
mpl
edSt
atio
n id
entif
i-ca
tion
num
ber
Fiel
d al
ka-
linity
(m
g/L
as
CaCO
�) (�
908�
)
Lab
AN
C (m
g/L
as
CaCO
�) (9
0�10
)
Dis
solv
ed
oxyg
en
(mg/
L)
(00�
00)
Fiel
d pH
(0
0�00
)
Lab
pH
(00�
0�)
Spec
ific
cond
uc-
tanc
e (µ
S/cm
) (0
009�
)
Lab
spec
ific
cond
uc-
tanc
e (µ
S/cm
) (9
009�
)
Tem
per-
atur
e (o C)
(0
0100
)
Dis
solv
ed
orga
nic
carb
on
(mg/
L)
(00�
81)
Tota
l or
gani
c ca
rbon
(m
g/L)
(0
0�80
)
0303
0122
7BR
CK
SB
R09
/22/
9941
0046
0740
7470
116
016
61.
87.
77.
52,
250
2,26
012
.50.
20.
403
0460
227P
SSC
BR
09/2
2/99
4055
4007
4081
601
189
200
5.3
7.3
7.1
69
7
697
14.5
0.9
0.3
1300
9822
7PSS
CB
R09
/21/
9940
4534
0741
4020
118
119
53.
47.
37.
2
956
94
313
.40.
90.
521
0402
231S
CK
NB
R09
/15/
9940
1936
0743
9300
520
621
83.
06.
86.
9
575
57
113
.91.
01.
035
0083
227P
SSC
BR
10/0
7/99
4035
5707
4275
503
131
133
1.2
7.4
7.4
1,45
01,
430
12.9
0.6
0.5
2700
8011
2SFD
FG
L09
/20/
9940
5414
0743
1090
114
515
52.
17.
87.
5
589
59
411
.90.
70.
527
0147
112S
FDF
GL
09/2
0/99
4048
5607
4233
901
196
206
0.1
7.9
7.8
68
5
686
12.4
1.4
1.2
2701
5511
2SFD
FG
L09
/16/
9940
5018
0742
7450
114
915
70.
67.
37.
3
713
71
014
.10.
60.
627
0182
112S
FDF
GL
09/2
1/99
4051
1107
4231
001
134
138
1.3
8.1
7.8
38
2
390
12.1
0.4
E0.2
3904
5111
2SFD
FG
L09
/23/
9940
4248
0741
8520
217
418
53.
37.
47.
4
663
65
412
.90.
80.
4
0500
3921
1MR
PAM
CP
07/2
8/98
4004
0407
4552
001
3738
3.1
5.7
6.1
27
5
280
13.4
0.5
0.7
0701
7721
1MR
PAL
CP
07/2
4/98
3955
2107
5043
501
5845
0.1
5.9
6.3
34
7
344
14.0
0.7
1.0
0703
6821
1MR
PAL
CP
07/2
7/98
3958
4807
5034
701
7161
0.1
6.5
6.7
25
5
245
15.2
1.1
1.0
1502
0721
1MR
PAL
CP
07/2
9/98
3951
5607
5105
301
146
145
0.1
6.4
6.7
39
9
385
13.4
1.4
1.4
2301
9521
1OD
BG
CP
07/2
2/98
4025
3707
4200
201
<1<1
0.1
4.8
5.1
25
8
259
14.6
1.0
1.2
2912
6412
1CK
KD
CP
07/2
3/98
4005
0007
4045
501
<14
2.5
4.7
5.0
18
4
185
13.2
0.8
0.9
0100
3912
2KR
KD
LC
CP
07/2
8/98
3923
2407
4231
401
4953
0.1
6.7
7.3
14
3
149
18.2
0.4
0.6
0106
0012
2KR
KD
LC
CP
07/3
0/98
3920
4507
4284
001
4554
0.1
7.0
7.7
14
2
149
18.6
0.4
0.6
0901
3612
2KR
KD
LC
CP
07/3
1/98
3911
5207
4392
701
8378
0.1
7.7
8.1
20
3
212
18.8
0.5
0.5
1502
7621
1MR
PAU
CC
P07
/27/
9839
4821
0751
0260
112
812
80.
17.
78.
1
382
37
914
.40.
70.
8
Appendixes ��
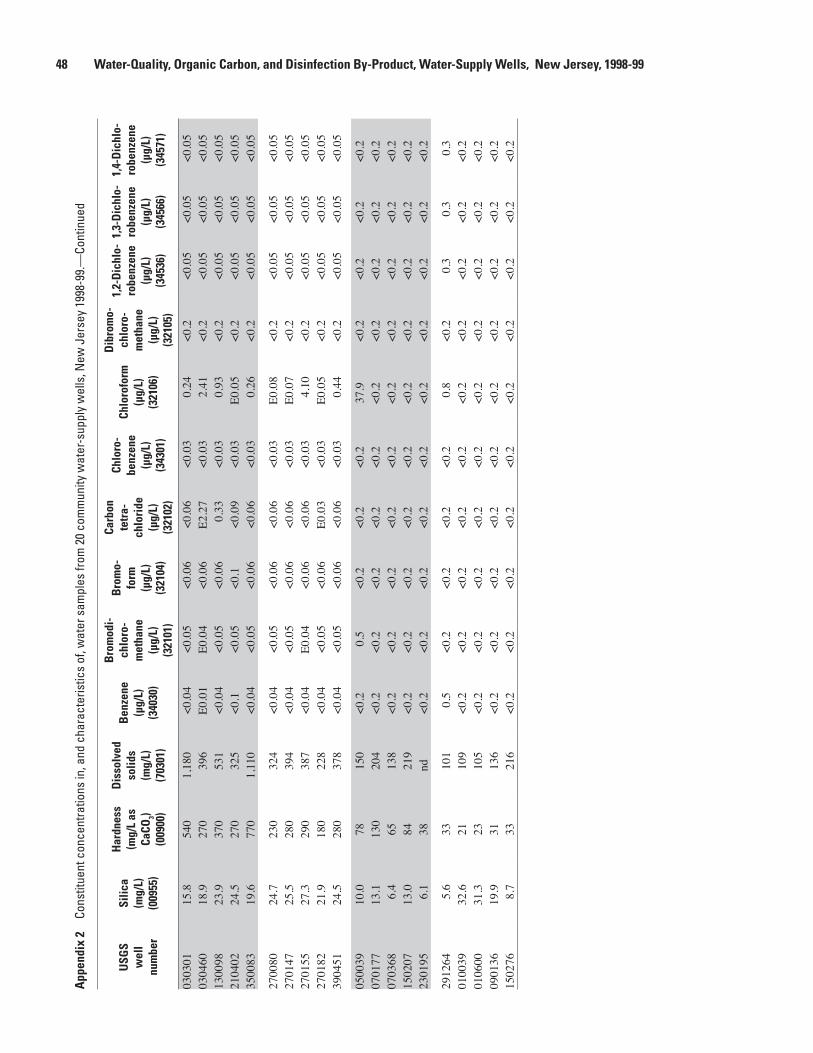
App
endi
x �
Cons
titue
nt c
once
ntra
tions
in, a
nd c
hara
cter
istic
s of
, wat
er s
ampl
es fr
om 2
0 co
mm
unity
wat
er-s
uppl
y w
ells
, New
Jer
sey
1998
-99.
—Co
ntin
ued
USG
S w
ell
num
ber
Silic
a (m
g/L)
(0
09��
)
Har
dnes
s (m
g/L
as
CaCO
�) (0
0900
)
Dis
solv
ed
solid
s (m
g/L)
(�
0�01
)
Ben
zene
(µ
g/L)
(�
�0�0
)
Bro
mod
i-ch
loro
-m
etha
ne
(µg/
L)
(��1
01)
Bro
mo-
form
(µ
g/L)
(�
�10�
)
Carb
on
tetr
a-ch
lori
de
(µg/
L)
(��1
0�)
Chlo
ro-
benz
ene
(µg/
L)
(���
01)
Chlo
rofo
rm
(µg/
L)
(��1
0�)
Dib
rom
o-ch
loro
-m
etha
ne
(µg/
L)
(��1
0�)
1,�-
Dic
hlo-
robe
nzen
e (µ
g/L)
(�
����
)
1,�-
Dic
hlo-
robe
nzen
e (µ
g/L)
(�
����
)
1,�-
Dic
hlo-
robe
nzen
e (µ
g/L)
(�
���1
)
0303
0115
.854
01,
180
<0.0
4<0
.05
<0.0
6<0
.06
<0.0
30.
24<0
.2<0
.05
<0.0
5<0
.05
0304
6018
.927
0
396
E0.0
1E0
.04
<0.0
6E2
.27
<0.0
32.
41<0
.2<0
.05
<0.0
5<0
.05
1300
9823
.937
0
531
<0.0
4<0
.05
<0.0
60.
33<0
.03
0.93
<0.2
<0.0
5<0
.05
<0.0
521
0402
24.5
270
32
5<0
.1<0
.05
<0.1
<0.0
9<0
.03
E0.0
5<0
.2<0
.05
<0.0
5<0
.05
3500
8319
.677
01,
110
<0.0
4<0
.05
<0.0
6<0
.06
<0.0
30.
26<0
.2<0
.05
<0.0
5<0
.05
2700
8024
.723
0
324
<0.0
4<0
.05
<0.0
6<0
.06
<0.0
3E0
.08
<0.2
<0.0
5<0
.05
<0.0
527
0147
25.5
280
39
4<0
.04
<0.0
5<0
.06
<0.0
6<0
.03
E0.0
7<0
.2<0
.05
<0.0
5<0
.05
2701
5527
.329
0
387
<0.0
4E0
.04
<0.0
6<0
.06
<0.0
34.
10<0
.2<0
.05
<0.0
5<0
.05
2701
8221
.918
0
228
<0.0
4<0
.05
<0.0
6E0
.03
<0.0
3E0
.05
<0.2
<0.0
5<0
.05
<0.0
539
0451
24.5
280
37
8<0
.04
<0.0
5<0
.06
<0.0
6<0
.03
0.44
<0.2
<0.0
5<0
.05
<0.0
5
0500
3910
.078
15
0<0
.20.
5<0
.2<0
.2<0
.237
.9<0
.2<0
.2<0
.2<0
.207
0177
13.1
130
20
4<0
.2<0
.2<0
.2<0
.2<0
.2<0
.2<0
.2<0
.2<0
.2<0
.207
0368
6.4
65
138
<0.2
<0.2
<0.2
<0.2
<0.2
<0.2
<0.2
<0.2
<0.2
<0.2
1502
0713
.084
21
9<0
.2<0
.2<0
.2<0
.2<0
.2<0
.2<0
.2<0
.2<0
.2<0
.223
0195
6.1
38nd
<0.2
<0.2
<0.2
<0.2
<0.2
<0.2
<0.2
<0.2
<0.2
<0.2
2912
645.
633
10
10.
5<0
.2<0
.2<0
.2<0
.20.
8<0
.20.
30.
30.
301
0039
32.6
21
109
<0.2
<0.2
<0.2
<0.2
<0.2
<0.2
<0.2
<0.2
<0.2
<0.2
0106
0031
.323
10
5<0
.2<0
.2<0
.2<0
.2<0
.2<0
.2<0
.2<0
.2<0
.2<0
.209
0136
19.9
31
136
<0.2
<0.2
<0.2
<0.2
<0.2
<0.2
<0.2
<0.2
<0.2
<0.2
1502
768.
733
21
6<0
.2<0
.2<0
.2<0
.2<0
.2<0
.2<0
.2<0
.2<0
.2<0
.2
�8 Water-Quality, Organic Carbon, and Disinfection By-Product, Water-Supply Wells, New Jersey, 1998-99

App
endi
x �
Cons
titue
nt c
once
ntra
tions
in, a
nd c
hara
cter
istic
s of
, wat
er s
ampl
es fr
om 2
0 co
mm
unity
wat
er-s
uppl
y w
ells
, New
Jer
sey
1998
-99.
—Co
ntin
ued
USG
S w
ell
num
ber
Dic
hlor
o-di
fluor
o-m
etha
ne
(µg/
L)
(���
�8)
1,1-
Dic
hlor
o-et
hane
(µ
g/L)
(�
��9�
)
1,�-
Dic
hlor
o-et
hane
(µ
g/L)
(�
�10�
)
1,1-
Dic
hlor
o-et
hyle
ne
(µg/
L)
(���
01)
cis-
1,�-
Dic
hlor
o-et
hyle
ne
(µg/
L)
(��0
9�)
tran
s-1,
�-D
ichl
oro-
ethy
lene
(µ
g/L)
(�
����
)
1,�-
Dic
hlor
o-pr
opan
e (µ
g/L)
(�
���1
)
Ethy
l-be
nzen
e (µ
g/L)
(�
���1
)
Met
hyle
ne
chlo
ride
(µ
g/L)
(�
����
)
Met
hyl
tert
bu
tyl
ethe
r (µ
g/L)
(�
80��
)
Styr
ene
(µg/
L)
(��1
�8)
Tetr
achl
oro-
ethy
lene
(µ
g/L)
(�
����
)
Tolu
ene
(µg/
L)
(��0
10)
0303
01<0
.27
0.27
<0.1
0.17
0.13
<0.0
3<0
.07
<0.0
3<0
.40.
9<0
.04
4.00
<0.0
503
0460
<0.2
70.
15<0
.10.
15E0
.05
<0.0
3<0
.07
<0.0
3<0
.41.
3<0
.04
23.0
<0.0
513
0098
E0.1
80.
13<0
.1E0
.06
1.32
E0.0
1<0
.07
<0.0
3<0
.44.
3<0
.04
19.4
<0.0
521
0402
<0.1
4<0
.07
<0.1
<0.0
4<0
.04
<0.0
3<0
.07
<0.0
3<0
.4M
<0.0
4<0
.1<0
.05
3500
83<0
.27
0.14
<0.1
0.18
0.63
<0.0
3<0
.07
<0.0
3<0
.4E0
.1<0
.04
1.86
<0.0
5
2700
80<0
.27
1.06
<0.1
0.26
0.38
<0.0
3<0
.07
<0.0
3<0
.40.
2<0
.04
E0.0
8<0
.05
2701
47<0
.27
0.79
<0.1
0.42
1.90
E0.0
2<0
.07
<0.0
3<0
.41.
6<0
.04
E0.0
8<0
.05
2701
55<0
.27
E0.0
5<0
.1<0
.04
<0.0
4<0
.03
<0.0
7<0
.03
<0.4
0.7
<0.0
4<0
.1<0
.05
2701
82E0
.03
<0.0
7<0
.1E0
.02
<0.0
4<0
.03
<0.0
7<0
.03
<0.4
E0.1
<0.0
4<0
.1<0
.05
3904
51<0
.27
<0.0
7<0
.1<0
.04
<0.0
4<0
.03
<0.0
7<0
.03
<0.4
E0.1
<0.0
40.
26<0
.05
0500
39<0
.20.
5<0
.2<0
.22.
0<0
.2<0
.2<0
.2<0
.20.
6<0
.2<0
.2<0
.207
0177
<0.2
<0.2
2.9
<0.2
10.0
<0.2
<0.2
<0.2
<0.2
<0.2
<0.2
1.9
<0.2
0703
68<0
.2<0
.2<0
.2<0
.2<0
.2<0
.2<0
.2<0
.2<0
.20.
9<0
.2<0
.2<0
.215
0207
<0.2
<0.2
0.4
<0.2
<0.2
<0.2
0.2
<0.2
<0.2
<0.2
<0.2
<0.2
<0.2
2301
95<0
.2<0
.20.
3<0
.2<0
.2<0
.2<0
.2<0
.2<0
.2<0
.2<0
.2<0
.2<0
.2
2912
64<0
.20.
5<0
.2<0
.20.
3<0
.2<0
.2<0
.2<0
.22.
6<0
.2<0
.2<0
.201
0039
<0.2
<0.2
<0.2
<0.2
<0.2
<0.2
<0.2
<0.2
<0.2
<0.2
<0.2
<0.2
<0.2
0106
00<0
.2<0
.2<0
.2<0
.2<0
.2<0
.2<0
.2<0
.2<0
.2<0
.2<0
.2<0
.2<0
.209
0136
<0.2
<0.2
<0.2
<0.2
<0.2
<0.2
<0.2
<0.2
<0.2
<0.2
<0.2
<0.2
<0.2
1502
76<0
.2<0
.2<0
.2<0
.2<0
.2<0
.2<0
.2<0
.2<0
.2<0
.2<0
.2<0
.2<0
.2
Appendixes �9

App
endi
x �
Cons
titue
nt c
once
ntra
tions
in, a
nd c
hara
cter
istic
s of
, wat
er s
ampl
es fr
om 2
0 co
mm
unity
wat
er-s
uppl
y w
ells
, New
Jer
sey
1998
-99.
—Co
ntin
ued
USG
S w
ell
num
ber
Calc
ium
(m
g/L)
(0
091�
)
Mag
nesi
um
(mg/
L)
(009
��)
Sodi
um
(mg/
L)
(009
�0)
Pota
s-si
um
(mg/
L)
(009
��)
Am
mon
ia
(mg/
L as
N)
(00�
08)
Am
mon
ia
+ or
gani
c ni
trog
en
(mg/
L as
N)
(00�
��)
Iron
(µ
g/L)
(0
10��
)
Man
g-an
ese
(µg/
L)
(010
��)
Sulfa
te
(mg/
L)
(009
��)
Chlo
ride
(m
g/L)
(0
09�0
)
Fluo
ride
(m
g/L)
(0
09�0
)
Bro
mid
e (m
g/L)
(�
18�0
)
Nitr
ite
(mg/
L as
N)
(00�
1�)
Nitr
ite +
ni
trat
e (m
g/L
as N
) (0
0��1
)
Ort
ho-
phos
phat
e (m
g/L
as P
) (0
0��1
)
0303
0111
561
.620
92.
01<0
.02
<0.1
0
<10
E
1.8
31.
563
4<0
.10.
19<0
.010
2.47
0.01
0304
6079
.217
.728
.83.
87<0
.02
E0.0
7
<10
E
2.1
32.
1 7
4.0
<0.1
0.06
<0.0
104.
860.
0113
0098
121
17.1
36.8
1.55
<0.0
2<0
.10
<1
0
<2.
2 5
5.7
150
<0.1
0.18
<0.0
103.
630.
0321
0402
68.2
23.0
15.9
1.67
<0.0
2E0
.08
<1
0
<2.
2 2
2.3
40.
7<0
.10.
08<0
.010
1.04
0.05
3500
8327
122
.739
.21.
54<0
.02
E0.0
9
<10
<
2.2
623
36.
70.
20.
10<0
.010
2.95
0.03
2700
8052
.823
.725
.21.
82<0
.02
<0.1
0 <
10
3
.1 2
3.8
78.
5<0
.10.
05<0
.01
1.49
0.03
2701
4768
.026
.529
.81.
34<0
.02
E0.0
6
E 6
39
0 5
9.4
64.
5<0
.10.
040.
028
0.17
0.08
2701
5573
.826
.321
.91.
39<0
.02
E0.0
7
E 8
3.6
22.
911
3<0
.10.
05<0
.010
2.34
0.02
2701
8244
.315
.98.
060.
89<0
.02
<0.1
0
23
<
2.2
20.
6 2
7.6
<0.1
0.06
<0.0
100.
730.
1039
0451
85.0
16.0
23.2
1.18
<0.0
2E0
.09
<1
0
<2.
2 3
9.0
73.
2<0
.10.
09<0
.010
2.54
0.02
0500
3914
.79.
9316
.93.
650.
360.
35
<10
1
6.1
29.
5 2
8.4
<0.1
0.04
<0.0
103.
190.
0107
0177
36.0
8.52
9.5
55.
620.
200.
186,
970
24
2 5
9.5
29.
1<0
.10.
12<0
.010
0.05
0.06
0703
6816
.95.
6816
.02.
461.
351.
35,
540
1,83
0 1
7.8
21.
20.
20.
05<0
.010
0.12
0.02
1502
0724
.05.
8142
.25.
820.
720.
704,
400
9
2.6
7
.3 2
7.2
0.3
0.15
<0.0
10<0
.05
<0.0
123
0195
10.8
2.78
22.9
1.68
0.79
0.87
3,57
0
181
45.
1 4
1.6
<0.1
nd<0
.010
0.05
<0.0
1
2912
648.
472.
9515
.73.
160.
270.
31
34
7
0.3
24.
4 2
5.5
<0.1
nd<0
.010
2.79
<0.0
101
0039
5.40
1.84
20.5
3.01
0.15
0.16
7
2
20.
1 1
1.6
3
.42
0.2
0.02
<0.0
10<0
.05
0.29
0106
006.
821.
3819
.92.
760.
140.
15
53
9.3
10.
3
3.8
70.
10.
03<0
.010
<0.0
50.
2909
0136
9.52
1.75
31.4
3.16
0.17
0.17
10
7
<4
10.
1
9.6
40.
20.
04<0
.010
<0.0
50.
2615
0276
9.32
2.27
67.3
5.33
0.34
0.32
10
6
6
.3 1
5.6
27.
91.
40.
11<0
.010
<0.0
50.
17
�0 Water-Quality, Organic Carbon, and Disinfection By-Product, Water-Supply Wells, New Jersey, 1998-99

Appendix � Constituent concentrations in, and characteristics of, water samples from 20 community water-supply wells, New Jersey 1998-99.—Continued
USGS well
number
1,1,1-Tri-chloro-ethane (µg/L)
(���0�)
Trichloro-ethylene
(µg/L) (�9180)
Trichloro-fluoro-
methane (µg/L)
(���88)
Vinyl chloride
(µg/L) (�91��)
m, p-Xy-lene
(µg/L) (8��9�)
o-Xylene (µg/L)
(��1��)
Xylene (µg/L)
(81��1)
030301 0.82 1.32 <0.09 <0.1 <0.06 <0.04 nd030460 0.59 0.62 <0.09 <0.1 <0.06 <0.04 nd130098 0.17 4.38 E0.09 <0.1 <0.06 <0.04 nd210402 <0.03 <0.04 <0.09 <0.1 <0.06 <0.06 nd350083 0.17 2.01 E0.04 <0.1 <0.06 <0.04 nd
270080 1.03 3.27 0.13 <0.1 <0.06 <0.04 nd270147 2.23 12.1 <0.09 <0.1 <0.06 <0.04 nd270155 0.25 <0.04 0.18 <0.1 <0.06 <0.04 nd270182 0.40 0.15 E0.03 <0.1 <0.06 <0.04 nd390451 E0.09 E0.01 <0.09 <0.1 <0.06 <0.04 nd
050039 <0.2 0.6 <0.2 <0.2 nd nd <0.2070177 <0.2 43.0 <0.2 <0.2 nd nd <0.2070368 <0.2 <0.2 <0.2 <0.2 nd nd <0.2150207 <0.2 <0.2 <0.2 <0.2 nd nd <0.2230195 <0.2 <0.2 <0.2 <0.2 nd nd <0.2
291264 0.2 0.9 <0.2 <0.2 nd nd <0.2010039 <0.2 <0.2 <0.2 <0.2 nd nd <0.2010600 <0.2 <0.2 <0.2 <0.2 nd nd <0.2090136 <0.2 <0.2 <0.2 <0.2 nd nd <0.2150276 <0.2 <0.2 <0.2 <0.2 nd nd <0.2
Appendixes �1

App
endi
x �
Conc
entra
tions
of d
isin
fect
ion
by-p
rodu
cts
form
ed in
chl
orin
ated
wat
er fr
om s
even
sel
ecte
d co
mm
unity
wat
er-s
uppl
y w
ells
in N
ew J
erse
y, 1
998-
99, d
urin
g th
ree
perio
ds o
f inc
ubat
ion.
[BR
, bed
rock
; GL,
gla
cial
; CP,
unc
onfin
ed C
oast
al P
lain
; CC
P, c
onfin
ed C
oast
al P
lain
; mg/
L, m
illig
ram
s per
lite
r; µg
/L, m
icro
gram
s per
lite
r; nd
, no
data
; <, l
ess t
han;
CH
BrC
l 2 bro
mod
ichl
orom
etha
ne; C
HB
r 3, br
omof
orm
; CH
Cl 3,
chlo
rofo
rm; C
HB
r 2Cl,
dibr
omoc
hlor
omet
hane
; B
rClA
A, b
rom
ochl
oroa
cetic
aci
d; B
r 2AA
, dib
rom
oace
tic a
cid;
Cl 2A
A d
ichl
oroa
cetic
aci
d; C
lAA
, mon
ochl
oroa
cetic
aci
d; C
l 3AA
, tric
hlor
o-ac
etic
aci
d; B
rClA
N, b
rom
ochl
oroa
ceto
nitri
le; B
r 2AN
, dib
rom
oace
toni
trile
; Cl 2A
N, d
ichl
oroa
ceto
nitri
le; C
l 3AN
, tric
hlor
oace
toni
trile
. Num
ber i
n pa
rent
hese
s is p
aram
eter
cod
e us
ed to
iden
tify
the
cons
titue
nt,
prop
erty
, or c
hara
cter
istic
in th
e U
.S. G
eolo
gica
l Sur
vey
Nat
iona
l Wat
er In
form
atio
n Sy
stem
(NW
IS) d
atab
ase.
]
USG
S w
ell
num
ber
Aqu
ifer
type
Incu
batio
n (h
ours
)
Chlo
rine
do
se
(mg/
L)
(99�
00)
Chlo
rine
re
sidu
al
(mg/
L)
(99�
01)
CHB
rCl �
(µg/
L)
(99�
0�)
CHB
r � (µ
g/L)
(9
9�0�
)
CHCl
� (µ
g/L)
(9
9�0�
)
CHB
r �Cl
(µg/
L)
(99�
0�)
BrC
lAA
(µ
g/L)
(9
9���
)
Br �A
A
(µg/
L)
(99�
1�)
Cl�A
A
(µg/
L)
(99�
09)
ClA
A
(µg/
L)
(99�
08)
Cl�A
A
(µg/
L)
(99�
10)
BrC
lAN
(µ
g/L)
(9
9�1�
)
Br �A
N
(µ
g/L)
(9
9�1�
)
2104
02B
R6
5.0
4.0
1.7
0.6
1.5
2.3
<0.1
<0.1
1.2
3.6
1.5
0.7
0.9
2104
02B
R24
5.0
4.0
3.6
0.8
2.6
3.4
1.2
1.1
1.4
<0.1
1.5
1.0
0.9
2104
02B
R16
85.
05.
06.
73.
74.
96.
33.
23.
73.
23.
81.
70.
61.
035
0083
BR
65.
04.
00.
70.
31.
20.
9<0
.1<0
.11.
2<0
.11.
2<0
.1<0
.135
0083
BR
245.
04.
01.
30.
51.
51.
5<0
.1<0
.11.
1<0
.11.
60.
5<0
.135
0083
BR
168
7.5
5.6
3.2
0.6
3.1
2.5
<0.1
<0.1
2.0
<0.1
2.6
0.6
<0.1
2701
55G
L6
5.0
4.0
1.3
0.3
4.3
1.5
<0.1
<0.1
1.6
2.0
1.6
<0.1
<0.1
2701
55G
L24
5.0
4.0
2.9
0.5
5.7
2.3
<0.1
<0.1
1.0
<0.1
1.3
0.7
<0.1
2701
55G
L16
85.
04.
05.
82.
57.
55.
42.
32.
52.
12.
81.
70.
60.
939
0451
GL
65.
04.
01.
50.
21.
71.
2<0
.1<0
.1<0
.1<0
.11.
30.
70.
739
0451
GL
247.
54.
52.
80.
33.
31.
71.
2<0
.11.
1<0
.11.
80.
90.
939
0451
GL
168
5.0
4.0
9.4
1.8
6.5
8.2
2.3
1.5
2.4
<0.1
1.8
1.5
1.5
2301
95C
P6
10.0
1.0
6.5
0.7
11.0
4.6
2.9
1.8
6.2
<0.1
6.5
2.0
1.9
2301
95C
P24
10.0
1.0
17.0
1.4
21.0
10.0
5.6
3.3
11.0
3.5
12.0
2.8
2.9
2301
95C
P16
81.
00.
529
.02.
235
.017
.08.
54.
115
.02.
313
.03.
03.
115
0207
CP
610
.02.
18.
41.
77.
57.
53.
12.
63.
3<0
.14.
03.
03.
215
0207
CP
2410
.01.
616
.02.
615
.012
.04.
02.
93.
8<0
.14.
73.
94.
715
0207
CP
168
7.5
3.4
40.0
5.9
32.0
30.0
9.3
6.1
9.6
<0.1
6.9
3.7
5.0
0106
00C
CP
6
nd
n
d4.
60.
113
.01.
91.
6<0
.14.
9<0
.12.
71.
00.
601
0600
CC
P24
n
d
nd
6.7
0.2
20.0
2.8
2.4
<0.1
6.4
<0.1
3.3
<0.1
<0.1
0106
00C
CP
168
n
d
nd
8.8
<0.1
30.0
2.3
2.5
<0.1
9.8
<0.1
4.0
<0.1
<0.1
�� Water-Quality, Organic Carbon, and Disinfection By-Product, Water-Supply Wells, New Jersey, 1998-99

Appendix � Concentrations of disinfection by-products formed in chlorinated water from seven selected community water-supply wells in New Jersey, 1998-99, during three periods of incubation.—Continued
USGS well
number
Aquifer type
Incubation (hours)
CL�AN (µg/L)
(99�1�)
CL�AN (µg/L)
(99�1�)
210402 BR 6 <0.1 <0.1210402 BR 24 0.6 <0.1210402 BR 168 <0.1 <0.1350083 BR 6 <0.1 <0.1350083 BR 24 <0.1 <0.1350083 BR 168 <0.1 <0.1
270155 GL 6 <0.1 <0.1270155 GL 24 <0.1 <0.1270155 GL 168 <0.1 <0.1390451 GL 6 <0.1 <0.1390451 GL 24 <0.1 <0.1390451 GL 168 <0.1 <0.1
230195 CP 6 1.8 <0.1230195 CP 24 2.1 <0.1230195 CP 168 2.0 <0.1150207 CP 6 1.4 <0.1150207 CP 24 2.0 <0.1150207 CP 168 1.2 <0.1
010600 CCP 6 1.0 <0.1010600 CCP 24 <0.1 <0.1010600 CCP 168 <0.1 <0.1
Appendixes ��

For additional information, write to:DirectorU.S. Geological SurveyNew Jersey Water Science CenterMountain View Office Park810 Bear Tavern Rd., Suite 206West Trenton, NJ 08628
or visit our Web site at:http://nj.usgs.gov/

Hopple, Jessica A., Barringer, Julia L. and Koleis, Janece—W
ater-Quality Constituents, D
issolved-Organic-Carbon Fractions, and D
isinfection By-Product
Formation in W
ater from Com
munity W
ater-Supply Wells in N
ew Jersey, 1998-99—
Scientific Investigations Report 2006-5260
Printed on recycled paper


