WATER Project Completion Report No. 710836 WATEROZONE ...
36
WATER WATER WATER W JL JL ER WATER WATER WATER WATER WATER WATER Project Completion Report No. 710836 THE MECHANISM OF OZONE INACTIVATION OF WATER BORNE VIRUSES Otis J. Sproul Professor Department of Civil Engineering Chi K. Kim Research Associate Department of Microbiology The Ohio State University United States Department of the Interior Contract No. B-0I3-MAINE Land and Water Resources Institute University of Maine at Orono State of Ohio Water Resources Center The Ohio State University
Transcript of WATER Project Completion Report No. 710836 WATEROZONE ...

WATERWATERWATERWJL JL ERWATERWATERWATERWATERWATERWATER
Project Completion Report No. 710836
THE MECHANISM OF OZONE INACTIVATION OF
WATER BORNE VIRUSES
Otis J. Sproul Professor
Department of Civil Engineering
Chi K. Kim Research Associate
Department of Microbiology
The Ohio State University
United States Department of the Interior
Contract No. B-0I3-MAINE
Land and Water Resources Institute University of Maine at Orono
State of Ohio
Water Resources Center
The Ohio State University


Completion ReportProject B-O13-ME
Land and Water Resources InstituteUniversity of Maine at Orono
Water Resources CenterThe Ohio State University
THE MECHANISM OF OZONEINACTIVATION OF WATERBORNE VIRUSES
by
Otis J . Sproul1
Chi K. Kim1
July 1980
The work upon wnich this publication is based wassupported in part by funds provided by the UnitedStates Department of Interior, Office of WaterResearch and Technology, as authorized under theWater Resources Research Act of 1964 as amended.
Department of Civil EngineeringThe Ohio State UniversityColumbus, OH 43210
1

ACKNOWLEDGMENTS
This work was supported in part by funds provided by the United
States Department of Interior, Office of Water Research and Technology,
as authorized under the Water Resources Research Act of 1964 as
amended, Project Number B-013-ME. The authors also acknowledge
contributions of the late David M. Gentile, who initiated this work
while a Ph.D. candidate at the University of Maine. The Union Carbide
Corporation graciously loaned the ozonator for this work.
A portion of this material was published in a paper entitled
"Mechanism of Ozone Inactivation of Bacteriophage f2" in Applied and
Environmental Microbiology, volume 39, pages 210-218, January 1980.

INTRODUCTION
Ozone has received much recent attention as an alternative disinfec
tant to chlorine in water and wastewater treatment practices due to its
quicker, powerful germicidal activity and no reported side effects as
can be produced by chlorination, such as taste, odor, and toxic by-
products (2). Inactivation kinetics with ozone have been actively studied
in laboratory or pilot-plant scale using a variety of microorganisms
including viruses (12, 17, 32). Much information has accumulated attest
ing to its superiority over other chemical disinfectants (10, 33) Lower
concentrations of ozone and shorter contact times are required than are
needed when using chlorine or other agents, and it is more effective than
other disinfectants against resistant organisms, such as amoebic cysts
and viruses.
Although the earlier all-or-none phenomenon of ozone inactivation
was explained as an ozone demand exerted by the organisms themselves (23)
recent reports indicate a threshold effect in virus ozonation (11, 15)
Katzenelson and Biedermann (10) reported a two-stage inactivation of
ozone, in which 99 percent of the test organisms were inactivated in 8
seconds and the remainder only after several minutes of contact. They
demonstrated that their two stage kinetics could be ascribed to virus
aggregation. Limited information is available on the mechanism of ozone
inactivation of bacteria and viruses, even though ozone has been increas
ingly used in disinfection practices in water
The RNA containing bacteriophage f2 which is chemically and physi
cally very similar to enteric viruses was first introduced in 1964 (9)
as a model for inactivation study of the enteric viruses. Since then,
the phage f2 has been used by many researchers (5, 21, 22, 28) for the
study of inactivation kinetics and inactivation mechanisms using various
disinfecting agents. Hsu et a k (9) showed that the phage f2 RNA and
poliovirus RNA were resistant to iodination and that inactivation of both
f2 and poliovirus were inhibited by increasing iodide ion concentration.
The phage f2 was used by Olivieri et a]_- (21) to study the mode of action
of chlorine, bromine, and iodine. They found that the mode of action
depended upon the element. Chlorine inactivated naked f2 RNA at the same
rate as R\A in the intact phage at pH 7.5 or lower. The protein of the
inactivated phage was still able to adsorb to the host. Bromine inacti
vated the naked RNA at the same rate as the intact phage, but the RNA
prepared from bromine-treated virus was significantly less inactivated
than the intact virus They suggested that the primary site of bromine
inactivation was more likely to be the protein moiety of the virus.
Iodine functioned through iodination of the ami no acid tyrosine in the
protein moiety of the phage with almost no effect on the nucleic acid.
The inactivation mechanism of ozone has been only partially studied
for viruses and bacteria. Using ozone in secondary effluent Pavoni et al.
(22) reported that the mechanism of destruction of f2 phage and bacteria
was probably oxidative. Riesser et a]^ (26) reported that the protein
capsid of poliovirus type 2 was damaged by ozonation so that uptake into
the susceptible cells was inhibited. Damage of the viral protein coat
was also demonstrated by DeMik and DeGroot (6), when the bacteriophage
0X 174 was exposed to air containing ozone. They also observed breaks
in the phage DMA. Christensen and Giese (4) reported that the effect of
ozone on nucleic acid was ascribed to its action on the purines and pyri
midines, each of which appeared to be affected. In studies by Prat et afL

(24) and Scott (27) using E_. coli DNA, the pyrimidine base was modified
by ozonation, with thymine reacting with ozone more sensitively than
cytosine and uracil These reports provide limited information on the
mechanisms of ozone inactivation of viruses.
OBJECTIVE
I t was the objective of this research to determine the ozone inact
vation mechanism for viruses in water Two bacteriophages, the f2 RNA
containing virus and the T4 DNA containing virus were used as models.
MATERIALS AND METHODS
Preparation, purif icat ion, and t i t ra t ion of viruses
Bacteriophage f2 (ATCC -15766-B) was propagated using Escherichia
coli K-13 Hfr (ATCC -15766) grown in Tryptone Yeast Extract (TYE) broth
medium, using the ammonium sulfate method described by Loeb and Zinder
(14) with minor modifications. Bacteriophage T4 was prepared using E
coli S/6/5 grown in nutrient broth (H-broth) using the method of Snustad
and Dean (31). The f2 phage was further purified using cesium chloride
at a concentration of 0.65 g/ml and centrifuged at a speed of 125,000 x
g for 48 hours in a Beckman L2-65B ultracentrifuge equipped with a Ti-75
rotor (Beckman Instruments Inc . , Palo Alto, CA). The phage band was
collected from the middle of the tube and dialyzed twice against 1 1 of
0.01 M phosphate buffer containing 8.0 g/1 NaCl, pH 7 2, at 4°C for 24
hours. The dialyzate was diluted with s ter i le t r ip le d is t i l l ed water to
12 about 5.0 x 10 plaque forming unit (PFU) per m i l l i l i t e r and stored at
-70°C until used. The T4 was purified and stored in similar fashion

except that cesium chloride in a concentration of 0.75 g/ml was used
and was centrifuged at 40,000 x g for 40 hours. After dialysis the T4
concentration was 10 - 10 PFU/ml. The phage were titrated with their
hosts according to the overlay method of Adams (1)
Incorporation of tritium into bacteriophage f2
The RNA was labeled with [3H] uridine in general accordance with the
method described by Oeschger and Nathans (20). One liter of TPG medium
with low uridine (2.4 mg/1) was inoculated with 50 ml of overnight grown
E . coli K-12 C-3000-38 which is a mutant requiring uridine, thymine, and
the amino acids, arginine, lysine, and histidine. After 24 hours incuba
tion with aeration at 37°C, the culture was amended with 3 mCi of [^H]
uridine (Hew England Nuclear, Boston, MA) After an additional 30 min
utes of incubation, the culture was infected with bacteriophage f2 at a
multiplicity of infection (M0I) of 10 and incubated for another 24 hours.
The tritiated phages were isolated by the method of Yamamoto and Alberts
(36) using polyethylene glycol 6,000. They were further purified by
ultracentrifugation on cesium chloride, dialyzed, and stored in the
manner previously described.
Preparation and assay of infectious nucleic acid
Infectious RNA was prepared from the bacteriophage f2 with the
phenol method described by Hofschneider and Deli us (8) The RNA isolated
from 2 ml of the tritiated f2 was diluted to 2 ml with cold sterile
triple distilled water The RNA to be treated with ozone was subsequently
extracted six times with 2 ml of ethyl ether to remove traces of phenol
After the final extraction, the residual ether was removed by bubbling
with nitrogen gas. All of the RNA preparation procedures were carried

out in an ice bucket.
The infectivity of the f2 control and ozone treated RNA and the DNA
recovered from the T4 samples was assayed using freshly prepared sphero
plasts of their respective hosts by the method described by Hofschneider
and Deli us (8).
Ozonation procedures
The ozonation system used in this study is shown in Figure 1 Ozone
was produced by a Linde model SG-4050 ozone generator (Union Carbide
Corp., South Plainf ield, NJ) The circulation system for the ozone
produced was constructed with stainless steel and teflon tubing. A 2 1
borosilicate glass bottle was used as the reactor Ozone was dissolved
in 1 1 of ster i le ozone demand-free 10" M phosphate buffer containing
0.01 M NaCl, pH 7.0, at 25 ± 1°C. Ozone in the off gas was neutralized
by passage through a solution containing 500 g sodium thiosulfate and a
10 g potassium iodide per 3.78 1 water Ozone concentration was measured
with a Spectronic 20 spectrophotometer (Bausch and Lomb, Inc. , Rochester,
NY) according to the method described by Shechter (30) All of the
glassware used in this work was rendered ozone demand-free by soaking in
a >2mg/l ozone solution for at least 1 hour, washed several times with
d ist i l led water, rinsed with t r ip le d ist i l led water, and dried at 110°C
for 5 hours. The bacteriophages and f2 RNA were treated with ozone solu
tion at a ratio of 1 to 100 in the reactor bottle or in a test tube at
25 ± 1°C. At appropriate intervals the ozone treated phages and f2 RNA
were transferred to a 0.206 g/1 ster i le sodium thiosulfate solution in a
volume of one-tenth of the sample to immediately neutralize the residual
ozone. The control phages and f2 RNA samples were mixed with the phosphate
buffer and sodium thiosulfate solution at the same ratio as in the ozone

O3 neufralizer
neutralizer
(§) Shut-off valve (8) Needle valve M. [~Ri Rotameter control reactor
FM I Magnetic mixer I Sample inlet 0 Sample outlet
Figure 1. Ozonation system for inactivation of viruses.

treated samples.
f2 host adsorption experiment
The procedures of Brinton and Beer (3) were used to determine the
loss of adsorption capability of the ozonated virus. The £. coli K-15T
is not a host for the f2 and any adsorption would be non-specific result
ing from ozone induced changes in the phage. One m i l l i l i t e r samples of
the control and ozone-treated phage were mixed with 1 ml of £. coli K-13
and E. coli K-15T" in TYE broth medium (5 x 10⁷ cells/ml) for 10 minutes
at room temperature. This mixture and a phage control were f i l tered at
a vacuum of 10 inch of mercury and washed four times with 2 ml of TYE
medium through a 0.45 pm Type HA Millipore f i l t e r membrane (Millipore
Corp., Bedford, HA) which had been pretreated with 1 ml of 3 percent
bovine serum albumin. The f i l t e r membranes were dried for 15 minutes
at 85°C, placed in 10 ml of Liquifluor cocktail (New England Nuclear,
Boston, MA), and the radioactivity counted for 5 minutes with a Packard
Tri-carb model 3375 liquid scint i l lat ion spectrometer (Packard Instru
ments Co. Inc. , Downers Grove, IL ) .
Electron microscopy
The f2 control and ozone-treated viruses were observed with an
electron microscope alone or after mixing with the host bacteria. One Q
ml portions of the control (5 x 10 PFU/ml) and ozone-treated phages were
mixed with 1 ml of E. coli K-13 (5 x 10⁶ cells/ml) for 10 minutes at
room temperature. One drop of the mixtures was put on a formvar and
carbon coated 300 mesh copper grid (Ladd Research Ind., Inc., Burlington,
VT) and dried 30 minutes. Excess water was drained with filter paper and
the virus and bacteria negatively stained with 2 percent uranyl acetate

8
for 3 minutes After draining the excess stain and air drying, the grids
were examined with a Phillips EM 300 electron microscope (Phill ips Elec
tronics, Cincinnati, OH) at an accelerating voltage of 80 kv.
The control and ozonated T4 viruses were negatively stained with
uranyl acetate and observed in the electron microscope as for the f2
virus. Where i t was desired to observe DNA the sample was placed on the
grid using the DNA spreading technique of Kleinschmidt (13) , rotary
shadowed with gold and photographed.
Sucrose density gradient analysis
Sucrose gradients were made with 5-17 or 5-20 percent sucrose in
0.01 M phosphate buffer containing 8.0 g/1 NaCl, pH 7.2. One ml portions
of the f2 control or ozone-treated f2 phage and RNA samples which had
been labeled with [ H] uridine were placed on top of an 11 ml gradient
and centrifuged at a speed of 110,000 or 149,000 x g for 4 or 8 hours at
4°C with a Beckman L2-65B ultracentrifuge using an SW 41 rotor (Beckman
Instruments, Inc . , Palo Alto, CA) The gradient was fractionated by
collecting 15, 25 or 50 drops for each fraction with an ISCO density
gradient fractionator model 180 (Instrumentation Specialties Co. Inc . ,
Lincoln, NE) using a 40 percent sucrose solution. Each fraction was
examined for refractive index, infect iv i ty of the phage, and radioactivity-
The phages in the fractions were t i t rated after dialyzing against 0.01
M phosphate buffer containing 8.0 g/1 NaCl, pH 7.2, at 4°C overnight.
Ten ml of Biofluor cocktail (New England Nuclear, Boston, MA) were mixed
with each fraction and radioactivity was counted in the same way previous
ly described.

RESULTS
f2 bacteriophage
The ozone inactivation kinetics of bacteriophage f2 are shown in
Table 1 A rapid phage inactivation during the first 5 seconds of
exposure was noted with 5 logs lost at 0.09 mg/1 ozone and by greater
than 7 logs at 0.8 mg/1 ozone. During the next 10 minutes, the f2 phages
were gradually inactivated at a slower rate in both ozone concentrations
The specific and non-specific adsorption of those phage samples examined
by the filtration method are shown in Table 1 The specific adsorption
of the phages to the host E. coli K-13 was gradually reduced at a slower
rate in 0.09 mg/1 ozone solution and faster in 0.8 mg/1 ozone. In both
treatments the general trends of reduction in the specific adsorption
of the phages were faster for the first 5 seconds and slower for the
next 10 minutes, and were similar to the reduction in PFU. On the other
hand, non-specific adsorption of the phages to the non-host female strain
E. coli K-15 T" and to the cellulose nitrate filter membrane was not sig
nificantly changed by ozonation at either ozone concentration.
The untreated control phages and the phage samples which had been
treated with 0.09 mg/1 ozone for 5 seconds (referred to as light treat
ment) and 0.8 mg/1 ozone for 30 seconds (referred to as heavy treatment)
were sedimented in a 5-20 percent sucrose gradient and fractionated by
collecting 25 drops for each fraction. On the other hand, the f2 phage
RNA was first extracted from the stock phages and then lightly or heavily
treated with ozone. The naked RNA samples were sedimented and fractionated
in the same manner as in the phage samples. The PFU of the phages and
radioactivity of the phage and naked RNA are shown in Figure 2. The

Table 1 . Ozone inactivation kinetics of bacteriophage f2 and i ts adsorption to host cind non-host bacteria and to cellulose nitrate fi lter.
Reacti on Residual Survival of Adsorption of f2 phage Residual Survival of Adsorption of f2 phagea
time ozone f2 phage (CPM) to ozone f2 phage (CPM) to (sec) (mg/1) (PFU/ml) E. coli E. col i fi1ter (mg/1) (PFU/ml) E. coli E. coli filter
K-13 K-15T" membrane K-13 K-15T" membrane
0 0.09 5.3 x 10⁹ 2617 53 139 0.80 5.3 x 10⁹ 2617 53 139
5 _b 8.7 x 10⁴ 1742 103 88 - 2.6 x 10³ 1013 185 79
10 0.086 6.2 x 10⁴ 1777 122 73 0.75 6.8 x 10² 851 103 74
30 0.085 3.3 x 10³ 1660 170 81 0.68 5.2 x 10² 562 89 69
60 0.083 5.6 x 10² 1363 101 84 0.64 2.0 x 10° 434 74 66
120 0.08 5.0 x 10² 1457 144 77 0.53 1.0 x 10° 372 61 57
600 0.065 4.6 x 101 1199 165 67 0.30 0 283 52 58
aE. coli K-13 and E. col i K-15T" were used, respectively, as the host and non-host bacteria ofthe phage f2 . A 0.45 ym Mill ipore type HA membrane f i l t e r 'was used for non-specifi c adsorptionof the phages.
-bNot determi ned.

11
6 8 10 12 18 FRACT.ON NO
Figure 2. Sucrose density gradient analysis of untreated controlbacteriophage f2 (A) and samples which were treated with 0.09 mg of ozoneper liter for 5 s (B) and with 0.8 mg of ozone per liter for 30 s (C)The naked RNA which had been extracted from the stock phage was ozonatedin the same manner as the phage. Three separate gradients were used tomeasure the radioactivities of phage and naked RNA and phage infectivity.Both samples of phage and naked RNA were centrifuged at 110,000 x g for4 h in a 5 to 20% sucrose gradient. For each fraction 25 drops wascollected from the top to analyze the radioactivity of the phage (•) andthe naked RNA ( A ) For each fraction 50 drops was collected for titration of phage infectivity (•) The peaks of PFUs remained in the mixtureof fractions 9 and 10 after ozonation, whereas the radioactivity peaks ofthe samples were moved up by ozonation. The radioactivities of all nakedRNA samples were essentially unchanged, showing their peaks in fraction3. Note a minor radioactivity peak of the control phage sample infraction 3.

12
peaks of the PFU curves in the control and ozone-treated phage were
found in the mixture of the 9th and 10th fractions in all three samples,
showing reduced PFUs in the samples which had been treated at the heavier
concentration of ozone for a longer time. However, the radioactivity
(presence of the f2 RNA) in the ozone-treated phages was localized in
the upper fractions with lighter density- The radioactivity of the
control phage was found mainly in the same gradient fractions in which
the peak of the PFU curve was seen (Figure 2A), but the radioactivity
in the lightly and heavily treated phage samples was observed in the 3rd
and 4th fractions and 2nd and 3rd fractions, respectively (Figures 2B and
2C), The radioactivities of the control naked RNA as well as the ozone-
treated naked RNA samples were nearly the same, showing their peaks in
the 2nd and 3rd fractions in all three samples. The distribution of
heavily treated naked radioactive RNA was identical to that of the
heavily treated phage sample (Figure 2C), thereby indicating that the
RNA from the ozonated phage had been liberated into the water
In order to prove a leakage of RNA from the phages during ozonation
and to correlate the specific adsorption of the ozone-treated phages to
the inactivation rate of the phages, the control and ozone-treated phages
were mixed with the host bacteria and observed with an electron micro
scope (Figure 3). The control phages had the integrity of the icosahedral
structure and attached to pi 1i of the host (Figure 3A) The phages unad
sorbed to the pi 1i were scattered over the grid as single particles. A
few broken particles were also observed in the control sample. In the
phage samples which had been lightly treated with ozone, some broken
phage particles were seen, while other intact phages were attached to the
pi 1i (Figure 3B) Almost all the phages were disrupted in the heavily

13
Figure 3. Electron micrographs of control phage f2 (A) and phagewhich were treated with 0.09 mg of ozone per liter for 5 s (B) and with0.8 mg of ozone per liter for 30 s (C) The phage samples adsorbed tothe host bacteria were stained with 2% uranyl acetate. The control sampleshowed that almost all of the phage were intact and that many of themadsorbed to the host pi 1i A few of them are seen partially damaged.Some of the lightly treated phage were still intact and adsorbed to thepili, but others were broken down to larger pieces of protein capsid.Most of the heavily treated phage were broken down to many subunits ofthe capsid, and only a few of them can be seen intact and adsorbed tothe pili or unadsorbed. Many subunits (arrows) of the protein capsidare seen all over the grid. Bars - 0.1 ym.

14
treated sample (Figure 3C) with only a few intact phages found in the
background or attached to the pili Many subunits (arrows) of the protein
capsid were observed in the heavily treated phage sample as seen in
Figure 3C.
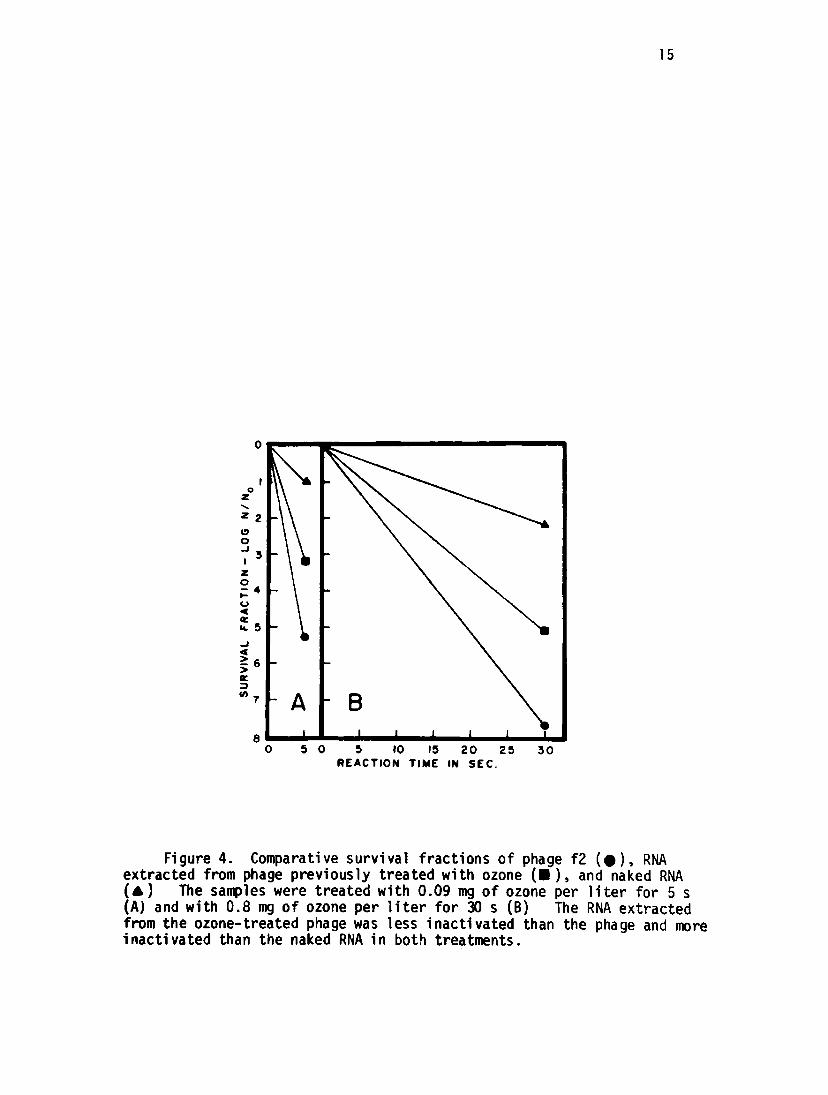
The survival fractions of the phage and naked RNA samples were
examined after ozonation and compared with the RNA extracted from the
phages previously treated with ozone (Figure 4) In the case of light
ozone treatment, the RNA extracted from the ozone-treated phages (about
5 logs of inactivation) showed about 3 logs of inactivation, but the
separately treated naked RNA lost less than 1 log during ozonation
(Figure 4A). In the sample of heavy treatment, the phages, the RNA
extracted fron the treated phages, and the naked RNA showed respectively,
over 7 logs, 5 logs, and 2 logs of inactivation (Figure 4B) In both
treatments the naked RNA was much less inactivated by ozonation than the
RNA inside the phage particle.
To examine any difference in inactivation rates between naked RNA
and RNA enclosed in the phage coat the ozone-treated and untreated samples
of both RNAs were sedimented in 5-17 percent sucrose gradients and
fractionated by collecting 15 drops for each fraction. The sucrose
density gradient analysis is shown in Figure 5. In the naked RNA samples
(Figure 5A), the sedimentation velocity of the ozone-treated naked RNA
has been slightly changed, showing their radioactivity peaks in the upper
fractions with lighter buoyant density. On the other hand, the RNA
extracted from the previously ozone-treated phages was sedimented at a
slower rate after ozonation than those of the naked RNA (Figure 5B)
The CPMs were significantly reduced in the RNA samples extracted from the
previously ozonated phage? as seen in Figure 5B. The difference of the
15
0 5 10 15 20 25 3 0 REACTION TIME IN SEC.
Figure 4. Comparative survival fractions of phage f2 (•), RNAextracted from phage previously treated with ozone (•), and naked RNA( A ) The samples were treated with 0.09 mg of ozone per liter for 5 s(A) and with 0.8 mg of ozone per liter for 30 s (B) The RNA extractedfrom the ozone-treated phage was less inactivated than the phage and moreinactivated than the naked RNA in both treatments.

16
20
v
2 " nI.O6
< " B 1
' T T ' T w ' 9 ' U ' 13 ' 15 ' I71 19 ' 2*1 ' 2'3' 25' 2*7 ! 2*9 ' FRACTION NO.
Figure 5. Sucrose density gradient analysis of ozonated naked RNA(A) and RNA extracted from the phage previously treated with ozone (B).The control RNA (#) and the RNA which had been treated with 0.09 mg ofozone per liter for 5 s (•) and with 0.8 mg of ozone per liter for 30 s( A ) were centrifuged in a 5 to 17% sucrose gradient at 149,000 x g for8 h and 15 drops for each fraction were collected from the top. TheRNA extracted from the ozone-treated phage is seen in the upper fractions,which have a lower buoyant density and are lower in counts per minutethan the naked RNA in both treatments.

17
change of sedimentation velocity between the naked RNA and RNA extracted
from the previously ozone-treated phages were in agreement with the
results shown in Figure 4, indicating that the naked RNA was less
affected by ozone than the RNA in the intact phage. The radioactivity
distributions of both groups of RNA after ozonation were shifted toward
fractions with lighter density, depending upon the ozone concentration
and time period of the reaction.
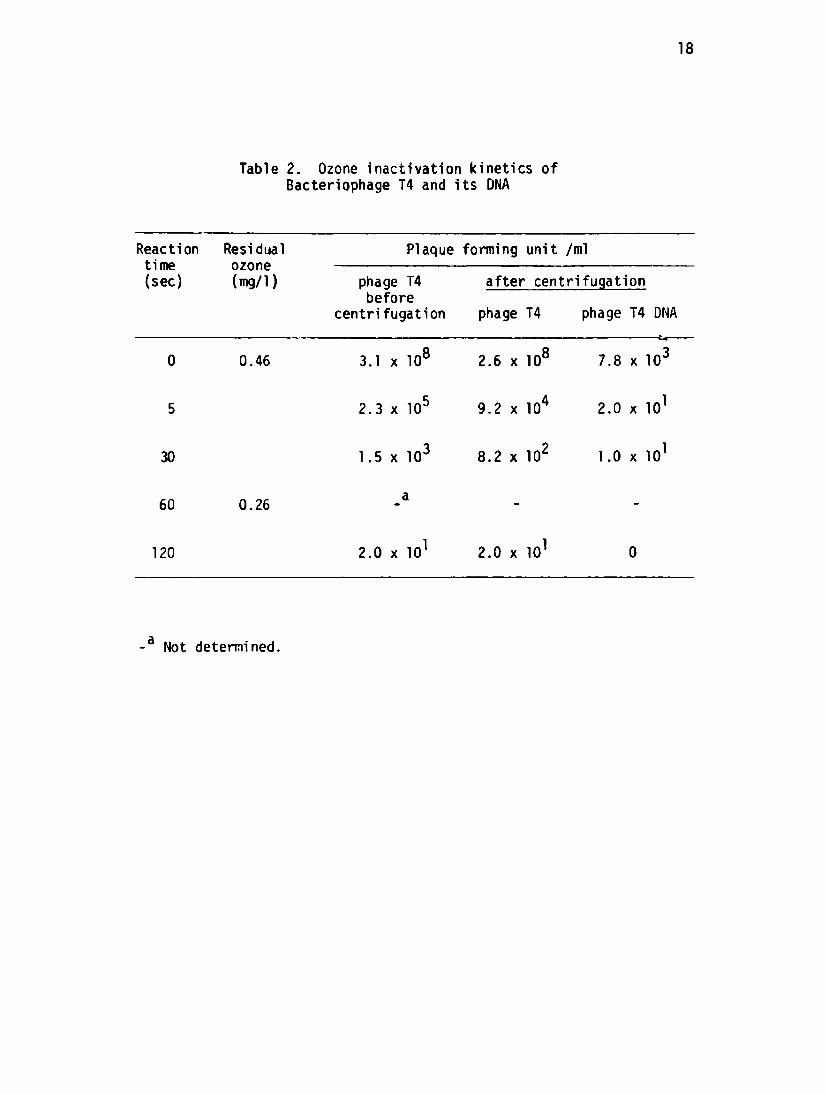
T4 bacteriophage
The inactivation kinetics of the T4 bacteriophage and its DNA are
shown in Table 2. The T4 inactivation before centrifugation appeared to
be two stage since about 3 logs were lost in 5 seconds with only an
additional 4 logs in the next 115 seconds. The two stage interpretation
is complicated by the decrease in the residual ozone concentration from
0.46 mg/1 to less than 0,26 mg/1.
The T4 DNA was separated from the T4 phage by centrifugation. Four
ml of the control and ozonated samples were cushioned on 1 ml of CsCl
(1.463 gm/ml) and centrifuged at 108,000 x g for 90 minutes in an SW 50.1
rotor with the Beckman L2-65B ultracentrifuge. The top 3 ml containing
the DNA were mixed and 0.1 ml samples taken for DNA titration. The
bottom two ml containing the phages were mixed and sampled for virus
titer
The 7.8 x 10 PFU/ml of T4 DNA in the control sample which had not
been exposed to ozone were lost from the phage during handling procedures.
This DNA and any released from the phages during the ozonation was rapidly
inactivated by the ozone since none accumulated in the reactor and none
was detected after 120 seconds
18
Table 2. Ozone inactivation kinetics ofBacteriophage T4 and its DNA
Reaction Residual Plaque forming unit /ml time ozone (sec) (mg/1) phage T4 after centrifugation
before centrifugation phage T4 phage T4 DNA
0 0.46 3.1 x 10⁸ 2.6 x 10⁸ 7.8 x 10³
5 2.3 x 10⁵ 9.2 x 10⁴ 2.0 x 101
30 1.5 x 10³ 8.2 x 10² 1.0 x 101
60 0.26
120 2.0 x 101 2.0 x 101
-a Not determined.
19
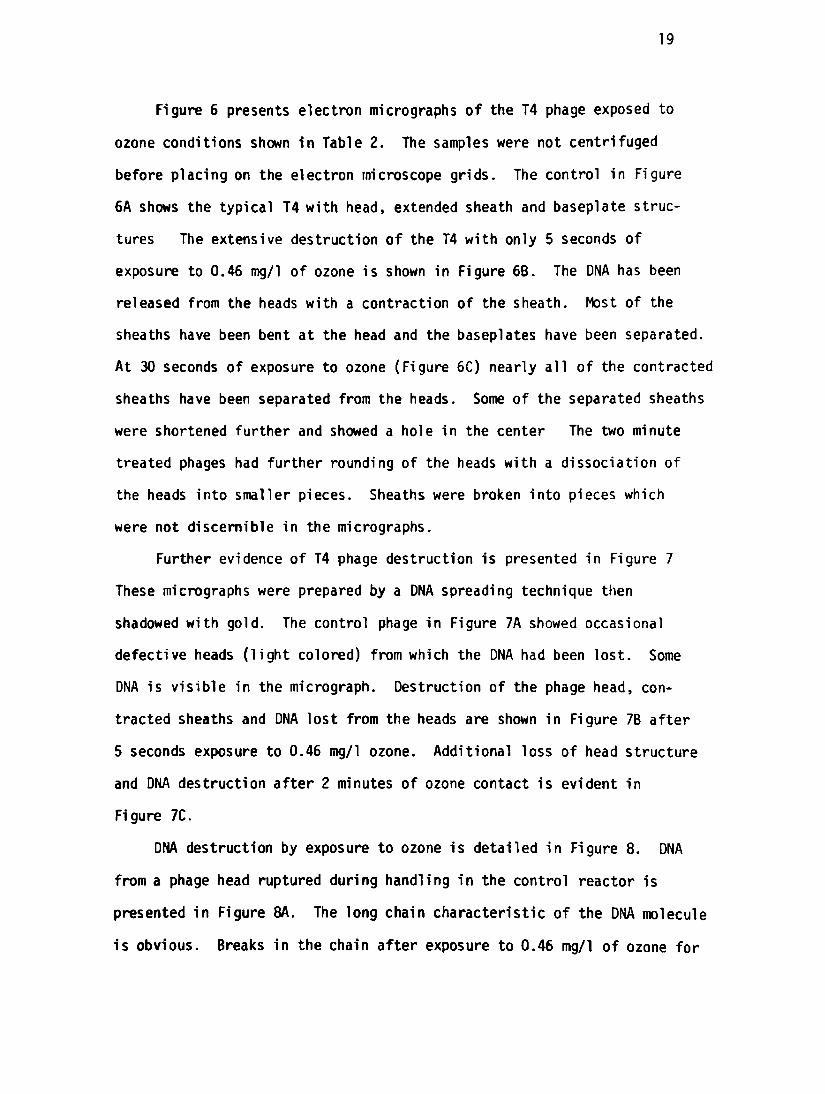
Figure 6 presents electron micrographs of the T4 phage exposed to
ozone conditions shown in Table 2. The samples were not centrifuged
before placing on the electron microscope grids. The control in Figure
6A shows the typical T4 with head, extended sheath and baseplate struc
tures The extensive destruction of the T4 with only 5 seconds of
exposure to 0.46 mg/1 of ozone is shown in Figure 6B. The DNA has been
released from the heads with a contraction of the sheath. Most of the
sheaths have been bent at the head and the baseplates have been separated.
At 30 seconds of exposure to ozone (Figure 6C) nearly all of the contracted
sheaths have been separated from the heads. Some of the separated sheaths
were shortened further and showed a hole in the center The two minute
treated phages had further rounding of the heads with a dissociation of
the heads into smaller pieces. Sheaths were broken into pieces which
were not discernible in the micrographs.
Further evidence of T4 phage destruction is presented in Figure 7
These micrographs were prepared by a DNA spreading technique then
shadowed with gold. The control phage in Figure 7A showed occasional
defective heads (light colored) from which the DNA had been lost. Some
DNA is visible in the micrograph. Destruction of the phage head, con
tracted sheaths and DNA lost from the heads are shown in Figure 7B after
5 seconds exposure to 0.46 mg/1 ozone. Additional loss of head structure
and DNA destruction after 2 minutes of ozone contact is evident in
Figure 7C.
DNA destruction by exposure to ozone is detailed in Figure 8. DNA
from a phage head ruptured during handling in the control reactor is
presented in Figure 8A, The long chain characteristic of the DNA molecule
is obvious. Breaks in the chain after exposure to 0.46 mg/1 of ozone for
20
Figure 6. Electron micrographs of control phage T4 (A) and phagewhich were treated with an initial ozone residual of 0.46 mg/1 for 5seconds (B), 30 seconds (C) and 120 seconds (D) Stained with 2 percenturanyl acetate. Exposure to ozone for 5 seconds caused sheath contraction, loss of baseplate and loosening of bond where tail joins head.Heads were partially broken after 120 seconds exposure. Bars = 0.4 ym.

21
Figure 7. Electron micrographs of control phage T4 (A) and phagetreated with an initial ozone residual of 0.46 mg/1 for 5 seconds (B)and 120 seconds (C). Rotary shadowed with gold. Control phage showsome damaged phage with lost DNA. After ozone exposure for 5 secondssheath contraction, head damage and DNA loss have occurred. Additionalhead destruction and DNA loss have occurred after 120 seconds. Bar =

22
Figure 8. Electron micrographs of control phage and DNA (A) andphage and DNA after 5 seconds (B) and 120 seconds (C) exposure to ozonewith an initial residual of 0.46 mg/1. Some damaged control phage withintact DNA were observed in A. DNA breakage has occurred after 5 secondsof exposure to ozone with very extensive breakage after exposure for 120seconds. Bar = 0.4 -m.

23
5 seconds have occurred in the DNA molecule shown in Figure 8B. The
extensive breakage of the DNA in Figure 3C was typical of the DNA seen
after exposure to ozone for 120 seconds.
DISCUSSION
A small amount of organic matter in solution can cause rapid dissi
pation of ozone and decreased inactivation rate of the test organisms
To meet this demand, the ozonation system used in this study was care
fully constructed with stainless steel and teflon tubing and the system
calibrated to produce ozone concentrations as low as 0.01 mg/1 All
glassware and solutions for this study were made ozone-demand free.
The ozone reactors were closed during mixing of the samples and the
residual ozone was evaluated at the time of sampling.
Inactivation of the bacteriophage f2 was demonstrated during this
study by a quick reaction with a low concentration of ozone, as suggested
by Venosa (33) Only 5 seconds were needed to inactivate 5 logs of the
f2 with 0,09 mg/1 ozone, but a longer time was required to completelyQ
inactivate the 10 PFU/ml i n i t i a l l y present (10 minutes with 0.8 mg/1
ozone) Walsh et al (34), inactivating f2 with ozone, also observed an
i n i t i a l quick inactivation followed by a slower inactivation rate. The
inactivation kinetics of the phage revealed a two-stage action of the
ozone. Katzenelson et aK (11) thought their two-stage phenomenon was
due to clumping of 0.5 to 1.0 percent of their poliovirus 1 There is
evidence (37) that aggregation of some enteric viruses can reduce the
inactivation rate by protecting the viruses from contact with disinfec
tants. The f2 phages were stored at -70°C and thawed just pr ior to use
in order to reduce any possible changes in their sensi t iv i ty to ozone as

24
suggested by Katzenelson and Biedermann (10) In the f2 phage stock as
well as the diluted phage samples used in this study, aggregation was not
detected by electron microscopy*
The f2 phages were widely distributed throughout the sucrose gradient
after sedimentation in both the ozone-treated and untreated phage samples
At a concentration of about 10 PFU/ml or less, the radioactivity was
too low to be counted in CPM. This can be explained by the calculation
of 7 9 x 10 PFU/CPM in the fraction of the control phage which showed
peaks in both PFU and radioactivity. A minor peak in the 3rd fraction
of the control phage was thought to be RNA, since a similar peak was
observed in the gradient of the naked RNA sample which had been used as
a reference. Leakage of the RNA from some phages may possibly have
occurred during the thawing and dilution procedures of the phage stock
since electron micrographs of the control sample revealed a few damaged
phage particles.
The electron micrographs of the ozone-treated phages showed break
down and alteration of the phage particles with the extent of the damage
proportional to the concentration of ozone and the period of reaction
time. The lightly treated f2 phage showed some deformed particles and
large pieces of the broken capsids, whereas constant sized subunit parti
cles were observed in the heavily treated phages. These subunits resemble
the 11 S subunits of the bacteriophage f2 (38) and R17 (19) which had
been obtained by treated the phages with 4 M guanidine hydrochloride at
neutral pH. Damage of the protein coat by ozonation has been reported
in both RNA containing poliovirus (26) and DNA containing bacteriophage
0X174 (6) These changes are also supported by the absorbance changes
of the proteins and amino acids (16) when treated with ozone. Mudd et al

25
(16) reported that proteins with susceptible amino acid residues were
inactivated directly by reaction of ozone and that cysteine, tryptophan,
and methionine were the most susceptible among the amino acids Trypto
phan and methionine were also demonstrated (25) to be particularly
sensitive to ozone The breakdown of the f2 phage by ozonation can
thusly be explained since the coat proteins contain cysteine, tryptophan,
and methionine. The T4 phage demonstrated a very rapid loss of structural
integrity- Within 5 seconds tail sheaths had contracted, DNA and base
plates were lost, and head and DNA destruction had occurred. This
behavior parallels that of the action of ozone on the f2 phage.
About 10 PFU/ml of infectious RNA was recovered by phenol extraction
from about 10 PFU/ml of f2 phages. The infectious RNA was evaluated for
the presence of the phages with intact host bacteria and no plaques were
produced. Both naked RNA and the RNA isolated from the previously ozone-
treated phages were prepared from the same number of phages and diluted
to react with ozone under the same conditions so that the same volume for
the final preparation of the RNA could be directly compared for titration
of infectivity and radioactivity- Few reports are available on the effect
of ozone on RNA. Christensen and Giese (4) and Scott (27) reported that
both purines and pyri mi dines were changed by ozonation in their UV absor
bancy Pyrimidine base also reacts with ozone (4, 24), with thymine being
more susceptible to ozone than cytosine or uracil If it is true that
among the pyrimidine bases, uracil is not affected by ozone, the f2 phage
RNA should be more resistant to ozone than DNA.
The results obtained in this study show that ozone breaks the protein
capsid of the f2 phage to many subunits, liberating RNA into the solution and
disrupting adsorption to the host pi 1i The RNA in the intact phage

26
was less inactivated by ozonation than whole phages, but more inactivated
than the naked RNA. This suggests that the coat protein may be involved
in the inactivation of the RNA, probably by a secondary shearing reaction
of the RNA with the protein molecules modified Dy ozonation. The RNA
extracted from the f2 phages prior to and after ozone treatment retained
their infectivity to the spheroplasts after ozonation in spite of some
reduction.
The T4 bacteriophage was rapidly broken and its DNA released to the
bulk solution. Data are not available to show whether the DNA had been
altered within the protein capsid as was shown for the f2. The DNA after
its release to the water was quickly attacked by the ozone and rapidly
lost its infectivity. The DNA inactivation rate appeared similar to that
of the intact T4 phage unlike that of the f2 phage. Christensen and Giese
(4) have shown that DNA is more susceptible to alteration by ozone than
is RNA.
This research has shown that ozone attacks the f2 and T4 in a manner
such that their nucleic acids are released to the bulk solution. This
release occurs after the coat proteins or organelles of the viruses are
attacked by the ozone and disrupted. RNA is subsequently inactivated
at a rate less than that of the intact phage while DNA is inactivated
at the same rate as the intact phage.
Our results suggest that the RNA of enteric viruses may retain their
infectivity after liberation from the viral particle during ozonation of
water and wastewater, if they are inactivated by ozone in the same manner
as the f2 phage.
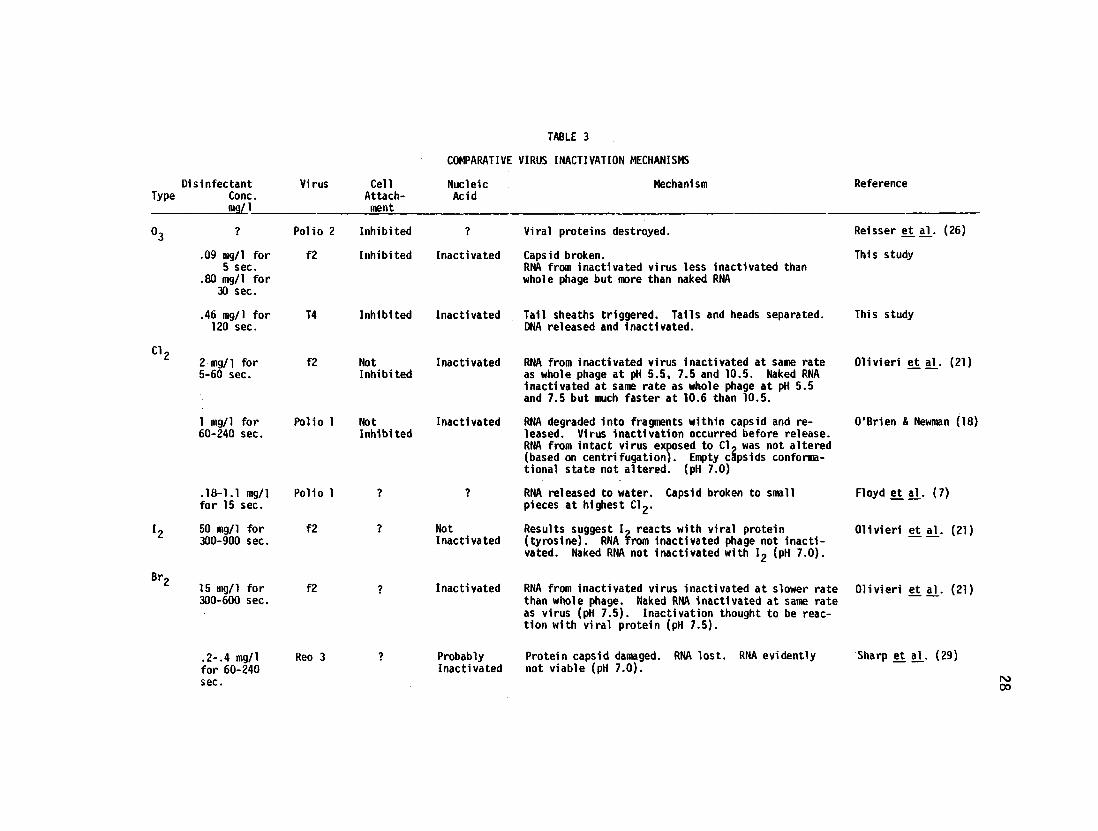
Comparative Inactivation Mechanisms
Comparative data which are available in the literature on the inacti

27
vation mechanisms of the principal disinfectants which are available for
use in drinking water have been summarized in Table 3. The data from
Reisser, et a h (26) and from the present study indicate that virus
inacti vation with ozone occurs by a loss of the caps id protein structure
with subsequent release of nucleic acid. DNA is subsequently readily
inactivated but RNA is inactivated at a slower rate. Attachment of the
viruses undergoing ozonation to their host cells is inhibited. The
investigators using chlorine showed that RNA was degraded within the
capsid and subsequently released to the water Attachment of the virus
to the cell was not inhibited. O l iver i , et aV (21) showed that iodine
reacts with the viral protein but not with RNA since the inactivated f2
bacteriophage was not inactivated nor was naked RNA inactivated by iodine.
Bromine appears to damage the capsid protein with subsequent loss of RNA
to the water Ol iver i , et, aj_ (21) showed that the RNA from inactivated
virus was inactivated with bromine at a slower rate than the whole phage,
although naked RNA was inactivated at the same rate as the intact phage.
In suronary, ozone, chlorine and bromine appear to inactivate nucleic
acid (RNA) within the virus with the virus capsid readily broken and the
RNA lost to the water. DNA is very readily destroyed with ozone. Iodine
appears to react with protein but does not react with RNA.
CONCLUSIONS
The following conclusions can be drawn from this research:
(1) Ozone inactivates the f2 and T4 bacteriophages by attacking
the protein capsid, l iberating the nucleic acid and inact i
vating the nucleic acid*
Disinfectant Type Cone.
mg/1
°3 ?
.09 mg/1 for 5 sec.
.80 mg/1 for 30 sec.
.46 mg/1 for 120 sec.
ci2 2 mg/1 for 5-60 sec.
1 mg/1 for 60-240 sec.
.18-1.1 mg/1 for 15 sec.
50 mg/1 for 300-900 sec.
Br015 mg/1 for 300-600 sec.
.2 - .4 mg/1 for 60-240 sec.
TABLE 3
COMPARATIVE VIRUS INACTIVATION MECHANISMS
Virus Cell Nucleic Mechanism Attach- Acid ment
Polio 2 Inhibited ? Viral proteins destroyed.
f2 Inhibited Inactivated Capsid broken. RNA from inactivated virus less inactivated than whole phage but more than naked RNA
T4 Inhibited Inactivated Tail sheaths triggered. Tails and heads separated. DNA released and inactivated.
f2 Not Inactivated RNA from inactivated virus Inactivated at same rate Inhibited as whole phage at pH 5.5, 7.5 and 10.5. Naked RNA
inactivated at same rate as whole phage at pH 5.5 and 7.5 but much faster at 10.6 than 10.5.
Polio 1 Not Inhibited
Inactivated RNA degraded into fragments within capsid and released. Virus inactivation occurred before release. RNA from intact virus exposed to Cl~ was not altered (based on centrifugation). Empty capsids conformationai state not altered. (pH 7.0)
Polio 1 RNA released to water. Capsid broken to small pieces at highest Cl2.
f2 Not Inactivated
Results suggest I~ reacts with viral protein (tyrosine). RNA from inactivated phage not inactivated. Naked RNA not inactivated with l9 (pH 7.0).
f2 Inactivated RNA from inactivated virus inactivated at slower rate than whole phage. Naked RNA inactivated at same rate as virus (pH 7.5). Inactivation thought to be reaction with viral protein (pH 7.5).
Reo 3 Probably Inactivated
Protein capsid damaged, not viable (pH 7.0).
RNA lost. RNA evidently
Reference
Reisser et al_. (26)
This study
This study
Olivieri et al_. (21)
O'Brien & Newman (18)
Floyd et al_. (7)
Olivieri et al_. (21)
Olivieri et al_. (21)
Sharp et al_. (29)
rooo

29
(2) The RNA from the f2 bacteriophage is at least partially inacti
vated before its release from the capsid. The rate of this
inactivation is slower than the whole phage but faster than
naked RNA exposed to ozone.
(3) DNA released from the T4 bacteriophage is rapidly inactivated
by ozone at about the same rate as the intact phage.

30
LITERATURE CITED
1 Adams, M.H. 1959. Bacteriophages Interscience Publishers, Inc., NY
2. Berg, 6. 1970. Integrated approach to the problem of viruses in water p. 339-364. In Proc. National specialty conference on disinfect ion. Amer. Soc. Civi l Engineer , NY
3. Brinton, C.C., J r . , and H. Beer. 1967 The interaction of male-specific bacteriophage with F p i l i . p. 251-289. In J.S. Colter and W. Paranchych (ed.), The molecular biology of viruses. Academic Press, NY
4. Christensen, E., and A. Giese. 1954. Changes in adsorption spectra ofnucleic acids and their derivatives following exposure to ozone andu l t raviolet radiations Arch. Biochem. Biophys. 51:208-216.
5. Cramer, W.N., K. Kawata, and C.W. Kruse. 1976. Chlorination and iodination of poliovirus and f2. J. Water Pollut. Control Fed. 48:61-76.
6. DeMik, 6., and I , DeGroot. 1977. Mechanism of inactivation of bacteriophage 0X174 and i ts DNA in aerosols by ozone and ozonized cyclohexene. J. Hyg. Camb. 78:199-211
7 Floyd, R.D., G. Sharp and J.D. Johnson. 1979. Inactivation by Chlorine of single poliovirus particles in water, Environ. Sci Technol 13: 438-442.
8. Hofschneider, P.H., and H. Deli us. 1968. Assay of Ml 2 phage RNA infect i v i t y in spheroplasts, p. 880-886. In L. Grossman and K. Moldave (ed.), Methods in enzymology vol. X I I . Nucleic acids, part B. Academic Press, NY
9, Hsu, Y.C., S. Nomura, and C.W. Kruse. 1966. Some bactericidal and v i rucidal properties of iodine not affecting infectious RNA and DNA. Amer J. Epidemiol. 82:317-328.
10. Ketzenelson, E., and N. Biedermann. 1976. Disinfection of viruses in sewage by ozone. Water Res 10:629-631
11. Katzenelson, E., B. Kletter, and H.I . Shuval. 1974. Inactivation kinetics of viruses and bacteria in water by use of ozone. J. Amer Water Works Assoc. 66:725-729.
12. Keller, J.W., R.A. Morin, and T.J. Schaffernoth. 1974. Ozone disinfect ion p i lo t plant studies at Laconia,NH. J.Amer Water Works Assoc. 66: 730-733.
13. Kleinschmidt, A.K. 1968. Monolayer techniques in electron microscopy of nucleic acid molecules, p. 361-377 In L. Grossman and K. Moldave (ed.) , Methods in enzymology, vol X I I , Part B. Academic Press Inc. , NY

31
14. Loeb, T , and N.D. Zinder 1961 A bacteriophage containing RNA. Nat'l Acad. Sci U.S. 47:282-289.
15. Majumdar, S.B., W.H. Ceckler, and O.J. Sproul 1973. Inactivation of polioviruses in water by ozonation. J. Water Pollut. Control Fed. 45:2433-2443.
16. Mudd, J .B. , R. Reavitt, A. Ongun, and T T McManus. 1969. Reaction of ozone with amino acids and proteins. Atmospheric Environment. 3:669681
17 Nebel, C , R.D. Gottschling, R.L. Hutchison, T.J. McBride, D.M. Taylor, J.L. Pavoni, M.E. Tittlebaum, H.E. Spencer, and M. Fleischman. 1973. Ozone disinfection of industrial-municipal secondary effluents. J. Water Pollut. Control Fed. 45:2493-2507
18. O'Brien, R.T. and J. Newman. 1979. Structural and compositional changes associated with chlorine inactivation of polioviruses Appl Environ. Microbiol 38:1034-1039.
19. O'Callaghan, R., R. Bradley, and R Paranchych. 1973. Controlled alterations in the physical and biological properties of R17 bacteriophage induced by guanidine hydrochloride. Virology 54:476-494.
20. Oeschger, M.P , and D. Nathans. 1966. Differential synthesis of bacteriophage-specific proteins in MS2-infected Escherichia coli treated with actinomycin. J . Mol Biol 22:235-2*7
21 O l i v ie r i , V.P-, C.W. Kruse, Y.C. Hsu, A.C. Gr i f f i ths , and K. Kawata. 1975. The comparative mode of action of chlorine, bromine, and iodine on f2 bacterial virus, p. 145-162. In J.D. Johnson (ed . ) , Disinfection water and wastewater Ann Arbor Science, Ann Arbor, MI
22. Pavoni, J .L . , M.E. Tittlebaum, H.T Spencer, M. Fleischman, C. Nebel, and R. Gottschling. 1972. Virus removal from wastewater using ozone. Water Sew. Works. 119:59-67
23. Poynter, S.F.G., J.S. Slade, and H.H. Jones 1973. The disinfection of water with special reference to viruses Wtr Trtmt. and Exam. 22:194-208.
24. Prat, R., C. Fofre, and A. Cier 1968. Effects de Thypochlorite de sodium, de 1'ozone et des radiations ionisontes sur les constituants pyrimidiques d'escherichia coli Ann. Ins. Pasteur 114:595-607
25. Previero, A. , M.A. Coletti-Previero, and P Jolles. 1967 Localization of non-essential tryptophan residues for the biological act ivi ty of lysozyme. J . Hoi Biol 24:261-268,
26. Riesser, V.W., J.R. Perrich, B.B. Si lver, and J.R. McCammon. 1976. Possible mechanism of poliovirus inactivation by ozone, p. 186-192. In Forum on ozone disinfection. International Ozone Inst i tu te , Syracuse, NY

32
27 Scott, D.B.M. 1975. The effect of ozone on nucleic acids and theirderivatives, p. 226-240. In W.J. Blogoslawski and R.G. Rice (ed.),Aquatic applications of ozone. International Ozone Institute, Syracuse,NY.
28. Shah, P., and J. McCamish. 1972. Relative resistance of poliovirus 1and coliphage f2 and T2 in water. Appl Microbiol 24:652-659.
29. Sharp, D.G., R. Floyd and J.D. Johnson. 1975. Nature of the survivingplaque-forming unit of reovirus in water containing bromine. Appl.Microbiol. 29:94-101
30. Shechter, H. 1973. Spectrophotometric method for determination of ozonein aqueous solutions. Water Res. 7:729-739.
31 Snustad, D.P. and D.S. Dean. 1971 Genetics experiments with bacterialviruses. W.H Freeman and Co., San Francisco, CA.
32. Sommerville, R.C., and G. Rempel. 1972. Ozone for supplementary watertreatment. J. Amer. Water Works Assoc. 64:377-382.
33. Venosa, A.D. 1972. Ozone as a water and wastewater disinfectant: aliterature review, p. 82-100. In F.L. Evans III (ed.), Ozone in waterand wastewater treatment. Ann Arbor Science, Ann Arbor, MI.
34. Walsh, D.S., C.E. Buck and O.J. Sproul 1980. Ozone inactivation offloe associated viruses and bacteria. J. Environ. Engr Div., Am. Soc.Civil Engr. Kte, (In press).
35. Weber, K., and W. Konigsberg. 1975. Proteins of the RNA phages. p. 5184. In N.D, Zinder (ed.), RNA phages Cold Spring Harbor Laboratory,Cold Spring Harbor, NY.
36. Yamamoto, K.R., and B.M. Alberts 1970. Rapid bacteriophage sedimentation in the presence of polyethylene glycol and its application tolarge-scale virus purification. Virology 40:734-744.
37 Young, D.C., and D.G. Sharp. 1977. Poliovirus aggregation and theirsurvival in water. Appl. Environ. Microbiol. 33:168-177.
38. Zelazo, P., and R. riaschemeyer 1969. Specific dissociation of bacteriophage f2 protein to an 11 S component. Biochemistry. 8:3587-3592.