Water Infiltration through Openings in a Vertical Plane …€¦ · Objectives Water infiltration...
44
Water Infiltration through Openings in a Vertical Plane under Static and Dynamic Pressure Conditions Michael A. Lacasse, Travis Moore National Research Council Canada Nathan Van Den Bossche Ghent University, Belgium
Transcript of Water Infiltration through Openings in a Vertical Plane …€¦ · Objectives Water infiltration...

Water Infiltration through Openings in a Vertical Plane under Static and
Dynamic Pressure Conditions
Michael A. Lacasse, Travis Moore
National Research Council Canada
Nathan Van Den Bossche
Ghent University, Belgium

• Introduction • Why bother: 2 cases • Experimental set-up and procedures • Results • Conclusions
Overview

Introduction
Concepts for watertightness Perfect barrier system Mass buffering Drained cavity
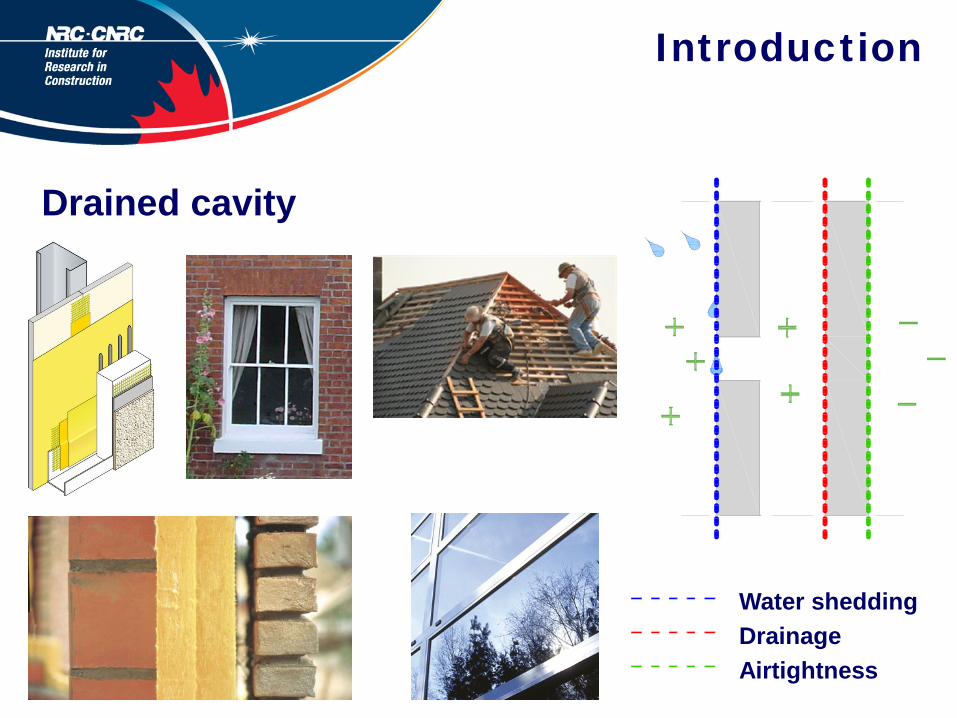
Introduction
Drained cavity
Water shedding Drainage Airtightness

Introduction
Drained cavity • Will water enter? • How much? • Where? • Why? • Is that a problem?

Case 1
Drained cavity • Will water enter? • How much? • Where? • Why? • Is that a problem? => Heat-Air-Moisture Simulations => need for input data!
(Künzel et al., 11th DBMC, 2008)

Case 2
Drained cavity
2 vents1 vent
0 vents
0 Weep holes
1 Weep hole
2 Weep holes
3 Weep holes
900
750 750750 750
450
750
600
300300
250
200
0
150
300
450
600
750
900
Pressure difference at moment of failure according to EN 12208
closing point
vent
weep hole
stay
pressure tap

Objectives
Water infiltration through openings
• Wind driven rain intensity • Pressure difference • Gust (length) • Type and size of deficiencies • Balance of forces

Experiments Test apparatus

Experiments Test apparatus

Experiments Test apparatus
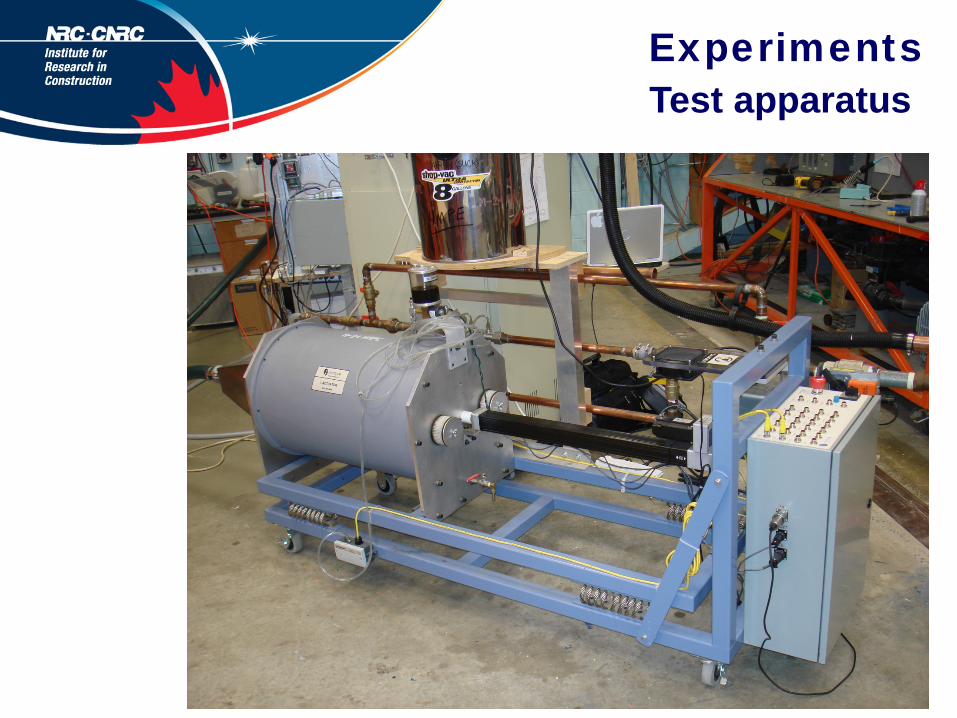
Experiments Test apparatus

Experiments Test specimen

Experiments Test specimen

Experiments Test protocol
Water spray rate
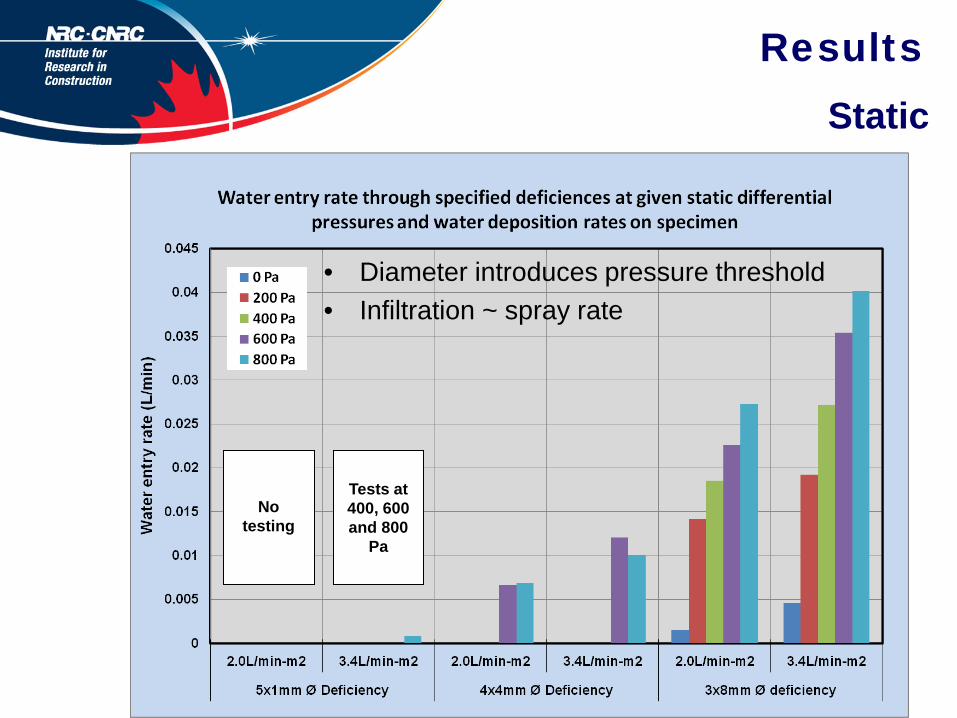
• North American standards: 3.4 L/min-m² • European standards: 2.0 L/min-m² • Only run-off was considered, no direct impingement • Run-off intensity corresponds to 3m tall window pane

Experiments Test protocol
Airtightness of back plate
• Simulates air barrier system • Different levels of performance • Pressure moderation in the cavity?

Experiments Test protocol
Pressure differences
• 0 – 200 – 400 – 600 – 800 Pa • correspond to a range wind loads
Dynamic tests: • 400 and 600 Pa mean pressure difference • Amplitudes 20%, 33%, 50% and 80% of mean • Pressure frequencies 0.1 – 0.2 – 0.333 – 1 Hz

Results
No testing
Tests at 400, 600 and 800
Pa
Static

Results
No testing
Tests at 400, 600 and 800
Pa
Static
• Diameter introduces pressure threshold
Results
No testing
Tests at 400, 600 and 800
Pa
Static
• Diameter introduces pressure threshold • Infiltration ~ spray rate

Results
No testing
Tests at 400, 600 and 800
Pa
Static
• Diameter introduces pressure threshold • Infiltration ~ spray rate • Infiltration ~ pressure difference

Results
No testing
Tests at 400, 600 and 800
Pa
Static
• Diameter introduces pressure threshold • Infiltration ~ spray rate • Infiltration ~ pressure difference • Infiltration ~ poor airtightness

Results nPCQ ∆= *
nPCQ ∆= *
Power law
C=0.00043 L/min
C=0.00029 L/min
Static

Expectations
• At what pressure difference will infiltration occur?
Results rpc
ϑγ cos2=
Phenomena
Capillary pressure Hydrostatic pressure
Exterior wind pressure Surface tension

Expectations
• At what pressure difference will infiltration occur?
Results
Deficiency
A
Flat meniscus [Pa]
1 mm 297
4 mm 74
8 mm 37
rpc
ϑγ cos2=
P
Phenomena

Expectations
• At what pressure difference will infiltration occur?
Results
Deficiency
A B
Flat meniscus [Pa]
Spherical meniscus
[Pa]
1 mm 297 274
4 mm 74 70
8 mm 37 36
Phenomena
P

Results
Deficiency
A B C
Flat meniscus [Pa]
Spherical meniscus
[Pa]
Capillary pressure
[Pa]
1 mm 297 274 121
4 mm 74 70 30
8 mm 37 36 15
θ = 66°
Expectations
• At what pressure difference will infiltration occur?
Phenomena

Results
Deficiency
A B C D
Flat meniscus [Pa]
Spherical meniscus
[Pa]
Capillary pressure
[Pa]
Capillary in drilled hole
[Pa]
1 mm 297 274 121 41
4 mm 74 70 30 10
8 mm 37 36 15 5
θ = 82°
Expectations
• At what pressure difference will infiltration occur?
Phenomena

Results
Deficiency
A B C D E
Flat meniscus [Pa]
Spherical meniscus
[Pa]
Capillary pressure
[Pa]
Capillary in drilled hole
[Pa]
Hydrostatic pressure
[Pa]
1 mm 297 274 121 41 10
4 mm 74 70 30 10 40
8 mm 37 36 15 5 80
Expectations
• At what pressure difference will infiltration occur?
Phenomena

Results
Deficiency
A B C D E F
Flat meniscus [Pa]
Spherical meniscus
[Pa]
Capillary pressure
[Pa]
Capillary in drilled hole
[Pa]
Hydrostatic pressure
[Pa]
B - D – E [Pa]
1 mm 297 274 121 41 10 223 4 mm 74 70 30 10 40 20 8 mm 37 36 15 5 80 -49
Expectations
• At what pressure difference will infiltration occur?
Phenomena

Results
Deficiency
F
B - D – E [Pa]
1 mm 223 High threshold 4 mm 20 Low threshold 8 mm -49 No threshold – infiltration at 0 Pa
Expectations
• At what pressure difference will infiltration occur?
Phenomena

Results
223 Pa threshold 20 Pa threshold 0 Pa threshold
Static

Results
223 Pa threshold 20 Pa threshold 0 Pa threshold
600 - 800 Pa 400 - 600 Pa 0 Pa
Static
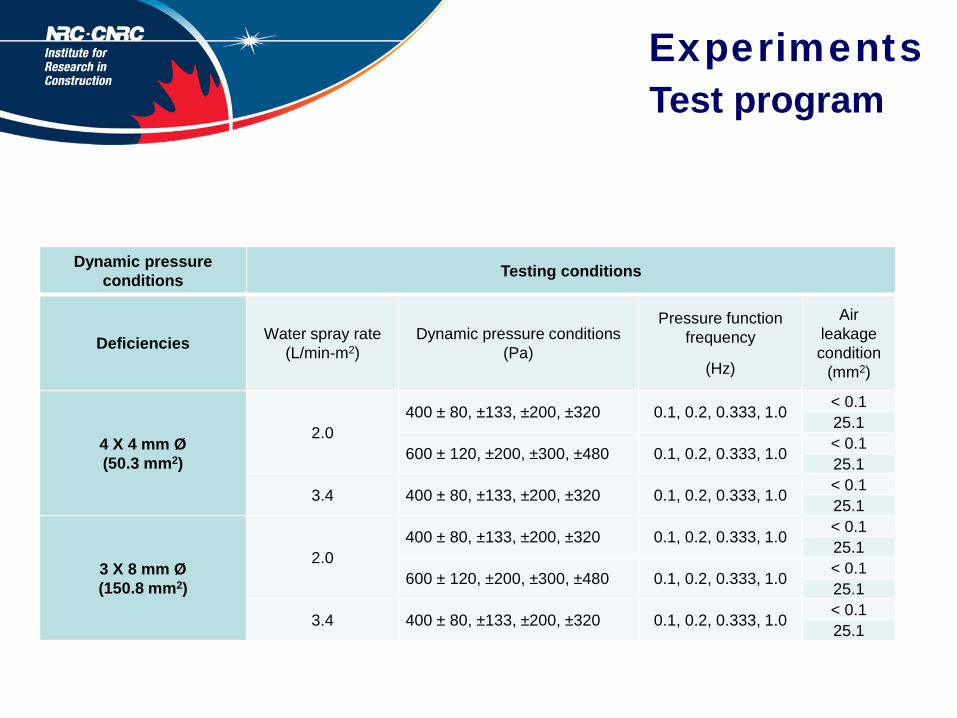
Experiments Test program
Dynamic pressure conditions Testing conditions
Deficiencies Water spray rate (L/min-m2)
Dynamic pressure conditions (Pa)
Pressure function frequency
(Hz)
Air leakage condition
(mm2)
4 X 4 mm Ø (50.3 mm2)
2.0 400 ± 80, ±133, ±200, ±320 0.1, 0.2, 0.333, 1.0 < 0.1
25.1
600 ± 120, ±200, ±300, ±480 0.1, 0.2, 0.333, 1.0 < 0.1 25.1
3.4 400 ± 80, ±133, ±200, ±320 0.1, 0.2, 0.333, 1.0 < 0.1 25.1
3 X 8 mm Ø (150.8 mm2)
2.0 400 ± 80, ±133, ±200, ±320 0.1, 0.2, 0.333, 1.0 < 0.1
25.1
600 ± 120, ±200, ±300, ±480 0.1, 0.2, 0.333, 1.0 < 0.1 25.1
3.4 400 ± 80, ±133, ±200, ±320 0.1, 0.2, 0.333, 1.0 < 0.1 25.1

Results
Dynamic

Results
Dynamic
Observations
• Under static conditions: no infiltration at 400 Pa • Infiltration ~ spray rate • Airtightness has a significant effect!

Results
Dynamic
Observations
Good airtightness • Good pressure moderation • Low pressure difference
over outer plate • Low infiltration rates • Mean pressure does not
breach meniscus • Amplitude determines
infiltration rates

Results
Dynamic
Observations
Good airtightness Poor airtightness • Good pressure moderation • Low pressure difference
over outer plate • Low infiltration rates • Mean pressure does not
breach meniscus • Amplitude determines
infiltration rates
• Poor pressure moderation • High pressure difference
over outer plate • High infiltration rates • Mean pressure does
breach meniscus • Mean pressure overrides
effect of amplitude

Results
Slits
Observations 30 degree slit: hydrostatic pressure, small surface Horizontal slit: threshold, large section

Results
Dynamic

Conclusions
Static
• Diameter introduces pressure threshold • Infiltration ~ spray rate
~ pressure difference ~ poor airtightness • Infiltration described by power law

Conclusions
Dynamic
• Diameter introduces pressure threshold • Infiltration ~ spray rate
~ pressure difference ~ poor airtightness • Higher infiltration as compared to static conditions • Infiltration mode shifts from mean pressure to amplitude
when the construction becomes more airtight

Acknowledgements
Co-authors:
Dr. Michael A. Lacasse and Mr. Travis Moore National Research Council Canada, Institute for Research in Construction, Heat and Moisture Performance of Envelopes