
Water Futures for Western Australia 2008‐30 · 2015-09-04 · Reference Details Resource...
61
J. F. Thomas Resource Economics Unit Water Futures for Western Australia 2008‐30 Accounting for Climate Change in Water Demand Scenarios
Transcript of Water Futures for Western Australia 2008‐30 · 2015-09-04 · Reference Details Resource...

J. F. Thomas
Resource Economics Unit
Water Futures for Western Australia 2008‐30
Accounting for Climate Change in Water Demand Scenarios

Resource Economics Unit
WATER FUTURES FOR WESTERN AUSTRALIA
2008-2030
ACCOUNTING FOR CLIMATE CHANGE IN WATER DEMAND SCENARIOS

Reference Details
Resource Economics Unit Water futures for Western Australia 2008‐2030. Volume 4: Accounting for climate change in water demand scenarios. Department of Water, Perth Page 2
Resource Economics Unit, Perth
TEL/FAX (08) 9388 2461 MOBILE: 04 32 66 44 07 Email: [email protected]
Title: Water futures for Western Australia 2008-2030. Volume 4: Accounting for climate change in water demand scenarios
Authors: J. F. Thomas and B. S. Sadler
Publication Date: 2008
ISBN 978-0-9805995-3-4
Volumes in this Series: Volume 1: State Report
Volume 2: Region Reports
Volume 3: Application of the MONASH-TERM model (unpublished)
Volume 4: Accounting for Climate Change in Water Demand Scenarios (this report)
Volume 5: Demand Scenario Modeling Tool User Manual (unpublished)
All volumes are available on the Western Australian Department of Water website:
www.water.wa.gov.au/publications/recentlypublished

Contents
Resource Economics Unit Water futures for Western Australia 2008‐2030. Volume 4: Accounting for climate change in water demand scenarios. Department of Water, Perth Page 3
CONTENTS EXECUTIVE SUMMARY ................................................................................................................................................ 5 1. INTRODUCTION..................................................................................................................................................... 7
1.1 OBJECTIVE AND APPROACH................................................................................................................................ 7 1.2 DEFINITIONS OF DEMAND AND WATER AVAILABILITY ...................................................................................... 7 1.3 TYPES OF CLIMATE CHANGE IMPACTS ON DEMAND........................................................................................... 7 1.4 SOURCES OF INFORMATION ................................................................................................................................ 8 1.5 CREATING A CLIMATE-DEPENDENT SCENARIO IN THE WATER DEMAND SCENARIO MODELLING TOOL ............ 8
2. PROJECTED HYDRO-CLIMATE - GLOBAL, NATIONAL AND STATE SCENARIOS ............................. 9 2.1 INTERNATIONAL AND NATIONAL SCIENTIFIC JUDGEMENT AND SCENARIO MATERIAL....................................... 9 2.2 A SCENARIO BASED RISK MANAGEMENT APPROACH FOR WESTERN AUSTRALIA ............................................. 9 2.3 GLOBAL EMISSION SCENARIOS AS THE STARTING POINT ................................................................................. 10 2.4 SCENARIO LIKELIHOODS .................................................................................................................................. 10 2.5 CLIMATE OUTCOMES FOR THE SCENARIO RANGE ............................................................................................ 11
3. ECONOMIC IMPACTS OF CLIMATE CHANGE............................................................................................ 12 3.1 GLOBAL ECONOMIC IMPACTS. .......................................................................................................................... 12 3.2 DEVELOPING COUNTRIES ................................................................................................................................. 12 3.3 DEVELOPED COUNTRIES ................................................................................................................................... 13 3.4 DISCUSSION...................................................................................................................................................... 14
4. AGRICULTURE..................................................................................................................................................... 15 4.1 OVERVIEW........................................................................................................................................................ 15 4.2 IMPACTS ON AGRICULTURAL PRODUCTIVITY................................................................................................... 17 4.3 IMPACTS ON AGRICULTURAL OUTPUT.............................................................................................................. 17 4.4 IRRIGATION PROSPECTS.................................................................................................................................... 18 4.5 WESTERN AUSTRALIAN FARMING.................................................................................................................... 18 4.5.1 Wheat-Sheep Zone ...................................................................................................................................... 19 4.5.2 The South West............................................................................................................................................ 20 4.5.3 Kimberley Region........................................................................................................................................ 20
5. MINERALS AND ENERGY INDUSTRIES ........................................................................................................ 21 6. UNIT WATER USE................................................................................................................................................ 22
6.1 UNITS OF ACTIVITY .......................................................................................................................................... 22 6.2 PRINCIPAL CLIMATE CHANGE FACTORS........................................................................................................... 22 6.3 SUMMARY OF UNIT DEMAND INFLUENCES....................................................................................................... 23
7. GREENHOUSE POLICY-INDUCED CHANGES.............................................................................................. 23 7.1 OVERVIEW........................................................................................................................................................ 23 7.2 AGRICULTURE .................................................................................................................................................. 24

Contents
Resource Economics Unit Water futures for Western Australia 2008‐2030. Volume 4: Accounting for climate change in water demand scenarios. Department of Water, Perth Page 4
7.3 FORESTRY ........................................................................................................................................................ 24 ............................................................................................................................................................................................ 26
7.4 WA TREASURY MODELLING ............................................................................................................................ 27 8. GROWTH SCENARIOS AND UNIT WATER USE UNDER EXPECTED CLIMATE CHANGE .............. 27 9. REFERENCES........................................................................................................................................................ 32 ANNEX A: DETAILED ASSESSMENT OF POTENTIAL CLIMATE CHANGE IMPACTS BY USER SECTOR AND CLIMATE REGION .............................................................................................................................................. 33
TABLES Table 1: Preferred High, Medium and Low Emissions Scenarios for the Department of Water’s adaptive planning .................................................................................................................................10
Table 2: Carbon Dioxide equivalents of key scenarios. (IPCC , Feb 2, 2007)...................................10
Table 3: Scenarios of Cumulative Mean Annual Temperature Change in Western Australian Regions of greatest and least projected warming – Best Estimate of Underlying Cumulative GHG Warming oC - Nominally relative to 1910 ...........................................................................................................12
Table 4: Potential climate change impacts on Western Australian agriculture (for given changes in temperature relative to 1990) ...............................................................................................................17
Table 5:Illustrative growth rates with and without climate change.....................................................21
Table 7: Potential impacts on WA industries of alternative scenarios for reductions in emissions ....27
Table 7: Compilation of a climate-sensitive MONASH-TERM run to the year 2030 ........................28
FIGURES Figure 1: Multi-model averages and assessed ranges for surface warming.........................................11
Figure 2: Average May-July rainfall in 1975 to 2003 (dotted isohyets) compared to 1925 to 1975 (solid isohyets) .....................................................................................................................................16
Figure 3: Carbon sequestration potential for forestry in WA ..............................................................25

Executive Summary
Resource Economics Unit Water futures for Western Australia 2008‐2030. Volume 4: Accounting for climate change in water demand scenarios. Department of Water, Perth Page 5
EXECUTIVE SUMMARY
Although climate change will cause widespread environmental stress and autonomous environmental change, its impacts and possible policy responses are currently foreseen mostly through supply side accounting. More likely than not the net effects of hydro-climatic forcing resulting from warming and rainfall changes will have a negative effect on water availability in most WA regions. The most likely exception is the Kimberley Region. However, regional rainfall projections in the north are based on much less comprehensive downscaling investigation and synoptic interpretation than for the south and will need regular review as scientific opportunity develops. The Demand Tool will allow the Department to explore supply demand balances under alternative hydro-climate scenarios.
The supply side of the demand-supply equation is to be picked up in water availability inputs to the Water Demand Scenario Modeling Tool. These inputs are currently being assembled by DoW.
However, climate change will also potentially affect the demand for water, and that is the subject of this paper. Based on our interpretation of and our inferences from recent literature it is suggested that the principal impacts on water demand that are likely to result from climate change within the time-horizon of this study (i.e. by 2030) are as follows.
Four principal kinds of impact that climate change may have on water demand have been identified:
• Regionally ubiquitous (mostly negative other than in agriculture) impacts on economic growth rates resulting from (i) climate driven influences on the global economy, and (ii) climatic influences on agricultural productivity in Western Australia
• Climate driven change in unit water demand (mostly positive), particularly the agricultural, urban, self supplied and commercial impacts of drying and warming
• Regulatory changes driven by attempts to deal with environmental change. Reduction of available water resources in most regions will progressively cause regulatory capping of water use: in particular through Statutory Water Allocation Plans to be developed in line with the Blueprint for Water Reform in Western Australia, and through water conservation initiatives backed by regulation across a wide range of user sectors The Demand tool will allow the Department to explore alternative regulatory scenarios.
• Structural economic changes associated with adaptive responses to regional development, sustainability thresholds and rising water values
The likelihood of climate change having a significant impact on water demand over the next quarter century varies markedly between regions. As a generalization, the biggest climate change impacts are apparent in the greater south west of the State where a drying climate is already manifest and where many aspects of water demand are climate sensitive. Outside of the south west, sparse populations and a predominantly mining economy limit the effect of climate on water demand in many regions, including regions of most severe warming.
In the Perth/Peel Region unit demands of households and civic uses (from both public water supply and self-supply from bores), will be affected by rainfall declines, raised temperature and evapostranspiration (ET). Some small downward revision of water demand from export
Executive Summary
Resource Economics Unit Water futures for Western Australia 2008‐2030. Volume 4: Accounting for climate change in water demand scenarios. Department of Water, Perth Page 6
industries might follow negative change in global GDP, while the growth rates of industries servicing agriculture in the State could decline.
Climate change has the potential to depress productivity and activity levels relative to trend, in all regions where rain-fed agriculture is a dominant economic activity. The affected Demand Regions include Pallinup, Upper Great Southern, Midlands, Moore and Greenough Demand Regions. These regions will be strongly affected in terms of agricultural output and productivity, suggesting a downward revision of water demand estimates compared to trend, unless unit water use increases as a defensive measure by hard-pressed farmers and townships.
In the South West Region work will be needed on potential impacts of raised temperature and ET on unit water use of different irrigation activities in order for the DoW to make some quantitative assessment. The prospects for rainfall affecting water demand are less of an issue. The irrigated dairy and beef industry in the south west is likely to experience even stronger competition from New Zealand, which is likely to benefit from climate change, and experience a small decline in overseas markets relative to trend as a result of a negative net impact of climate change on global GDP. Carbon constraints would impose significant costs on these industries, changing their product mix and lowering their marginal values for water.
Reduced water availability in the south west coupled with new water reform initiatives, in particular water trading and the setting of allocation limits in Statutory Water Allocation Plans, may lead to continuing transfers of water out of those irrigation activities having low marginal values for water, thus changing the mix of irrigation activities and water demands.
The South West is where forestry initiatives in response to carbon trading may have an impact on unlicensed use (draw down of aquifers), depending on prior land use.
The East and West Pilbara and the Murchison are regions with the highest projected levels of warming in Australia. This may increase unit water requirements for wash down, dust suppression etc in response to higher temperatures, and ET. There could also be a small impact on the level of activity relative to trend in mining regions from reduced rates of growth of global GDP. Global economic effects of climate change, notably a depressed rate of increase in global GDP, could shave up to 5 per cent off Year 2030 outcomes for the mineral and energy sectors.
Kimberley projections are equivocal for rainfall and temperature and are complicated by possible positive forcing of the monsoon from the “dimming” effects of Asian aerosols. The net consequence is that no significant change in unit water demand is foreseen as likely in the next few decades. Our biggest concern is the competitive standing of the sugar industry. International repercussions of climate trends on the sugar industry include reduced yields in India and ASEAN countries, but a strengthening of Brazil’s competitive position. The implications for water use in the East Kimberley are as yet unclear.

Introduction
Resource Economics Unit Water futures for Western Australia 2008‐2030. Volume 4: Accounting for climate change in water demand scenarios. Department of Water, Perth Page 7
ACCOUNTING FOR CLIMATE CHANGE IN WATER DEMAND SCENARIOS
1. INTRODUCTION
1.1 Objective and Approach The objective of this paper is to develop a set of assumptions that can be used in an application of the Water Demand Scenario Modelling Tool to explore the implications of prospective climate changes for water demand in Western Australian regions.
The paper draws on: (i) a review of selected recent publications on the economic impacts of climate change internationally and within Australia, and (ii) a detailed review and interpretation of the most recent information and analysis on prospects for climate change in WA regions (Sadler ed., 2008). These sources are used to compile a set of working assumptions for each of the 59 user groups represented in the Water Demand Scenario Modelling Tool.
1.2 Definitions of Demand and Water Availability For the purposes of this paper:
Water demand includes all consumptive uses of water including (i) that obtained directly by abstraction from surface water and groundwater, (ii) dewatering requirements of mines or construction sites, and (iii) that obtained through any supply scheme operated by the Water, Sewerage and Drainage Services sector. The Water, Sewerage and Drainage Services sector includes both urban water suppliers and irrigation cooperatives.
The term “Water Availability” is used occasionally in the paper. This equals the sum of water allocation limits on abstractive use that have been set within a region plus water production from desalination plants or reclaimed water schemes.
Non-abstractive uses, such as the water use of forests, are excluded. Environmental allocations are also excluded.
1.3 Types of Climate Change Impacts on Demand We distinguish four kinds of demand impact:
Global impacts on regional economic structures: resulting, for example, from changes in global GDP, or shifts in comparative advantage for Australian producers resulting from climate change, leading to a changed water use scenario for an industry;
Impacts that are dependent on local climate scenarios: for example changes in the water use per unit output of an agricultural industry;
Introduction
Resource Economics Unit Water futures for Western Australia 2008‐2030. Volume 4: Accounting for climate change in water demand scenarios. Department of Water, Perth Page 8
Impacts on regional economic structure that may result from Australian climate policy, including carbon trading and introduced constraints on carbon emissions; and
Changes in water allocations or new regulations affecting the way in which water is used, due to revised estimates of water availability.
This paper deals mainly with the first three of these impacts. The report does not consider changes in regional economic structure that could result from revisions to the official estimates of water availability due to climate change, together with any consequent changes to allocation limits under the new Blueprint for Water Reform in WA. This is because the Water Demand Scenario Modelling Tool will itself play a part in water allocation decisions. This approach provides a clear separation between demand and water availability.
1.4 Sources of Information The following recent publications have been used in developing the paper:
The Stern Report ABARE Review of Climate Change Impacts on Australian Agriculture Garnaut Review Interim Report Regional Climate Change and Risk Management of Water Resources in Western
Australia (Sadler ed., 2008 for Department of Water)
The Garnaut Climate Change Review is an independent study by Professor Ross Garnaut, commissioned by Australia's State and Territory Governments on 30 April 2007. The Review will examine the impacts of climate change on the Australian economy, and recommend medium to long-term policies and policy frameworks to improve the prospects for sustainable prosperity. The Review's final report is due on 30 September 2008, with a draft by 30 June 2008. A number of forums are being held around Australia to engage the public on various issues relating to the Review.
The Regional Climate Change Report (Sadler ed.) produced for the Department of Water in parallel with this study draws upon the recent IPCC Assessment and national derivatives to produce climate scenarios for regions (See Annex A) which envelop and are readily related to the more geographically divided Demand Regions of this study.
1.5 Creating a Climate-dependent Scenario in the Water Demand Scenario Modelling Tool There are a number of places within the Water Demand Scenario Modeling Tool where assumptions about climate-induced changes may be expressed. These are as follows.
Demographic and economic growth rates for may be changed. Climate change will force structural adjustments in some regions. For example: (i) rain-fed crops and pastures are facing productivity and output reductions, compared to trend as a direct result of local climate changes; (ii) national or global loss of production in some products will create opportunities for regions that are able to offer increased irrigation supplies; and (iii) downward revisions of growth in global GDP could lead to slightly reduced growth for WA mineral and energy exports. The Demand tool will allow the Department to explore alternative scenarios. All that is needed in order to express the potential structural effects is to specify a change in growth rate for the prime industry in the MONASH-TERM economic model. The underlying input-output economic model will then change the output levels of all related industries. Resulting growth rates across all industries are then re-entered into the Water Demand Scenario Modeling Tool

Introduction
Resource Economics Unit Water futures for Western Australia 2008‐2030. Volume 4: Accounting for climate change in water demand scenarios. Department of Water, Perth Page 9
Water use coefficients might be changed. Water use coefficients in the Water Demand Scenario Modeling Tool express water demand per unit of the indicator value for a user group; this might be value added, employment, area irrigated, number of livestock, human population etc. The coefficients reflect prevailing climate, water use technologies and water using practices. In the absence of counter-measures climate change will impact on water use coefficients. However, there is not much basis for predictive economic modeling of counter-measures and a sensitivity approach is needed.
Inter-regional transfers: Regions with capacity for water export may find increased demand for their water as a consequence of climate shortages in adjacent regions. The Demand Tool will allow the Department to explore alternative water development (including desalination or wastewater re-use) and regional export/import scenarios.
2. PROJECTED HYDRO-CLIMATE - GLOBAL, NATIONAL AND STATE SCENARIOS
2.1 International and National Scientific Judgement and Scenario Material There is now unequivocal evidence that global climate has been changing (warming), a strong likelihood that its prime underlying cause has been anthropogenic and a strong expectation that global warming will continue through this century driven primarily by carbon emissions. There is now a substantive body of recent international and national scientific reporting available to assist in making judgements on future climate risks in Western Australia. This includes: the 2007, Fourth Assessment Report (4AR) of the IPCC; the 4AR based Climate Change in Australia Report of CSIRO/BoM later in 2007; and the various more specific regional studies which have spun off from the Indian Ocean Climate Initiative in Western Australia. Whilst, in such recent scientific reporting, there is growing confidence in the broad direction and scale of projected change there is, and will always be, uncertainty attached to detail. This uncertainty, is a consequence of:
1. the noise of natural variability (which increases at concentrated geographic scales); 2. the uncertainty of future human behaviour; and 3. the complexity of the climate system and associated scientific limitations.
Climate affected sectors need to respond to this circumstance in some form of risk management approach.
2.2 A Scenario Based Risk Management Approach for Western Australia The climatic range of Western Australia, from wet tropical in the far north, through the dry sub-tropics to a temperate climate in the south west, imply that the nature of projected climate change and impacts differ markedly in different parts of the State.
In response the Department of Water has recently completed a review which sets out a scenario based framework for risk management of water resources in Western Australia (Sadler ed., 2008). This review draws on the latest available climate science.

Global, National & State Climate Scenarios
Resource Economics Unit Water futures for Western Australia 2008‐2030. Volume 4: Accounting for climate change in water demand scenarios. Department of Water, Perth Page 10
2.3 Global Emission Scenarios as the Starting Point The starting point for definition of water oriented climate scenarios has been in selection of global emission scenarios. These scenarios are regarded as representing, from optimistic to pessimistic, a range of plausible emission outcomes labeled low, medium and high respectively.
The chosen scenarios are from the wider set of scenarios developed by the IPCC and are scenarios for which a substantial range of recent modeling is available. The chosen scenarios are shown in the Table hereunder (Table xx) and the corresponding, end of century Greenhouse Gas concentrations are shown in Table 1. (See Sadler ed. 2008. Section 1).
Table 1: Preferred High, Medium and Low Emissions Scenarios for the Department of Water’s adaptive planning
Preferred High, Medium, Low Emissions Scenarios - to represent the range of risks for adaptive management planning at different Time Horizons
Scenario Classification 2030 2050 2070 2100
High Emissions A1FI A1FI A2
Medium Emissions A1B (or A2) A1B A1B
Low Emissions
A1B
B1 B1 B1
Table 2: Carbon Dioxide equivalents of key scenarios. (IPCC , Feb 2, 2007)
SRES Scenario
Approx. CO2 Equivalent at 2100*
A2 1250 A1FI 1550 A1B 850 B1 600 (~550)
* Approximate CO2 equivalent concentrations ppm corresponding to the computed radiative forcing due to anthropogenic greenhouse gases and aerosols in 2100
2.4 Scenario Likelihoods From Table 2 it is important to note, in the context of this demand modeling study, that only one emission scenario (A1B) is currently adopted by the Department of Water to represent the high low and medium emission scenarios for 2030. This is because there is very little differentiation amongst scenarios up to that time. This fact is convenient for this study which is primarily concerned with developing modeling tools for projections to 2030.
Beyond 2030 the low scenario B1 is the aspirational goal of current mitigation negotiations and the target needed to have some prospect of avoiding dangerous global change. A1FI/A2 the high scenario, reflects business-as-usual expectations to 2070 with tokenistic mitigation. To achieve B1 would need urgent and strong global action. As much as B1 is desirable, there is little happening at global level to suggest it is any more likely as an outcome than is the high scenario. From the adaptive viewpoint there is a risk that global outcomes may be anywhere in the range of B1-A1FI up to 2070.

Global, National & State Climate Scenarios
Resource Economics Unit Water futures for Western Australia 2008‐2030. Volume 4: Accounting for climate change in water demand scenarios. Department of Water, Perth Page 11
2.5 Climate Outcomes for the Scenario Range The climate outcomes for the various scenarios as currently assessed for the Department’s planning are given in its recent report (Sadler ed., 2008). Because on natural variability and model diversity these judgements are presented in confidence bands.
For the application of the climate effects to demand modelling tools of this study it is assumed that the scenario report (Sadler ed., 2008), or its subsequent updates will be used for regional climate projection. However, as an indicator of the ranges involved, Figure 1 and Table 3are included hereunder to show the range of (temperature) outcomes potentially associated with alternative scenarios.
Figure 1: Multi-model averages and assessed ranges for surface warming.
Solid lines are multi-model global averages of surface warming (relative to 1980–99) for the scenarios A2, A1B and B1, shown as continuations of the twentieth-century simulations. Shading denotes the plus/minus one standard deviation range of individual model annual averages. The orange line is for where concentrations were held constant at year 2000 values. The grey bars at right indicate the best estimate (solid line within each bar) and the likely range assessed for the six SRES marker scenarios. The assessment of the best estimate and likely ranges in the gray bars included the sources employed in the left part of the figure, as well as results from a hierarchy of independent models and observational constraints. Source: Summary for Policy Makers - IPCC Fourth Assessment Report. Paris: WMO/UNEP Intergovernmental Panel on Climate Change http://www.ipcc.ch/SPM2feb07.pdf. (IPCC , Feb 2, 2007 , p. 4)

Global, National & State Climate Scenarios
Resource Economics Unit Water futures for Western Australia 2008‐2030. Volume 4: Accounting for climate change in water demand scenarios. Department of Water, Perth Page 12
Table 3: Scenarios of Cumulative Mean Annual Temperature Change in Western
Australian Regions of greatest and least projected warming – Best Estimate of Underlying Cumulative GHG Warming oC - Nominally relative to 1910
Horizon Region Scenario 1990 2007 2030 2050 2070
B1 2.2 3.0
A1B 3.0 3.7 10. East Pilbara Region: Region of greatest projected warming in WA A1FI
0.7 1.2 2.0 3.2 4.7
B1 1.3 1.8
A1B 1.8 2.3
3. South Coast Region: Region of least projected warming in WA A1FI
0.5 0.8 1.4
2.0 2.8
3. ECONOMIC IMPACTS OF CLIMATE CHANGE
Climate impacts will be felt world-wide (Stern 2006; Garnaut, 2007), but with different “signatures” in different parts of the globe, and within Australia (CSIRO, 2007; Sadler, this study).
3.1 Global economic impacts. As ABARE (2007) points out, modeling the overall impact of climate change is a formidable challenge, involving forecasting over a century or more as the effects appear with long lags and are very long-lived. The limitations to our ability to model over such a time scale demand caution in interpreting results, but projections can illustrate the risks involved.
Most formal modeling has used 2 - 3°C warming (B1 or A1B in Sect. 2.2 above) as a starting point. According to Stern (2006) the cost of climate change for this range of temperature increase, could be equivalent to around a 0 - 3% loss in global GDP from what could have been achieved in a world without climate change. Poor countries will suffer higher costs.
However, according to Stern (2006), in the absence of ameliorative measures, termed business as usual (BAU), temperature increases may exceed 2 - 3°C by the end of this century (A1FI or A2 in Sect. 2.2 above). This increases the likelihood of a wider range of impacts than previously considered, which are more difficult to quantify. For example, with 5 - 6°C (high end of A1FI ensemble estimates - Fig. xx above) warming, models that include the risk of abrupt and large-scale climate change estimate a 5 -10% loss in global GDP, with poor countries suffering costs in excess of 10%. The risks, however, cover a very broad range and according to Stern (2006) involve the possibility of much higher losses.
3.2 Developing Countries According to Stern (2006), developing countries are especially vulnerable to climate change because of their geographic exposure, low incomes, and greater reliance on climate sensitive economic sectors such as agriculture. Many developing countries are already struggling to cope with their current climate. For low-income countries, major natural disasters today can cost an average of 5% of GDP.

Economic Impacts
Resource Economics Unit Water futures for Western Australia 2008‐2030. Volume 4: Accounting for climate change in water demand scenarios. Department of Water, Perth Page 13
Health and agricultural incomes will be under particular threat from climate change. For example:
Falling farm incomes will increase poverty and reduce the ability of households to invest in a better future and force them to use up meagre savings just to survive.
Millions of people will potentially be at risk of climate-driven heat stress, flooding, malnutrition, water related disease and vector borne diseases. For example, dengue transmission in South America may increase by 2 to 5 fold by the 2050s.
The cost of climate change in India and South East Asia could be as high as a 9-13% loss in GDP by 2100 compared with what could have been achieved in a world without climate change.
Up to an additional 145-220 million people could be living on less than $2 a day and there could be an additional 165,000 to 250,000 child deaths per year in South Asia and sub-Saharan Africa by 2100 due to income losses alone.
In some parts of the developing world, severe deterioration in the local climate could lead to mass migration and conflict, especially as another 2-3 billion people are added to the developing world’s population in the next few decades:
Rising sea levels, advancing desertification and other climate-driven changes could drive millions of people to migrate: more than a fifth of Bangladesh could be under water with a 1m rise in sea levels – a possibility by the end of the century.
Drought and other climate-related shocks risk sparking conflict and violence, with West Africa and the Nile Basin particularly vulnerable given their high water dependence.
Stern (2006) asserts that these risks place an even greater premium on fostering growth and development to reduce the vulnerability of developing countries to climate change. However, little can now be done to change the likely adverse effects that some developing countries will face in the next few decades, and so some adaptation will be essential.
3.3 Developed countries Climate change will have some positive effects for a few developed countries for moderate amounts of warming, but will become very damaging at the higher temperatures that threaten the world in the second half of this century.
In higher latitude regions, such as Canada, Russia and Scandinavia, climate change could bring net benefits up to 2°C or 3°C (B2 to A1B in Section 2.2 above) through higher agricultural yields, lower winter mortality, lower heating requirements, and a potential boost to tourism. But these regions will also experience the most rapid rates of warming with serious consequences for biodiversity and local livelihoods.
Developed countries in lower latitudes will be more vulnerable. Many regions where water is already scarce will face serious difficulties and rising costs as a consequence of changed water regimes. Recent studies suggest a 2°C (B2) rise in global temperatures may lead to a 20% reduction in water availability and crop yields in southern Europe and a more erratic water supply in California, as the mountain snowpack melts by 25 – 40%. In the USA, one study predicts a mix of costs and benefits initially (± 1% GDP), but then declines in GDP even in the most optimistic scenarios once global temperatures exceed 3°C.
Economic Impacts
Resource Economics Unit Water futures for Western Australia 2008‐2030. Volume 4: Accounting for climate change in water demand scenarios. Department of Water, Perth Page 14
The poorest will be the most vulnerable. People on lower incomes are more likely to live in poor quality housing in higher-risk areas and have fewer financial resources to cope with climate change, including lack of comprehensive insurance cover.
The costs of extreme weather events, such as storms, floods, droughts, and heat waves, will increase rapidly at higher temperatures, potentially counteracting some of the early benefits of climate change. Costs of extreme weather alone could reach 0.5 - 1% of world GDP by the middle of the century, and will keep rising as the world warms.
Damage from hurricanes and typhoons will increase substantially from even small increases in storm severity, because they scale as the cube of wind speed or more. A 5 – 10% increase in hurricane wind speed is predicted to approximately double annual damages, resulting in total losses of 0.13% of GDP each year on average in the USA alone.
The costs of flooding in Europe are likely to increase, unless flood management is strengthened in line with the rising risk. In the UK, annual flood losses could increase from around 0.1% of GDP today to 0.2 – 0.4% of GDP once global temperature increases reach 3 to 4°C.
Heat waves like 2003 in Europe, when 35,000 people died and agricultural losses reached $15 billion, will be commonplace by the middle of the century.
At higher temperatures, developed economies face a growing risk of large-scale shocks.
Extreme weather events could affect trade and global financial markets through disruptions to communications and more volatile costs of insurance and capital.
Major areas of the world could be devastated by the social and economic consequences of very high temperatures. As history shows, this could lead to large-scale and disruptive population movement and trigger regional conflict.
3.4 Discussion It is important to note that the Stern report is written in the framework of benefit-cost analysis. In some cases economic costs of climate change, e.g. the costs of increased flooding or hurricane damage are expressed as GDP-equivalents. Put another way, in these cases the implication of climate worsening is that a greater proportion of global GDP would need to be used in defensive or rehabilitation expenditures as opposed to alternative, income and welfare increasing investments. The mechanism by which such a diversion would reduce the level of global GDP is not explained. It is clear, however, that reductions in the agricultural productivity of developing countries would certainly affect global economic growth prospects, and through that would potentially affect global export markets on which the Western Australian economy depends.
The Stern Report says relatively little on global impacts in the shorter-term (i.e. 30 years or less). Therefore, it provides little evidence to support any change in the MONASH-TERM assumptions about the overall growth of the Western Australian economy to the year 2030. However, the Stern Review clearly sets out the nature of future impacts and these will occur earlier if climate change is more rapid.

Impacts on Agriculture
Resource Economics Unit Water futures for Western Australia 2008‐2030. Volume 4: Accounting for climate change in water demand scenarios. Department of Water, Perth Page 15
4. AGRICULTURE
4.1 Overview ABARE (2007) indicates that future climate changes and associated declines in agricultural productivity and global economic activity may affect global production of key commodities. ABARE suggests that global wheat, beef, dairy and sugar production could decline by 2–6 per cent by 2030 and by 5–11 per cent by 2050, relative to what would otherwise have been the case (the ‘reference case’). Cline (2007), quoted by ABARE, estimates that world agricultural production could potentially fall by 16 per cent (without carbon fertilization) and by 3 per cent (with carbon fertilization) by 2080 (Cline 2007).
These changes would also have significant implications for Australian agricultural markets. Exports of key commodities are projected by ABARE to decline by 11–63 per cent by 2030 and by 15–79 per cent by 2050, relative to the reference case. Agricultural trade impacts of future changes in climate are likely to arise from the interaction of two forces — first, from a potential reduction in agricultural output in key producing countries and, second, from a slowdown in global economic activity brought about by climate change related effects leading to a decline in demand for agricultural products in some regions. In this context it is important to recognise that the likely change in demand for agricultural commodities, such as grains, in response to changes in income is likely to be relatively low across many regions given their importance in meeting dietary requirements. For these commodities supply shortage mean steeply rising prices. On the other hand, the likely change in demand for dairy and livestock products in response to changes in income is likely to be relatively high, particularly in a number of developing countries.
According to ABARE, Australia is projected to be one of the most adversely affected regions from future changes in climate in terms of reductions in agricultural production and exports. Cline (2007) projects that, by 2080, potential climate change could lower agricultural productivity in Australia by 27 per cent (without carbon fertilization) and by 16 per cent (with carbon fertilization).
Projected higher temperatures and lower rainfall are expected to reduce Australia’s agricultural production relative to the reference case. Increases in carbon dioxide concentration could have positive carbon fertilization effects by increasing the rate of photosynthesis in some plants (Steffen and Canadell, 2005). However, higher concentrations of carbon dioxide could also reduce crop quality, by lowering the content of protein and trace elements (EEA, 2004). The positive impacts of carbon fertilization are likely to be restricted by high temperatures and low rainfall, which are both expected to occur in Australia (CSIRO, 2007).
Climate change will affect the comparative advantage of different countries in agricultural production as compared with Australia. For example, given the assumed increases in New Zealand’s agricultural productivity, as reported in Cline (2007), output of New Zealand dairy and beef is expected to expand, relative to the reference case, while Brazil is expected to take an increasing share of world sugar production.
In the south west of Western Australia declines in rainfall are already a fact of life for farmers. This is illustrated in Figure 2, (from Department of Agriculture and Food, 2008) which suggests a contraction of the wheat belt in a south westerly direction.

Impacts on Agriculture
Resource Economics Unit Water futures for Western Australia 2008‐2030. Volume 4: Accounting for climate change in water demand scenarios. Department of Water, Perth Page 16
Figure 2: Average May-July rainfall in 1975 to 2003 (dotted isohyets) compared to 1925 to
1975 (solid isohyets)
Source: P. Hope, 2005, Indian Ocean Climate Initiative Notes on Changed Climate in SWWA Number 5/05 www.ioci.org.au

Impacts on Agriculture
Resource Economics Unit Water futures for Western Australia 2008‐2030. Volume 4: Accounting for climate change in water demand scenarios. Department of Water, Perth Page 17
4.2 Impacts on Agricultural Productivity ABARE quotes several studies of the productivity impacts of prospective climate change. The main effects occur through changes in average conditions, notably from changes in rainfall, temperature and ET. Extreme events such as flooding and droughts are also likely to impact on agricultural productivity and production by decreasing crop yields and increasing stock losses (Ecofys, 2006). Flooding has not been indicated as a rising source of loss in WA, but the effects of drought are likely to become more severe. Changes in temperatures are projected to alter the incidence and occurrence of pests and diseases, in some cases benignly, in others adversely. Relevant studies giving implications for agriculture in Western Australia are summarized in Table 4.
Table 4: Potential climate change impacts on Western Australian agriculture (for given
changes in temperature relative to 1990)
Temperature Change
Sector/Impact Source
Annual milk production per cow falls by 250–310 litres, or 6 per cent
Preston and Jones, 2006
Total factor productivity of wheat in WA falls by 7.3 per cent, relative to the reference case
Heyhoe et al., 2007
< 1°C
Total factor productivity of sheep meat in WA falls by 6.1 per cent, relative to the reference case
Heyhoe et al., 2007
Pasture productivity falls 15 per cent with 20% lower precipitation
Crimp et al., 2002
1–2°C Liveweight gain in cattlefalls 12 per cent with 20 per cent lower precipitation
Crimp et al., 2002
3-4% Tick-related losses in net cattle production weight increase by 128%
Crimp et al., 2002
4.3 Impacts on Agricultural Output ABARE has assessed the combined impacts in Australia of (i) assumed global developments (slowdown in global economic activity and a decline in agricultural productivity) and (ii) domestic developments (a decline in agricultural productivity in key growing regions) using its GTEM–Ausregion modelling interface. Overall, the modeling results indicate that the output effects on key agricultural industries are broadly in line with the productivity impacts. With assumed changes in climate, Australian production of key agricultural products is estimated to decline relative to the reference case, as follows:

Impacts on Agriculture
Resource Economics Unit Water futures for Western Australia 2008‐2030. Volume 4: Accounting for climate change in water demand scenarios. Department of Water, Perth Page 18
Wheat: production is estimated to decline by 8.3–9.6 per cent at 2030 and 12–13 per cent at 2050, relative to the reference case, in New South Wales, Victoria, South Australia and Western Australia.
Sheep meat: output in the sheep meat industry in New South Wales, Victoria, South Australia and Western Australia is estimated to decline by 6.4–8.1 per cent at 2030 and 12–13 per cent at 2050, relative to the reference case.
Beef: output in New South Wales, Victoria, Queensland, Western Australia and Northern Territory is estimated to decline by between 0.7–20 per cent at 2030 and 3.0–34 per cent at 2050, relative to the reference case, as a result of potential changes in climate.
Dairy industry: output is also estimated to fall relative to the reference case, at 2030 and 2050.
ABARE emphasizes that there is a continuing need for the agriculture sector to maintain strong productivity growth in order to cope with the potential pressures emerging from climate change. In this context, adaptation measures, including improved agricultural technologies (including irrigation systems), will be particularly important in reducing the potential impacts. There is also an urgent need for policies that encourage rather than impede adjustment in vulnerable sectors in agriculture, including already marginal farming enterprises.
4.4 Irrigation Prospects ABARE projections refer to wheat, sheep meat, beef and dairy production, without any differentiation of irrigated versus rain-fed production. They take account of rainfall and water availability in a lumped manner. Therefore, the ABARE results are of little help in assessing impacts on irrigated agriculture. This is probably due to the importance of the Murray Darling Basin in total Australian agriculture. In that basin climate impacts on irrigation enterprises are likely to be at least as bad as those for dryland farms, given a scenario for lower rainfall and runoff.
However, in areas where irrigation can be substituted for dryland farming, or where water can be accessed to maintain the viability of animal production in dryland farming areas, there could be substantial pressure for increased access to water entitlements. The availability and cost of water will then become critical for farm viability in existing agricultural areas. Cline (2007) suggests that under a “baseline” global warming scenario the ratio of irrigated crop area to total harvested crop area in the U.S.A. could rise by some 20.3% by 2080, water availability and cost permitting.
4.5 Western Australian Farming Kingwell (2007), writing before the publication of Climate Change in Australia (CSIRO and Bureau of Meteorology 2007) suggested the following potential impacts for Western Australia (our notes are added in parenthesis):
Changes in the seasonal distribution of rainfall with some regions becoming drier whilst others, particularly some pastoral regions, becoming wetter. The latest CSIRO/BoM paper implies widespread rain decrease in pastoral areas as more likely than increase (Kimberley excluded). In current projections for the State as a whole the spatial prospects of beneficially wetter change are significantly less than for drying.
Rising temperatures that have implications for all agricultural crops via potentially large changes in heat or chill accumulation and the frequency of temperature extremes. A

Impacts on Agriculture
Resource Economics Unit Water futures for Western Australia 2008‐2030. Volume 4: Accounting for climate change in water demand scenarios. Department of Water, Perth Page 19
potential benefit for grain and horticulture crops would be the reduced risk of frost. However, conversely more hot days during grain or fruit filling could reduce yields.
An expected decline in the rate of spread of salinity under a drier, more evaporative climate.
Increased demands on farm water storage and irrigation water. These resources will be affected by changes in temperatures and the incidence of rainfall. Combined with higher evaporation rates, it is likely that farm and regional water storage capacity will need to be increased.
Maintaining environmental water flows and providing water for irrigation farming may become increasingly difficult in some regions.
More frequent extreme weather events (e.g. consecutive days of extreme heat, extreme thunderstorms) will affect rural and urban communities and potentially cause additional crop and stock losses. Not sure about thunderstorms in terms of frequency. South Western Australia is anomalous in rainfall extremes
The risk from insect pest and weed competition will probably change. Higher temperatures are favourable to many insects, though their ultimate activity will be dependent on any changes to summer rainfall. A warmer climate might also favour many plant diseases.
Native species with restricted climatic ranges or limited mobility face the possibility of extinction in some rural regions.
However, as many of the effects of global warming on agriculture are gradual, it is expected that incremental technological improvement and plant breeding improvements will lessen the severity of many of the impacts for agriculture. Appropriate farming systems are likely to be able to emerge gradually in response to climate change. This interpretation might warrant more qualification at the margins
The following sections provide an interpretation of the implications of the Stern, ABARE and Kingwell studies for agriculture in the study Demand Regions.
4.5.1 Wheat-Sheep Zone The most directly-applicable results from ABARE in the Water Demand Scenario Modeling Study are those that relate to the wheat-sheep zone, namely the Pallinup, Upper Great Southern, Moore, Greenough and Midland Demand Regions. Here, in the absence of any countervailing technical change, the productivity impacts of climate change on the cereals, sheep and beef industries are likely to be correlated with production declines, and associated reductions in regional populations and economic activity relative to the reference case.
Climate change seems likely to negatively affect northern and eastern parts of wheat belt, and particularly areas that currently experience 350mm or less rainfall at present (Kingwell, 2007). These thresholds of marginality are likely to move southwards and westwards as global warming progresses. Thus, agriculture in much of the Greenough and Midland Demand regions seems likely to face yield reductions of between 10% and 50%. In contrast to this, adverse impacts on yields in the dryland agricultural areas lying between the 350mm and 600mmm isohyets seem less certain (Kingwell, 2007). It is tacitly understood that in the highest rainfall areas of this region that there may have been benefits from changes seen so far, certainly when combined with the benefits of modern crop varieties and drill seeding.

Impacts on Agriculture
Resource Economics Unit Water futures for Western Australia 2008‐2030. Volume 4: Accounting for climate change in water demand scenarios. Department of Water, Perth Page 20
In terms of farm incomes, and associated levels of regional economic activity, a counter-veiling factor will be that the generally depressed physical productivity in cereals and beef production globally would tend to increase the prices received by producers.
Kingwell’s (2007) suggestion that climate change is likely to increase demands on farm water storage is highly relevant in this region. This would imply that the downward effect on farm production and productivity would be to some degree offset by an upward trend in unit water use. In the wheat belt, this use is generally un-licensed.
4.5.2 The South West The South West climatic region includes Preston, Vasse, and Blackwood Demand regions, which contain a large area of intensive production of beef, milk, horticultural products and grapes, on both rain fed and irrigated land.
To the extent that water availability for irrigation in temperate Australia is likely to be correlated with rainfall trends, there would be likely to be increasing incentive for irrigators to improve irrigation efficiency, and this would tend to offset declines in bulk water supply availability to irrigation areas. Direct water requirements for irrigation of pasture are also likely to increase as a result of increased temperature and evaporation, and this would reinforce the incentive to achieve irrigation system improvements. It is also likely that water will become more freely traded in future, with more examples of transfers from agricultural production into higher-value uses, or from low-marginal value uses such as pasture irrigation into higher-marginal value uses such as horticulture. (Resource Economics Unit, 2007).
4.5.3 Kimberley Region The Kimberley Climate Region covers the West and East Kimberley Demand Regions. By far the largest water use is in the Ord River Scheme in the East Kimberley, where sugar cane is the prime crop. The region also supports an extensive pastoral industry producing beef. The region has experienced increased monsoonal activity in recent decades and some associated cooling. This circumstance may be influenced by Asian aerosols and may also be a manifestation of regional rainfall variability. Climate scenarios for global warming are ambivalent for rainfall in this region, but whilst the Asian aerosols persist the mid-term probabilities favour the status quo. In the longer term, the effects of global warming will be a more dominant influence on outcomes for this region and warming is expected. However, the long term rainfall projections show no clear trends at this stage of investigation.
According to ABARE (2007) sugar output in Brazil is expected to expand under a climate change scenario, relative to the reference case, given a projected increasing comparative advantage for Brazilian sugar production. Sugar production in India and ASEAN countries (particularly Thailand) is projected to be most adversely affected by climate change. Given the generally more favourable observed rainfall and temperature trends and projections for at least the next few decades in the Kimberley it appears unlikely that water availability will be an issue for the sugar cane industry in the Kimberley regions. However, the international competitiveness of Australian sugar, including that from the Kimberley will remain an issue. More work is needed on potential market share of Kimberley sugar industry given the projected declines in productivity in Indian and ASEAN countries.

Minerals & Energy Industries
Resource Economics Unit Water futures for Western Australia 2008‐2030. Volume 4: Accounting for climate change in water demand scenarios. Department of Water, Perth Page 21
5. MINERALS AND ENERGY INDUSTRIES
We are not aware of any assessment of climate change impacts on international trade in the minerals and energy sectors that might affect growth prospects for these industries in Western Australia. Much has been written about the carbon-intensity of China’s and India’s rapid build-up of infrastructure, and how clean coal technology might help to abate future carbon emissions from the steel industry in those countries. However, there is little to suggest that the rates of economic growth and infrastructure investment in those countries will be slowed as a result of climate initiatives. Thus, no-one has argued that demand for Western Australian minerals or energy from the ferrous and non-ferrous metals industries of China, India and other countries will be affected in the foreseeable future.
Based on Stern (2006), ABARE assumed that in developed and developing countries economic activity will decline by 5 per cent and 10 per cent respectively by 2050, relative to what would otherwise be the case, as a result of potential changes in climate.
To put this in the context of the current study, arbitrarily-chosen growth rates with and without a 10 per cent reduction are due to climate change. The last column shows the reduction in growth factor over 22 years (the time period for the current study) for a 10 per cent reduction in the annual average growth rate. It is seen that for all initial growth rates the climate-adjusted growth factor for Year 22 is 4.5 per cent less than the original factor. Thus, as a broad indication, the maximum rate of impact considered in ABARE (2007) would suggest, ceteris paribus, an average 4.5 per cent downward variation in primary industry output and ergo water demand estimates at year 2030 as a result of economic activities responding to depressed global markets.
Table 5:Illustrative growth rates with and without climate change
Under a climate-dependent scenario such factors could be used to replace the growth rates assumed for the mining sector in the 1st MONASH-TERM run, with lower growth rates. Economic impacts on other sectors within the WA economy would then be generated through the economic model.
6. UNIT WATER USE
This Section summarises indicative conclusions about potential changes in the amount of water likely to be demanded per unit of activity in each user group. These changes can be used to modify the water use coefficients within the Water Demand Scenario Modelling Tool for climate-dependent projections.
Initial Growth Rate
(%/Yr)
Growth Factor by End Year (50
Years)
Growth factor after a 10%
reduction (50 Years)
Revised Growth Rate
(%/Yr)
Change in Growth Factor
by Year 22
1.0 1.64 1.48 0.79 -4.5% 2.0 2.69 2.42 1.79 -4.5% 3.0 4.38 3.94 2.78 -4.5% 4.0 7.11 6.40 3.78 -4.5%

Unit Water Use
Resource Economics Unit Water futures for Western Australia 2008‐2030. Volume 4: Accounting for climate change in water demand scenarios. Department of Water, Perth Page 22
6.1 Units of Activity We do not discuss here the absolute unit rates of use in the Base Year. These are set out in Technical Paper No 4. The units that have been used within the Water Demand Scenario Modelling study are as follows:
Irrigated agriculture Areas irrigated, value added, employment Dryland agriculture Value added, employment, number of
livestock Fishing, Forestry Value added, employment Mining Value added, employment Manufacturing and
Processing Industry Value added, employment
Service Industries Value added, employment Civic uses Value added, employment Households Population
6.2 Principal Climate Change Factors Rising temperatures and diminution of rainfall inputs will push water demands higher in most regions. These changes in-turn will increase demand for efficiencies and substitutions in regional water use. The net effect on unit water demand will vary between classes of use. This area of demand adjustment is a primary input in use of the demand tool. There is not much available basis for predictive modeling and a sensitivity approach may be needed.
Regulatory measures will develop further to add structural pressure to market forcing of water efficiencies. Examples would be changes to urban form and appliance design or even prohibition of some usage. The Demand Tool will allow the Department to explore alternative regulatory scenarios.
The principal climate change factors that may affect future unit water use are as follows:
Rainfall (declining in most regions, possibly increasing in the Kimberley). This is generally likely to increase unit water demands.
Rising temperatures and evapotranspiration (ET): while they are to be expected everywhere, these are likely to be particularly severe in the Murchison, Pilbara and Kimberley regions. The effect seems likely to increase unit water demands.
Drought conditions of increasing frequency. The effect is likely to be to increase demands for surface water storage capacity
It is not considered likely that cyclones will increase in frequency, though they may increase in intensity. They have not been considered as a major influence on water demand. Similarly flooding has not been viewed as a major influence on water demand.
6.3 Summary of Unit Demand Influences Our preliminary assessments of potential climate-induced shifts in unit demand for water, in each climate region, are given in Annex A. The potential effects may be summarised as follows:
Irrigated agriculture
Unit demands generally increase in response to higher temperatures and ET, and in response to declining rainfall in

Unit Water Use
Resource Economics Unit Water futures for Western Australia 2008‐2030. Volume 4: Accounting for climate change in water demand scenarios. Department of Water, Perth Page 23
areas where irrigation is supplementary. Dryland
agriculture Unit demands for stock water purposes increase
Fishing Possible small effects from rising temperature and ET in processing activities
Forestry No change in unit demands Mining Small increases in unit demands for wash down, dust
suppression etc Manufacturing
and Processing Industry
Significant increase where water is used for cooling. Small increases for water-intensive process activities.
Service Industries
Some indoor cooling/humidifying processes e.g. sprays, may have higher unit use; landscaped areas will have increased irrigation demand, wash down, dust suppression uses in construction or transport could require higher unit use.
Civic uses Ovals, golf courses, bowling greens, parks, gardens etc may require higher unit rates of irrigation unless layout or irrigation systems are modified
Households Garden irrigation requirements could increase unless counteracted by water conservation practices; there could be small increases in in-house use for showers etc in homes that lack air conditioning.
7. GREENHOUSE POLICY-INDUCED CHANGES
7.1 Overview
Carbon Trading is a market based mechanism for helping mitigate the increase of CO2 in the atmosphere. Carbon trading markets are developed that bring buyers and sellers of carbon credits together with standardised rules of trade. Any entity, typically a business, that emits CO2 to the atmosphere may have an interest or may be required by law to balance their emissions through mechanism of C sequestration. Similarly, business entities that reduce their carbon emissions may be able to sell their reductions to other emitters. Entities that manage forest or agricultural land might sell carbon credits based on the accumulation of carbon in their forest trees or agricultural soils.
7.2 Agriculture In Australia, the agriculture sector accounted for just under 60 per cent of total methane emissions, 84 per cent of total nitrous oxide emissions and 17 per cent of overall greenhouse gas emissions in 2005. Adaptive responses in the agricultural industries will therefore be important for maintaining productivity growth and international competitiveness in response to climate change impacts and new policy environments. The agriculture sector may generate offsets through a range of agricultural management practices, including stubble retention, grazing management and conservation or

Effects of Greenhouse Policies
Resource Economics Unit Water futures for Western Australia 2008‐2030. Volume 4: Accounting for climate change in water demand scenarios. Department of Water, Perth Page 24
minimum tillage practices, in order to build up carbon stocks in agricultural soils (M Keogh, 2007). There are still large gaps in scientific and technical knowledge of soil carbon. For example, the capacity of Australian soils to sequester carbon for an extended period is still unknown. A robust soil carbon accounting methodology will need to be developed before the development of an appropriate system for recognising carbon stored in soils is considered.
The implications for trends in agricultural water use with respect to carbon trading follow principally from constraints that might be placed on agricultural activity to limit greenhouse emissions. Modelling in WA has suggested that, because of their methane production, ruminants would soon leave the optimum solution for farm plans under carbon constraints (Kingwell, 2007). This would impact on the demand for stock water.
7.3 Forestry Reduced land clearing and expansion of forestry areas are important for reducing growth in Australia’s greenhouse gas emissions and increasing terrestrial carbon sequestration. There is evidence to suggest that the marginal cost of abatement through carbon sequestration, particularly in forestry, may be comparable to other abatement options such as fuel switching or energy efficiency (Stavins and Richards 2005). This sector therefore has a considerable opportunity for early involvement as a provider of offsets.
Changes of land use from agriculture to forestry may, however, lead to higher use of water. For example, it has been estimated that a change in land use from pine plantations to native Banksia sp woodlands would produce a net increase of 200mm/yr in recharge to the superficial aquifer. The use of groundwater by plantation forests is an unlicensed use.
Carbon offsets may be generated by expanding forestry areas (new forests plus regrowth of old forests), revegetating farmland (regeneration of native trees and shrubs) and protecting existing native trees and shrubs. About 70 per cent of forest plantations are located on private and leasehold land in Australia, and while plantations make up only around 1 per cent of the forest estate, plantations expanded by an average of 70 000 hectares a year nationally between 1995 and 2005 (BRS 2007). Present arrangements for recognising the carbon sequestered in above ground sinks such as forest plantations require the carbon stock to be maintained for a period of a hundred years (GGAS 2007). However, assuming no change in existing policy measures, the sequestration of carbon in the forestry sector is expected to decrease to about 39 Mt CO2-eq by 2020 (table 2), a reduction of 25 per cent compared with 2005 (AGO 2006b).
The cost of achieving a given carbon offset, particularly in the forestry sector, is likely to be influenced by a range of factors. These include biophysical factors, such as tree species, forestry practices, geographic location, and carbon yield patterns. Other factors that could influence the efficiency of carbon sequestration in the forestry sector include the opportunity cost of land, availability of water, forest management practices, the disposal of forest products and related biomass, and the policy instruments used to achieve carbon sequestration. The amount of carbon that can be sequestered in forests is influenced by region and tree species. In Australia, forestry sequestration potentials range from about 23.6 tonnes of carbon dioxide per hectare a year in tall, dense eucalypt forests that are less than ten years old to about 0.7 tonnes of carbon dioxide per hectare a year in mature, medium density forests (NGGIC 2006).
ABARE has produced a map of areas in Australia that are prospective for increased carbon sequestration from forestry. The Western Australian sections of that map are reproduced below as Figure 3. It is seen that the area deemed to be the most prospective (but still obtaining only a

Effects of Greenhouse Policies
Resource Economics Unit Water futures for Western Australia 2008‐2030. Volume 4: Accounting for climate change in water demand scenarios. Department of Water, Perth Page 25
“Medium” rating) is in the Vasse and Blackwood Demand Regions, with “Medium-Low” or “Low” ratings elsewhere in the South West and in the Kimberley.
Figure 3: Carbon sequestration potential for forestry in WA
(after ABARE, 2007) Legend:
(a) Northern Half
(b) Southern Half
High Medium High Medium Medium Low Low No Data/Not Applicable

Effects of Greenhouse Policies
Resource Economics Unit Water futures for Western Australia 2008‐2030. Volume 4: Accounting for climate change in water demand scenarios. Department of Water, Perth Page 26
7.4 WA Treasury Modelling The Western Australian Department of Treasury and Finance has undertaken a preliminary analysis of the potential impacts on the Western Australian economy of an emissions reduction strategy (Layman, 2008). Model scenarios were developed for reductions in Western Australian emissions of between 35% (Scenario 1) and 45% (Scenario 2) relative to the levels projected for the year 2030. The reductions would broadly keep the level of emissions at 2003 levels (which appears to imply that it relates more to a global A1B type compromise scenario rather than to aspirations for avoiding dangerous change through a B1 type scenario ).
These imposed reductions in emissions would lead to a reduction of 1.3% to 1.4% in WA Gross State Product in the year 2030. Impacts on individual industry sectors, shown in Table 6, would be much more marked.
Table 6: Potential impacts on WA industries of alternative scenarios for reductions in emissions
Change Relative to Projected Level in 2030 (%) Industry
Scenario 1 Scenario 2 Agriculture -4 -6 Forestry 143 351 Mining 1 1 Coal -2 -45 Gas 3 6 Manufacturing 0 -2 Electricity -14 -14 Other Utilities 0 -2 Transport -3 -3 Construction -2 -2 Services -1 -1
Source: Layman (2008)
Both scenarios indicate a major expansion of Forestry for production of carbon offsets. There is also a significant impact on Electricity production under both scenarios. The more ambitious emissions reduction scenario requires a substantial reduction in output of the Coal industry and a significant increase in the output of Gas. There are relatively small impacts on other sectors. Net gains are projected for output from the Mining sector. Conversely, Manufacturing, Utilities, Transport, Construction and Services all decline from between 1% to 3% relative to the base case. It is important to remember that these projected changes are estimated for alternative emissions reduction strategies. They do not take account of wider climate change impacts: e.g. on international markets for WA products resulting from global GDP effects.
8. GROWTH SCENARIOS AND UNIT WATER USE UNDER EXPECTED CLIMATE CHANGE
The following table prescribes a set of assumptions that could be used in compiling a climate-sensitive projection of water demand in WA, using the Water Demand Scenario Modeling Tool, and drawing on the literature review and our interpretation of the implications for individual usage sectors with each of the 19 Demand regions.

Suggested Assumptions for the Climate Change Scenario
Resource Economics Unit Water futures for Western Australia 2008‐2030. Volume 4: Accounting for climate change in water demand scenarios. Department of Water, Perth Page 27
Table 7: Compilation of a climate-sensitive MONASH-TERM run to the year 2030
SECTOR Suggested adjustments to value added growth rates
Suggested adjustments to unit water use coefficients
Agriculture Forestry & Fishing 1 Grain & Livestock Steady decline relative to initial
growth rates in all wheat belt regions with the sharpest declines being in Midlands and Greenough (productivity forced)
Steadily increasing
2 Beef Cattle Unchanged growth rates to 2020, with decline thereafter in Peel, Preston, Vasse and Blackwood plus all wheat belt regions. Unchanged growth rates in the Kimberleys (Productivity forced)
Steadily increasing
3 Dairy Cattle Growth to 2020, decline thereafter notably in Preston
Steadily increasing
4 Pigs Change generated by model Steadily increasing 5 Poultry Change generated by model Steadily increasing
6 Cotton Change generated by model Steadily increasing
7 Grapes Change generated by model Steadily increasing
8 Vegetables Change generated by model Steadily increasing 9 Other
Horticulture Change generated by model Steadily increasing
10 Sugar Cane Could go either way: a pessimistic case would be for negative growth after 2020
Steadily increasing
11 Other Agriculture & Services
Change generated by model Steadily increasing
12 Forestry Increased growth in Vasse and Blackwood (Incentives forced)
Static
13 Fishing No change (may be some productivity forced decline through effects of ocean warming and acidification)
Static
Mining and Energy
14 Coal Possible shutting down of the industry (policy forced)
Static
15 Oil Gas No change Static 16 Iron Ores 4.5% reduction in 2030 (Changed
export growth rates) Static
17 Other Metal Ores 4.5% reduction in 2030 (Changed export growth rates)
Static
18 Other Mining 4.5% reduction in 2030 (Changed export growth rates)
Static

Suggested Assumptions for the Climate Change Scenario
Resource Economics Unit Water futures for Western Australia 2008‐2030. Volume 4: Accounting for climate change in water demand scenarios. Department of Water, Perth Page 28
Manufacturing 19 Meat Products Change generated by model Small increases 20 Dairy Products Change generated by model Small increases 21 Fruit & Vegetables Change generated by model Small increases 22 Other Food &
Tobacco Change generated by model Small increases
23 Beverages Change generated by model Small increases 24 Textiles, Clothing &
Footwear Change generated by model Small increases
25 Sawmill Products Change generated by model Small increases 26 Other Wood
Products Change generated by model Small increases
27 Pulp, Paper & Printing
Change generated by model Small increases
28 Petroleum & Coal Products
Change generated by model Small increases
29 Chemicals Change generated by model Moderate increase for cooling demand
30 Non-Metalic Mineral Products
Reduce output by 4.5% in 2030 Small increases
31 Iron & Steel Change generated by model Moderate increase (cooling demand)
32 Basic Non-ferrous Metal products
Reduce output by 4.5% in 2030 Moderate increase (cooling demand)
33 Metal Products Change generated by model Small increases 34 Transport Equipment Change generated by model Small increases 35 Photographic &
Electronic Equipment Change generated by model Small increases
36 Other Equipment Change generated by model Small increases 37 Other Manufacturing Change generated by model Small increases

Suggested Assumptions for the Climate Change Scenario
Resource Economics Unit Water futures for Western Australia 2008‐2030. Volume 4: Accounting for climate change in water demand scenarios. Department of Water, Perth Page 29
Service Industries
38 Electricity & Gas Change generated by model Moderate increase for cooling demand)
39 Water, Sewerage & Drainage
Change generated by model Moderate increase for system evaporative losses, primarily in irrigation systems
40 Construction Change generated by model Static 41 Wholesale Trade Change generated by model Static 42 Retail Trade Change generated by model Static 43 Mechanical & Other
Repairs Change generated by model Static
44 Hotels, Restaurants & Cafes
Change generated by model Moderate increase for landscaping demands
45 Transport & Communication
Change generated by model Static
46 Finance, Business & Property Services
Change generated by model Static
47 Ownership of Dwellings
Change generated by model Sector is not used
48 Government Administration & Defence
Change generated by model Static
49 Education Change generated by model Moderate increase for landscaping demands
50 Health Change generated by model Static 51 Welfare Services Change generated by model Static 52 Entertainment &
Leisure (incl civic uses) Change generated by model Moderate increase for
landscaping demands (large increase if there is no change to landscaping)
53 Personal & other Services
Change generated by model Static

Suggested Assumptions for the Climate Change Scenario
Resource Economics Unit Water futures for Western Australia 2008‐2030. Volume 4: Accounting for climate change in water demand scenarios. Department of Water, Perth Page 30
Additional categories
54 Population (Household usage from public supply)
Change generated by model Increased unit water use coefficient in the absence of successful water conservation initiatives
55 Licensed Domestic and Stock Water
Linked to growth rates in relevant agricultural industries
Increase unit water use coefficients (defensive water harvesting to counteract climate change impacts on productivity in all except the Kimberley regions
56 Environmental Allocation
No change (will be entered directly following the current review of allocation limits)
57 Use Not Specified in WRL
No change (treated as a function of growth across all other sectors).
58 Licensed Rural Domestic Usage
Increase unit water use coefficients (defensive water harvesting to counteract climate change impacts on productivity in all except the Kimberley regions)
59 Unlicensed Use Increased use in both metropolitan and rural areas (defensive water harvesting to counteract climate change impacts

References
Resource Economics Unit Water futures for Western Australia 2008‐2030. Volume 4: Accounting for climate change in water demand scenarios. Department of Water, Perth Page 31
9. REFERENCES
ABARE (2007) Climate change impacts on Australian agriculture. In: Australian Commodities Dec Qtr 2007. Australian Bureau of Agricultural and Resource Economics, Canberra. Cline, W. (2007) Global Warming and Agriculture: Impact Estimates by Country, Center for Global Development and Peterson Institute for International Economics, Washington DC (www.cgdev.org/content/publications/detail/14090#Chpt).
Crimp, S.J., Flood, N.R., Carter, J.O., Conroy, J.P. and McKeon G.M. (2002) Evaluation of the Potential Impacts of Climate Change on Native Pasture Production – Implications for livestock Carrying Capacity, Report to the Australian Greenhouse Office, Canberra.
Ecofys B.V. (2006) Agriculture and Forestry Sectoral Report, for the European Climate Change Programme Working Group II Impacts and Adaptation, Brussels, (http:// ec.europa.eu/environment/climat/pdf/eccp/impactsadaptation/agriforestry.pdf).
Garnaut, R. (2007) Will climate change bring an end to the platinum age? Paper presented at the inaugural S.T. Lee Lecture on Asia and the Pacific, Australian National University, 29 November (www.garnautreview.org.au/CA25734E0016A131/WebObj/ GarnautPublicLectureANU29November2007/$File/Garnaut%20Public%20Lecture%20ANU%2029%20November%202007.pdf).
Heyhoe, E., Kim, Y., Kokic, P., Levantis, C., Ahammad, H., Schneider, K., Crimp, S., Flood, N. and Carter, J. (2007) ‘Adapting to climate change’, Australian Commodities, Vol. 14, No. 1, March quarter, pp. 167–78.
Preston, B.L. and Jones, R.N. (2006) Climate Change Impacts on Australia and the Benefits of Early Action to Reduce Global Greenhouse Gas Emissions, Consultancy report for the Australian Business Roundtable on Climate Change, CSIRO, Canberra, February (www.csiro.au/fi les/fi les/p6fy.pdf). Resource Economics Unit (2007) Inquiry into competition in the water and wastewater services sector: water trading issues. Discussion Paper prepared for the Economic Regulation Authority of Western Australia, Perth (www.era.wa.gov.au). Sadler, B. S. (2008) Climate Change Scenarios affecting the Water Supply/Demand Balance in Western Australia (Draft). Development of a Water Demand Scenario Modeling Tool for Western Australia Technical Paper No 6. Department of Water, Perth Stern, N. (2006) The Economics of Climate Change: The Stern Review HM Treasury, Cambridge University Press, London (www.hm-treasury.gov.uk/Independent_ Reviews/stern_review_economics_climate_change/sternreview_index.cfm).

Resource Economics Unit Water futures for Western Australia 2008‐2030. Volume 4: Accounting for climate change in water demand scenarios. Department of Water, Perth Page 32
ANNEX A: DETAILED ASSESSMENT OF POTENTIAL CLIMATE CHANGE IMPACTS BY USER SECTOR AND CLIMATE REGION
Important Note: The usage quantities given in this Annex were those available at an early stage in the study, and have been changed in the Final Report. However, they have been left in this document in order to give a broad impression of scale against each assessment.
For background see ‐ Climate Change Scenarios affecting the Water Supply/Demand Balance in Western Australia (Draft) Part 1 – Report and State Overview Part 2 – Regional Scenarios

Resource Economics Unit Water futures for Western Australia 2008‐2030. Volume 4: Accounting for climate change in water demand scenarios. Department of Water, Perth Page 33
THE REGIONS
The map below shows regions as defined for development of hydroclimatic scenarios (Sadler ed., 2008). These boundaries allow simple correspondence to the more geographically detailed Demand Regions of this study.
Boundary Definition: The regional boundaries used for this report are hybrid boundaries, with the Natural Resources Management Regions as their prime source. Northern Agricultural, Avon, Swan, South West and South Coast regions are NRM regions. The other regions are sub-divisions of the NRM Rangelands Region. The Rangelands Region sub-division has followed boundaries used in defining the DoW Demand Regions. However, the East and West Pilbara separation has been moved eastwards to roughly differentiate the Pilbara rivers from the desert zone.
Two prime means by which climate change is seen to affect future (and present) water demand in WA are :

Resource Economics Unit Water futures for Western Australia 2008‐2030. Volume 4: Accounting for climate change in water demand scenarios. Department of Water, Perth Page 34
Effect of climate on unit consumption
Structural effects such as
• changes in growth driven by climate induced changes in the global economy (global GDP),
• changes in comparative economic competitiveness and opportunity consequent on climate change
• changes in regional economic and social infrastructure driven by climate • changes in productive feasibility (eg crop or farming style) caused by
crossing of climate thresholds The draft worksheets below have made some first pass judgements on how these might develop over the next two decades for seven component sub-divisions of the total regional water demand in WA.
The nature of these potential impacts, together with judgements on their likely scale and the confidence underlying these judgements are presented for each of the 11 regions in the Demand Worksheets. Also tabulated is the current annual use in GL for each component of use in each region.
The magnitude of annual use in the 7 components and 11 regions varies greatly and clearly the greatest potential water impact will come from significant changes at the higher end of use.
The most readily identified impacts are changes in unit demand (Effect 1.) and (Effect 2. i) implicit change in regional growth responding to changes in Global GDP( potentially projected via the Monash Model). Other structural changes (2. ii, 2. iii, 2. iv) are more difficult to identify and poorly researched at this stage of climate change knowledge.
Of these potential changes recognised in the work sheets the following tables present a simple analysis enabling a first judgement of the potential scale of impact on each component of use for each region and some appreciation of the confidence of that assessment. The analysis considers both (1.) unit consumption impacts and (2.) Structural impacts.
Because the State is warming and (except perhaps for the Kimberley) drying, the effects on (1.) unit consumption are almost always expected as an increase (of differing scales from low to high). The presently identified structural change potentialities are mostly 2.(i) GDP driven and are generally for some lowering through reduction of business as usual growth.
The following summary tables serve three purposes:
• They present a means for quick inspection of the regions and use components which are most likely to affect the State's water balance

Resource Economics Unit Water futures for Western Australia 2008‐2030. Volume 4: Accounting for climate change in water demand scenarios. Department of Water, Perth Page 35
• They present a quick inspection assessment of the components of climate driven demand most warranting further investigation
• They provide a side-by-side view of the first-pass judgements for various
demand components across the regions and thereby show up possible inconsistencies for quality checking and review.

Resource Economics Unit Water futures for Western Australia 2008‐2030. Volume 4: Accounting for climate change in water demand scenarios. Department of Water, Perth Page 36

Resource Economics Unit Water futures for Western Australia 2008‐2030. Volume 4: Accounting for climate change in water demand scenarios. Department of Water, Perth Page 37

Resource Economics Unit Water futures for Western Australia 2008‐2030. Volume 4: Accounting for climate change in water demand scenarios. Department of Water, Perth Page 38
1. South West Region
1. South West Region - Climate Change driven trends in Water Demand
Impacted Demand Component
Current Use (GL) Nature of Impact Potential
Scale Confidence
Unit Demand ex Climate Change: depends (i) on the future crop mix: e.g. grapes lower water use, vegetables higher than existing pasture-based activities (covered by MONASH projections); (ii) reductions in irrigation water supply system losses due to channel replacement in the Collie Irrigation District. Future growth of irrigation water use may be constrained by water availability, but not land availability.
Moderate High
Unit Demand With Climate Change: all uses (including channel delivery systems) will have increasing unit demands due to higher temperatures and ET
Moderate High
Ex-Climate Structural Change: Steady tendency for change of land use from pasture irrigation to higher-value crops. Market pressure for transfer of water to urban/industrial uses with or without improved irrigation efficiency.
Moderate to High High
With Climate Structural Change: International competitiveness of the beef and dairy industries likely to decline. If water remains available for irrigation it will help to sustain these industries despite climate change, as productivity loss will then be less than that in dryland areas.
Moderate Moderate
Irrigation Demand 228
The area is prospective for forestry initiatives in response to carbon credit incentives, and this could increase evapotranspirational demands on groundwater (currently unlicensed water use), depending on the pre-existing land use
Moderate Moderate to High
Unit Demand ex Climate Change: assume constant per capita water use Zero Moderate
Unit Demand with Climate Change: moderate increase as a result of increasing temperatures and ET
Low Moderate
Ex-Climate Structural Change: continuing tendency for higher residential densities
Low to moderate High
Town Water Supply 55
With Climate Structural Change: there will be some reinforcement of trends in housing styles Moderate High
Industrial Demand 16 Unit Demand ex Climate Change : there will continuing attempts to make industrial processes more water efficient.
Low High

Resource Economics Unit Water futures for Western Australia 2008‐2030. Volume 4: Accounting for climate change in water demand scenarios. Department of Water, Perth Page 39
Unit Demand with Climate Change: a small increase due to increased cooling requirements
Moderate High
Ex-Climate Structural Change: growth as projected by MONASH model Moderate High
With Climate Structural Change: no change Zero High
Unit Demand ex Climate Change: no change Zero High
Unit Demand with Climate Change: not very sensitive Low High
Ex-Climate Structural Change: minor change: coal mining at Collie continues to grow; mineral sands mining continues to grow
Moderate Moderate
Mining Demand work site and process 63
With Climate Structural Change: not very sensitive. It is not clear whether a possible slow-down in global economic growth will translate into slower growth prospects for mining in this region.
Low High
Unit Demand ex Climate Change: efficiency drivers will dominate Moderate High
Unit Demand with Climate Change: small climate effect Moderate High
Ex-Climate Structural Change: continued growth of service industries in the region
High High
Commercial Demand 16
With Climate Structural Change: No major effect Low High
Unit Demand ex Climate Change : big efficiency drive (e.g. sporting facilities, parks and gardens, other landscaping)
Moderate to High High
Unit Demand with Climate Change: increasing temperature and ET will increase the water demands of turfs
Moderate High
Ex-Climate Structural Change: leisure activities are income-elastic and grow in response to regional economic growth
High High
Self Supply Demand Including Civic
23
With Climate Structural Change: possible switch away from outdoor to indoor activities
Low to moderate Moderate

Resource Economics Unit Water futures for Western Australia 2008‐2030. Volume 4: Accounting for climate change in water demand scenarios. Department of Water, Perth Page 40
2. Swan Region
Impacted Demand Component
Current Use (GL) Nature of Impact Potential
Scale Confidence
Unit Demand ex Climate Change: assume constant, as potential gains in irrigation efficiency are moderate for the current crop mix.
Unit Demand With Climate Change: all uses will have increasing unit demands due to higher temperatures and ET.
Moderate High
Ex-Climate Structural Change: MONASH model suggests substantial growth in water demand for vegetables and other horticulture, and lower for grapes. However, the growth of irrigation water use will be constrained by the availability of and land and water. There will be market pressure for transfer of land and water to urban/industrial or environmental uses with or without improved irrigation efficiency.
High High Irrigation Demand
93
With Climate Structural Change: None of the current irrigation activities seems likely to be much affected by international shifts in comparative advantage. However, the need to maintain environmental values in the face of changed temperatures and ET will further constrain allocation limits for irrigation use.
Low High
Unit Demand ex Climate Change: the Water Corporation has a target of keeping per capita use at 155kl/head, versus 170kl/head.
Moderate Moderate
Unit Demand with Climate Change: some increase as a result of increasing temperatures and ET
Moderate High
Ex-Climate Structural Change: there will be a continuing tendency for smaller block sizes in Perth. Housing styles will continue to change, with less ex-house water use but greater in-house use.
Low to Moderate High
Town Water Supply Demand including mine towns and camps
233
With Climate Structural Change: there will be some reinforcement of trends in housing styles. Moderate High
Unit Demand ex Climate Change : there will continuing attempts to make industrial processes more water efficient.
Low High
Unit Demand with Climate Change: a small increase due to increased cooling requirements
Low High
Industrial Demand 127
Ex-Climate Structural Change: continued growth of the sector due to both heavy industry (coastal strip), food processing and servicing functions
Moderate High

Resource Economics Unit Water futures for Western Australia 2008‐2030. Volume 4: Accounting for climate change in water demand scenarios. Department of Water, Perth Page 41
With Climate Structural Change: small incremental effect Low High
Unit Demand ex Climate Change: no change Low High
Unit Demand with Climate Change: not very sensitive Low High
Ex-Climate Structural Change: minor change Low High
Mining Demand work site and process 5
With Climate Structural Change: not very sensitive. It is not clear whether a possible slow-down in global economic growth will translate into slower growth prospects for mining in this region.
Low High
Unit Demand ex Climate Change: efficiency drivers will dominate Low High
Unit Demand with Climate Change: increasing temperatures and ET will push up irrigation use in this sector, especially in the area landscaped areas around offices, tertiary education facilities etc. Counteracting this, there will be a major efficiency drive.
Moderate
High
Ex-Climate Structural Change: continued growth of service industries in the region
Moderate High
Commercial Demand 176
With Climate Structural Change: No major water demand impacts. Low High
Unit Demand ex Climate Change : major growth sector, counteracted by big efficiency drive (e.g. household bore usage, sporting facilities, parks and gardens, other landscaping)
Moderate to High
High
Unit Demand with Climate Change: increasing temperature and ET will increase the water demands of household bores, parks, playing fields, gardens etc.
Moderate to High
High
Ex-Climate Structural Change: leisure activities are income-elastic and grow strongly in response to regional demographic and economic growth
Moderate to high
High
Self Supply Demand Including Civic 252
With Climate Structural Change: possible switch away from outdoor to indoor activities Moderate
High
Unit Demand ex Climate Change :There will be a substantial increase in environmental water allocations in response to past rates of daw down of superficial aquifers
High High Environmental Provisions/ Releases 4
With Climate Structural Change: There will be a significant increase in environmental allocations, or constraints imposed on licensed usage under new Statutory Water Management Plans
High High

Resource Economics Unit Water futures for Western Australia 2008‐2030. Volume 4: Accounting for climate change in water demand scenarios. Department of Water, Perth Page 42

Resource Economics Unit Water futures for Western Australia 2008‐2030. Volume 4: Accounting for climate change in water demand scenarios. Department of Water, Perth Page 43
3. South Coast Region
Impacted Demand Component
Current Use (GL) Nature of Impact Potential
Scale Confidence
Unit Demand ex Climate Change: little change Low Moderate to High
Unit Demand With Climate Change: minimal impact Low Moderate to High
Ex-Climate Structural Change: minimal change Low Moderate to High
Irrigation Demand 6
With Climate Structural Change: potential increase in plantation forestry schemes
Low Moderate to High
Unit Demand ex Climate Change: assume constant per capita water use
Zero Moderate to High
Unit Demand with Climate Change: minor increase as a result of slightly increasing temperatures and ET
Low Moderate
Ex-Climate Structural Change: there will be less of a tendency for smaller block sizes than will occur in Perth.
Low Moderate
Town Water Supply Demand including mine towns and camps
8
With Climate Structural Change: little effect Low Moderate to High
Unit Demand ex Climate Change : little change Very Low High
Unit Demand with Climate Change: no effect Very Low High
Ex-Climate Structural Change: minor Very Low High
Industrial Demand 2
With Climate Structural Change: Minimal effect Very Low High
Unit Demand ex Climate Change : little change Zero High Mining Demand
work site and process 14
Unit Demand with Climate Change: not very sensitive Very Low High

Resource Economics Unit Water futures for Western Australia 2008‐2030. Volume 4: Accounting for climate change in water demand scenarios. Department of Water, Perth Page 44
Ex-Climate Structural Change: Some small initiatives may come to fruition
Very Low High
With Climate Structural Change: No discernible effect Very Low High
Unit Demand ex Climate Change : assume zero change Zero High
Unit Demand with Climate Change: no effect Very Low High
Ex-Climate Structural Change: Steady growth Very Low High
Commercial Demand 4
With Climate Structural Change: no effect Very Low High
Unit Demand ex Climate Change : assume zero change Zero High
Unit Demand with Climate Change: little effect Very Low High
Ex-Climate Structural Change: growth in irrigation and pasture activities
Very Low Low to Moderate
Self Supply Demand Including Civic
10
With Climate Structural Change: little effect Very Low Low to Moderate

Resource Economics Unit Water futures for Western Australia 2008‐2030. Volume 4: Accounting for climate change in water demand scenarios. Department of Water, Perth Page 45
4. Avon Region
Impacted Demand
Component Current
Use (GL) Nature of Impact Potential Scale Confidence
Unit Demand ex Climate Change: Not Significant Not Significant
Unit Demand With Climate Change: Not Significant Not Significant
Ex-Climate Structural Change: Not Significant Not Significant
Irrigation Demand 0
With Climate Structural Change Not Significant Not Significant
Unit Demand ex Climate Change: static Zero Moderate
Unit Demand with Climate Change: increase as a result of increasing temperatures and ET Low
Moderate
Ex-Climate Structural Change: MONASH model predicts moderate population growth.
Low Moderate
Town Water Supply Demand including mine towns and camps
8
With Climate Structural Change: accelerated decline in rural towns in the eastern part of the region, resulting from climate-induced reductions in farm output and productivity
Moderate Moderate
Unit Demand ex Climate Change : static Not significant High
Unit Demand with Climate Change: small increase for cooling purposes Low High
Ex-Climate Structural Change: moderate growth of industrial activity Low Moderate
Industrial Demand 3
With Climate Structural Change: there could be a small negative impact due to flow-on effects from climate impacts on the farm sector.
Low Moderate
Unit Demand ex Climate Change: static
Low Moderate Mining
Demand work site and process
13
Unit Demand with Climate Change: not significant Zero
Moderate
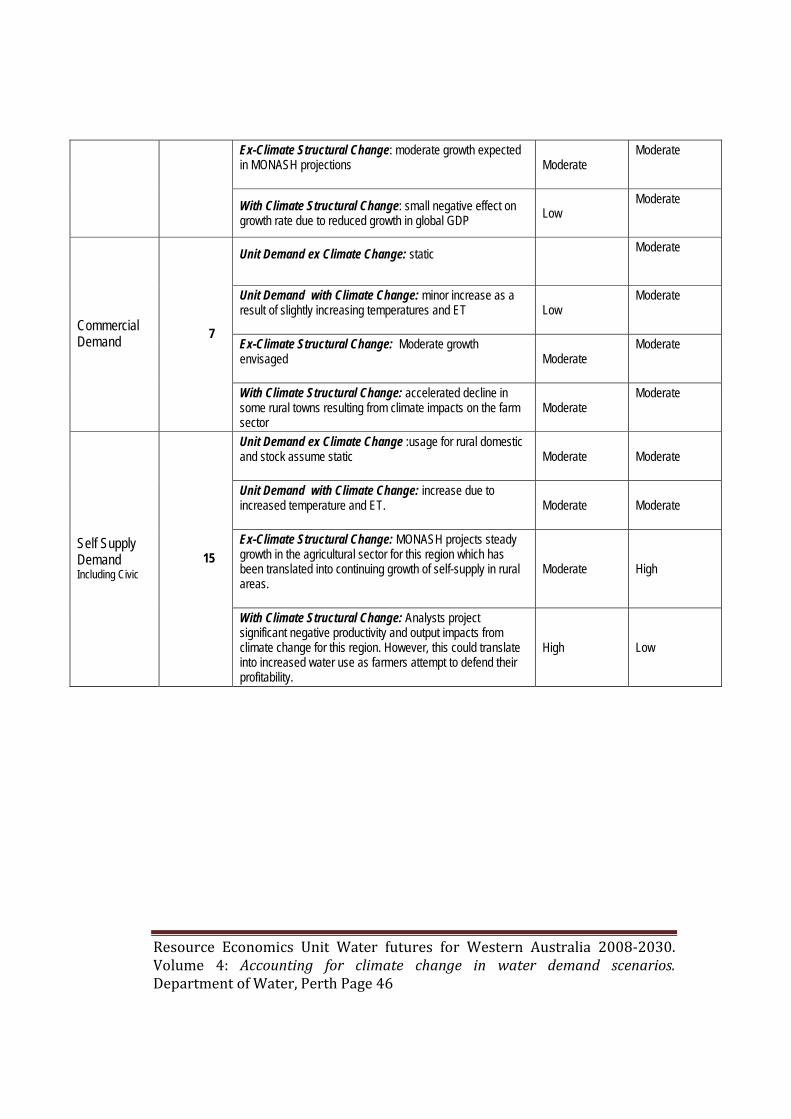
Resource Economics Unit Water futures for Western Australia 2008‐2030. Volume 4: Accounting for climate change in water demand scenarios. Department of Water, Perth Page 46
Ex-Climate Structural Change: moderate growth expected in MONASH projections
Moderate Moderate
With Climate Structural Change: small negative effect on growth rate due to reduced growth in global GDP Low
Moderate
Unit Demand ex Climate Change: static
Moderate
Unit Demand with Climate Change: minor increase as a result of slightly increasing temperatures and ET
Low Moderate
Ex-Climate Structural Change: Moderate growth envisaged
Moderate Moderate
Commercial Demand 7
With Climate Structural Change: accelerated decline in some rural towns resulting from climate impacts on the farm sector
Moderate Moderate
Unit Demand ex Climate Change :usage for rural domestic and stock assume static
Moderate Moderate
Unit Demand with Climate Change: increase due to increased temperature and ET.
Moderate Moderate
Ex-Climate Structural Change: MONASH projects steady growth in the agricultural sector for this region which has been translated into continuing growth of self-supply in rural areas.
Moderate High
Self Supply Demand Including Civic
15
With Climate Structural Change: Analysts project significant negative productivity and output impacts from climate change for this region. However, this could translate into increased water use as farmers attempt to defend their profitability.
High Low

Resource Economics Unit Water futures for Western Australia 2008‐2030. Volume 4: Accounting for climate change in water demand scenarios. Department of Water, Perth Page 47
5. Northern Agricultural Region
Impacted Demand
Component Current Use (GL) Nature of Impact Potential
Scale Confidence
Unit Demand ex Climate Change: assume static Zero Moderate
Unit Demand With Climate Change: increased demand due to higher temperatures and ET
Substantial effect High
Ex-Climate Structural Change: product mix generally stable
Substantial growth
Moderate to High
Irrigation Demand
152
With Climate Structural Change: no discernible effect on mix of irrigated products
Low Moderate
Unit Demand ex Climate Change: static Zero Moderate
Unit Demand with Climate Change: increase as a result of increasing temperatures and ET Low
Moderate
Ex-Climate Structural Change: MONASH model predicts moderate population growth.
Low Moderate
Town Water Supply Demand including mine towns and camps
13
With Climate Structural Change: accelerated decline in rural towns in the eastern part of the region, resulting from climate-induced reductions in farm output and productivity
Moderate Moderate
Unit Demand ex Climate Change : static
Not significant High
Unit Demand with Climate Change: small increase for cooling purposes Low High
Ex-Climate Structural Change: moderate growth of industrial activity Low Moderate
Industrial Demand 3
With Climate Structural Change: there could be a small negative impact due to flow-on effects from climate impacts on the farm sector.
Low Moderate

Resource Economics Unit Water futures for Western Australia 2008‐2030. Volume 4: Accounting for climate change in water demand scenarios. Department of Water, Perth Page 48
Unit Demand ex Climate Change: assume static Zero
Moderate
Unit Demand with Climate Change: minor impact Moderate
Moderate
Ex-Climate Structural Change: there are a number of mining projects that could be developed in this region, that could increase usage beyond the existing healthy growth rate
Low Moderate
Mining Demand work site and process
48
With Climate Structural Change: small negative effect on growth rate due to reduced growth in global GDP Low
Moderate
Unit Demand ex Climate Change: static Zero
Moderate
Unit Demand with Climate Change: minor increase as a result of slightly increasing temperatures and ET
Low Moderate
Ex-Climate Structural Change: Moderate growth envisaged Moderate
Moderate Commercial Demand 10
With Climate Structural Change: accelerated decline in some rural towns resulting from climate impacts on the farm sector Moderate
Moderate
Self Supply Demand Including Civic
15 Unit Demand ex Climate Change :usage for rural domestic and stock assume static
Moderate Moderate
Unit Demand with Climate Change: increase due to increased temperature and ET.
Moderate Moderate
Ex-Climate Structural Change: MONASH projects steady growth in the agricultural sector for this region which has been translated into continuing growth of self-supply in rural areas.
Moderate High
With Climate Structural Change: Analysts project significant negative productivity and output impacts from climate change for this region. However, this could translate into increased water use as farmers attempt to defend their profitability.
High Low

Resource Economics Unit Water futures for Western Australia 2008‐2030. Volume 4: Accounting for climate change in water demand scenarios. Department of Water, Perth Page 49
6. Goldfields Region
Impacted Demand
Component Current Use (GL) Nature of Impact Potential
Scale Confidence
Unit Demand ex Climate Change: Zero High
Unit Demand With Climate Change: Zero High
Ex-Climate Structural Change: Zero High
Irrigation Demand 0
With Climate Structural Change: Zero High
Unit Demand ex Climate Change: Assume static Low Moderate
Unit Demand with Climate Change: Low Moderate
Ex-Climate Structural Change: Steady but moderate growth in the mining sector leading to continued growth in demand
Town Water Supply Demand including mine towns and camps
4
With Climate Structural Change: Possibility of a small reduction in growth rate in response to slower growth in global GDP and the mining sector
Unit Demand ex Climate Change: Assume static Zero Moderate
Unit Demand with Climate Change: Slight increase for cooling purposes
Low Moderate
Ex-Climate Structural Change: No major changes assumed Low Moderate
Industrial Demand 4
With Climate Structural Change: Possibility of slightly slower growth Low Moderate
Mining Demand 210 Unit Demand ex Climate Change: Assume static
Zero Moderate

Resource Economics Unit Water futures for Western Australia 2008‐2030. Volume 4: Accounting for climate change in water demand scenarios. Department of Water, Perth Page 50
Unit Demand with Climate Change: Higher unit demand for wash-down etc purposes due to raised temperatures and ET
Low to Moderate Moderate
Ex-Climate Structural Change: Steady but moderate growth of the mining sector in this region
Significant Moderate to High
work site and process
With Climate Structural Change: Possibility of a slight reduction in growth rate due to reductions in global GDP Moderate Moderate
Unit Demand ex Climate Change: Assume static Zero Moderate
Unit Demand with Climate Change: Higher unit demand for irrigation purposes on commercial sites due to raised temperatures and ET
Low to Moderate Moderate
Ex-Climate Structural Change: Steady but moderate growth of the mining sector in this region will boost growth in the sector
Significant Moderate to High
Commercial Demand 10
With Climate Structural Change: Possibility of a slight reduction in flow-on effect of mining due to reductions in global GDP Moderate Moderate
Unit Demand ex Climate Change : Assume static Zero Moderate
Unit Demand with Climate Change: Higher unit demand for domestic and stock and some irrigation purposes due to raised temperatures and ET
Low Moderate to High
Ex-Climate Structural Change: Relatively static. Zero Moderate
Self Supply Demand Including Civic
2
With Climate Structural Change: Probable reduction in demand for domestic and stock purposes Low Moderate to
High

Resource Economics Unit Water futures for Western Australia 2008‐2030. Volume 4: Accounting for climate change in water demand scenarios. Department of Water, Perth Page 51
7. Murchison Region
Impacted Demand
Component Current Use (GL) Nature of Impact Potential
Scale Confidence
Unit Demand ex Climate Change: Assume static Zero High
Unit Demand With Climate Change: Increased due to higher temperatures and ET
Moderate High
Ex-Climate Structural Change: Moderate growth Moderate High
Irrigation Demand 3
With Climate Structural Change: Growth rate reduced Moderate High
Unit Demand ex Climate Change: Assume static Low Moderate
Unit Demand with Climate Change: Increased due to higher temperatures and ET
Low Moderate
Ex-Climate Structural Change: Steady but moderate growth in the mining sector will lead to continued growth in demand
Town Water Supply Demand including mine towns and camps
1
With Climate Structural Change: Possibility of a small reduction in growth rate in response to slower growth in global GDP and the mining sector
Unit Demand ex Climate Change: Assume static Zero Moderate
Unit Demand with Climate Change: Slight increase for cooling purposes
Low Moderate
Ex-Climate Structural Change: No major changes assumed Low Moderate
Industrial Demand 0
With Climate Structural Change: Possibility of slightly slower growth Low Moderate
Mining Demand 90 Unit Demand ex Climate Change: Assume static
Zero Moderate

Resource Economics Unit Water futures for Western Australia 2008‐2030. Volume 4: Accounting for climate change in water demand scenarios. Department of Water, Perth Page 52
Unit Demand with Climate Change: Higher unit demand for wash-down etc purposes due to raised temperatures and ET
Low to Moderate Moderate
Ex-Climate Structural Change: Steady but moderate growth of the mining sector in this region
Significant Moderate to High
work site and process
With Climate Structural Change: Possibility of a slight reduction in growth rate due to reductions in global GDP Moderate Moderate
Unit Demand ex Climate Change: Assume static Zero Moderate
Unit Demand with Climate Change: Higher unit demand for irrigation purposes on commercial sites due to raised temperatures and ET
Low to Moderate Moderate
Ex-Climate Structural Change: Steady but moderate growth of the mining sector in this region will boost growth in the sector
Significant Moderate to High
Commercial Demand 1
With Climate Structural Change: Possibility of a slight reduction in flow-on effect of mining due to reductions in global GDP Moderate Moderate
Unit Demand ex Climate Change : Assume static Zero Moderate
Unit Demand with Climate Change: Higher unit demand for domestic and stock and some irrigation purposes due to raised temperatures and ET
Low Moderate to High
Ex-Climate Structural Change: Relatively static. Zero Moderate
Self Supply Demand Including Civic
3
With Climate Structural Change: Probable reduction in demand for domestic and stock purposes Low Moderate to
High

Resource Economics Unit Water futures for Western Australia 2008‐2030. Volume 4: Accounting for climate change in water demand scenarios. Department of Water, Perth Page 53
8. Gascoyne Region
Impacted Demand
Component Current Use (GL) Nature of Impact Potential Scale Confidence
Unit Demand ex Climate Change: Assume static Zero High
Unit Demand With Climate Change: Increased due to higher temperatures and ET
Moderate to High Moderate
Ex-Climate Structural Change: Moderate growth Moderate High
Irrigation Demand 19
With Climate Structural Change: Little effect Low Moderate
Unit Demand ex Climate Change: Assume static Zero High
Unit Demand with Climate Change: Increased due to higher temperatures and ET
Low Moderate
Ex-Climate Structural Change: Steady but moderate growth Low Moderate
Town Water Supply Demand including mine towns and camps
5
With Climate Structural Change: Little effect Low Moderate
Unit Demand ex Climate Change: Assume static Zero Moderate
Unit Demand with Climate Change: Slight increase for cooling purposes
Low Moderate
Unit Demand ex Climate Change: Assume static Zero High
Industrial Demand 1
Unit Demand With Climate Change: Increased due to higher temperatures and ET
Low Moderate
Mining Demand 3 Unit Demand ex Climate Change: Assume static
Zero Moderate

Resource Economics Unit Water futures for Western Australia 2008‐2030. Volume 4: Accounting for climate change in water demand scenarios. Department of Water, Perth Page 54
Unit Demand with Climate Change: Higher unit demand for wash-down etc purposes due to raised temperatures and ET
Low to Moderate Moderate
Ex-Climate Structural Change: Steady but moderate growth of the mining sector in this region
Low Moderate to High
work site and process
With Climate Structural Change: Possibility of a slight reduction in growth rate due to reductions in global GDP Low Moderate
Unit Demand ex Climate Change: Assume static Zero Moderate
Unit Demand with Climate Change: Higher unit demand for irrigation purposes on commercial sites due to raised temperatures and ET
Moderate Moderate
Ex-Climate Structural Change: Steady but moderate growth Moderate Moderate
Commercial Demand 5
With Climate Structural Change: Little effect Moderate Moderate
Unit Demand ex Climate Change : Assume static Zero Moderate
Unit Demand with Climate Change: Higher unit demand for domestic and stock and some irrigation purposes due to raised temperatures and ET
Low Moderate to High
Ex-Climate Structural Change: Steady but moderate growth Low Moderate
Self Supply Demand Including
Civic 4
With Climate Structural Change: Little effect Low Moderate

Resource Economics Unit Water futures for Western Australia 2008‐2030. Volume 4: Accounting for climate change in water demand scenarios. Department of Water, Perth Page 55
9. West Pilbara Region
Impacted Demand
Component
Current Use (GL)
Nature of Impact Potential Scale Confidence
Unit Demand ex Climate Change: Not significant
Unit Demand With Climate Change:
Not significant
Ex-Climate Structural Change:
Not significant
Irrigation Demand 0
With Climate Structural Change:
Not significant
Unit Demand ex Climate Change: Zero Moderate
Unit Demand with Climate Change:
Moderate to High
Moderate to High
Ex-Climate Structural Change: Assumed that the gas-related economy of this region will grow substantially
Moderate Moderate
Town Water Supply Demand including mine towns and camps
4
With Climate Structural Change: Possibility of a slight reduction in growth rate due to reductions in global GDP
Moderate Moderate
Unit Demand ex Climate Change: Assume static Moderate Moderate
Unit Demand with Climate Change: Higher temperatures and ET will increase cooling requirements
Moderate Higfh
Industrial Demand 3
Ex-Climate Structural Change: Little change in economic structure is projected. However, there is always the possibility that large energy-related major projects will diversify the economic base in the region. If they proceed they would rely on sea water desalination for their water supplies.
Moderate Moderate

Resource Economics Unit Water futures for Western Australia 2008‐2030. Volume 4: Accounting for climate change in water demand scenarios. Department of Water, Perth Page 56
With Climate Structural Change: Possibility of a slight reduction in growth rate due to reductions in global GDP Low Moderate
Unit Demand ex Climate Change: Assume static Zero Moderate
Unit Demand with Climate Change: Higher temperatures and ET will increase cooling and wash-down requirements
Low to Moderate Moderate
Ex-Climate Structural Change: Substantial growth of the gas industry
Moderate to High
Moderate to High
Mining Demand work site
and process including
gas facilities
89
With Climate Structural Change: Possibility of a slight reduction in growth rate due to reductions in global GDP Moderate Moderate
Unit Demand ex Climate Change: Assume static Zero Moderate
Unit Demand with Climate Change: Higher unit demand for irrigation purposes on commercial sites due to raised temperatures and ET
Moderate Moderate
Ex-Climate Structural Change: Sector grows as flow-on from the mining and energy sector
Moderate Moderate
Commercial Demand 6
With Climate Structural Change: Little effect Moderate Moderate
Unit Demand ex Climate Change: Assume static Zero Moderate
Unit Demand with Climate Change: Higher unit demand for domestic and stock purposes due to raised temperatures and ET
Low Moderate
Ex-Climate Structural Change: Sector grows as flow-on from the mining and energy sector
Moderate Moderate
Self Supply Demand Including
Civic 3
With Climate Structural Change: Little effect Moderate Moderate

Resource Economics Unit Water futures for Western Australia 2008‐2030. Volume 4: Accounting for climate change in water demand scenarios. Department of Water, Perth Page 57
10. East Pilbara Region
Impacted Demand
Component Current Use (GL) Nature of Impact Potential
Scale Confidence
Unit Demand ex Climate Change:
Not significant
Unit Demand With Climate Change:
Not significant
Ex-Climate Structural Change:
Not significant
Irrigation Demand 0
With Climate Structural Change:
Not significant
Unit Demand ex Climate Change: Zero Moderate
Unit Demand with Climate Change: Substantial increases in temperature will increase unit demands
Low Moderate to High
Ex-Climate Structural Change: Assumed that the iron ore-related economy of this region will grow substantially, with flow-on to town water requirements
Moderate Moderate to High
Town Water Supply
Demand including
mine towns and camps
3
With Climate Structural Change: Possibility of a slight reduction in growth rate due to reductions in global GDP
Moderate Moderate
Unit Demand ex Climate Change: Assume static Moderate Moderate
Unit Demand with Climate Change: Higher temperatures and ET will increase cooling requirements
Moderate High
Ex-Climate Structural Change: Little change Low Moderate
Industrial Demand 1
With Climate Structural Change: Possibility of a slight reduction in growth rate due to reductions in global GDP Low Moderate

Resource Economics Unit Water futures for Western Australia 2008‐2030. Volume 4: Accounting for climate change in water demand scenarios. Department of Water, Perth Page 58
Unit Demand ex Climate Change: Assume static Zero Moderate
Unit Demand with Climate Change: Higher temperatures and ET will increase wash-down requirements
Moderate to High
Moderate to High
Ex-Climate Structural Change: Substantial growth of the iron ore
Moderate to High
Moderate to High
Mining Demand work site
and process 177
With Climate Structural Change: Possibility of a slight reduction in growth rate due to reductions in global GDP Moderate Moderate
Unit Demand ex Climate Change: Assume static Zero Moderate
Unit Demand with Climate Change: Higher unit demand for irrigation purposes on commercial sites due to substantially raised temperatures and ET
Moderate Moderate
Ex-Climate Structural Change: Sector grows as flow-on from the mining and energy sector
Moderate Moderate
Commercial Demand 6
With Climate Structural Change: Little effect Moderate Moderate
Unit Demand ex Climate Change: Assume static Zero Moderate
Unit Demand with Climate Change: Higher unit demand for domestic and stock purposes due to raised temperatures and ET. Low Moderate
Ex-Climate Structural Change: Sector grows as flow-on from the mining and energy sector
Moderate Moderate
Self Supply Demand Including
Civic 3
With Climate Structural Change: Effect could be negative for water requirement Low Moderate

Resource Economics Unit Water futures for Western Australia 2008‐2030. Volume 4: Accounting for climate change in water demand scenarios. Department of Water, Perth Page 59
11. Kimberley Region
Impacted Demand
Component
Current Use (GL)
Nature of Impact Potential Scale Confidence
Unit Demand ex Climate Change: Assume static Zero
Unit Demand With Climate Change: Potentially reduced with higher rainfall, but depends on seasonality
Low
Ex-Climate Structural Change: Assumed that the sugar industry will continue to grow at a moderate rate.
Moderate to High
Low to Moderate
Irrigation Demand 356
With Climate Structural Change: Continuing changes in international comparative advantage in favour of Brazil are expected to result from climate change, but India’s and ASEAN countries’ production is expected to decline. Implications for Kimberley production still not clear.
Moderate to High
Low to Moderate
Unit Demand ex Climate Change: Assume static Zero
Unit Demand with Climate Change: Little effect Low Moderate
Ex-Climate Structural Change: Growth of towns continues Low Moderate
Town Water Supply
Demand including
mine towns and camps
5
With Climate Structural Change: Little effect, except if tourism is adversely affected by increasing monsoonal activity.
Low Moderate
Unit Demand ex Climate Change: Assume static Low Moderate
Unit Demand with Climate Change: Little effect Low Moderate
Ex-Climate Structural Change: Minor growth Low Moderate
Industrial Demand 2
With Climate Structural Change: Little effect Low Moderate

Resource Economics Unit Water futures for Western Australia 2008‐2030. Volume 4: Accounting for climate change in water demand scenarios. Department of Water, Perth Page 60
Unit Demand ex Climate Change: Assume static Zero Moderate
Unit Demand with Climate Change: Little effect Low Moderate
Ex-Climate Structural Change: Minor growth Low Moderate
Mining Demand work site
and process 24
With Climate Structural Change: Little effect Low Moderate
Unit Demand ex Climate Change: Assume static Zero Moderate
Unit Demand with Climate Change: Little effect Low Moderate
Ex-Climate Structural Change: Minor growth Low Moderate
Commercial Demand 8
With Climate Structural Change: Little effect Low Moderate
Unit Demand ex Climate Change : Assume static Zero Moderate
Unit Demand with Climate Change: Little effect Low Moderate
Ex-Climate Structural Change: Same pattern continues Low Moderate
Self Supply Demand Including
Civic 17
With Climate Structural Change: Little effect Low Moderate