Water Analysis of Abbott Run, North Attleboro, MA · 2014 Water Analysis of Abbott Run, North...
46
Bridgewater State University Virtual Commons - Bridgewater State University Watershed Access Lab Projects Watershed Access Lab 2014 Water Analysis of Abbo Run, North Aleboro, MA is item is available as part of Virtual Commons, the open-access institutional repository of Bridgewater State University, Bridgewater, Massachuses. Recommended Citation North Aleborough High School, North Aleborough, Massachuses (2014). Water Analysis of Abbo Run, North Aleboro, MA. In Watershed Access Lab Projects. Project 146. Available at: hp://vc.bridgew.edu/wal_projects/146
Transcript of Water Analysis of Abbott Run, North Attleboro, MA · 2014 Water Analysis of Abbott Run, North...

Bridgewater State UniversityVirtual Commons - Bridgewater State University
Watershed Access Lab Projects Watershed Access Lab
2014
Water Analysis of Abbott Run, North Attleboro,MA
This item is available as part of Virtual Commons, the open-access institutional repository of Bridgewater State University, Bridgewater, Massachusetts.
Recommended CitationNorth Attleborough High School, North Attleborough, Massachusetts (2014). Water Analysis of Abbott Run, North Attleboro, MA. InWatershed Access Lab Projects. Project 146.Available at: http://vc.bridgew.edu/wal_projects/146

*

**The purpose of our study on the Abbott Run River was to compare it’s
data to that of a Class A river. We collected data such as pH, dissolved oxygen, temperature, benthic-macro invertebrate diversity, river flow, river depth, nitrates, and the river’s specific conductivity at two separate sites.
* It is important that Abbott Run is Class A water, as it is the source of drinking water for Pawtucket, RI. The MassDEP states that in order for a river to be used as drinking water, it must be classified as a “Class A” source. These standards state:
*The dissolved oxygen be no less than 6.0 mg/L unless background conditions are lower.
*The temperature shall not exceed 28.3 degrees Celsius in warm water.
*The pH shall be in the range of 6.5 through 8.3 standard units but not more than 0.5 units outside of the background range.
*The Fecal Coliform Bacteria shall not exceed an arithmetic mean of 20 organisms per 100 mL in and representative set of samples, nor shall 10% of the samples exceeds 100 organisms per 100 mL.

*

*

*
*Abbott Run is the primary water source for Pawtucket
and Cumberland, Rhode Island.
*During the Revolution, cannons were made here at a
factory named Iron Rust.
*Robin Hollow, one of Cumberland’s first manufacturing
plants, was built in the early 1800’s, on Abbott Run.
*At Shady Pines, site B, there had been a Girl Scout camp
there for forty years, beginning in 1940.
*In 2006, the construction of a new bridge began on
Abbott Run. The concrete used may have affected the
pH.

*

*
Site B
Site A

*

*
-1
-0.9
-0.8
-0.7
-0.6
-0.5
-0.4
-0.3
-0.2
-0.1
0
1 2 3 4 5 6 7 8 9 10 11 12
Depth
(Ft)
Segments-2 ft
2013 Depth
Average of 0.75 feet deep

*

Site A, Cushman Road
Looking downstream

*

*
-1.4
-1.2
-1
-0.8
-0.6
-0.4
-0.2
0
1 2 3 4 5 6 7 8 9 10
Depth
(Ft)
Segments-2 ft
2013 Depth
Average of 0.89 feet
deep

*
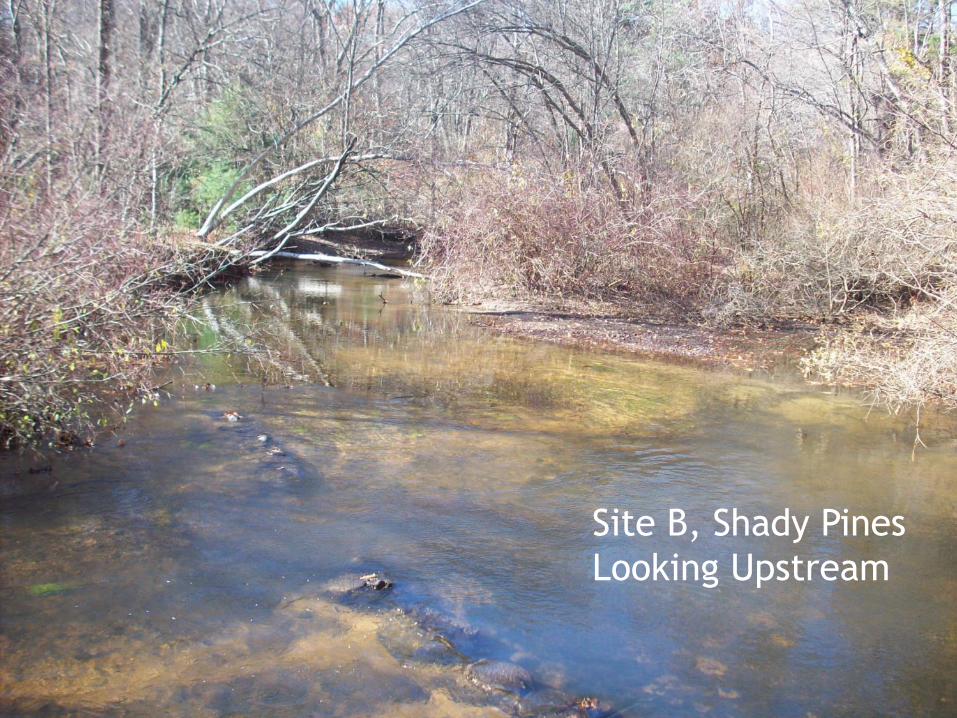
Site B, Shady Pines
Looking Upstream

*
*There was
only .01 inch
of rain within
the week.
0
0.002
0.004
0.006
0.008
0.01
0.012
24 25 26 27 28 29 30
Pre
cip
itati
on (
in)
Date
Seven Day Precipitation for North Attleboro, Oct. 24-30, 2013
Precipitation

Average Flow, Total Discharge, Average Stream Width, Average Depth, and Bottom
Composition of Site A, 10/30/13
Average
Flow Total
Discharge Average
Stream Width Average
Depth Bottom
Composition
1.35 ft/sec 22.53 CFS 23 feet 0.75 feet rocky
Average Flow, Total Discharge, Average Stream Width, Average Depth, and Bottom
Composition of Site B, 10/30/13
Average
Flow Total
Discharge Average
Stream Width Average
Depth Bottom
Composition
1.27 ft/sec 24.83 CFS 14 feet 0.89 feet sandy
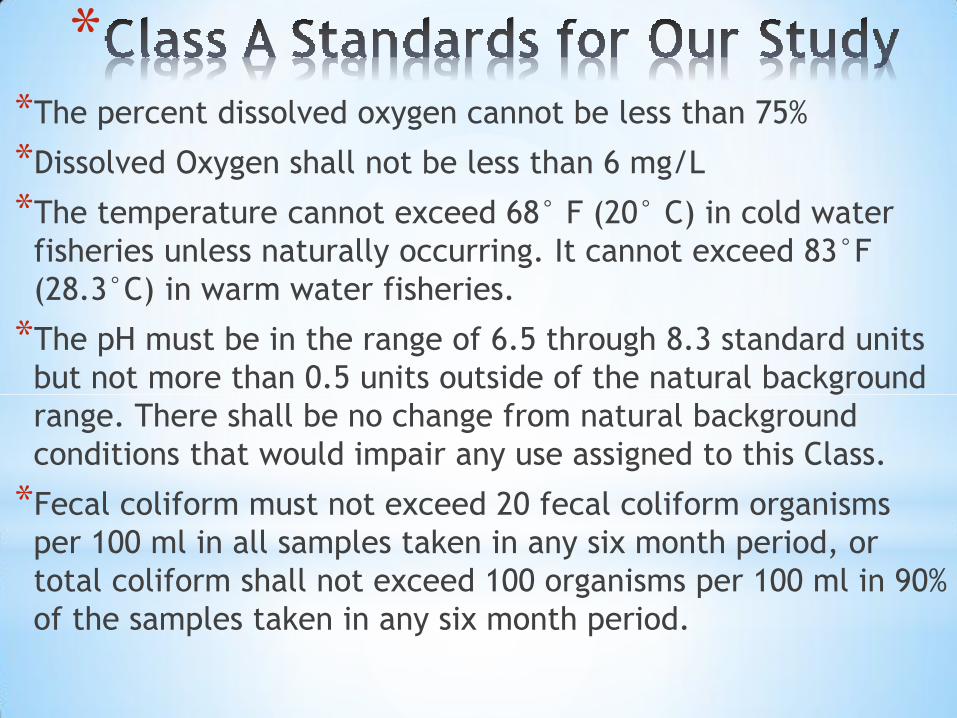
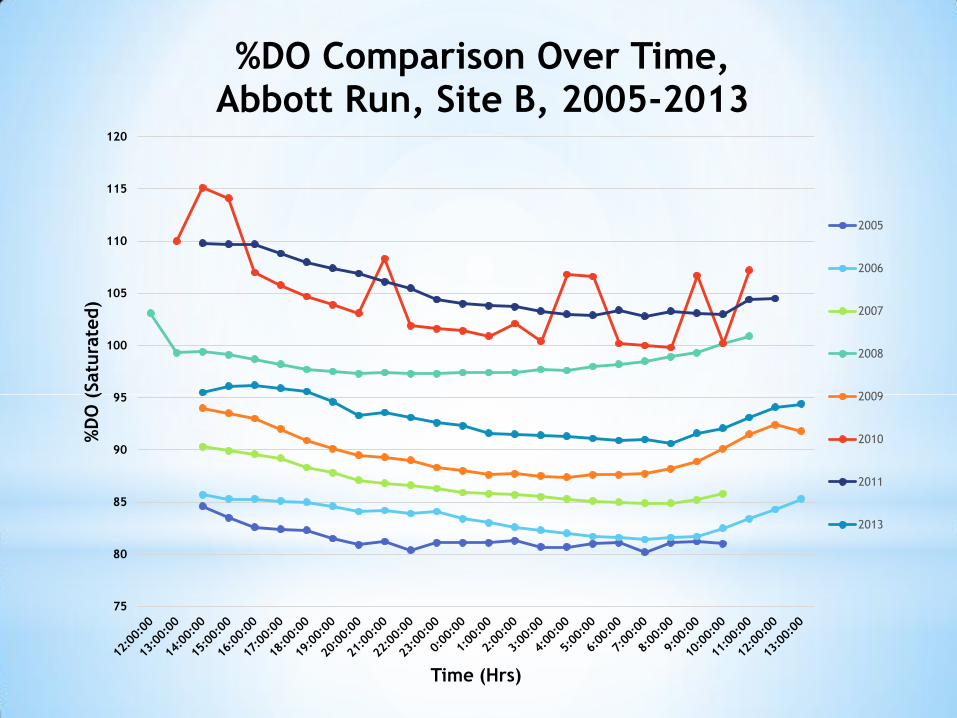
**The percent dissolved oxygen cannot be less than 75%
*Dissolved Oxygen shall not be less than 6 mg/L
*The temperature cannot exceed 68° F (20° C) in cold water
fisheries unless naturally occurring. It cannot exceed 83°F
(28.3°C) in warm water fisheries.
*The pH must be in the range of 6.5 through 8.3 standard units
but not more than 0.5 units outside of the natural background
range. There shall be no change from natural background
conditions that would impair any use assigned to this Class.
*Fecal coliform must not exceed 20 fecal coliform organisms
per 100 ml in all samples taken in any six month period, or
total coliform shall not exceed 100 organisms per 100 ml in 90%
of the samples taken in any six month period.

*
*The water in both Site A and B
did not show any fecal coliform
bacteria colonies. The water
was too cold at the time for any
colonies to grow.

6.7
6.75
6.8
6.85
6.9
6.95
7
7.05
pH
Time (hr)
pH Comparison, Abbott Run, Sites A & B 10/30/13-10/31/13
Site A
Site B

6
6.5
7
7.5
8
8.5
9
9.5
10
pH
Time (hrs)
pH Comparison Over Time, Abbott Run, Site A, 2005-2013
2005
2006
2007
2008
2009
2010
2011
2013
6
6.5
7
7.5
8
8.5
9
9.5
10
10.5
11
pH
Time (hrs)
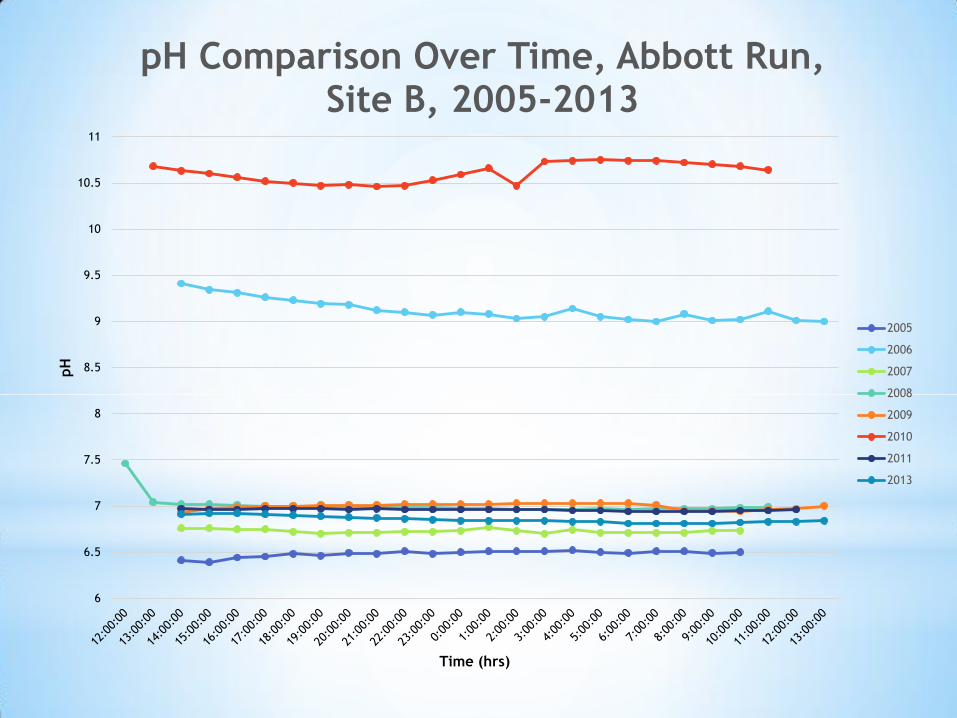
pH Comparison Over Time, Abbott Run, Site B, 2005-2013
2005
2006
2007
2008
2009
2010
2011
2013

10.2
10.4
10.6
10.8
11
11.2
11.4
11.6
11.8
DO
(m
g/L
)
Time (hours)
DO Comparison of Sites A & B of Abbott Run 10/30/13 - 10/31/13
Site A
Site B
Class A: Dissolved Oxygen shall not be less than six mg/l unless background conditions
are lower.

8
9
10
11
12
13
14
15
DO
(m
g/L
)
Time (Hrs)
DO Comparison Over Time, Abbott Run, Site A, 2005-2013
2005
2006
2007
2008
2009
2010
2011
2013
8
9
10
11
12
13
14
15
DO
(m
g/L
)
Time (Hrs)
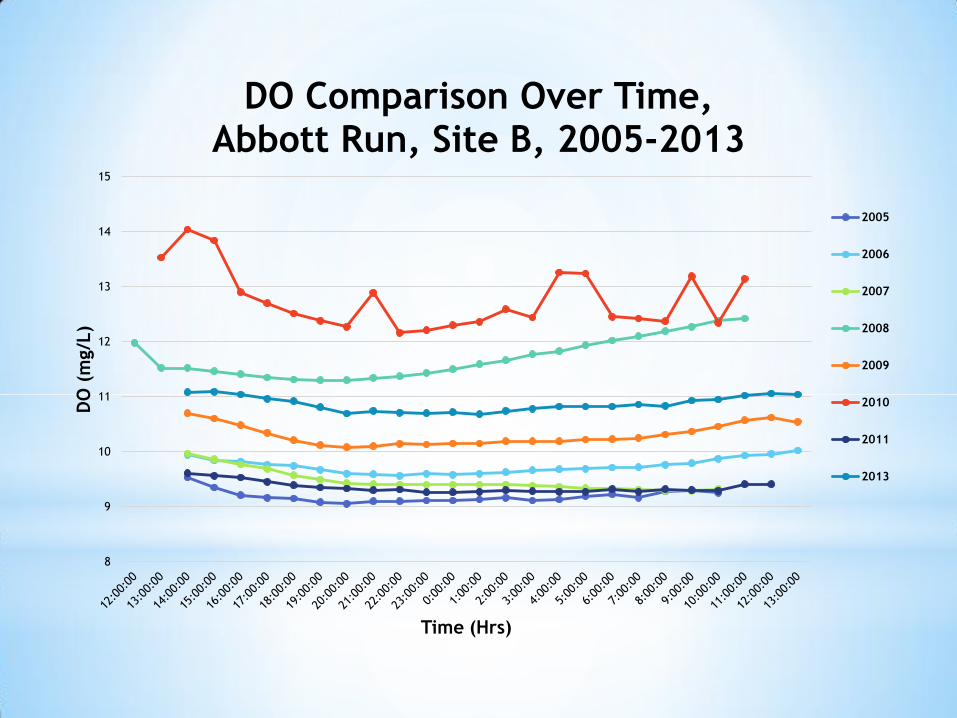
DO Comparison Over Time, Abbott Run, Site B, 2005-2013
2005
2006
2007
2008
2009
2010
2011
2013

6
6.5
7
7.5
8
8.5
9
9.5
10
Tem
pera
ture
(C
els
ius)
Time (hours)
Temperature Comparison of Sites A & B, Abbott Run,10/30-10/31/13
Site A
Site B
The temperature cannot not exceed 68° F (20° C) in cold water fisheries
unless naturally occurring. It cannot exceed 83°F (28.3°C) in warm water
fisheries.

6
7
8
9
10
11
12
13
14
Tem
pera
ture
(degre
es
Cels
ius)
Time (Hrs)
Temperature Comparison Over Time, Abbott Run, Site A, 2005-2013
2005
2006
2007
2008
2009
2010
2011
2013

6
7
8
9
10
11
12
13
14
Tem
pera
ture
(degre
es
Cels
ius)
Time (Hrs)
Temperature Comparison Over Time, Abbott Run, Site B,
2005-2013
2005
2006
2007
2008
2009
2010
2011
2013

90
92
94
96
98
100
% D
O (
Satu
rate
d)
Time (hr)
%DO Comparison, Abbott Run, Sites A & B, 10/30-10/31/13
Site A
Site B
Class A Standard: %DO not less than 75%

80
85
90
95
100
105
110
115
120
125
%D
O (
Satu
rate
d)
Time (Hrs)
%DO Comparison Over Time, Abbott Run, Site A, 2005-2013
2005
2006
2007
2008
2009
2010
2011
2013
75
80
85
90
95
100
105
110
115
120
%D
O (
Satu
rate
d)
Time (Hrs)
%DO Comparison Over Time, Abbott Run, Site B, 2005-2013
2005
2006
2007
2008
2009
2010
2011
2013

7
7.5
8
8.5
9
9.5
94
95
96
97
98
99
100
Tem
pera
ture
(D
egre
es
Cels
ius)
% D
O (
Satu
rate
d)
Time (Hours)
%DO and Temperature Comparison, Abbott Run, Site A 10/30-10/31/13
%DO Temp °C
7
7.5
8
8.5
9
9.5
10
90
91
92
93
94
95
96
97
Tem
pera
ture
(D
egre
es
Cels
ius)
%D
O (
Satu
rate
d)
Time (Hours)
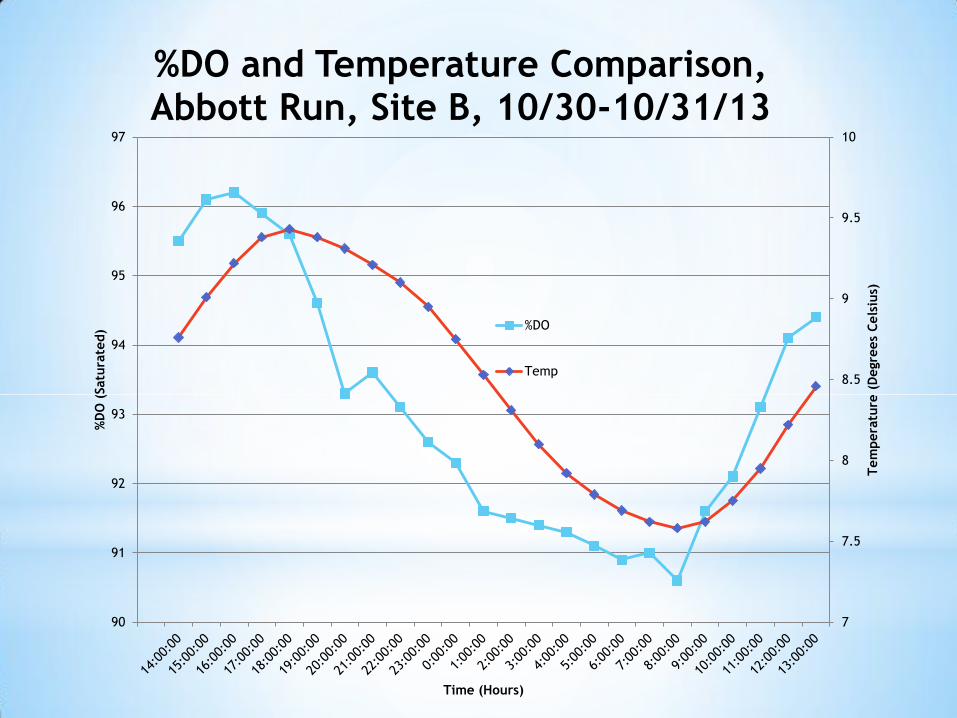
%DO and Temperature Comparison, Abbott Run, Site B, 10/30-10/31/13
%DO
Temp

191
191.5
192
192.5
193
193.5
194
194.5
µS/c
m
Time (hours)
Specific Conductivity Comparison, Abbott Run, Sites A & B, 10/30-10/31/13
Site A
Site B
“…natural conductivity level without human
influence would be around 50 µS/cm or less.
The levels in the 300 – 400 µS/cm range
indicate likely contamination from salt and
or wastewater.” –Doug Heath, EPA,
2005 email

120
130
140
150
160
170
180
190
200
210
220
12:0
0:0
0
13:0
0:0
0
14:0
0:0
0
15:0
0:0
0
16:0
0:0
0
17:0
0:0
0
18:0
0:0
0
19:0
0:0
0
20:0
0:0
0
21:0
0:0
0
22:0
0:0
0
23:0
0:0
0
0:0
0:0
0
1:0
0:0
0
2:0
0:0
0
3:0
0:0
0
4:0
0:0
0
5:0
0:0
0
6:0
0:0
0
7:0
0:0
0
8:0
0:0
0
9:0
0:0
0
10:0
0:0
0
11:0
0:0
0
12:0
0:0
0
13:0
0:0
0
µS/c
m
Time (Hours)
Specific Conductivity Comparison Over Time, Abbott Run, Site A, 2005-2013
2013
2011
2010
2009
2008
2007
2006
2005

120
130
140
150
160
170
180
190
200
210
220
µS/c
m
Time (hours)
Specific Conductivity Comparison Over Time, Abbott Run, Site B, 2005-2013
2013
2011
2010
2009
2008
2007
2006
2005
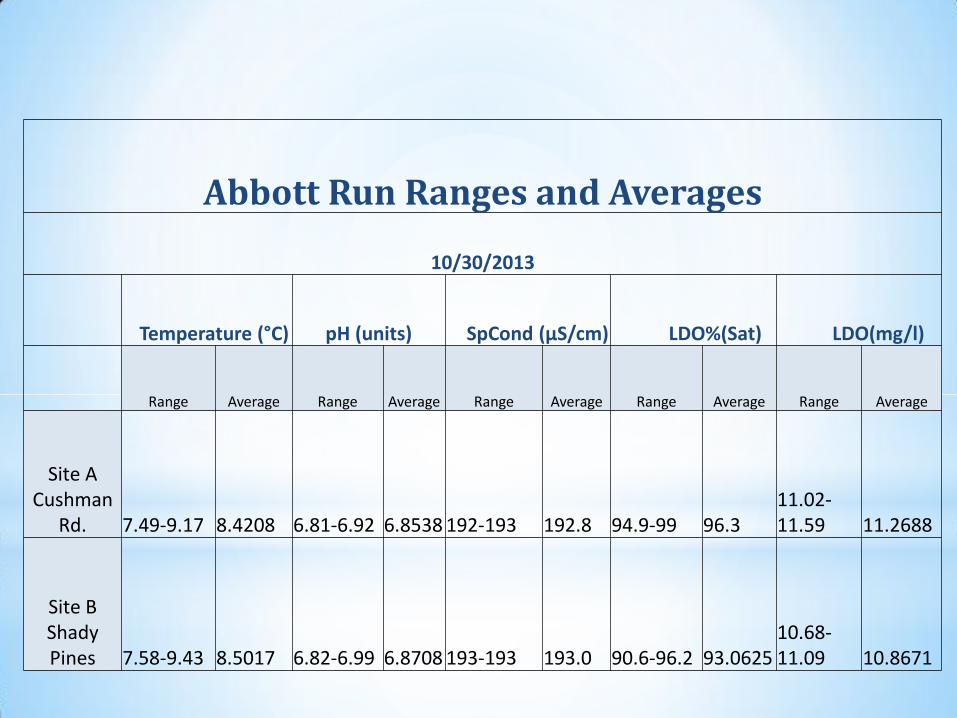
Abbott Run Ranges and Averages
10/30/2013
Temperature (°C) pH (units) SpCond (µS/cm) LDO%(Sat) LDO(mg/l)
Range Average Range Average Range Average Range Average Range Average
Site A Cushman
Rd. 7.49-9.17 8.4208 6.81-6.92 6.8538 192-193 192.8 94.9-99 96.3 11.02-11.59 11.2688
Site B Shady Pines 7.58-9.43 8.5017 6.82-6.99 6.8708 193-193 193.0 90.6-96.2 93.0625
10.68-11.09 10.8671

0
0.001
0.002
0.003
0.004
0.005
0.006
0.007
0.008
0.009
1 2 3 4 5 6 7 8 9 10 11 12
mg/L
Soluble Reactive Phosphorus per Liter,
Abbott Run, 10/30-10/31/13
Site A
Site B
DetectionLimit
Class A Water Standards: SRP less than .05 mg/L High Detection for P: 0.326 mg/L

0
0.05
0.1
0.15
0.2
0.25
0.3
0.35
1 2 3 4 5 6 7 8 9 10 11 12
mg/L
Nitrogen-Nitrate per Liter,
Abbott Run, 10/30-10/31/13
Site A
Site B
Detection Limit

176408.7
4410.2
19076.99
486.04 0
20000
40000
60000
80000
100000
120000
140000
160000
180000
200000
Site A Site B
Loads
(g/d
ay)
Nitrogen and SRP Loads, Abbott Run, Sites A & B,
10/30-10/31/13
N Load P Load
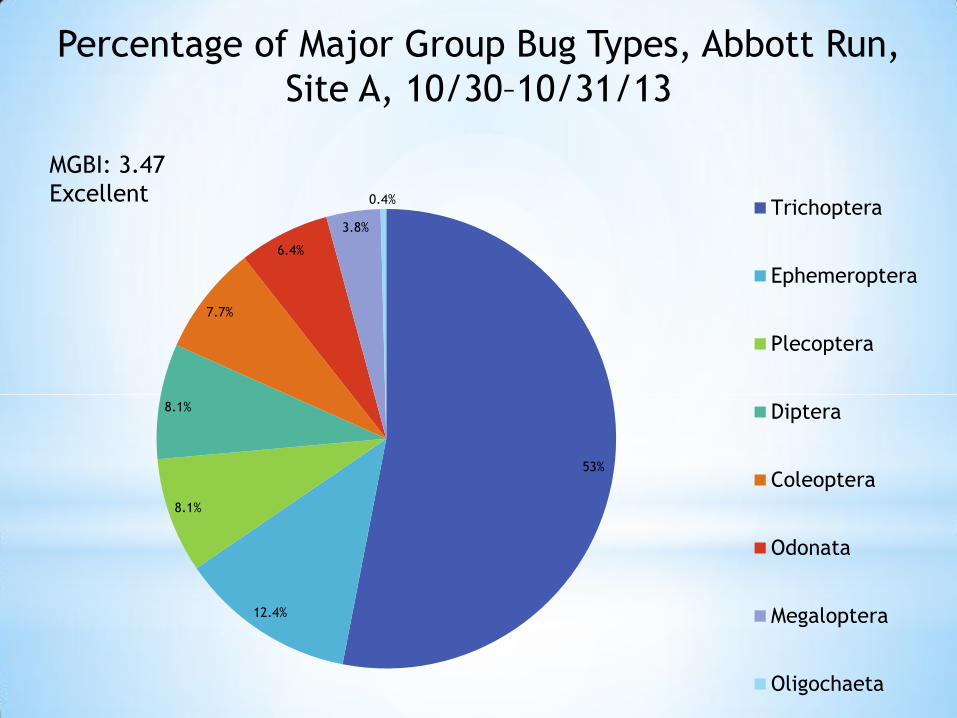
53%
12.4%
8.1%
8.1%
7.7%
6.4%
3.8%
0.4% Trichoptera
Ephemeroptera
Plecoptera
Diptera
Coleoptera
Odonata
Megaloptera
Oligochaeta
Percentage of Major Group Bug Types, Abbott Run,
Site A, 10/30–10/31/13
MGBI: 3.47
Excellent

Percentage of Major Group Bug Types, Abbott Run,
Site B, 10/30-10/31/13
MGBI: 7.65
Very Poor
.5% 1%
7%
9%
10.4%
2.5%
.5%
1.5% 67.7%
Ephemeroptera
Plecoptera
Trichoptera
Diptera
Odonata
Megaloptera
Coleoptera
Amphipoda
Oligochaeta

**pH levels are similar to previous years at the
usual level for water which is close to 7
*Dissolved Oxygen Levels and water temperature for both sites are similar to other years
*Site A had more N-NO3 than Site B, but the SRP is the limiting factor for fresh water.
*The number of Net-Spinning Caddisflies in Site A have increased while Net-Spinning Caddisflies in Site B have decreased
* In previous years more net Spinning Caddisflies were found in Site B than in Site A
*Net-Spinning Caddisflies are more tolerant to pollution than Case Building Caddisflies.
*Oligochaeta is the majority group of BMIs in Site B which hasn’t been seen in previous years
*The MGBI for Site B is very poor which hasn’t been seen in previous years.

*
*Continue to monitor the Benthic Macro-invertebrate
communities for both sites.
*Perhaps next year’s class can identify bugs to family instead
of just order/class.
*Check specific conductivity to see if 2013-2014’s snowfall
increases the values.
*Continue monitoring the N-NO3 and SRP loads to see if land
use causes any changes.

*Laura Ebraico
*Brian Gariepy
*Andria Grant
*Cameron Grieves
*Ruth Hanan
*Shane Hanrahan
*Nicole Hastry
*Andrew Hoffman
*David Howlett
*James O’ Connor
*Patricia Pitassi
*Jacob Rivello
*Siddarth Senthilkumaran
*Alec Swanson
*Thomas Van
Executive Producers…
Laura Ebraico
Andria Grant
Nicole Hastry