Washington Health Benefit Exchange...share from 2014 to 2016. For more information on carriers with...
32
Washington Health Benefit Exchange Washington State Health Insurance Market Analysis Prepared for: The Washington Health Benefit Exchange Prepared by: Wakely Consulting Group 9777 Pyramid Court Suite 260 Englewood, CO 80112 Tel 720.226.9800 Fax 720.226.9820 www.wakely.com Jon Kingsdale, Ph.D. Managing Directory Aree Bly, FSA, MAAA Senior Consulting Actuary Danielle Hilson, FSA, MAAA Consulting Actuary Brittney Phillips, ASA, MAAA Associate Actuary
Transcript of Washington Health Benefit Exchange...share from 2014 to 2016. For more information on carriers with...

Washington Health Benefit Exchange
Washington State Health Insurance Market Analysis
Prepared for: The Washington Health Benefit Exchange
Prepared by: Wakely Consulting Group 9777 Pyramid Court
Suite 260 Englewood, CO 80112 Tel 720.226.9800 Fax 720.226.9820 www.wakely.com
Jon Kingsdale, Ph.D. Managing Directory Aree Bly, FSA, MAAA Senior Consulting Actuary Danielle Hilson, FSA, MAAA Consulting Actuary Brittney Phillips, ASA, MAAA Associate Actuary

Wakely Consulting Group
Washington Health Benefit Exchange Washington State Health Insurance Market Analysis November 2016
Table of Contents
OVERVIEW ............................................................................................................................ 1
EXECUTIVE SUMMARY ........................................................................................................... 1
General health and viability of market ..................................................................................................... 2
Recommendations .................................................................................................................................... 3
INDIVIDUAL MARKET RESULTS ............................................................................................... 3
Competition .............................................................................................................................................. 4
Carrier participation .................................................................................................................................. 7
Rates ......................................................................................................................................................... 7
Provider choice ....................................................................................................................................... 14
Enrollment & plan changes ..................................................................................................................... 14
Risk pool concerns .................................................................................................................................. 18
SMALL GROUP RESULTS ....................................................................................................... 19
ADDITIONAL CARRIER COMMENTS ...................................................................................... 21
RELIANCES ........................................................................................................................... 22
ASSUMPTIONS AND METHODOLOGY ................................................................................... 22
DISCLOSURES AND LIMITATIONS ......................................................................................... 24
APPENDIX A – INDIVIDUAL ON EXCHANGE CARRIERS WITH >20% MARKET SHARE IN A COUNTY (ORDERED BY MARKET SHARE) APPENDIX B – AVERAGE ANNUAL RATE CHANGES FOR INDIVIDUAL ON EXCHANGE ENROLLEES (ASSUMING AUTO-RENEWAL) BY CARRIER

Wakely Consulting Group
Washington Health Benefit Exchange Washington State Health Insurance Market Analysis November 2016 Page 1
OVERVIEW
The Washington Health Benefit Exchange (“WAHBE” or “Exchange”) and the Washington State Office of the Insurance Commissioner (“OIC”) retained Wakely Consulting Group, LLC (“Wakely”) to conduct a market analysis of the health insurance market, both inside and outside of the Exchange. The review addresses the effect on the individual and small group markets of specific market rules in Washington State as well as the general “health and viability” of the individual market. The Affordable Care Act (ACA) provided standardization and new consumer protections at the federal level. Washington State created additional standardization through state law. Specifically, Revised Code of Washington (RCW) 48.43.700 (4) requires that insurance carriers who offer bronze plans in the individual and small group markets outside the Exchange also offer a gold and silver plan outside the Exchange. It also limited the sale of catastrophic plans to inside the Exchange. However, OIC later made the legal determination that the statutory language violates federal law and therefore could not prohibit the sale of catastrophic plans off the Exchange. This document has been prepared to provide WAHBE and the OIC with the results of the analysis that Wakely performed. This document contains the results, data, assumptions, and methods used in our analysis, and satisfies the ASOP 41 reporting requirements. Using the information in this report for other purposes may not be appropriate.
EXECUTIVE SUMMARY
Wakely used two approaches to analyze the changes in Washington’s health insurance market since 2014, when ACA-compliant plans and the Exchange marketplace came into existence. We performed an analytical review of the plans, enrollment, and premiums offered on and off Exchange in the individual and small group markets. This analysis provided concrete information on changes from year to year and the impact of consumer reactions to those changes. We also interviewed all the carriers in the individual and some of the carriers in the small group health insurance markets to better understand their perceptions of these markets and their withdrawal, entry, and product design decisions for these markets. These discussions allowed Wakely to gather insights directly from the carriers on their concerns regarding the stability of the market and the impact of current regulations, as well as any recommendations for stabilizing the market.

Wakely Consulting Group
Washington Health Benefit Exchange Washington State Health Insurance Market Analysis November 2016 Page 2
General health and viability of market
All carriers said that the requirement regarding offering silver and gold actuarial values has not influenced their strategies and offerings in either the individual or small group markets. Moreover, they have observed that both the individual and small group markets in Washington are generally more stable than in other states with which they are familiar. The overall impression is of market stability with respect to competition, plan and product choice, average rate trend, and choice of providers within plans.
For the individual market, the following key findings point to the overall market health and stability.
Steady growth in number of issuers, plans and products from 2014 to 2016, both overall and by county.
i. Eight on Exchange issuers have participated in all years from 2014 to 2017;
ii. Total plan options offered statewide grew from 46 in 2014 to 138 in 2016 on Exchange, and from 49 in 2014 to 70 in 2016 off Exchange;
iii. There is some reduction in number of plan offerings for 2017, especially in less populated counties, but the total plan offerings is still greater than in 2014 (at 98 on Exchange and 56 off Exchange).
Steady growth in individual on Exchange enrollment. There has been growth statewide (and in virtually every county), from a total of 133,280 members in October 2014 to 163,813 members in October 2016. Off Exchange individual enrollment shrank slightly from 158,987 in 2014 to 150,957 in 2016.
Small carriers have increased their market share creating dispersion of enrollment between multiple competitors. The on Exchange market is less dependent on any one carrier than in 2014. Premera had approximately 47% of the market share in 2014, dropping to 30% in 2016. The loss in its market share has been spread among several other carriers. The off Exchange market has had four carriers with at least 10% market share in 2014 and 2015.
Relative rate stability in the on Exchange market overall (before APTCs), except for a few low-enrollment counties in a few years. Gross premiums have increased at an average annual rate of 2.7% in 2014, 3.6% in 2015 and 11.3% in 2016 (based only on enrollees able to renew).
Considerable year-to-year rate changes (after APTCs) for some on Exchange issuers, although the majority of enrollees have opportunities for cost savings or minimization of cost increases. 75% in 2014, 68% in 2015, and 91% in 2016 could lower net premiums (after APTCs) by enrolling in the lowest priced plan in

Wakely Consulting Group
Washington Health Benefit Exchange Washington State Health Insurance Market Analysis November 2016 Page 3
the same metal level, and all but 14% in 2014, 25% in 2015, and 3% in 2016 could stay under a 10% net premium increase by doing the same.
Narrowing of networks by carriers to constrain premium increases. However, PPOs are still available along the I-5 corridor and in many rural counties. We have not seen the appearance of “ultra-narrow” networks.
For the small group market, selection has been much greater off the Exchange than on the Exchange. In 2017, only one carrier will be offered through the Exchange in two counties. Outside the Exchange, there are at least six carriers in all counties. In addition, ten carriers have participated off Exchange from 2014-2017. The majority of small group enrollees have consistently been enrolled in gold tier and PPO plans, and there continues to be many of these types of plans available in 2017.
Recommendations
Because the Washington market appears to be relatively stable compared to many other states, Wakely makes the following recommendations, for the client’s consideration:
The statutory requirement found in RCW 48.43.700 (4), which requires that insurance carriers which offer bronze plans in the individual or small group markets outside the Exchange also offer a gold and silver plan outside the Exchange, should be retained, as it has not destabilized the market and it could help equalize market conditions inside and outside the Exchange in the future. The discussions with issuers and the changes observed in the marketplace indicate that the plan offerings are not materially impacted by the regulation.
More broadly, given the uncertainty over the future of the ACA generated by the recent national election results, and the relatively good health of the insurance market to date, we recommend that the State maintain its current statutory and regulatory framework for the individual market and for WAHBE.
INDIVIDUAL MARKET RESULTS
Wakely analyzed many factors in order to show the changes that have been occurring in the market. We also gained significant insights from our interviews with carriers. Although the results are interrelated, and should be considered in totality to represent a full picture, we describe them separately by key areas for the analysis.

Wakely Consulting Group
Washington Health Benefit Exchange Washington State Health Insurance Market Analysis November 2016 Page 4
Competition
Wakely analyzed the level of competition among carriers from 2014 to 2016, both on a statewide and county level, for the on Exchange individual market. On a statewide level, several carriers had significant market share (defined as more than 5% of total enrollees) from 2014 to 2016. In 2014, there were four carriers with significant market share, growing to six carriers in 2015, and shrinking to five in 2016. The number of significant carriers increased through the years, and the distribution of enrollment has dispersed more evenly among the larger carriers. In another sign of stability, the three largest carriers in 2014 remained so in all years. The biggest changes in carrier competition is the addition of Molina as a significant carrier statewide in 2016 and the exit of Moda from the Exchange in 2016.
Individual On Exchange Market Share by Year (>5% Bolded)
Carrier 2014 2015 2016
Premera 47% 39% 30%
Coordinated Care 16% 20% 20%
Group Health Cooperative 15% 14% 17%
Molina 1% 3% 15%
Lifewise 14% 9% 7%
Kaiser 2% 2% 4%
BridgeSpan 2% 7% 3%
UHC N/A N/A 2%
Regence BlueShield N/A N/A 1%
Community Health Plan of WA 2% 1% < 1%
Health Alliance N/A N/A < 1%
Moda N/A 5% N/A
Columbia United Providers N/A < 1% N/A
On a county level, competition between carriers has been relatively consistent. Although there was some shifting between carriers with significant market share (defined as greater than 20% of enrollees within a county), most counties retained the same carriers with significant market share from 2014 to 2016. For more information on carriers with significant market share on a county level, see Appendix A. For the individual off Exchange market, market share for 2015 was similar to market share in 2014, with only one carrier exiting after 2014 (Moda) and one carrier (Premera) gaining significant market share in 2015. (2016 data by carrier was unavailable.)

Wakely Consulting Group
Washington Health Benefit Exchange Washington State Health Insurance Market Analysis November 2016 Page 5
Individual Off Exchange Market Share by Year Carrier 2014 2015
Regence 33% 33%
Lifewise 27% 24%
Premera 12% 24%
Group Health Cooperative 10% 10%
Group Health Options 8% 6%
Asuris 2% 2%
Kaiser 1% 1%
Moda Health 6% N/A
Time Insurance 1% N/A
Bridgespan N/A <1%
Along with carrier competition, Wakely also considered the competition among product and plan offerings by carriers in the individual market, both on and off Exchange. On Exchange, the total number of plan offerings peaked in 2016 at 138, driven by a large increase in the number of EPO plans offered. In general, EPO plans are similar to HMO plans, in that they have a closed-network, but may be offered by a carrier without an HMO license or may not require referrals to see specialists. The number of total plans in 2017 shrank to approximately the same level as 2015 (but still more than twice the number in 2014), due to a large decrease in the number of PPO plans available.
Number of Individual Plan Offerings by Product Type – On the Exchange Year HMO PPO EPO POS Total
2014 16 30 - - 46
2015 25 62 3 - 90
2016 23 67 47 1 138
2017 23 23 52 - 98
Wakely reviewed these metrics for King, Snohomish, and Pierce counties, as well as the remaining counties combined. These three (of 39) counties account for well over half the State’s population and individual market enrollment. The results were largely similar to the statewide metrics, with the few differences noted below:
King, Snohomish, and “all other counties” had a relatively stable number of HMO plans available throughout the years; Pierce grew from six HMO plans in 2014 to 23 in 2017 (data not shown).
Many of the PPO plans available in 2017 are in King county. King has 17 PPO plans in 2017 compared to nine in Snohomish county, five in Pierce county, and three in all other counties (data not shown).
Relative to their numbers in 2016, EPO plans became more available in rural counties (“all other counties”) than in King, Snohomish, and Pierce counties (data not shown).

Wakely Consulting Group
Washington Health Benefit Exchange Washington State Health Insurance Market Analysis November 2016 Page 6
We also examined enrollment by plan network type. Through 2016, enrollment has significantly shifted away from PPOs into closed-network plans (EPO and HMO). As of 2016, two-thirds of membership was enrolled in an HMO or EPO product and 33% in a PPO product, which is the inverse of the enrollment proportions in 2014.
Individual Enrollment Distribution by Product Type – On the Exchange
Year HMO PPO EPO POS
2014 35% 65% N/A N/A
2015 39% 61% < 1% N/A
2016 51% 33% 16% < 1%
The shift in enrollment is partially due to carriers discontinuing some PPO plans or converting and “cross-walking” existing PPO into EPO plans. As closed-network plans are generally less expensive than PPO plans, several carriers noted that the relative increase of HMO and EPO offerings was a conscious effort to mitigate increases in claims costs. The increase on enrollment indicates that consumers have responded favorably to this strategy. Wakely compared premiums in King county for the lowest cost HMO and PPO bronze plans on the Exchange: In 2015, the lowest cost PPO plan was 15% more expensive than the lowest cost HMO plan; by 2017, the lowest cost PPO plan will be 28% more expensive than the lowest cost HMO plan. The enrollment distributions have some variation on a county level, but the overall patterns are consistent. A similar shift in the number and type of plans available can be seen in the individual off Exchange market, except that the decrease in PPO plans occurred earlier (2016) and continues in 2017, resulting in a return to near-2014 total number of plans off Exchange.
Number of Individual Plan Offerings by Product Type – Off the Exchange Year HMO PPO EPO POS Total
2014 9 40 - - 49
2015 11 115 - 3 129
2016 5 42 22 1 70
2017 7 28 20 1 56
A similar pattern can be seen on a county basis, except that EPO plans are more available in the rural counties. King, Snohomish, and Pierce counties each had eight EPO plans available in 2016, but only one EPO plan available in 2017. The other counties have a total of 19 EPO plans available in both years (data not shown). In contrast with the individual on Exchange market, the vast majority of individual off Exchange enrollment (135,415 in October 2014 and 123,871 in October 2015) was in PPO plans.

Wakely Consulting Group
Washington Health Benefit Exchange Washington State Health Insurance Market Analysis November 2016 Page 7
Individual Enrollment Distribution by Product Type – Off the Exchange Year HMO PPO EPO POS
2014 12% 88% N/A N/A
2015 12% 82% N/A 6%
Although there was a large reduction in the number of PPO plans on a statewide basis from 2015 to 2017 off Exchange, there are still many more PPO plans available than any other plan type. Again, carrier interviews confirmed our hypothesis, which was based on observations in many states, that the increase in closed-network plans appears to be part of a strategy for moderating claims cost increases. Wakely compared premiums for the lowest cost HMO and PPO bronze plans in King county, off Exchange: for 2015, the lowest cost PPO plan was only 3% more expensive than the lowest cost HMO plan; by 2017, the lowest cost PPO plan will be 32% more expensive than the lowest cost HMO plan.
Carrier participation
Eight carriers have participated in the individual on Exchange market since 2014, although some issuers have entered or withdrawn completely. Withdrawals have affected a relatively small portion of the overall market.
Moda and Columbia United Providers (CUP) only participated in 2015. Moda had approximately 5% of the individual on Exchange market that year and CUP had fewer than 100 enrollees.
UnitedHealthcare and Health Alliance only participated in 2016. UnitedHealthcare had approximately 2% of the individual on Exchange market that year and Health Alliance had fewer than 20 enrollees.
Regence joined the individual on Exchange market in 2016 and will continue in 2017. In 2016, they enrolled approximately 1% of the market.
Rates
Wakely analyzed the average annual change in premiums on the Exchange for (a) all members, (b) members not receiving an Advance Premium Tax Credit (APTC), and (c) members receiving an APTC (before and after applying APTCs). The analysis considers premium increases only for on Exchange enrollees whose plans were renewed or, if discontinued, were “cross-walked” to another plan for the next year. The changes in all premiums assume no change in age, household size, or tobacco usage. In addition, the net rates (after the application of APTCs) assume no changes in the enrollee household’s percentage of federal poverty rate (FPL) on which APTCs are based, or premium contribution cap between years.

Wakely Consulting Group
Washington Health Benefit Exchange Washington State Health Insurance Market Analysis November 2016 Page 8
The average annual gross premium increases (before APTCs) were 2.7% in 2014, 3.6% in 2015, and 11.3% in 2016. The gross premium increases (before APTCs) were higher for those enrollees that did not receive APTCs compared with those who did receive APTCs in 2015 (5.1% vs 3.2%) and 2016 (12.5% vs 10.9%). Changes year-to-year in net premiums reflect several factors that can make them very different from the changes in gross premiums. First, as indicated above, those who enroll without the benefit of subsidies tend to select different plans than those who enjoy APTC subsidies; for example, the latter overwhelmingly favor silver and bronze plans, whereas non-APTC enrollees are generally dispersed more evenly among metal levels. This difference in plan selection accounts for the slightly higher average increase in gross premiums (before application of APTCs) between APTC-eligible and non-eligible enrollees that is reported above.
However, a second and more material set of differentiators are the change in APTCs year-over-
year, and the “leveraging” impact of the APTCs on net premium. As a result, even for the same
plan, net premium trends can be much higher (or lower) than the changes in gross premiums.
To understand why, consider a household that does not change composition or income from
the base year (call it year 1) to the next (call it year 2). The calculation and application of the
APTC for that household is as follows.
1) The APTC is calculated anew each year, such that the net premium for the second lowest cost silver plan (SLCSP) will remain unchanged from year to year, at a fixed percentage of household income. Hence, a change in the gross premium for the SLCSP will change the level of APTC from year 1 to year 2: if the premium for the SLCSP goes up, so will the APTC subsidy, so that the SCLSP still carries the same net premium in year 2 as it did in year 1; or if the premium for the SLCSP goes down in year 2, similarly, so will the APTC, in order to maintain the same net premium.
2) Even were the APTC to remain the same from year to year, a leveraging effect “magnifies” the impact of small changes in gross premium on the net premium actually paid by subsidized enrollees. To illustrate this leveraging effect, consider a plan which increases its gross premium for year 2 over year 1 by 10%, from $200 to $220 per month. If there is no change in the APTC – say it remains $180/month in both years – while the gross premium increases by 10%, the net premium increases from $20 in year 1 ($200-$180 = $20) to $40 in year 2 ($220-$180=$40), or 100%.
The combination of these two factors -- (1) changes in APTCs from one year to the next, and (2) the leveraging impact of APTCs on net premiums -- can lead to relatively large swings in net premiums, despite relatively modest changes in gross premiums. The average annual net premium increases for enrollees who received APTCs were far higher on a percentage basis, due to the reasons discussed above. The net premium increases were 27.1% in 2014, 35.2% in 2015, and 15.1% in 2016.

Wakely Consulting Group
Washington Health Benefit Exchange Washington State Health Insurance Market Analysis November 2016 Page 9
2014-2015 Average Annual Rate Changes for Individual On Exchange Enrollees (Assuming Auto-Renewal) By Metal
All Members Members Not Receiving APTC
Members Receiving APTC
Metal Level Enrollment Renewal % Change
Enrollment Renewal % Change
Enrollment Renewal % Change - Pre APTC
Renewal % Change -
Post APTC
Gold 10,718 1.0% 4,402 0.9% 6,316 1.1% 11.5%
Silver 66,315 2.4% 7,272 2.2% 59,043 2.5% 26.1%
Bronze 46,897 3.9% 12,837 4.1% 34,060 3.8% 37.8%
Catastrophic 91 -9.0% 91 -9.0%
Total 124,021 2.7% 24,602 2.7% 99,419 2.7% 27.1%
2015-2016 Average Annual Rate Changes for Individual On Exchange Enrollees
(Assuming Auto-Renewal) By Metal All Members Members Not Receiving
APTC Members Receiving APTC
Metal Level Enrollment Renewal % Change
Enrollment Renewal % Change
Enrollment Renewal % Change - Pre APTC
Renewal % Change -
Post APTC
Gold 10,171 9.7% 4,806 9.7% 5,365 9.6% 27.6%
Silver 74,750 2.3% 9,453 2.8% 65,297 2.2% 33.1%
Bronze 50,612 4.1% 15,050 4.7% 35,562 3.8% 42.1%
Catastrophic 735 -1.1% 735 -1.1%
Total 136,268 3.6% 30,044 5.1% 106,224 3.2% 35.2%
2016-2017 Average Annual Rate Changes for Individual On Exchange Enrollees
(Assuming Auto-Renewal) By Metal All Members Members Not Receiving
APTC Members Receiving APTC
Metal Level Enrollment Renewal % Change
Enrollment Renewal % Change
Enrollment Renewal % Change - Pre APTC
Renewal % Change -
Post APTC
Gold 7,975 12.8% 4,811 13.2% 3,164 12.2% 13.0%
Silver 78,046 10.0% 14,502 10.9% 63,544 9.8% 13.9%
Bronze 37,743 13.6% 14,005 14.0% 23,738 13.4% 18.7%
Catastrophic 1,184 13.3% 1,184 13.3%
Total 124,948 11.3% 34,502 12.5% 90,446 10.9% 15.1%
The difference between the pre APTC and post APTC premium increase for members receiving an APTC from 2016 to 2017 is not as marked as prior years. This is caused by the increase in the premium for the second lowest silver plan, which increases the APTC and offsets some of the leveraging effect described above. In prior years, the premiums for the second lowest silver

Wakely Consulting Group
Washington Health Benefit Exchange Washington State Health Insurance Market Analysis November 2016 Page 10
plan generally decreased, which reduced the APTC for enrollees and led to higher net rate increases. Similar renewal results on a carrier basis, rather than metal level, can be found in Appendix B. Of course, a primary purpose of the Exchange is to facilitate comparison shopping, and enrollees renewing through WAHBE have the opportunity to shop and switch plans during open enrollment. Wakely quantified the impact on premiums if all enrollees switched into (or remained in) the lowest cost plan in their county on the same metal tier as their previous plan. Based on this projection, we calculated the percent of enrollees who (a) would have to increase their net monthly premium payments by more than 10%, or (b) would see premium savings, year-over-year. Wakely has calculated this at both the metal and rating area levels, and for enrollees who do and do not receive APTCs. These calculations assume no change in age, tobacco use, percentage of FPL, household size, or cap on premium contributions. By shopping and selecting the lowest priced plan for the following year at the same actuarial value as they were in the previous year, the vast majority of renewing enrollees would be able to either save on premiums or experience only a modest (single digit) increase in premiums. Looking first at gross premiums, before the application of APTCs, most enrollees have the ability to change to (or remain in) the lowest cost option within the same metal tier in their county and receive a premium decrease. In 2014 and 2015, close to 90% of enrollees were in this situation. In each of these years, 1% or fewer of enrollees would have experienced a premium increase of more than 10% after switching to (or remaining in) the lowest cost plan in the same metal tier. For 2017 over 2016, somewhat fewer enrollees are able to shop to reduce premiums, (approximately 70%), but still only 3% would receive a premium increase of more than 10%. Looking at net premiums, the majority of APTC eligible enrollees are able to achieve cost savings after switching to (or remaining in) the lowest cost available plan: 75% of enrollees for 2015 over 2014, 68% of enrollees for 2016 over 2015, and 91% of enrollees for 2017 over 2016. Increases in premiums of greater than 10% would apply to 14% of enrollees for 2015 over 2014, 25% of enrollees for 2016 over 2015, and 3% of enrollees for 2017 over 2016. Of course, enrollees in the richer metal levels (gold and silver) are also able to achieve savings by switching to a lower cost metal level.

Wakely Consulting Group
Washington Health Benefit Exchange Washington State Health Insurance Market Analysis November 2016 Page 11
2014-2015 Percentages of Exchange Individual Enrollees with Premium Increases >10% and Premium Decreases After Switching to (or Remaining in) Lowest Cost Available Plan
at Open Enrollment, By Metal All Members Members Not Receiving
APTC Members Receiving APTC
Metal Level Percent with Premium Increase > 10%, Pre-
APTC
Percent with
Premium Decrease, Pre-APTC
Percent with
Premium Increase >
10%
Percent with Premium Decrease
Percent with Premium Increase > 10%, Pre-
APTC
Percent with
Premium Decrease, Pre-APTC
Percent with Premium Increase > 10%, Post-
APTC
Percent with Premium Decrease, Post-APTC
Gold < 1% 92% < 1% 94% < 1% 91% 7% 82%
Silver < 1% 98% < 1% 99% < 1% 98% 9% 88%
Bronze 1% 79% < 1% 80% 1% 79% 23% 50%
Catastrophic < 1% 82% < 1% 82%
Total < 1% 91% < 1% 88% < 1% 91% 14% 75%
2015-2016 Percentages of Exchange Individual Enrollees with Premium Increases >10% and
Premium Decreases After Switching to (or Remaining in) Lowest Cost Available Plan at Open Enrollment, By Metal
All Members Members Not Receiving APTC
Members Receiving APTC
Metal Level Percent with Premium Increase > 10%, Pre-
APTC
Percent with
Premium Decrease, Pre-APTC
Percent with
Premium Increase >
10%
Percent with Premium Decrease
Percent with Premium Increase > 10%, Pre-
APTC
Percent with
Premium Decrease, Pre-APTC
Percent with Premium Increase > 10%, Post-
APTC
Percent with Premium Decrease, Post-APTC
Gold < 1% 98% < 1% 99% < 1% 97% 1% 97%
Silver 2% 95% 2% 97% 2% 95% 24% 74%
Bronze < 1% 82% < 1% 84% < 1% 81% 32% 51%
Catastrophic < 1% 52% < 1% 52%
Total 1% 90% 1% 89% 2% 90% 25% 68%

Wakely Consulting Group
Washington Health Benefit Exchange Washington State Health Insurance Market Analysis November 2016 Page 12
2016-2017 Percentages of Exchange Individual Enrollees with Premium Increases >10% and Premium Decreases After Switching to (or Remaining in) Lowest Cost Available Plan
at Open Enrollment, By Metal All Members Members Not Receiving
APTC Members Receiving APTC
Metal Level Percent with Premium Increase > 10%, Pre-
APTC
Percent with
Premium Decrease, Pre-APTC
Percent with
Premium Increase >
10%
Percent with Premium Decrease
Percent with Premium Increase > 10%, Pre-
APTC
Percent with
Premium Decrease, Pre-APTC
Percent with Premium Increase > 10%, Post-
APTC
Percent with Premium Decrease, Post-APTC
Gold 4% 71% 3% 72% 7% 68% 2% 84%
Silver 3% 76% 1% 88% 3% 73% 3% 97%
Bronze 1% 57% 1% 60% 1% 54% 6% 78%
Catastrophic 100% < 1% 100% < 1%
Total 3% 69% 3% 72% 3% 67% 3% 91%
Wakely also analyzed the impact for each of Washington’s five rating areas of members switching to (or remaining in) the lowest cost plan available to them in the same metal tier. The calculations (below) do show some inter-area variations, but no consistent pattern of any rating area being systematically disadvantaged over the four-year period.
2014-2015 Percentages of Exchange Individual Enrollees with Premium Increases >10% and
Premium Decreases After Switching to (or Remaining in) Lowest Cost Available Plan at Open Enrollment, By Rating Area
All Members Members Not Receiving APTC
Members Receiving APTC
Rating Area Percent with Premium Increase > 10%, Pre-
APTC
Percent with
Premium Decrease, Pre-APTC
Percent with
Premium Increase >
10%
Percent with Premium Decrease
Percent with Premium Increase > 10%, Pre-
APTC
Percent with
Premium Decrease, Pre-APTC
Percent with Premium Increase > 10%, Post-
APTC
Percent with Premium Decrease, Post-APTC
Rating Area 1 < 1% 90% < 1% 86% < 1% 91% 27% 67%
Rating Area 2 < 1% 92% 1% 91% < 1% 93% 8% 79%
Rating Area 3 < 1% 97% < 1% 93% < 1% 98% 1% 85%
Rating Area 4 < 1% 91% < 1% 88% < 1% 92% 5% 89%
Rating Area 5 < 1% 84% < 1% 85% < 1% 83% 16% 66%
Total < 1% 91% < 1% 88% < 1% 91% 14% 75%

Wakely Consulting Group
Washington Health Benefit Exchange Washington State Health Insurance Market Analysis November 2016 Page 13
2015-2016 Percentages of Exchange Individual Enrollees with Premium Increases >10% and Premium Decreases After Switching to (or Remaining in) Lowest Cost Available Plan
at Open Enrollment, By Rating Area All Members Members Not Receiving
APTC Members Receiving APTC
Rating Area Percent with Premium Increase > 10%, Pre-
APTC
Percent with
Premium Decrease, Pre-APTC
Percent with
Premium Increase >
10%
Percent with Premium Decrease
Percent with Premium Increase > 10%, Pre-
APTC
Percent with
Premium Decrease, Pre-APTC
Percent with Premium Increase > 10%, Post-
APTC
Percent with Premium Decrease, Post-APTC
Rating Area 1 < 1% 95% < 1% 93% < 1% 95% 32% 64%
Rating Area 2 < 1% 89% < 1% 87% < 1% 90% 17% 74%
Rating Area 3 19% 71% 12% 69% 20% 72% 21% 76%
Rating Area 4 < 1% 90% < 1% 86% < 1% 91% 35% 58%
Rating Area 5 < 1% 90% < 1% 89% < 1% 91% 36% 54%
Total 1% 90% 1% 89% 2% 90% 25% 68%
2016-2017 Percentages of Exchange Individual Enrollees with Premium Increases >10% and
Premium Decreases After Switching to (or Remaining in) Lowest Cost Available Plan at Open Enrollment, By Rating Area
All Members Members Not Receiving APTC
Members Receiving APTC
Rating Area Percent with Premium Increase > 10%, Pre-
APTC
Percent with
Premium Decrease, Pre-APTC
Percent with
Premium Increase >
10%
Percent with Premium Decrease
Percent with Premium Increase > 10%, Pre-
APTC
Percent with
Premium Decrease, Pre-APTC
Percent with Premium Increase > 10%, Post-
APTC
Percent with Premium Decrease, Post-APTC
Rating Area 1 1% 68% 3% 71% < 1% 65% 1% 94%
Rating Area 2 6% 62% 5% 69% 6% 59% 6% 88%
Rating Area 3 1% 78% 3% 67% 1% 81% 2% 93%
Rating Area 4 < 1% 73% 1% 75% < 1% 72% < 1% 95%
Rating Area 5 1% 89% 2% 88% 1% 89% 3% 90%
Total 3% 69% 3% 72% 3% 67% 3% 91%
Because it is by far the most populous county, for King county we considered the minimum premium available for a 40 year old not receiving APTC, by year and metal level, both on and off the Exchange. The premium rates do not contain any impact of aging or tobacco usage. In King county, minimum available premium rates are generally lower on than off Exchange for all years and metal levels. Minimum premium rates generally increased from 2014 to 2017 for gold and bronze plans on the Exchange, and generally decreased for silver and catastrophic plans on the Exchange. Off the Exchange, the minimum available premium level for all metal levels reached a low in 2016, and then increased for 2017.

Wakely Consulting Group
Washington Health Benefit Exchange Washington State Health Insurance Market Analysis November 2016 Page 14
Minimum Available Individual Premium by Metal Level for 40 Year Old Non-Smoker in King County
2014 2015 2016 2017
Level of Coverage
On the Exchange
Off the Exchange
On the Exchange
Off the Exchange
On the Exchange
Off the Exchange
On the Exchange
Off the Exchange
Platinum $392.97 $396.78
Gold $294.18 $339.74 $308.80 $347.21 $295.17 $308.10 $316.66 $344.28
Silver $244.75 $286.28 $234.51 $255.84 $223.87 $240.62 $230.47 $274.89
Bronze $185.77 $225.35 $193.85 $221.78 $197.18 $207.71 $213.22 $221.89
Catastrophic $223.19 $197.68 $187.70 $212.66
Provider choice
We asked issuers to characterize their networks as broad (containing >70% of hospitals in most counties, narrow (30% to 70%), or ultra-narrow (< 30% of hospitals). Issuers generally characterize their networks as broad or narrow; none offer ultra-narrow networks. By contrast, McKinsey reported that 19% of networks offered to individuals on Exchanges across the country in 2014 were “ultra-narrow.” 1 And networks in the individual market nationally have only tended to become narrower since 2014. Therefore, we infer that the health plans offered in Washington tend to be not as narrow as those offered elsewhere, which is positive for access to care and another sign of the state’s market stability.
Enrollment & plan changes
On Exchange enrollment has grown from 133,280 members as of October 2014 to 163,813
members in October 2016. The yearly growth on Exchange has been between 10-12%, and total
growth (on and off Exchange) was just under 2% for 2015 over 2014, and 6% for 2016 over 2015.
Off Exchange enrollment has shrunk from 158,987 members in October 2014 to 150,957
enrollees in 2016.
Individual Enrollment On and Off the Exchange (Monthly October Snapshot) On Exchange Off Exchange
Year Enrollment Yearly Growth Enrollment Yearly Growth
2014 133,280
158,987
2015 149,125 12% 147,767 -7%
2016 163,813 10% 150,957 2%
1 “Hospital networks: Updated national view of configurations on the Exchanges,” McKinsey & Company (June 2014), p. 4.

Wakely Consulting Group
Washington Health Benefit Exchange Washington State Health Insurance Market Analysis November 2016 Page 15
Enrollment distribution by metal level has remained relatively constant from 2014 to 2016. The majority of enrollees on the Exchange are in silver plans, with 54% of enrollees in a silver plan in 2014 and 58% in a silver plan in 2016. Bronze plans have decreased slightly in popularity from 37% of enrollees on the Exchange in bronze plans in 2014 and 33% of enrollees in bronze plans in 2016. Off the Exchange, the majority of enrollees are in bronze plans. However, in 2016, enrollment has shifted slightly to gold, silver, and catastrophic plans.
Individual Enrollment Distribution by Year and Metal Level, On and Off the Exchange
On Exchange Enrollment Distribution Off Exchange Enrollment Distribution
Level of Coverage 2014 2015 2016 2014 2015 2016
Platinum N/A < 1% N/A N/A 1% N/A
Gold 9% 8% 8% 21% 21% 23%
Silver 54% 56% 58% 20% 22% 26%
Bronze 37% 36% 33% 59% 56% 46%
Catastrophic < 1% 1% 1% < 1% < 1% 6%
In addition, Wakely reviewed the number of plan offerings, on and off the Exchange, by metal level and year. In 2014 and 2015, more plans were offered on every metal level off the Exchange (except catastrophic) than on Exchange. In 2016, the number of plans on the Exchange increased dramatically, approximately doubling that offered off the Exchange. In 2017, the number of plans decreased, both on and off Exchange, but on Exchange still offers a greater number of plans at every metal level than the outside market. The choice of plan offerings on and off the Exchange have been similar by year: silver plans are the most prevalent offering, followed by bronze, then gold.
Number of Individual Plans Offered by Year and Metal, On and Off the Exchange On Exchange Enrollment Distribution Off Exchange Enrollment Distribution
Level of Coverage 2014 2015 2016 2014 2015 2016
Platinum 0 5 0 0 17 0
Gold 12 20 34 14 33 18
Silver 17 32 60 18 46 28
Bronze 15 30 41 17 33 23
Catastrophic 2 3 3 0 0 1
In addition to a few carriers withdrawing completely from the market, some carriers have remained, but discontinued selected plans. Most of the discontinued plans in 2015 were Moda’s, which withdrew entirely as described above (data not shown).

Wakely Consulting Group
Washington Health Benefit Exchange Washington State Health Insurance Market Analysis November 2016 Page 16
Number and Enrollment in Discontinued Individual On Exchange Plans by Year and Rating Area 2014 2015 2016
Rating Area Plans % Yearly Enrollment
Plans % Yearly Enrollment
Plans % Yearly Enrollment
Rating Area 1 0 N/A 8 1.2% 44 9.4%
Rating Area 2 3 0.5% 8 3.4% 50 8.0%
Rating Area 3 0 N/A 11 1.0% 42 1.1%
Rating Area 4 0 N/A 6 0.1% 50 0.9%
Rating Area 5 0 N/A 8 0.5% 55 2.0%
In 2016, there was a large increase in the number of discontinued plans. This was largely due to Premera changing its risk arrangements and networks in a significant number of plans in King, Snohomish, and Pierce counties from 2016 to 2017 (data not shown). These changes are significant enough that WAHBE did not “cross-walk” the plans from 2016 to 2017, so we treated them for our particular analytic purpose as if they had been discontinued. WAHBE has communicated that they are encouraging these members to shop on the Exchange for new plans in 2017. There are some rural counties which have experienced a severe reduction in the number of plans available on Exchange: five counties have less than 10 plan options on Exchange in 2017, representing a significant decrease from 2016, and even from 2014. However, these counties have approximately double the amount of plans available to them off Exchange as on Exchange in 2017 (data not shown).
Counties with < 10 Individual Plans Available in 2017, On the Exchange County 2014 2015 2016 2017
San Juan 28 34 54 8
Klickitat 24 29 48 4
Pend Oreille 27 32 50 5
Skamania 24 29 48 7
Ferry 27 32 50 5
Two of these counties are experiencing large premium increases in their second lowest cost silver plans: Ferry and Pend Oreille each saw 48% price increases for 2017. This is driven by three carriers (Premera, Lifewise, and UHC) completely withdrawing from these counties in 2017. In addition, two other counties within this group have only one carrier offering plans on the Exchange in 2017. These counties have very small populations, but for their residents the declining level of choice and competition may be problematic.

Wakely Consulting Group
Washington Health Benefit Exchange Washington State Health Insurance Market Analysis November 2016 Page 17
Counties with 1 Individual Carrier Available in 2017, On the Exchange County 2014 2015 2016 2017
San Juan 3 4 4 1
Klickitat 2 3 3 1
As an indication of market stability, Wakely considered the variability in the second lowest cost silver plan, the lowest cost silver plan, and the lowest cost bronze plan, by year. These are the most frequently selected plan choices. The plan identified as the second lowest cost silver plan changed in 27 (out of 39) counties from 2014 to 2015, 35 counties from 2015 to 2016, and 22 counties from 2016 to 2017. In the majority of these cases, the second lowest cost silver plan was offered by a different carrier as well. Such changes can be disconcerting, even confusing, for enrollees. On the other hand, these changes in the identity of lowest cost plans also suggests healthy competition among carriers to be the second lowest cost silver plan. Annual rate changes were moderate or negative for the second lowest cost silver plans from 2014 to 2016; from 2016 to 2017, rates are increasing at an average annual rate of 5%, although in two counties, as discussed previously, the second lowest cost silver rate increased 48%.
Changes in the Second Lowest Cost Silver Plan, for the On Exchange Individual Market, By County and Year
Metric 2014-2015 2015-2016 2016-2017
Counties with Same Plan, Year Over Year
12 4 17
Counties with Plan Change, Year Over Year
27 35 22
Min Rate Change, by County -10% -17% -7%
Max Rate Change, by County 3% 5% 48%
Avg Rate Change -6% -9% 5%
Similarly, for the lowest cost silver plans, average rates decreased for 2015 and again for 2016, and are increasing slightly (3%) for 2017 across all counties.
Changes in Lowest Cost Silver Plan, for the On Exchange Individual Market, By County and Year
Metric 2014-2015 2015-2016 2016-2017
Counties with Same Plan, Year Over Year 5 0 16
Counties with Plan Change, Year Over Year 34 39 23
Min Rate Change, by County -19% -14% -12%
Max Rate Change, by County 6% 17% 14%
Avg Rate Change -7% -3% 3%

Wakely Consulting Group
Washington Health Benefit Exchange Washington State Health Insurance Market Analysis November 2016 Page 18
For the lowest cost bronze plans, there was somewhat more continuity than for silver plans: the plan identified as the lowest cost bronze plan changed in 28 counties into 2015, and 18 counties into 2016 and 2017. The annual rate changes are higher than in the lowest cost silver plans, with an average change of 2% into 2015, 1% into 2016 and 7% into 2017.
Changes in Lowest Cost Bronze Plan, for the On Exchange Individual Market, By County and Year
Metric 2014-2015 2015-2016 2016-2017
Counties with Same Plan, Year Over Year 11 21 21
Counties with Plan Change, Year Over Year 28 18 18
Min Rate Change, by County -15% -12% -8%
Max Rate Change, by County 18% 3% 17%
Avg Rate Change 2% 1% 7%
Overall, the identity of the second lowest cost silver, lowest cost silver, and lowest cost bronze plans has changed in many counties from 2014 to 2017, but the annual rate changes have generally been modest (with a few exceptions).
Risk pool concerns
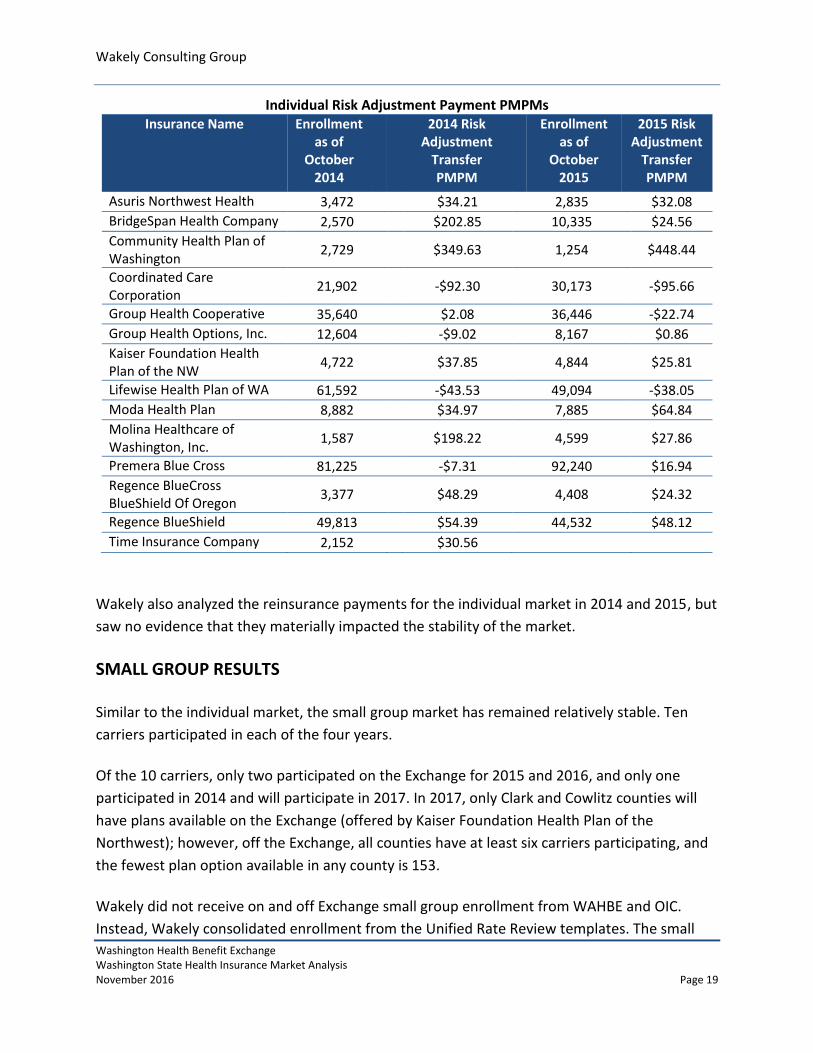
Wakely considered risk adjustment on a per member per month (PMPM) basis in 2014 and
2015 by carrier. In order to calculate the PMPMs, Wakely annualized the October membership
snapshot provided by WAHBE and OIC for each year, which could cause variations to carrier
PMPM calculations.
In 2014, the risk adjustment transfer payments ranged from -$92.30 PMPM (Coordinated Care
Corporation) to $349.63 PMPM (Community Health Plan of Washington). In 2015, the payments
ranged from -$95.66 PMPM (Coordinated Care Corporation) to $448.44 PMPM (Community
Health Plan of Washington). The most significant changes in risk adjustment payments were
BridgeSpan and Molina, both of which decreased their payments by approximately $170 PMPM
from 2014 to 2015. However, these two carriers also saw significant enrollment changes from
2014 to 2015, which can materially change (and stabilize) the risk profile of the population.
Overall, many carriers have experienced similar risk adjustment transfer payments year over
year indicating that, besides a few carriers, the risk pool is not changing significantly (by carrier)
from year to year. The stability may also be in part due to the fact that Washington did not
allow transitional policies, so there is no late influx of enrollees from transitional plans that is
changing the overall risk of the pool.
Wakely Consulting Group
Washington Health Benefit Exchange Washington State Health Insurance Market Analysis November 2016 Page 19
Individual Risk Adjustment Payment PMPMs Insurance Name Enrollment
as of October
2014
2014 Risk Adjustment
Transfer PMPM
Enrollment as of
October 2015
2015 Risk Adjustment
Transfer PMPM
Asuris Northwest Health 3,472 $34.21 2,835 $32.08 BridgeSpan Health Company 2,570 $202.85 10,335 $24.56 Community Health Plan of Washington
2,729 $349.63 1,254 $448.44
Coordinated Care Corporation
21,902 -$92.30 30,173 -$95.66
Group Health Cooperative 35,640 $2.08 36,446 -$22.74 Group Health Options, Inc. 12,604 -$9.02 8,167 $0.86 Kaiser Foundation Health Plan of the NW
4,722 $37.85 4,844 $25.81
Lifewise Health Plan of WA 61,592 -$43.53 49,094 -$38.05 Moda Health Plan 8,882 $34.97 7,885 $64.84 Molina Healthcare of Washington, Inc.
1,587 $198.22 4,599 $27.86
Premera Blue Cross 81,225 -$7.31 92,240 $16.94 Regence BlueCross BlueShield Of Oregon
3,377 $48.29 4,408 $24.32
Regence BlueShield 49,813 $54.39 44,532 $48.12 Time Insurance Company 2,152 $30.56
Wakely also analyzed the reinsurance payments for the individual market in 2014 and 2015, but
saw no evidence that they materially impacted the stability of the market.
SMALL GROUP RESULTS
Similar to the individual market, the small group market has remained relatively stable. Ten
carriers participated in each of the four years.
Of the 10 carriers, only two participated on the Exchange for 2015 and 2016, and only one
participated in 2014 and will participate in 2017. In 2017, only Clark and Cowlitz counties will
have plans available on the Exchange (offered by Kaiser Foundation Health Plan of the
Northwest); however, off the Exchange, all counties have at least six carriers participating, and
the fewest plan option available in any county is 153.
Wakely did not receive on and off Exchange small group enrollment from WAHBE and OIC.
Instead, Wakely consolidated enrollment from the Unified Rate Review templates. The small

Wakely Consulting Group
Washington Health Benefit Exchange Washington State Health Insurance Market Analysis November 2016 Page 20
group plans that were offered on Exchange were also offered off Exchange. For the purpose of
this report, the enrollment was consolidated, rather than split into on and off Exchange.
The total number of small group plan offerings peaked in 2016 at 381, driven by a large increase
in the number of EPO plans offered, as well as a smaller increase in the number of POS plans
offered. The number of plans in 2017 shrank approximately 10% compared to 2016 and will be
at its lowest level since 2014 (but is still approximately 50% higher than the number in 2014).
Number of Small Group Plan Offerings by Product Type Year HMO PPO EPO POS Indemnity Total
2014 14 194 12 14 1 235
2015 23 309 16 26 1 375
2016 11 237 96 36 1 381
2017 10 205 93 37 1 346
Unlike the individual on Exchange market, enrollment in 2015 saw a shift away from HMO (and
POS) products into PPOs.
Small Group Enrollment Distribution by Product Type Year HMO PPO EPO POS Indemnity Total
2014 15% 70% 1% 14% < 1% 100%
2015 12% 74% 1% 13% < 1% 100%
Enrollment distribution by metal plan remained relatively constant from 2014 to 2015. Almost
80% of enrollees are in silver or gold plans in both years. With the vast majority (92%) of small-
group enrollment concentrated in plans that are richer than bronze, it would be hard to make
an argument that the requirement to offer silver and gold plans has any market impact.
Small Group Enrollment Distribution by Metal Level Level of Coverage 2014 2015
Platinum 13% 14%
Gold 45% 51%
Silver 33% 27%
Bronze 9% 8%
Wakely also reviewed the number of plan offerings by metal level and year. In all years, there
has been an increase in the number of silver and bronze plan offerings and a decrease in the
platinum plan offerings. The number of gold plans decreased from 2015 to 2016 off the
Exchange, but remained well above the 2014 level.

Wakely Consulting Group
Washington Health Benefit Exchange Washington State Health Insurance Market Analysis November 2016 Page 21
Number of Small Group Plan Offerings by Year and Metal, On and Off the Exchange On Exchange Plans Available Off Exchange Plans Available
Level of Coverage 2014 2015 2016 2014 2015 2016
Platinum 0 0 0 51 41 40
Gold 1 5 9 91 149 127
Silver 3 12 13 85 130 140
Bronze 1 6 8 8 55 74
Catastrophic 0 0 0 0 0 0
ADDITIONAL CARRIER COMMENTS
The carriers were unanimous in characterizing Washington State as either a healthy market or
at a minimum, more stable than other markets they have observed or heard about. One carrier
suggested that this was due to premium rates in Washington being close to sufficient in year
one. While this makes sense, and Washington’s decision not to allow transitional policies, i.e.
not to grandfather all existing individual policies, probably improved the risk pool for new
enrollees, Wakely has not assessed underwriting results, so we cannot verify this observation.
Another carrier ascribed this to Washington having already adopted some of the ACA’s market
regulations prior to 2014, but was not specific as to which regulations.
Beyond this, the carriers offered a variety of observations:
1. Several carriers noted that, with all the uncertainty now about how long the ACA will
remain in place and what will succeed it, this is not the time for the State to make
significant legislative or regulatory changes to the market.
2. Carriers noted that OIC and WAHBE have done a good job helping new competitors
enter the individual market. As one observed, the agencies have been very responsive in
working with the new plan and seem to coordinate their policies so that plans are not
given conflicting signals. “They have gone out of their way to help us understand the
regulatory dynamics here.”
3. Several carriers suggested that enforcing eligibility criteria more effectively would
further stabilize the individual market. They point to such actions as: enforcing the
residency requirements, policing qualification for special enrollment periods, barring
provider-sponsored “charities” from paying for commercial coverage to increase their
own reimbursement, and ensuring that the offer of (affordable) employer sponsored
coverage pre-empts eligibility for individual enrollment on the Exchange.
4. Carriers noted the constraint of +/- 15% on geographic rating differences and having
only five distinct rating areas in Washington tends to either raise premiums in lower-
cost areas (in order to stay within the 15% range) or push carriers out of higher-cost

Wakely Consulting Group
Washington Health Benefit Exchange Washington State Health Insurance Market Analysis November 2016 Page 22
areas. However, this requirement may be partially responsible for the moderate rate
increases the state has experienced.
5. Several carriers suggested that other sorts of regulatory flexibility would allow them to
expand their service areas and thus increase competition, such as loosening access
requirements for medical specialties (e.g. dermatology) and allowing service areas to
encompass some, but not all, zip codes in a county.
RELIANCES
Wakely has utilized publicly available data and data provided by WAHBE and the OIC in the analysis described in this report. The analysis was performed using the following QHP data.
Rate Table templates
Plan and Benefit templates
Service Area templates
Network templates
Unified Rate Review templates (URRTs)
Crosswalks of 2014 to 2015, 2015 to 2016, and 2016 to 2017 individual on Exchange plans
Detailed on Exchange enrollment data by year including plan, county, age, and APTC for October 2014, October 2015, and October 2016
Off Exchange enrollment by year including carrier, county, and metal level for October 2014 and October 2015
Off Exchange enrollment by county and metal level for October 2016
CMS Report on Transitional Reinsurance Payments and Risk Adjustment Transfers for 2014 and 2015
ASSUMPTIONS AND METHODOLOGY
Wakely made some assumptions in working with the available data. These assumptions may impact the results of the analysis and should be reviewed by WAHBE and the OIC for reasonableness.
Continuing plans were identified as those found in the crosswalk provided by WAHBE or those that have the same Plan ID in sequential years.
The second lowest silver benchmark plan is determined after consideration of the EHB amounts for all years.
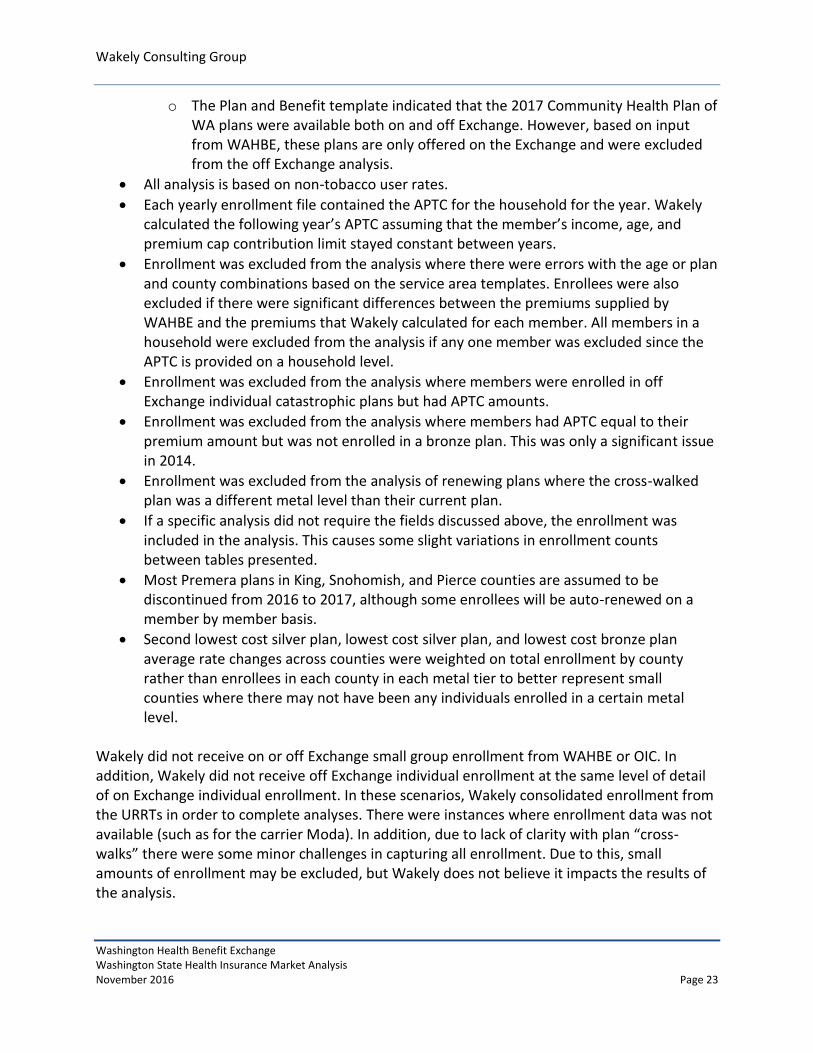
There were a couple discrepancies between the templates and other information described below:
o There were a handful of plans where the service area template indicated a plan was available in a certain rating area, but rates were missing from the rate template. We excluded these plan/county combinations from the analysis.
Wakely Consulting Group
Washington Health Benefit Exchange Washington State Health Insurance Market Analysis November 2016 Page 23
o The Plan and Benefit template indicated that the 2017 Community Health Plan of WA plans were available both on and off Exchange. However, based on input from WAHBE, these plans are only offered on the Exchange and were excluded from the off Exchange analysis.
All analysis is based on non-tobacco user rates.
Each yearly enrollment file contained the APTC for the household for the year. Wakely calculated the following year’s APTC assuming that the member’s income, age, and premium cap contribution limit stayed constant between years.
Enrollment was excluded from the analysis where there were errors with the age or plan and county combinations based on the service area templates. Enrollees were also excluded if there were significant differences between the premiums supplied by WAHBE and the premiums that Wakely calculated for each member. All members in a household were excluded from the analysis if any one member was excluded since the APTC is provided on a household level.
Enrollment was excluded from the analysis where members were enrolled in off Exchange individual catastrophic plans but had APTC amounts.
Enrollment was excluded from the analysis where members had APTC equal to their premium amount but was not enrolled in a bronze plan. This was only a significant issue in 2014.
Enrollment was excluded from the analysis of renewing plans where the cross-walked plan was a different metal level than their current plan.
If a specific analysis did not require the fields discussed above, the enrollment was included in the analysis. This causes some slight variations in enrollment counts between tables presented.
Most Premera plans in King, Snohomish, and Pierce counties are assumed to be discontinued from 2016 to 2017, although some enrollees will be auto-renewed on a member by member basis.
Second lowest cost silver plan, lowest cost silver plan, and lowest cost bronze plan average rate changes across counties were weighted on total enrollment by county rather than enrollees in each county in each metal tier to better represent small counties where there may not have been any individuals enrolled in a certain metal level.
Wakely did not receive on or off Exchange small group enrollment from WAHBE or OIC. In addition, Wakely did not receive off Exchange individual enrollment at the same level of detail of on Exchange individual enrollment. In these scenarios, Wakely consolidated enrollment from the URRTs in order to complete analyses. There were instances where enrollment data was not available (such as for the carrier Moda). In addition, due to lack of clarity with plan “cross-walks” there were some minor challenges in capturing all enrollment. Due to this, small amounts of enrollment may be excluded, but Wakely does not believe it impacts the results of the analysis.

Wakely Consulting Group
Washington Health Benefit Exchange Washington State Health Insurance Market Analysis November 2016 Page 24
Any errors in the plan offerings, rates, and other source data could have an impact on the results of this analysis.
DISCLOSURES AND LIMITATIONS
Responsible Actuary. Aree Bly and Danielle Hilson are the actuaries responsible for this communication. They are Members of the American Academy of Actuaries and Fellows of the Society of Actuaries. They meet the Qualification Standards of the American Academy of Actuaries to issue this report. Intended Users. This information has been prepared for the sole use of the management of WAHBE and the OIC and cannot be distributed to or relied on by any third party without the prior written permission of Wakely. We acknowledge that WAHBE and the OIC may provide this report to the Washington State Legislature. Distribution to such parties should be made in its entirety and should be evaluated only by qualified users. This information is confidential and proprietary. Risks and Uncertainties. The assumptions and resulting estimates included in this report and produced by the model are inherently uncertain. Users of the results should be qualified to use it and understand the results and the inherent uncertainty. Actual results may vary, potentially materially, from our estimates. Wakely does not warrant or guarantee that WAHBE and OIC will attain the projected values included in the report. It is the responsibility of the organization receiving this output to review the assumptions carefully and notify Wakely of any potential concerns. Conflict of Interest. The responsible actuaries are financially independent and free from conflict concerning all matters related to performing the actuarial services underlying this analysis. In addition, Wakely is organizationally and financially independent to WAHBE and the OIC. Data and Reliance. We have relied on others for data and assumptions used in the assignment. We have reviewed the data for reasonableness, but have not performed any independent audit or otherwise verified the accuracy of the data/information. If the underlying information is incomplete or inaccurate, our estimates may be impacted, potentially significantly. The information included in the Assumptions and Reliances section identifies the key data and assumptions. Subsequent Events. There are no known relevant events subsequent to the date of information received that would impact the results of this report. Contents of Actuarial Report. This document and the supporting exhibits/files constitute the entirety of actuarial report and supersede any previous communications on the project.

Wakely Consulting Group
Washington Health Benefit Exchange Washington State Health Insurance Market Analysis November 2016 Page 25
Deviations from ASOPs. Wakely completed the analysis using sound actuarial practice. To the best of my knowledge, the report and methods used in the analysis are in compliance with the appropriate Actuarial Standards of Practice (ASOP) with no known deviations. A summary of ASOP compliance is listed below: ASOP No. 23, Data Quality ASOP No. 41, Actuarial Communication

Wakely Consulting Group Appendix A
Washington Health Benefit Exchange Washington State Health Insurance Market Analysis November 2016 PageA-1
Appendix A
Individual On Exchange Carriers with >20% Market Share in a County (Ordered by Market Share)
County 2014 2015 2016
Adams Coordinated Care Coordinated Care Coordinated Care
Adams Premera Premera Premera
Asotin Premera Premera Premera
Benton Premera Coordinated Care Coordinated Care
Benton Group Health Cooperative Premera Group Health Cooperative
Benton Coordinated Care Group Health Cooperative Premera
Chelan Premera Premera Molina
Chelan Coordinated Care Coordinated Care Premera
Chelan Coordinated Care
Clallam Premera Premera Premera
Clallam Moda Lifewise
Clark Lifewise BridgeSpan Kaiser
Clark Kaiser Lifewise Lifewise
Clark Kaiser
Columbia Premera Group Health Cooperative Group Health Cooperative
Columbia Group Health Cooperative Premera Premera
Cowlitz Premera Premera Kaiser
Cowlitz Kaiser Kaiser Premera
Douglas Premera Premera Molina
Douglas Coordinated Care Coordinated Care Premera
Douglas Coordinated Care
Ferry Premera Premera Premera
Ferry Lifewise Lifewise Lifewise
Franklin Coordinated Care Coordinated Care Coordinated Care
Franklin Premera Group Health Cooperative Group Health Cooperative
Franklin Group Health Cooperative
Garfield Premera Premera Premera
Grant Premera Premera Molina
Grant Coordinated Care Coordinated Care Premera
Grant Coordinated Care
Grays Harbor Premera Premera Premera
Grays Harbor Moda Lifewise
Island Premera Premera Group Health Cooperative
Island Group Health Cooperative Group Health Cooperative Premera
Jefferson Premera Premera Coordinated Care
Jefferson Premera
King Premera Premera Premera

Wakely Consulting Group Appendix A
Washington Health Benefit Exchange Washington State Health Insurance Market Analysis November 2016 PageA-2
King Coordinated Care Coordinated Care Coordinated Care
King Molina
Kitsap Premera Premera Premera
Kitsap Group Health Cooperative Group Health Cooperative Group Health Cooperative
Kittitas Premera Premera Premera
Kittitas Group Health Cooperative Group Health Cooperative Group Health Cooperative
Klickitat Premera Premera Premera
Lewis Premera Premera Premera
Lewis Coordinated Care Coordinated Care
Lincoln Premera Premera Premera
Lincoln Lifewise Coordinated Care Coordinated Care
Mason Premera Premera Premera
Mason Group Health Cooperative Group Health Cooperative Molina
Mason
Group Health Cooperative
Okanogan Premera Premera Molina
Okanogan Lifewise
Premera
Pacific Premera Premera Premera
Pacific Lifewise Moda
Pend Oreille Premera Premera Premera
Pierce Premera Premera Molina
Pierce Premera
San Juan Premera Premera Group Health Cooperative
San Juan Group Health Cooperative Group Health Cooperative Premera
Skagit Premera Premera Group Health Cooperative
Skagit Group Health Cooperative Group Health Cooperative Premera
Skamania Premera Premera Premera
Skamania Lifewise Lifewise Lifewise
Snohomish Premera Premera Coordinated Care
Snohomish
Coordinated Care Premera
Spokane Premera Premera Coordinated Care
Spokane Coordinated Care Coordinated Care Molina
Spokane Group Health Cooperative Premera
Stevens Premera Premera Coordinated Care
Stevens Lifewise Coordinated Care Premera
Thurston Premera Premera Premera
Thurston Group Health Cooperative Coordinated Care Coordinated Care
Thurston Group Health Cooperative
Wahkiakum Premera Premera Premera
Wahkiakum
Lifewise
Walla Walla Premera Premera Group Health Cooperative
Walla Walla Group Health Cooperative Group Health Cooperative Coordinated Care
Walla Walla Coordinated Care Premera

Wakely Consulting Group Appendix A
Washington Health Benefit Exchange Washington State Health Insurance Market Analysis November 2016 PageA-3
Whatcom Premera Premera Group Health Cooperative
Whatcom Group Health Cooperative Group Health Cooperative Premera
Whitman Premera Premera Group Health Cooperative
Whitman Group Health Cooperative Group Health Cooperative Premera
Yakima Coordinated Care Coordinated Care Coordinated Care
Yakima Premera Premera Group Health Cooperative
Yakima Group Health Cooperative Premera

Wakely Consulting Group Appendix B
Washington Health Benefit Exchange Washington State Health Insurance Market Analysis November 2016 PageB-1
Appendix B
2014-2015 Average Annual Rate Changes for Individual On Exchange Enrollees (Assuming Auto-Renewal) By Carrier
All Members Members Not Receiving
APTC Members Receiving APTC
Metal Level Enrollment Renewal % Change
Enrollment Renewal %
Change Enrollment
Renewal % Change - Pre APTC
Renewal % Change -
Post APTC
BridgeSpan 2,439 -2.8% 526 -2.5% 1,913 -2.8% 10.6%
Community Health Plan of WA
2,539 1.4% 814 1.9% 1,725 1.1% 17.7%
Coordinated Care 17,934 7.0% 2,886 6.2% 15,048 7.2% 82.3%
Group Health Cooperative
19,477 2.0% 3,796 3.2% 15,681 1.8% 26.6%
Kaiser 2,418 -3.6% 298 -3.6% 2,120 -3.6% 6.6%
Lifewise 18,292 2.9% 3,008 3.0% 15,284 2.9% 25.2%
Molina 1,413 -9.5% 430 -7.1% 983 -10.6% -7.1%
Premera 59,509 2.9% 12,844 3.0% 46,665 2.9% 23.4%
Total 124,021 2.7% 24,602 2.8% 99,419 2.7% 27.1%
2015-2016 Average Annual Rate Changes for Individual On Exchange Enrollees
(Assuming Auto-Renewal) By Carrier
All Members Members Not Receiving
APTC Members Receiving APTC
Metal Level Enrollment Renewal % Change
Enrollment Renewal %
Change Enrollment
Renewal % Change - Pre APTC
Renewal % Change -
Post APTC
BridgeSpan 9,459 14.9% 1,452 13.9% 8,007 15.1% 73.6%
Community Health Plan of WA
93 9.0% 20 8.3% 73 9.2% 31.6%
Coordinated Care 29,310 -0.9% 4,281 0.1% 25,029 -1.0% 63.0%
Group Health Cooperative
20,511 -3.9% 4,884 -4.0% 15,627 -3.8% 14.3%
Kaiser 2,645 -10.3% 415 -10.2% 2,230 -10.4% -33.2%
Lifewise 13,411 -0.1% 2,780 0.7% 10,631 -0.2% 15.4%
Molina 4,508 -12.2% 1,002 -10.9% 3,506 -12.6% -5.4%
Premera 56,331 8.6% 15,210 9.5% 41,121 8.3% 42.5%
Total 136,268 3.6% 30,044 5.1% 106,224 3.2% 35.2%
Wakely Consulting Group Appendix B
Washington Health Benefit Exchange Washington State Health Insurance Market Analysis November 2016 PageB-2
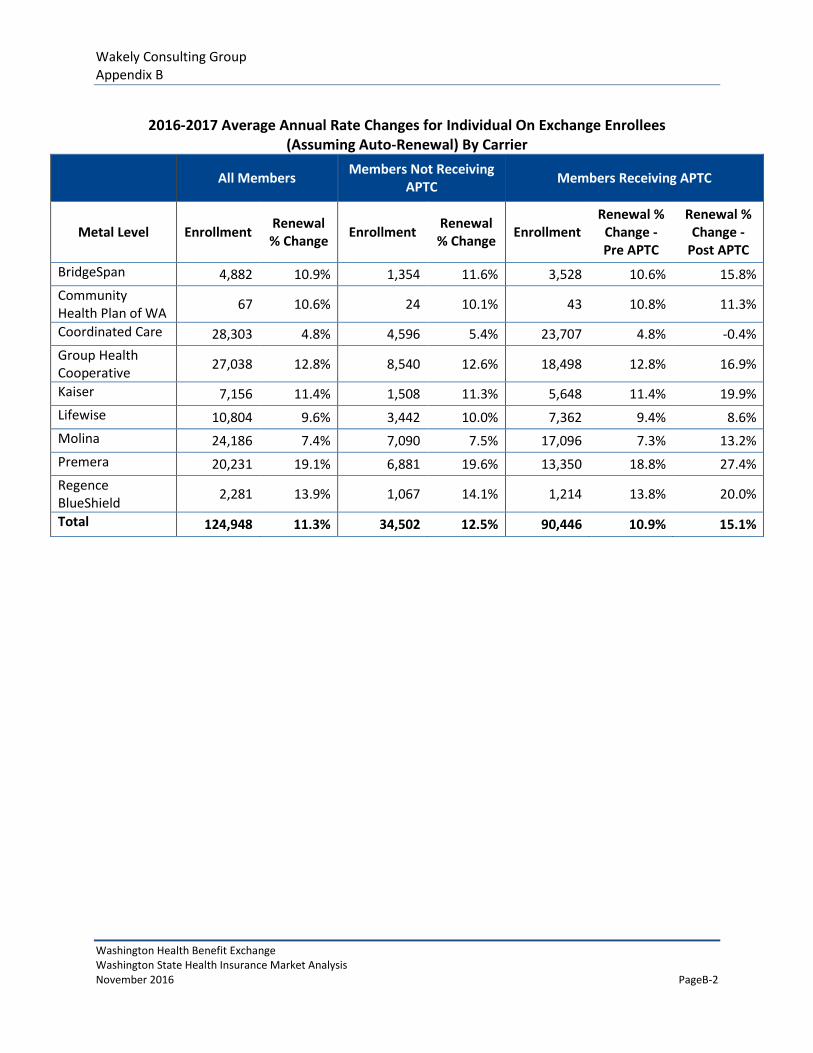
2016-2017 Average Annual Rate Changes for Individual On Exchange Enrollees
(Assuming Auto-Renewal) By Carrier
All Members Members Not Receiving
APTC Members Receiving APTC
Metal Level Enrollment Renewal % Change
Enrollment Renewal % Change
Enrollment Renewal %
Change - Pre APTC
Renewal % Change -
Post APTC
BridgeSpan 4,882 10.9% 1,354 11.6% 3,528 10.6% 15.8%
Community Health Plan of WA
67 10.6% 24 10.1% 43 10.8% 11.3%
Coordinated Care 28,303 4.8% 4,596 5.4% 23,707 4.8% -0.4%
Group Health Cooperative
27,038 12.8% 8,540 12.6% 18,498 12.8% 16.9%
Kaiser 7,156 11.4% 1,508 11.3% 5,648 11.4% 19.9%
Lifewise 10,804 9.6% 3,442 10.0% 7,362 9.4% 8.6%
Molina 24,186 7.4% 7,090 7.5% 17,096 7.3% 13.2%
Premera 20,231 19.1% 6,881 19.6% 13,350 18.8% 27.4%
Regence BlueShield
2,281 13.9% 1,067 14.1% 1,214 13.8% 20.0%
Total 124,948 11.3% 34,502 12.5% 90,446 10.9% 15.1%