Washington Area Compensation and Benefits Association February 21, 2013 Uncertain Economic Times:...
51
Washington Area Compensation and Benefits Association February 21, 2013 Uncertain Economic Times: Impacts on Local DC, MD and VA Employers and Employees Stephen S. Fuller, Ph.D. Dwight Schar Faculty Chair and University Professor Director, Center for Regional Analysis George Mason University
-
Upload
paulina-james -
Category
Documents
-
view
216 -
download
3
Transcript of Washington Area Compensation and Benefits Association February 21, 2013 Uncertain Economic Times:...
Washington Area Compensationand Benefits Association
February 21, 2013
Uncertain Economic Times:Impacts on Local DC, MD and VA
Employers and Employees
Stephen S. Fuller, Ph.D.Dwight Schar Faculty Chair and University Professor
Director, Center for Regional AnalysisGeorge Mason University

The U.S. EconomyRecent Trends and Outlook

0 1 2 3 4 5 6 7 8 9 10 11 12 13 140
5
10
15
20
25
1982-Q31991-Q12001-Q42009-Q2
Quarters After Trough
% C
ha
ng
e in
GD
P
Recession Recovery Patterns of GDPPast Four Recessions
Sources: Bureau of Economic Analysis, GMU Center for Regional Analysis

Components of Post Recession RecoveriesAverage Growth After 14 Quarters
Source: Bureau of Economic Analysis
1982-Q3 1991-Q1 2001-Q4 2009-Q20.0
1.0
2.0
3.0
4.0
5.0
6.05.3
3.32.9
2.1
3.4
2.3 2.1
1.5
0.70.4 0.4
0.10.3
0.7 0.60.8
GDP Personal Consumption Residential Investment Exports
Recession
Avg % Chg

Jan-08
Jan-09
Jan-10
Jan-11
Jan-12
Jan-13
30
35
40
45
50
55
60
65
MfgN-Mfg
ISM Manufacturing and Non-Manufacturing Indices
Source: Institute for Supply Management

20012002
20032004
20052006
20072008
20092010
20112012
2013
-8000
-6000
-4000
-2000
0
2000
4000
Annual Change in Payroll Jobs – USMonth-Over-Year
(000s)
Jan =+ 2.05 M
Source: Bureau of Labor Statistics (Not Seasonally Adjusted), GMU Center for Regional Analysis

U.S. Payroll Job Change by SectorJan 2012 – Jan 2013
Information
Federal Govt.
Transp. & Util.
Other Services
Construction
Wlse Trade
Financial
Manufacturing
Leisure & Hosp.
Retail Trade
Prof. & Bus. Svcs
State & Local Govt
Educ & Health Svcs
-600 -400 -200 0 200 400 600
21
-43
124
61
102
107
107
109
332
213
467
-31
429
(000s) Total = 2,016Ranked by Size in 2011
Source: Bureau of Labor Statistics (Seasonally Adjusted), GMU Center for Regional Analysis

20072008
20092010
20112012
2013
200
250
300
350
400
450
500
550
600
650
700
Initial Claims for Unemployment4-Week Moving Average
Feb 9352.5
Source: Department of Labor
(000s)

Source: Department of Labor
Series1
300
320
340
360
380
400
420
440
460
480
500
20122011 2013
Initial Claims for Unemployment 2011-Present 4-Week Moving Average
Feb 9352.5
(000s)

Jan-
05
Jan-
06
Jan-
07
Jan-
08
Jan-
09
Jan-
10
Jan-
11
Jan-
12
Jan-
134
5
6
7
8
9
10
11
U.S. Unemployment Rate
Source: Bureau of Labor Statistics (Seasonally Adjusted), IHS Global Insight Feb. 11 2013
Jan = 7.9
%
GI FCST12 – 8.113 – 7.714 – 7.315 – 6.616 – 6.217 – 5.918 – 5.7

20
01
20
02
20
03
20
04
20
05
20
06
20
07
20
08
20
09
20
10
20
11
20
12
20
13
20
14
20
15
20
16
20
17
-1
0
1
2
3
4
5
Consumer Prices2001 - 2017
Forecast > > > > >
%
Source: Bureau of Labor Statistics, IHS Global Insight Jan. 7, 2013

Jan-08 Jan-09 Jan-10 Jan-11 Jan-12 Jan-130
20
40
60
80
100
120
140
100
Consumer Confidence
Source: The Conference Board, GMU Center for Regional Analysis
Expectations
Current Situation

Dec-07
Dec-08
Dec-09
Dec-10
Dec-11
Dec-12
3000
3500
4000
4500
5000
5500
6000
6500
7000
200
300
400
500
600
700
800
900
1000
1100
Existing (Left Axis)
New (Right Axis)
U.S. New and Existing Home Sales
(000s) (000s)
Source: National Association of Home Builders (New), National Association of Realtors (Existing)

2007
-1 3
2008
-1 3
2009
-1 3
2010
-1 3
2011
-1 3
2012
-1 3
2013
-1 3
2014
-1 3-10.0
-8.0
-6.0
-4.0
-2.0
0.0
2.0
4.0
6.0
U.S. Gross Domestic ProductQuarterly Change: 2007 – 2014
% Forecast > > > > >
Source: Bureau of Economic Analysis, Global Insight Feb. 11 2013

How did the recession change the
Washington area economy?

US GDP and Washington GRP 1
97
01
97
21
97
41
97
61
97
81
98
01
98
21
98
41
98
61
98
81
99
01
99
21
99
41
99
61
99
82
00
02
00
22
00
42
00
62
00
82
01
0
-4
-2
0
2
4
6
8
10
%
Washington GRP
US GDP

19701975
19801985
19901995
20002005
2010
-80
-40
0
40
80
120
160
Annual Change in JobsWashington Metro Area1,000s
Source: US Bureau of Economic Analysis, GMU Center for Regional Analysis

Wash MSA Payroll Job Change: Private Sector The Great Recession and Recovery To December 2012
Transp. & Util.
Wlse Trade
Manufacturing
Information
Financial
Other Services
Construction
Leisure & Hosp.
Retail Trade
Educ & Health Svcs
Prof. & Bus. Svcs
-80 -70 -60 -50 -40 -30 -20 -10 0
-5
-9
-14
-13
-14
-3
-45
-37
-29
0
-25
(000s)
Source: US Bureau of Labor Statistics (Not Seasonally Adjusted), GMU Center for Regional Analysis
Series1
0 10 20 30 40 50 60 70 80
1
0
0
0
6
1
9
23
13
52
28Total -193 Total 132
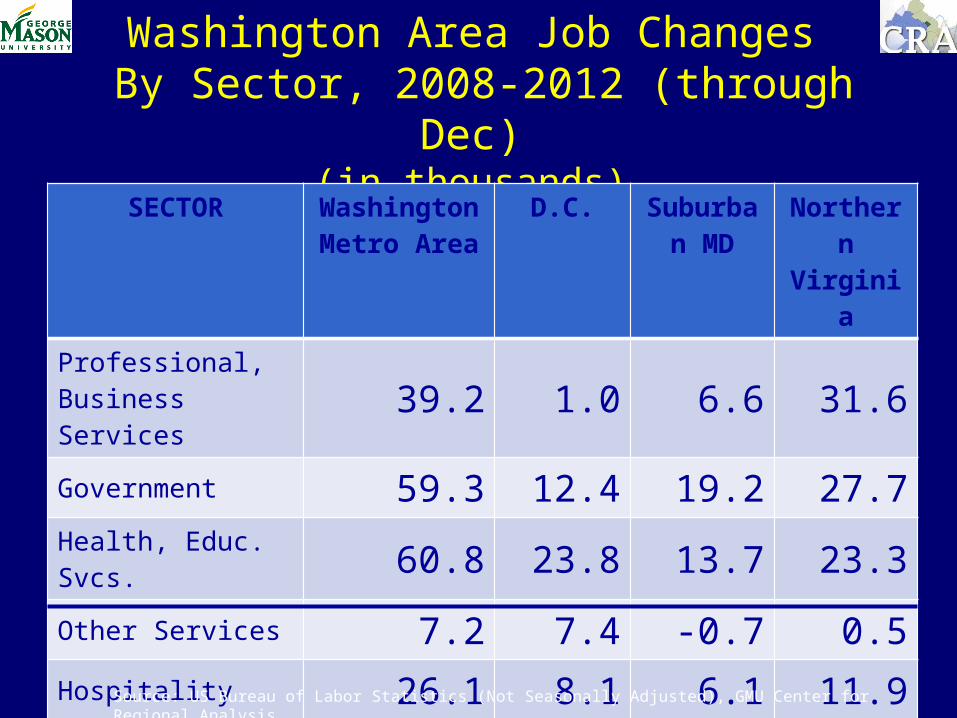
Washington Area Job Changes By Sector, 2008-2012 (through Dec)
(in thousands)
SECTOR Washington Metro Area
D.C. Suburban MD
Northern Virginia
Professional, Business Services 39.2 1.0 6.6 31.6
Government 59.3 12.4 19.2 27.7Health, Educ. Svcs. 60.8 23.8 13.7 23.3Other Services 7.2 7.4 -0.7 0.5Hospitality 26.1 8.1 6.1 11.9All Other -64.8 -4.5 -36.6 -23.7 TOTAL 127.8 48.2 8.3 71.3
Source: US Bureau of Labor Statistics (Not Seasonally Adjusted), GMU Center for Regional Analysis

Annual Job ChangeWashington MSA, 2002-2012
2002200420062008
-80
-60
-40
-20
0
20
40
60
80
100(000s) Annual Data Annual Month over Year
2009 2010 2011 2012
Source: US Bureau of Labor Statistics (Not Seasonally Adjusted), GMU Center for Regional Analysis

16 Large Job MarketsJob Change: Dec 2011 – Dec 2012
New York
Los Angeles
Chicago
DC Dallas
Philadelphia
Houston
Boston
Miam
i
Atlanta
Detroit
SF-Oakland
Minneapolis
Phoenix
Seattle
Baltimore
0
20
40
60
80
100
120
140(000s)
Washington + 30,200
Source: US Bureau of Labor Statistics (Not Seasonally Adjusted), GMU Center for Regional Analysis

Job Change by SectorDec 2011 – Dec 2012
Washington MSA
Transp. & Util.
Wlse Trade
Manufacturing
Information
Financial
Other Services
Construction
Leisure & Hosp.
Retail Trade
State & Local Govt
Educ & Health Svcs
Federal Govt.
Prof. & Bus. Svcs
-20 -15 -10 -5 0 5 10 15 20 25 30
-2
-1
-1
-1
4
0
2
2
-6
12
13
-3
10(000s) Total = 30,200
Source: US Bureau of Labor Statistics (Not Seasonally Adjusted), GMU Center for Regional Analysis

Job Change by SectorNov 2012 – Dec 2012
Washington MSA
Transp. & Util.
Wlse Trade
Manufacturing
Information
Financial
Other Services
Construction
Leisure & Hosp.
Retail Trade
State & Local Govt
Educ & Health Svcs
Federal Govt.
Prof. & Bus. Svcs
-20 -15 -10 -5 0 5 10 15 20 25 30
1
-2
0
0
1
0
-2
0
0
1
-1
1
-2(000s) Total = -1,300
Source: US Bureau of Labor Statistics (Not Seasonally Adjusted), GMU Center for Regional Analysis

Annual Job ChangeDistrict of Columbia, 2002-2012
2002200420062008
-40
-30
-20
-10
0
10
20
30
40
50
60
(000s) Annual Data Annual Month over Year
2009 2010 2011 2012
Source: US Bureau of Labor Statistics (Not Seasonally Adjusted), GMU Center for Regional Analysis

Job Change by SectorDec 2011 – Dec 2012 District of Columbia
Transp. & Util.
Wlse Trade
Manufacturing
Information
Financial
Other Services
Construction
Leisure & Hosp.
Retail Trade
State & Local Govt
Educ & Health Svcs
Federal Govt.
Prof. & Bus. Svcs
-20 -15 -10 -5 0 5 10 15 20 25 30
0
0
0
-1
0
2
1
-1
-1
0
4
-2
-1(000s) Total 1,400
Source: US Bureau of Labor Statistics (Not Seasonally Adjusted), GMU Center for Regional Analysis

Annual Job ChangeSuburban Maryland, 2002-2012
2002200420062008
-40
-30-20
-100
1020
3040
5060
(000s) Annual Data Annual Month over Year
2009 2010 2011 2012
Source: US Bureau of Labor Statistics (Not Seasonally Adjusted), GMU Center for Regional Analysis

Job Change by SectorDec 2011 – Dec 2012Suburban Maryland
Transp. & Util.
Wlse Trade
Manufacturing
Information
Financial
Other Services
Construction
Leisure & Hosp.
Retail Trade
State & Local Govt
Educ & Health Svcs
Federal Govt.
Prof. & Bus. Svcs
-20 -15 -10 -5 0 5 10 15 20 25 30
0
-1
-1
0
-1
0
2
2
0
2
3
-2
8(000s) Total 12,600
Source: US Bureau of Labor Statistics (Not Seasonally Adjusted), GMU Center for Regional Analysis

Annual Job ChangeNorthern Virginia, 2002-2012
2002200420062008
-40
-30
-20
-10
0
10
20
30
40
50
60
(000s) Annual Data Annual Month over Year
2009 2010 2011 2012
Source: US Bureau of Labor Statistics (Not Seasonally Adjusted), GMU Center for Regional Analysis

Job Change by SectorDec 2011 – Dec 2012
Northern Virginia
Transp. & Util.
Wlse Trade
Manufacturing
Information
Financial
Other Services
Construction
Leisure & Hosp.
Retail Trade
State & Local Govt
Educ & Health Svcs
Federal Govt.
Prof. & Bus. Svcs
-20 -15 -10 -5 0 5 10 15 20 25 30
0
0
0
-1
5
0
-3
1
2
8
5
0
4(000s) Total 20,600
Source: US Bureau of Labor Statistics (Not Seasonally Adjusted), GMU Center for Regional Analysis

Dec-05
Dec-06
Dec-07
Dec-08
Dec-09
Dec-10
Dec-11
Dec-12
0
2
4
6
8
10
12
14
8.6 – DC7.8 – U.S.
5.7 – SMD5.2 – MSA4.1 - NVA
Unemployment Rates in the WMSABy Sub-State Area, 2005-2012
Source: US Bureau of Labor Statistics (Region - Not Seasonally Adjusted, US – Seasonally Adjusted)

Metro Area ComparisonsJob Change Dec 2010 – Dec 2012
15 Largest Metro Areas
PhiladelphiaMiami
DetroitMinneapolis
Boston
ChicagoAtlantaSeattle
SF-OaklandPhoenix
Los AngelesDallas
HoustonNew York
-100 -50 0 50 100 150 200
1925
3944
525761
72767677
118130
161192
(000s)
Source: US Bureau of Labor Statistics (Not Seasonally Adjusted), GMU Center for Regional Analysis
WASHINGTON

Key Conditions Shaping the Future
Washington Area Economy:
Declining Federal SpendingWage and Salary Compression
Population Change
1980
1982
1984
1986
1988
1990
1992
1994
1996
1998
2000
2002
2004
2006
2008
2010
0
10
20
30
40
50
60
70
80
90
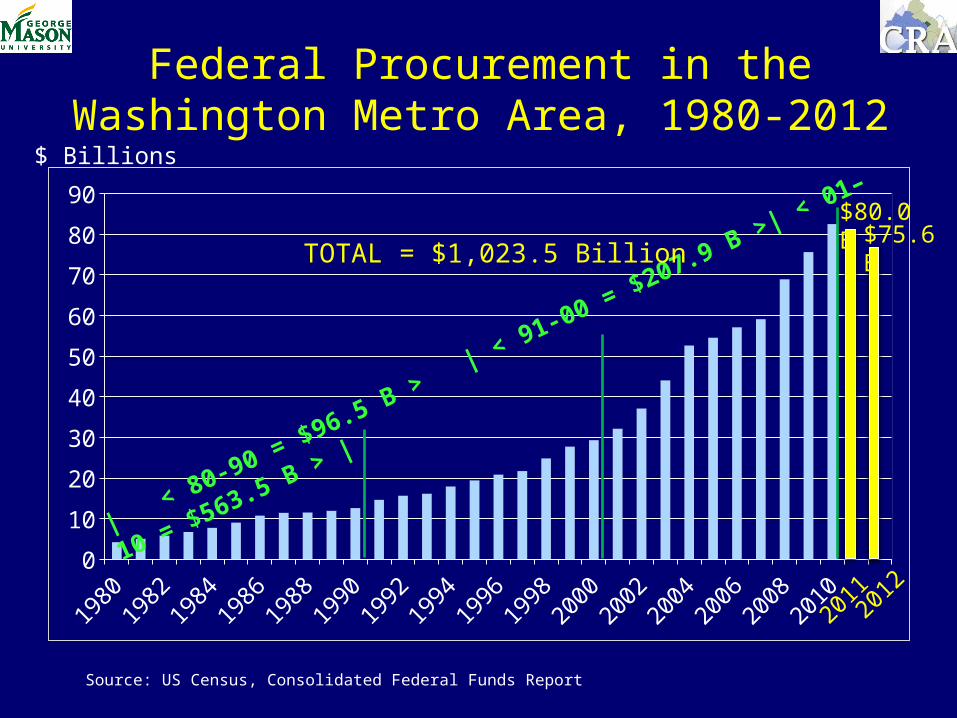
Federal Procurement in theWashington Metro Area, 1980-2012
$ Billions
| < 80-90 = $96.5 B > |
< 91-00 = $207.9 B >| < 01–10 = $563.5 B > |
TOTAL = $1,023.5 Billion
Source: US Census, Consolidated Federal Funds Report
2011
$80.0 B$75.6 B
2012

Federal GovernmentWashington MSA
2002
2005
Jan
Apr
Jul
Oct
Jan
Apr
Jul
Oct
Jan
Apr
Jul
Oct
Jan
Apr
Jul
Oct
Jan
Apr
Jul
Oct
-20
-15
-10
-5
0
5
10
15
20
25
30
(000s) Annual Data Annual Month over Year
2008 2009 2010 2011 2012
Source: U.S. Bureau of Labor Statistics (Not Seasonally Adjusted), GMU Center for Regional Analysis

Summary for Federal Spending Trends in the Washington Metropolitan Area, 2010-2012
• Federal Procurement Outlays declined 8.4% between FY 2010 and FY 2012.
• Federal employment has declined since peaking in July 2010, losing 8,700 jobs or 2.25%.
• Federal payroll declined by 0.6% between FY 2010 and FY 2011 and will continue to decline as the workforce shrinks and older workers retire and are replaced by younger workers.

Sources: Reuters, GMU Center for Regional Analysis
Average Income LevelsIn the Washington Metropolitan Area, 1990
10 -
20K
20 -
30K
30 -
40K
40 -
50K
50 -
60K
60 -
70K
70 -
80K
80 -
90K
90 -
100K
110K
+0%
5%
10%
15%
20%
25%
30%
1990 Income (in 2011 dollars)% of Workers

Sources: Reuters, GMU Center for Regional Analysis
Average Income LevelsIn the Washington Metropolitan Area, 2010
10 -
20K
20 -
30K
30 -
40K
40 -
50K
50 -
60K
60 -
70K
70 -
80K
80 -
90K
90 -
100K
110K
+-5%
0%
5%
10%
15%
20%
25%
30%
2010 Income (in 2011 dollars)% of Workers

The Changing Income Pattern in theWashington Area, 1990 and 2010(percent share, inflation adjusted $s)
Income Range 1990 2010
$10K-$50K 44% 44%
$50K-$70K 31% 14%
$70K-$90K 20% 2%
$90K and above 4% 39%
Source: Reuters, GMU Center for Regional Analysis

Changing Job and Income PatternsIn the Washington Metropolitan Area
Source: US Bureau of Labor Statistics, GMU Center for Regional Analysis
Oct-2002 to Oct-2007 Oct-2007 to Oct-20120
20
40
60
80
100
120
140
115.6
22.735.5
53.4
Professional & Business Services
Education & Health Services$$$$ $$ $$ $$ $$ $$ $$ $2011 Avg.
Annual Pay
$92.2K
$50.7K

2008 2009 2010 2011 3,780
3,800
3,820
3,840
3,860
3,880
3,900
3,920
72.0
73.0
74.0
75.0
76.0
77.0
78.0
3,861
3,827
3,849
3,906
74.0
75.3
77.4
76.6
Jobs Earnings Per Employee
Early Signs of Income CompressionWashington MSA
Source: US Bureau of Economic Analysis, GMU Center for Regional Analysis
(in thousands) (in thousands, 2011 dollars)
Jobs
Earnings P
er Em
ployee

The Washington Metropolitan AreaPopulation Is Aging
(percent share, total population in millions)
Age Group 2012 2017 2029 ChangeLess than 25 years 32.7% 32.0% 31.5% 17.2%
25 to 44 years old 30.2 30.0 29.5 19.5%
45 to 64 years old 26.6 25.3 23.3 6.8%
65 years old + 10.5% 12.7% 15.7% 82.4%
Totals 5.810 6.213 7.087 22.0%
Source: IHS Global Insight, GMU Center for Regional Analysis

The Outlook for the WashingtonArea Economy: 2012-2017

Job Growth in the Washington AreaBy Sector, 2012-2017 (in thousands)
Sector 2012 2017 Change Percent
Prof. & Bus. Ser. 697.4 841.2 143.8 20.6
Federal Gov’t 380.4 358.4 - 22.0 - 5.8
Education/Health 380.2 419.0 38.8 10.2
S & L Gov’t 309.7 321.6 11.9 3.8
Hospitality 276.8 285.0 8.2 3.0
Retail Trade 254.1 266.6 12.5 4.9
Other Services 182.8 185.3 2.5 1.4
Financial Services 150.0 154.7 4.7 3.1
Construction 146.4 201.8 55.4 37.8
Information Ser. 80.6 87.6 7.0 8.7
Other Sectors (3) 175.0 193.2 18.2 10.4
Total Jobs 3,033.4 3,314.4 281.0 9.3

Major Sources of Job Growth in theWashington Area , 2012-2017 (in thousands)
Growth Sectors 2012 2017 Change Percent
Prof. & Bus. Ser. 697.4 841.2 143.8 20.6
Education/Health 380.2 419.0 38.8 10.2
Construction 146.4 201.8 55.4 37.8
Sub-Totals 1,224.0 1,462.0 238.0 19.4
% Total 40.4 44.1 84.7_________
Totals 3,033.4 3,314.4 281.0 9.3
Sources: IHS Global Insight; GMU Center for Regional Analysis

GRP Per Job in the Washington Area By Sector (in 2005 dollars)
Sector 2012 2017 % Change
Prof. & Bus. Services $134,750 $154,656 14.8%
Federal Gov’t 138,361 138,566 0.1
Education/Health 59,730 57,508 - 3.7
S & L Gov’t 60,975 56,920 - 6.6
Hospitality 42,883 42,391 - 1.1
Retail Trade 60,807 64,136 5.5
Other Services 70,339 69,151 - 1.7
Financial Services 543,482 578,062 6.4
Construction 98,824 82,490 - 16.5
Information Services 349,868 468,376 33.9
Other Sectors 147,903 151,120 2.2
GRP per Job $130,653 $138,881 6.3

GRP Per Job in the Washington Area By Sector (in 2005 dollars)
High Job Growth 2012 2017 % Change
Prof. & Bus. Svs. (20.6%) $134,750 $154,656 14.8
Education/Health (10.2%) 59,730 57,508 - 3.7
Construction (37.8%) 98,824 82,490 - 16.5
Other High Value-Added Sectors
Information Services (8.7%) 349,868 468,376 33.9
Financial Services (3.1%) 543,482 578,062 6.4
Federal (-5.8%) 138,361 138,566 0.1
Wholesale Trade (8.9%) 183,006 191,884 4.8
Transport/Warehsg (16.1%) 138,768 135,938 - 2.0
GRP per Job $130,653 $138,881 6.3

Indicator 2012 2017 Change
GRP Growth $450.9 $571.8 26.8%
Net Job Growth 3,915.3 4,271.5 356.29.1%
Replacement Job Growth 459.1 11.7%
Resident Workforce 3,203.1 3,427.9 224.8
7.0%
GRP, Job and Workforce Growth in theWashington Metropolitan Area, 2012 – 2017
(in billions of current $s, jobs in thousands)

Occupation Total Openings % of Total % Change
Sales Occupations 92,556 11.4 22.2
Business and Financial 89,058 10.9 23.3
Office Admin Support 85,320 10.5 17.7
Food Prep & Serving 60,652 7.4 26.2
Management Occupations 59,203 7.3 18.2
Computer, Math and Sci 55,059 6.8 23.3
Health Care (all) 53,594 6.6 22.9
Education & Training 42,952 5.3 21.1
Personal Care Occup. 42,371 5.2 26.9
Totals 580,765 71.2 21.8
Washington Metropolitan Area: Major Sources of Workforce Growth
2012-2017

Occupation Net New % of Total % Change
Business and Financial 52,253 14.7 13.7
Computer, Math and Sci 33,630 9.4 14.2
Health Care (all) 31,915 9.0 13.7
Office Admin Support 30,334 8.5 6.3
Sales & Related Occup. 29,246 8.2 7.0
Personal Care Occup. 23,892 6.7 15.2
Management Occupations 22,964 6.4 7.1
Education & Training 21,642 6.1 10.6
Totals 224,234 63.0 10.0
Source: EMSI Inc., GMU Center for Regional Analysis
Washington Metropolitan Area: Major Sources of Net New Jobs
2012-2017

Educational Level All Jobs Net New Replace
ment
Bachelor’sor more
34.1%278,163
40.6%144,518
29.1%133,645
Associate’s 4.3%35,458
5.1%18,341
3.7%17,117
HS/Voc. Ed. GED/OJT
61.4%500,373
54.1%192,827
67.0%307,546
Educational Levels of Net New and Replacement Jobs in the Washington
Metropolitan Area, 2012 – 2017

Thank You Questions
cra.gmu.edu