WASBO 2011 T.J Kelly and Calvin Brodie - OSPI ABC’ S O F T HE N EW F UNDING FORMULA.
38
ABC’S OF THE NEW FUNDING FORMULA
-
Upload
karen-mcdaniel -
Category
Documents
-
view
215 -
download
1
Transcript of WASBO 2011 T.J Kelly and Calvin Brodie - OSPI ABC’ S O F T HE N EW F UNDING FORMULA.

ABC’S OF THE NEW FUNDING FORMULA

AGENDA
Prototypical Funding Model An Overview
Session Changes
Working Model for district usage
Required Comparison
Your Questions & Our Answers

PROTOTYPICAL MODEL - OVERVIEW
A full Presentation is available on our website at www.k12.wa.us/safs/ under the SHB2776 link.
We have provided 23 training sessions to groups of Business Managers, Superintendents, Skills Centers & CTE directors, Personnel and Others.
The following are NINE reference slides to keep handy.

NEW FUNDING STRUCTURE
The new funding structure breaks out into the three major functional areas of a school district:
Schools (12 Job Duties)
District-wide Support (3 job Duties)
Administration (Admin or Classified)
Provides formula detail of staffing units.
Non employee funding provides detail.

WHAT IS THE ASSUMPTION OF
SCHOOL SIZE?
Category Elementary(K-6)
Middle(7-8)
High(9-12)
Base Enrollment 400 432 600
• In reality, school configurations vary widely and are not generally consistent with the Prototype model.
• Your school sizes WILL be different.

WHAT IS THE ASSUMED CLASS SIZE ?
Grade Level Class Size(Basic Ed)
Class Size(High Poverty School)
Grades K-3 25.23 See Budgets
Grade 4 27.00 Not Defined
Grades 5-6 27.00 Not Defined
Grades 7-8 28.53 Not Defined
Grades 9-12 28.74 Not Defined
CTE 7-8 26.57 SameCTE 9-12 – (Exploratory & Preparatory)
26.57 Same
Skills Centers 22.76 Same
Lab Science Not Defined Same
Advanced Placement Not Defined Same
International Baccalaureate Not Defined Same
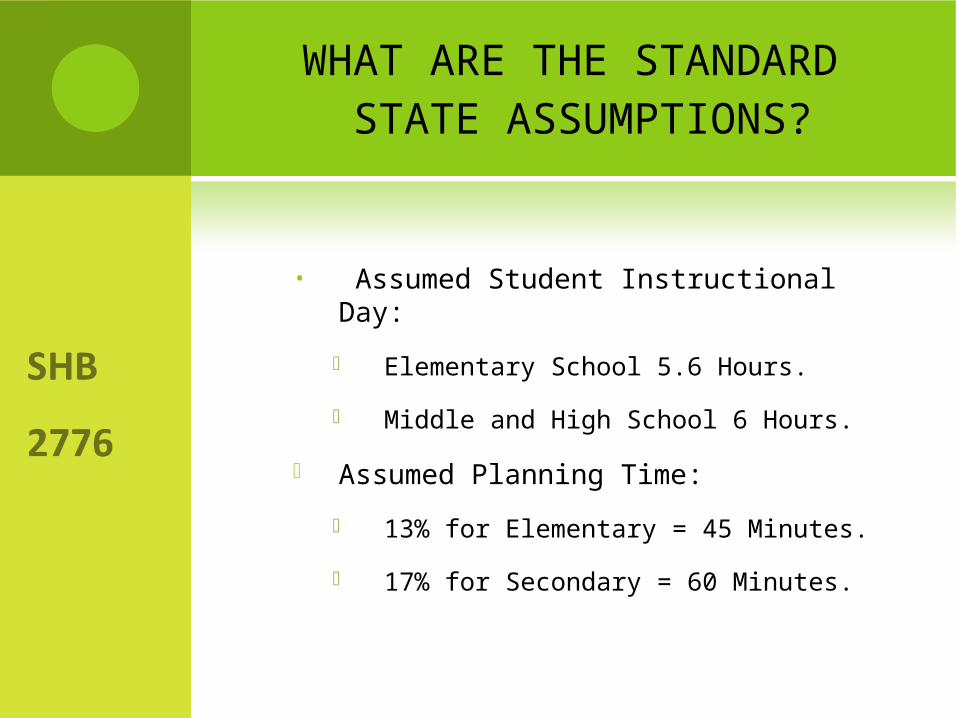
WHAT ARE THE STANDARD STATE ASSUMPTIONS?
• Assumed Student Instructional Day:
Elementary School 5.6 Hours.
Middle and High School 6 Hours.
Assumed Planning Time:
13% for Elementary = 45 Minutes.
17% for Secondary = 60 Minutes.

SCHOOL LEVEL TEACHERS
Grade Level Class Size(Basic Ed)
Students Planning Time
Assumption
Funded Teachers
Grades K-3 25.23 400 15.5% 18.31
Grade 4 27.00 400 15.5% 17.11
Grades 5-6 27.00 400 15.5% 17.11
Grades 7-8 28.53 432 20% 18.17
Grades 9-12 28.74 600 20% 25.05
CTE 7-8 26.57 100 20% 4.52
CTE 9-12 26.57 100 20% 4.52
Skills Centers 22.76 100 20% 5.27
Lab Science Not Defined Not Defined
AP/IB Not Defined Not Defined
itsTeacher Un FundedPlanning1Size Class
Students
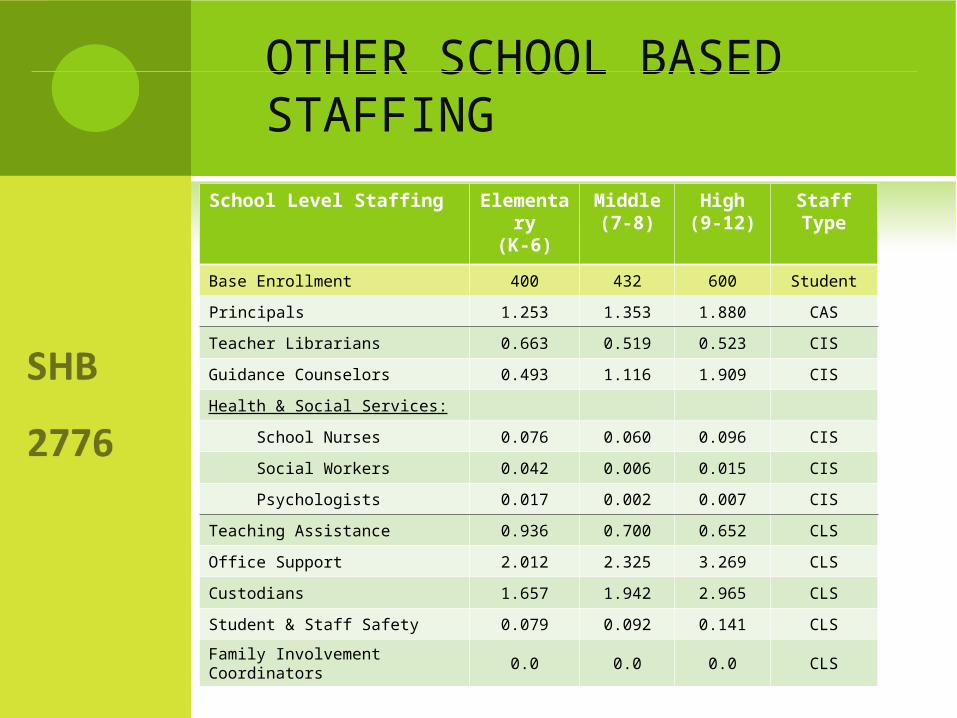
OTHER SCHOOL BASED STAFFING
School Level Staffing Elementary(K-6)
Middle(7-8)
High(9-12)
Staff Type
Base Enrollment 400 432 600 Student
Principals 1.253 1.353 1.880 CAS
Teacher Librarians 0.663 0.519 0.523 CIS
Guidance Counselors 0.493 1.116 1.909 CIS
Health & Social Services:
School Nurses 0.076 0.060 0.096 CIS
Social Workers 0.042 0.006 0.015 CIS
Psychologists 0.017 0.002 0.007 CIS
Teaching Assistance 0.936 0.700 0.652 CLS
Office Support 2.012 2.325 3.269 CLS
Custodians 1.657 1.942 2.965 CLS
Student & Staff Safety 0.079 0.092 0.141 CLS
Family Involvement Coordinators 0.0 0.0 0.0 CLS
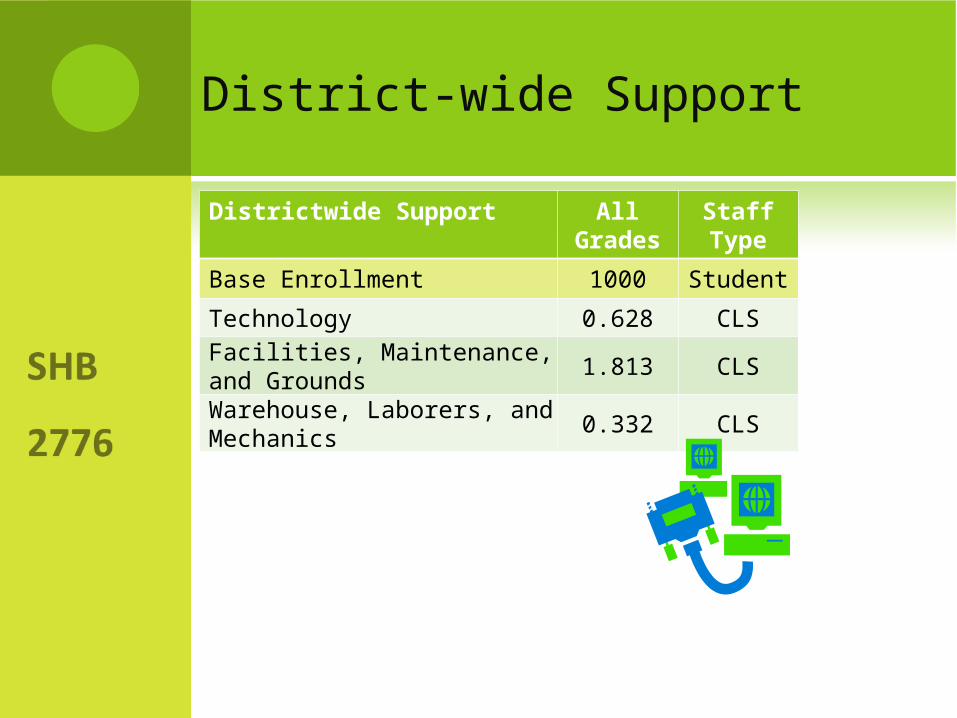
Districtwide Support All Grades Staff Type
Base Enrollment 1000 Student
Technology 0.628 CLSFacilities, Maintenance, and Grounds 1.813 CLS
Warehouse, Laborers, and Mechanics 0.332 CLS
District-wide Support

Career and Technical Education Middle High Staff Type
Base Enrollment 100 100 Student
Certificated Administration Not DefinedNot Defined CAS
Teachers 4.516 4.516 CIS
Other Certificated Support Not DefinedNot Defined CIS
CTE and Skills Centers
Skills Center Staffing High Staff Type
Base Enrollment 100 Student
Certificated Administration Not Defined CAS
Teachers 5.272 CIS
Other Certificated Support Not Defined CIS

CENTRAL ADMINISTRATION
Central Administration Percent Staff Type
Total Central Admin Staff 5.3%Percent Certificated Administrators 25% CAS
Percent Classified 75% CLS
• Central Administration is 5.3% of staffing units generated as K-12 teachers, School Level Staffing, and Districtwide Support.
• The Central Administration percentage is NOT applied to enhancements. Examples include: Poverty, Lab Science, AP/IB, CTE, Skills Centers, or Categorical Program Staffing.

MSOC TARGETED VALUES
Materials, Supplies, and Operating Costs Per Student Starting $$
Target Values 2015-16 SY
Total MSOC per Student FTE $517.91 $1,082.76
Technology $54.43 $113.80
Utilities and Insurance $147.90 $309.21
Curriculum and Textbooks $58.44 $122.17
Other Supplies and Library Materials $124.07 $259.39
Instructional Professional Development for Certificated and Classified Staff $9.04 $18.89
Facilities Maintenance $73.27 $153.18
Security and Central Office $50.76 $106.12

WHAT CHANGES HAS THE LEGISLATURE PROPOSED?

LEGISLATIVE SCORECARD
HIGH POVERTY CLASS SIZE:
House – Reduced for grade K-3 to 24.23 for high poverty schools only and included this as Basic Education. $25,000,000.
Senate: Reduced K-3 Class Size to 22.76 for high poverty schools, but failed to define this as basic education. $64,330,000.
Both utilized a 50% poverty threshold.
LEGISLATIVE SCORECARD
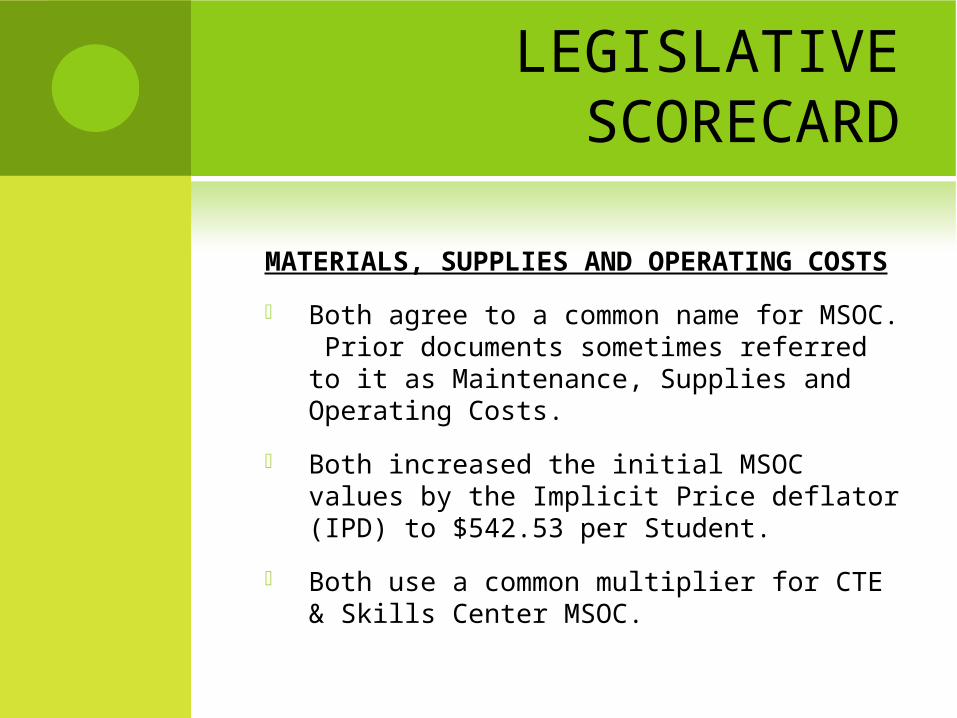
MATERIALS, SUPPLIES AND OPERATING COSTS
Both agree to a common name for MSOC. Prior documents sometimes referred to it as Maintenance, Supplies and Operating Costs.
Both increased the initial MSOC values by the Implicit Price deflator (IPD) to $542.53 per Student.
Both use a common multiplier for CTE & Skills Center MSOC.
LEGISLATIVE SCORECARD
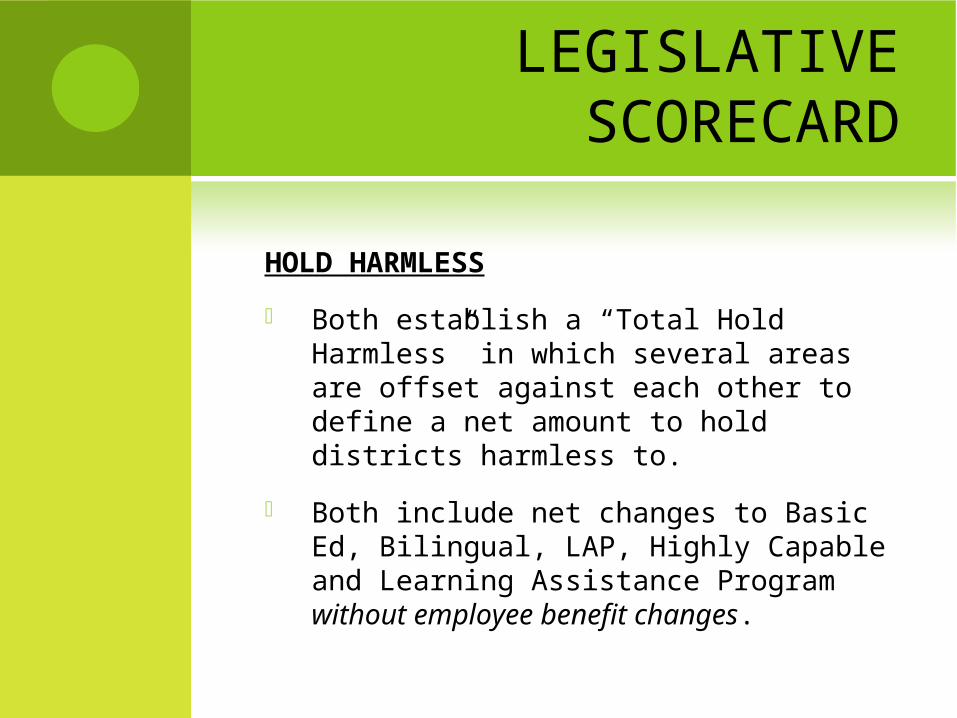
HOLD HARMLESS
Both establish a “Total Hold Harmless” in which several areas are offset against each other to define a net amount to hold districts harmless to.
Both include net changes to Basic Ed, Bilingual, LAP, Highly Capable and Learning Assistance Program without employee benefit changes.

LEGISLATIVE SCORECARD
HOLD HARMLESS
House budgets $19.2 - includes K-3 High-Poverty class-size changes and MSOC.
Senate Budgets $41.5 - does not includes K-3 High Poverty class-size changes or MSOC.

LEGISLATIVE SCORECARD
Central Administration Percent Staff Type
Total Central Admin Staff 5.3%Percent Certificated Administrators 25.47% CAS
Percent Classified 74.53% CLS
LEGISLATIVE SCORECARD
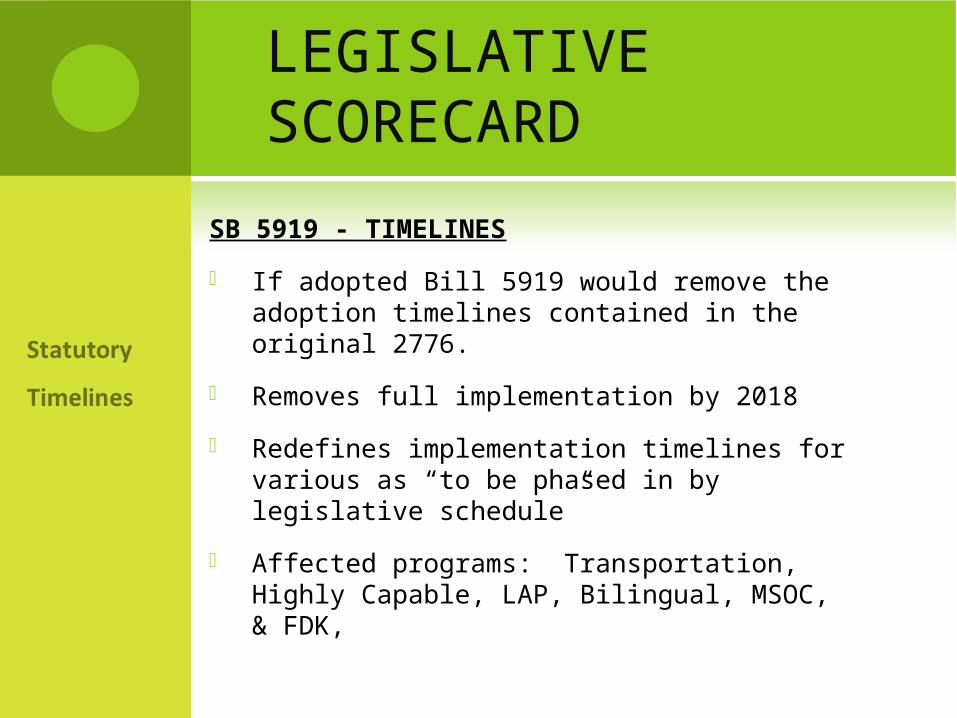
SB 5919 - TIMELINES
If adopted Bill 5919 would remove the adoption timelines contained in the original 2776.
Removes full implementation by 2018
Redefines implementation timelines for various as “to be phased in by legislative schedule”
Affected programs: Transportation, Highly Capable, LAP, Bilingual, MSOC, & FDK,

CTE AND SKILLS CENTERS
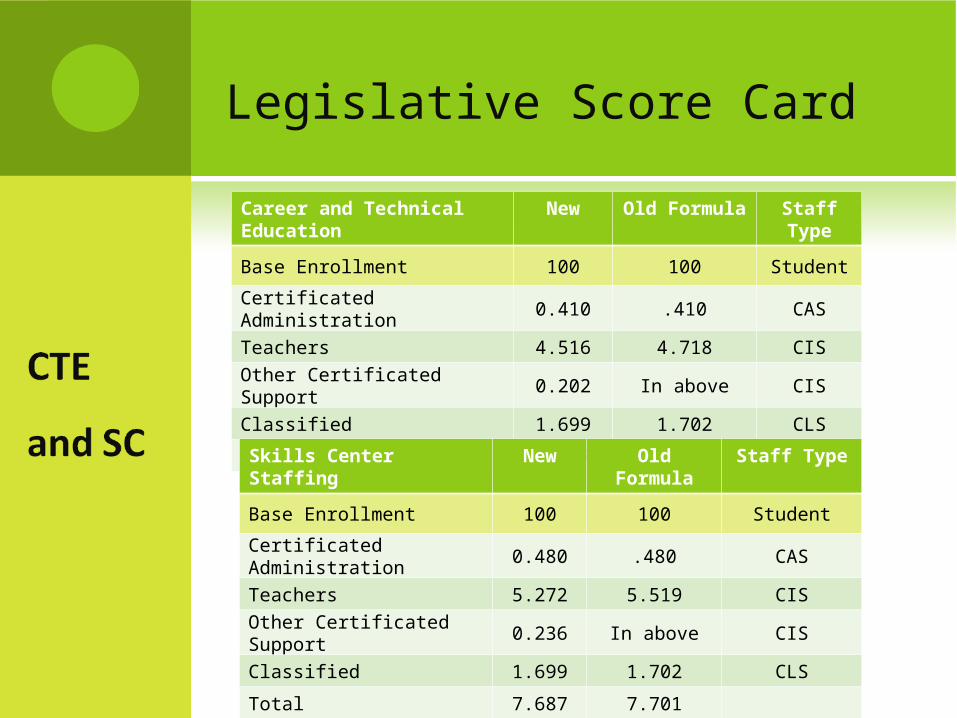
Career and Technical Education New Old Formula Staff Type
Base Enrollment 100 100 Student
Certificated Administration 0.410 .410 CAS
Teachers 4.516 4.718 CIS
Other Certificated Support 0.202 In above CIS
Classified 1.699 1.702 CLS
Total 6.827 6.830
Legislative Score Card
Skills Center Staffing New Old Formula Staff Type
Base Enrollment 100 100 Student
Certificated Administration 0.480 .480 CAS
Teachers 5.272 5.519 CIS
Other Certificated Support 0.236 In above CIS
Classified 1.699 1.702 CLS
Total 7.687 7.701

Materials, Supplies, and Operating Costs CTE Skills Centers
Total MSOC per Student FTE $1,334.08 $1,186.51
Technology $140.21 $124.70
Utilities and Insurance $380.97 $338.83
Curriculum and Textbooks $150.54 $133.89
Other Supplies and Library Materials $319.06 $284.24
Instructional Professional Development for Certificated and Classified Staff $23.29 $20.71
Facilities Maintenance $188.73 $167.85
Security and Central Office $130.75 $116.28
Legislative Scorecard

LEGISLATIVE SCORECARD
Anything I’ve Missed??

ETC. ETC. ETC

Lots of confusion around the planning factor.
Legislation addresses the planning factor.
The budgeted elementary factor of 13.42 % for planning time creates a increase multiplier for teachers of 1.155
The budgeted middle and high planning time of 16.67% creates an increase multiplier for teachers of 1.20.
PLANNING TIME

Elementary Middle High
(1) Prototypical Enrollment 400.00 432.00 600.00
(2) Class Size (Assume K-3 for elementary) 25.23 28.53 28.74
(3) # Teachers Required with no Planning (1) / (2) 15.85 15.14 20.88
(4) Assumed Instructional Day 5.60 6.00 6.00
(5a) Planning Time (assumed) 0.75 1.00 1.00
(5b) Budget Bill Assumption (5a) / (4) 13.42% 16.67% 16.67%
(6) Assumed instructional time per teacher (4)*(1- (14) ) 4.85 5.00 5.00
(7) # class hours (3) * (4) 88.78 90.85 125.26
(8) Number of Teachers Required With Planning Time Inc (7) / (6) 18.31 18.17 25.05
(9) Staffing multiplier to be used for planning (8) / (3) 1.155 1.20 1.20
PLANNING TIME ALGORITHM

WORKING MODEL FOR DISTRICTS
Have had several requests to create a simple working model for districts to use in building their own projections and or to incorporate into their local excel models.
This is on our work list however may be awhile. When available to It will be found at: www.k12.wa.us/safs SHB 2776 link.
COMPARISON MODEL
Legislation requires a comparison model between funded staffing and actual staffing by school.
To be generated by OSPI in February based upon S-275 reporting.
Current examples on our website.

COMPARISON MODEL- DETAILS
School Level enrollment must be taken from CEDARS.
It will be transmogrified to FTE using district level FTE to HC from P-223.
Staffing Information will be from S-275.
Model will show a comparison between the funded staff units and funded salary dollars versus the actual staff units and actual salary costs.

S-275 CHANGES
The S-275 will require changes to align the reported duty codes and job description to the prototype model.
More information to be provided this summer.

ACCOUNTING SYSTEMS
For 2011-12 additional activity codes have been added to address:
31 - Professional development of instructional staff
32 - Instructional Technology (Computers)
Further changes are anticipated for 2012-13
To assist with transition and training the SHB 2776 format of the F-203X has been available since January.
As of April 26th, 192 Districts have created 404 F-203X estimates.
Highest number of estimates for one district = 14.
Most optimistic named estimate - “Final Budget.”
103 have not created any estimate!
F-203X SYSTEM USAGE

F-203 will be programmed and released after the legislature passes a budget.
If the legislature runs late . . . . . school district budget timelines may prompt action before this.
Districts may have to use the F-203X for initial budget preparations for July proposed budget release.
The F-203 would have to be completed to accompany final filing to OSPI.
BUDGET ADOPTION F-203 OR F-203X ??
KNOWN F-203X DEFICIENCIES
CTE Classified Staff ratio generates 2.536 less FTE than current law. This has impact on minimum expenditures within the CTE program.
Missing Data on the 1191 ED – applied only to item codes D57 and D58.
Small Schools/Remote and Necessary bonus calculations not accounting for all units.
BEA MSOC rate changes not impacting item codes Z246 and Z245.
CIS benefit calculation using partial rate.

F-203X AND F-203 CAPACITY
Policy Decision/Area of Funding Y/N
Hold Harmless – Governor’s Proposal Y
MSOC changes for IPD inflation Y
Central Admin Staffing Percentage Changes Y
Hold Harmless – Senate and House Proposals N
K-3 High Poverty Reduction of Class Size N

A BALANCING ACT
System Development Recap.
F-203 / F-203X
Apportionment
Development of various ancillary Excel models to support 2011-12 school funding calculation and payments.

OPEN QUESTIONS???