
Wachovia Securities 2006 Media and Communications Conference
21
Wachovia Securities 2006 Media and Communications Conference May 24, 2006
-
Upload
conan-ramirez -
Category
Documents
-
view
29 -
download
0
description
Wachovia Securities 2006 Media and Communications Conference. May 24, 2006. - PowerPoint PPT Presentation
Transcript of Wachovia Securities 2006 Media and Communications Conference

Wachovia Securities2006 Media and Communications
Conference
May 24, 2006

2
Caution Concerning Forward Looking Statements and Non-GAAP Financial Measures
This presentation contains certain forward-looking statements relating to future events and This presentation contains certain forward-looking statements relating to future events and Mediacom’s future financial performance. These forward-looking statements are subject to risks Mediacom’s future financial performance. These forward-looking statements are subject to risks and uncertainties that could cause actual results to differ materially from historical results or those and uncertainties that could cause actual results to differ materially from historical results or those anticipated. Factors that could cause actual results to differ from those contained in the forward-anticipated. Factors that could cause actual results to differ from those contained in the forward-looking statements include: competition in the video, high-speed Internet access and telephone looking statements include: competition in the video, high-speed Internet access and telephone businesses; Mediacom’s ability to achieve anticipated customer and revenue growth and to businesses; Mediacom’s ability to achieve anticipated customer and revenue growth and to successfully introduce new products and services; increasing programming costs; changes in laws successfully introduce new products and services; increasing programming costs; changes in laws and regulations; Mediacom’s ability to generate sufficient cash flow to meet its debt service and regulations; Mediacom’s ability to generate sufficient cash flow to meet its debt service obligations and to access capital to maintain its financial flexibility; and the other risks and obligations and to access capital to maintain its financial flexibility; and the other risks and uncertainties described in the reports and documents Mediacom files from time to time with the uncertainties described in the reports and documents Mediacom files from time to time with the Securities and Exchange Commission. Mediacom assumes no obligation to update or alter these Securities and Exchange Commission. Mediacom assumes no obligation to update or alter these forward-looking statements, whether as a result of new information, future events or otherwise, forward-looking statements, whether as a result of new information, future events or otherwise, except as otherwise required by law.except as otherwise required by law.
This presentation may include financial measures which are not determined in accordance with This presentation may include financial measures which are not determined in accordance with generally accepted accounting principles (GAAP) in the United States. Any applicable generally accepted accounting principles (GAAP) in the United States. Any applicable reconciliation of historical non-GAAP financial measures included in this presentation to the most reconciliation of historical non-GAAP financial measures included in this presentation to the most directly comparable GAAP financial measures is available at the Press Releases link in the Investor directly comparable GAAP financial measures is available at the Press Releases link in the Investor Relations section of the Company’s website at www.mediacomcc.com. Relations section of the Company’s website at www.mediacomcc.com.

3
Mark StephanMark Stephan
Executive VP and Chief Financial OfficerExecutive VP and Chief Financial Officer

4
Mediacom Today
Improving basic subscriber trendImproving basic subscriber trend
Expanding RGU penetrationExpanding RGU penetration
Delivering solid operating performanceDelivering solid operating performance
Maintaining financial flexibilityMaintaining financial flexibility

5
2006 Objectives
Scaling of phoneScaling of phone Add 1 million marketable homes by Add 1 million marketable homes by
YE 2006 (reaching 87% of total) YE 2006 (reaching 87% of total)
Realize triple-play pull through across Realize triple-play pull through across all products all products
Retention of 2005 discounted customersRetention of 2005 discounted customers Exceeding expectations YTDExceeding expectations YTD
Cost controlsCost controls Capture operating efficienciesCapture operating efficiencies

6
Potential Upside in Pull Through Effect
18%
23%
0%
10%
20%
30%
40%
50%
Mediacom MSO Average (1)
Data Penetration% of HP
35%
49%
0%
10%
20%
30%
40%
50%
Mediacom MSO Average (1)
Digital Penetration% of basic
(1) Weighted average of Comcast, Time Warner, Charter, Adelphia, Cablevision and Insight. Source: Public information.
Q1 2006Q1 2006

7
Orders per Month
Usage Rates
Over 1,200 hoursOver 1,200 hoursof contentof content
Competitive Advantage
No equipment toNo equipment to purchase purchase
No contractNo contract
Low entry priceLow entry price
Our advantage today: Our advantage today: local broadcast local broadcast channels channels
Up to 16 HD channelsUp to 16 HD channels
44%
40%
April 2005 April 2006
3.8 million3.8 million
1.9 million1.9 million
ONDEMAND

8
Enhanced High-Speed Data Product
Mediacom OnlineMax: 10 MbpsMediacom OnlineMax: 10 Mbps Free wireless routerFree wireless router Free premium contentFree premium content

9
RGU Rebound
123,000
52,000
15,000
196,000
52,000
FY 2002 FY 2003 FY 2004 FY 2005 Q1 2006
RGU AddsRGU Adds
Penetration of Penetration of Homes PassedHomes Passed 79.3%79.3% 80.1%80.1% 79.7%79.7% 86.1%86.1% 87.9% 87.9%

10
Mediacom Phone Rollout
1.6 million 1.6 million homes homes
marketed Q1 marketed Q1 20062006
0.9 million 0.9 million additional additional homes by homes by YE 2006YE 2006
Total homes passed = 2.8 millionTotal homes passed = 2.8 millionMediacom Phone CustomersMediacom Phone Customers
0
46,000
Q2 2005 Q1 2006
11
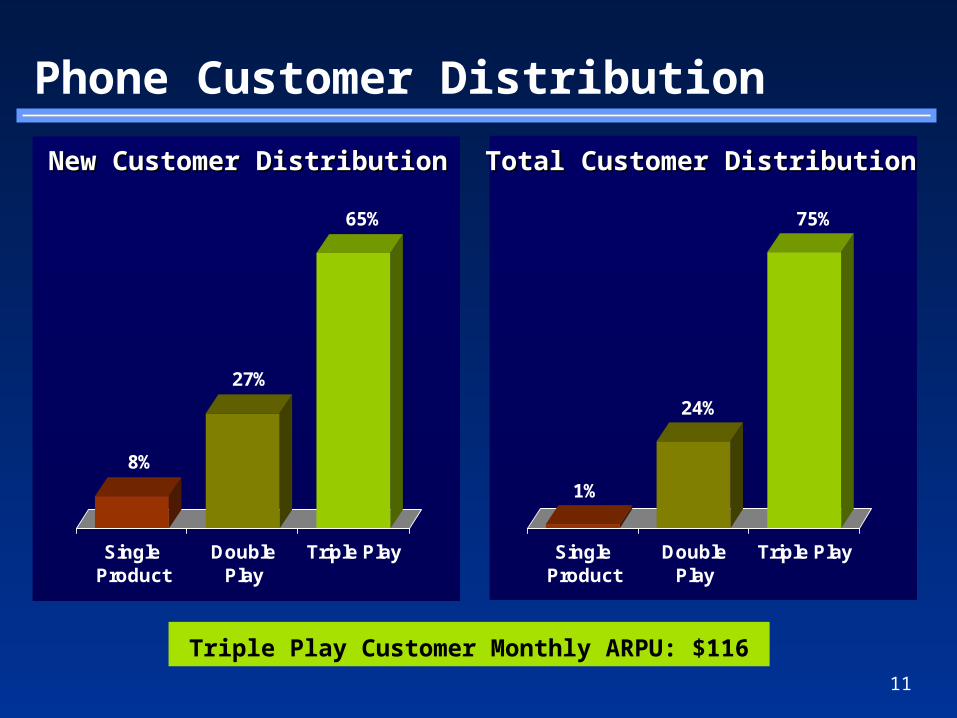
Phone Customer Distribution
8%
27%
65%
SingleProduct
DoublePlay
Triple Play
Triple Play Customer Monthly ARPU: $116
1%
24%
75%
SingleProduct
DoublePlay
Triple Play
New Customer DistributionNew Customer Distribution Total Customer DistributionTotal Customer Distribution

12
Phone’s Ripple Effect
1.3 million1.3 millionhomeshomes
1.5 million homes1.5 million homes(customer relationships)(customer relationships)
MEDIACOM’sMEDIACOM’sOPPORTUNITY:OPPORTUNITY:
Total Homes Passed = 2.8 millionTotal Homes Passed = 2.8 million
New video, voice and New video, voice and data customersdata customers
Incremental RGU Incremental RGU penetrationpenetration

13
MSO-RBOC Footprint Overlap
91%
9%
44%
35%
4%
17%
36%
48%
6%
10%
38%
39%
11%
12%
36%
45%
2%
17%
19%
68%
0%
13%
17%
56%
18%
9%
13%
26%
31%
30%
Cablevision Adelphia Charter Comcast Time Warner Insight Cox Mediacom
Other
Qwest
AT&T*
Verizon
100% = Total Homes Passed
Source:Source: Wall Street ResearchWall Street Research* Pro forma for AT&T-BellSouth merger* Pro forma for AT&T-BellSouth merger

14
Business Services – the Next Growth Market
Business voice penetration expected to Business voice penetration expected to converge with residential VoIP converge with residential VoIP
Estimated 250,000 businesses in Mediacom’sEstimated 250,000 businesses in Mediacom’s markets markets
Business interest in VoIP has gone from Business interest in VoIP has gone from weak to strong weak to strong
We become a full service provider to We become a full service provider to commercial marketplace commercial marketplace

15
Matt DerdeynMatt Derdeyn
Group VP, Corporate Finance and TreasurerGroup VP, Corporate Finance and Treasurer

16
MCCC – Summary Q1 06 Results
Q1 2006Q1 2006 Q4 2005Q4 2005 Q1 2005Q1 2005
Revenues ($ in millions)Revenues ($ in millions) $289.3$289.3 $280.3$280.3 $266.2$266.2
YOY GrowthYOY Growth 8.7%8.7%
Adjusted OIBDA ($ in millions)Adjusted OIBDA ($ in millions) (1) (1) $107.6$107.6 $101.1$101.1 $99.1$99.1
YOY GrowthYOY Growth 8.5%8.5%
MarginMargin 37.2%37.2% 36.1%36.1% 37.2%37.2%
Customer DataCustomer Data Q1 2006Q1 2006 Q4 2005Q4 2005 Q1 2005Q1 2005
Basic subscribersBasic subscribers 1,422,0001,422,000 1,423,0001,423,000 1,461,0001,461,000
Digital customersDigital customers 497,000497,000 494,000494,000 430,000430,000
Data customersData customers 504,000504,000 478,000478,000 407,000407,000
Phone customersPhone customers 46,00046,000 22,00022,000 --
Total Revenue Generating Units (RGU)Total Revenue Generating Units (RGU) 2,469,0002,469,000 2,417,0002,417,000 2,298,0002,298,000
Average monthly revenue Average monthly revenue
per basic subscriberper basic subscriber
$67.80$67.80 $65.52$65.52 $60.81$60.81
Year-over-year growthYear-over-year growth 11.5%11.5% 8.2%8.2% 6.5%6.5%
Average monthly revenue per RGUAverage monthly revenue per RGU $39.48$39.48 $39.11$39.11 $39.28$39.28
Average monthly data revenue per data Average monthly data revenue per data customerscustomers
$37.40$37.40 $37.33$37.33 $38.78$38.78
(1) Excludes non-cash stock compensation charges.

17
Capex Shift to Success-Based Product Growth
$0
$100
$200
$300
$400
$500
2002 2003 2004 2005 2006G
CPE/Scalable Upgrade Line Extension Support
Hurricane CapexHurricane Capex $8.1$8.1 $6.6$6.6 $2.2$2.2
$408
33%33% 52%52% 55%55% 66%66%
$241
$181$228
($ in millions)($ in millions)
$200
67%67%
Q1 2006: Q1 2006: $47.6$47.6
Massive shift to success-based investmentMassive shift to success-based investment

18
Flexible Capital Structure
Mediacom Broadband LLCSubsidiaries
Senior Debt(1) $861Unused Credit Commitments $581Senior Debt/SCF 3.4x
Mediacom Broadband LLC
Senior Notes $600Total Debt/OCF 6.1x
Mediacom LLCSubsidiaries
Senior Debt(1) $862Unused Credit Commitments $388Senior Debt/SCF(2) 4.0x
Mediacom LLC
Senior Notes $625Total Debt/OCF(2) 7.1x
Mediacom Communications Corporation
Convertible Notes $173Total Debt $3,100
Note: Note: Based on Q1 2006 data. OCF and SCF are Q1 annualized and exclude non-cash compensation charges. Pro forma for refinancings of Mediacom LLC Group Term Loan B Based on Q1 2006 data. OCF and SCF are Q1 annualized and exclude non-cash compensation charges. Pro forma for refinancings of Mediacom LLC Group Term Loan B and Mediacom Broadband Group Term Loan C on May 5, 2006.and Mediacom Broadband Group Term Loan C on May 5, 2006.
(1) Excludes letters of credit.(1) Excludes letters of credit.(2) OCF and SCF for Mediacom LLC includes cash investment income.(2) OCF and SCF for Mediacom LLC includes cash investment income.
($ in millions)($ in millions)
18
19
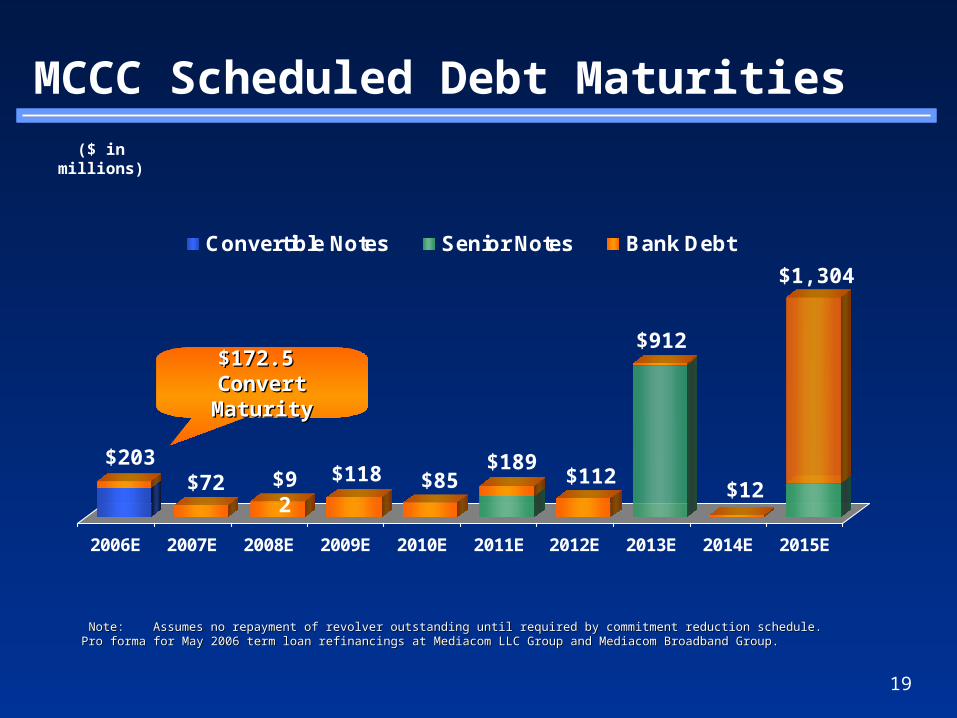
2006E 2007E 2008E 2009E 2010E 2011E 2012E 2013E 2014E 2015E
Convertible Notes Senior Notes Bank Debt
Note:Note: Assumes no repayment of revolver outstanding until required by commitment reduction schedule.Assumes no repayment of revolver outstanding until required by commitment reduction schedule.
Pro forma for May 2006 term loan refinancings at Mediacom LLC Group and Mediacom Broadband Group.Pro forma for May 2006 term loan refinancings at Mediacom LLC Group and Mediacom Broadband Group.
$203$72 $118
$189$85 $112
$912
MCCC Scheduled Debt Maturities
$1,304
$12
($ in millions)
$92
$172.5 $172.5 Convert MaturityConvert Maturity

20
$437
$1,100
$844$770
$909 $871$969 $1,014
$1,014$969
$871$909
$562$600
$800
$358
FYE 2000 FYE 2001 FYE 2002 FYE 2003 FYE 2004 FYE 2005 Q1 2006PF*
Q1 2006PF**
Unused Credit Commitments Borrowing Availability
Credit Availability
Solid track record of preserving liquidity and Solid track record of preserving liquidity and maintaining ample borrowing availabilitymaintaining ample borrowing availability
** Pro forma for May 2006 term loan refinancings at Mediacom LLC Group and Mediacom Broadband Group.Pro forma for May 2006 term loan refinancings at Mediacom LLC Group and Mediacom Broadband Group.**** Pro forma for drawdown of $250.0 million Mediacom Broadband Group Term Loan D-2 and repayment of MCC 5.25% convertible notes due July 1, 2006.Pro forma for drawdown of $250.0 million Mediacom Broadband Group Term Loan D-2 and repayment of MCC 5.25% convertible notes due July 1, 2006.
20
($ in millions)

21


