Wachovia Securities Databook. Corporate & Investment Banking Product Expertise.
Upload
claire-knightCategory
view
215download
0
1
Wachovia Securities Convertible Securities
Conference March 5th, 2003

2
Certain matters discussed in this presentation are "forward-looking statements" intended to qualify for the safe harbors from liability established by the Private Securities Litigation Reform Act of 1995. These forward-looking statements can generally be identified as such because of the context of the statement and may include words such as "believes," "anticipates," "expects," "estimates," or words of similar import. Similarly, statements that describe Hanover's future plans, objectives or goals are also forward-looking statements. Such forward-looking statements are subject to certain risks and uncertainties, which could cause actual results to differ materially from those anticipated as of the date of this presentation. These risks and uncertainties include: the loss of market share through competition; reduced profit margins resulting from increased pricing pressure in our business, the introduction of competing technologies by other companies; a prolonged, substantial reduction in oil and gas prices which could cause a decline in the demand for Hanover's compression and oil and gas production equipment; new governmental safety, health and environmental regulations which could require Hanover to make significant capital expenditures; inability to successfully integrate acquired businesses; currency fluctuations; changes in economic or political conditions in the countries in which Hanover operates; adverse results of regulatory inquiries or shareholder litigation; inability to comply with loan and lease covenants; inability to access capital markets; and legislative changes in the various countries in which Hanover does business. The forward-looking statements included in this presentation are only made as of the date of this presentation, and Hanover undertakes no obligation to publicly update such forward-looking statements to reflect subsequent events or circumstances. A discussion of these factors is included in the Company's periodic reports filed with the Securities and Exchange Commission.
Forward Looking Statements

3
Corporate Overview
Market Capitalization (2/25/03): $ 632 MM
Enterprise Value (2/25/03)(1) $2,413 MM
S&P/Moody’s ratings: BB-/Ba3
2002 Revenues: $1,029 MM
(1) Includes Synthetic Lease Financings
2002 Revenue MixBusiness Segment
2002 Revenue MixBy Geographic Region
Domestic 70%
International 30%
Comp. Fab 11%
Other 2%
Domestic Compression Rental 32%
Parts & Service 22%
Prod. Equip. Fab 15%
International Compression Rental 18%

4
Hanover History
• Dramatic Growth Since 1997 Fueled by Acquisitions and Management Focus on Top Line Growth
• Positives of Growth Market Leader in Outsourced Compression Critical Mass for Global Solutions Expanded Business Lines
• Negatives of Growth Growth Exceeded Infrastructure Control Environment Strained Increased Leverage Lack of Consolidation of Acquired Company
Operations
• 2002 Review Restatements, SEC Inquiry, and Shareholder
Lawsuits Management and Organizational Changes New Phase in Hanover History
$199$286
$1,029
$318
$1,041
$563
1997 1998 1999 2000 2001 2002
39% CAGR
Total Revenue ($ MM)
Total Debt/Total Capitalization
36%
53%55%
57%60%
62%
1997 1998 1999 2000 2001 2002*
*As of 9/30/02

5
Hanover – The Future
• Integrate Hanover’s Systems and Operations Enabling the Company to Move Quickly to React to Our Customer's Needs – Both Domestically and Internationally
• Become the Solutions Provider for Our Customers Surface Production and Processing Needs
• Change Operations and Management Focus to Increased Capital Discipline and Improving Returns on Capital Employed
• Structure Organization Around Geographical Business Units
• Focus on Key Product Lines:– Services (Includes all Rental Income)– 3rd Party Parts and Services– Packaging (Compression, Processing, Power, etc.)– Alternative Fuels
6
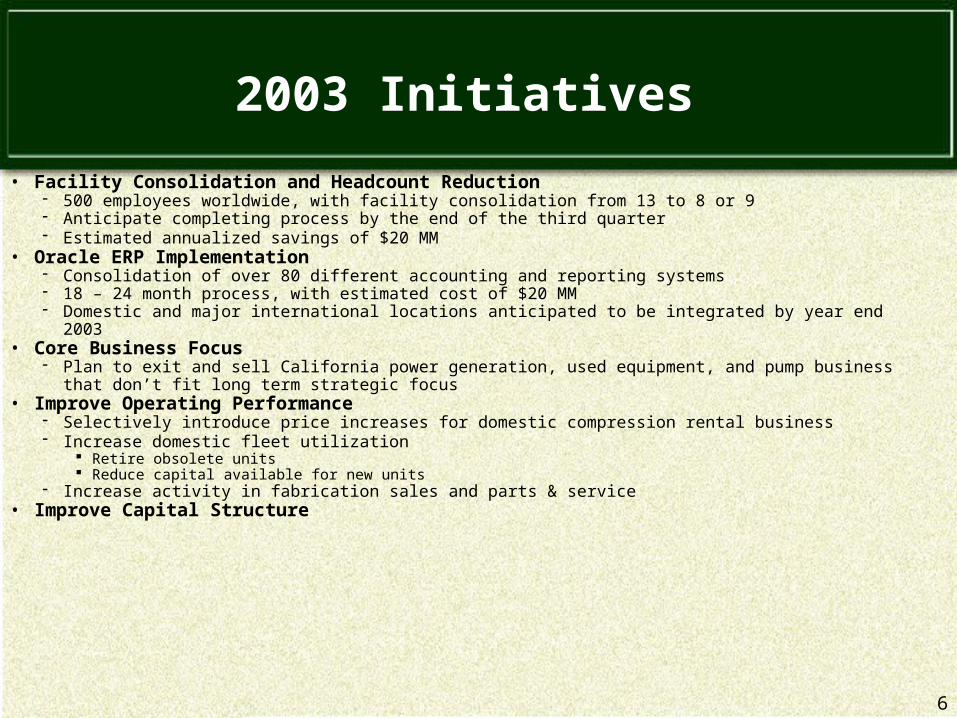
2003 Initiatives
• Facility Consolidation and Headcount Reduction 500 employees worldwide, with facility consolidation from 13 to 8 or 9 Anticipate completing process by the end of the third quarter Estimated annualized savings of $20 MM
• Oracle ERP Implementation Consolidation of over 80 different accounting and reporting systems 18 – 24 month process, with estimated cost of $20 MM Domestic and major international locations anticipated to be integrated by year end 2003
• Core Business Focus Plan to exit and sell California power generation, used equipment, and pump business that don’t fit long
term strategic focus• Improve Operating Performance
Selectively introduce price increases for domestic compression rental business Increase domestic fleet utilization
Retire obsolete units Reduce capital available for new units
Increase activity in fabrication sales and parts & service• Improve Capital Structure
7
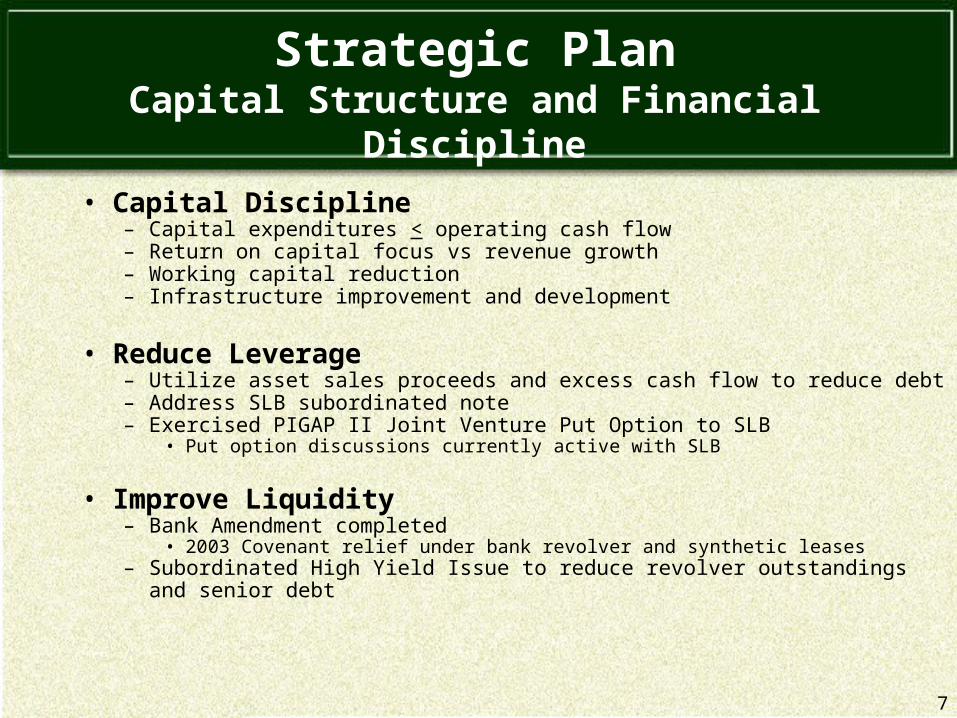
Strategic PlanCapital Structure and Financial Discipline
• Capital Discipline– Capital expenditures < operating cash flow– Return on capital focus vs revenue growth– Working capital reduction– Infrastructure improvement and development
• Reduce Leverage– Utilize asset sales proceeds and excess cash flow to reduce debt– Address SLB subordinated note – Exercised PIGAP II Joint Venture Put Option to SLB
• Put option discussions currently active with SLB
• Improve Liquidity– Bank Amendment completed
• 2003 Covenant relief under bank revolver and synthetic leases– Subordinated High Yield Issue to reduce revolver outstandings and senior debt
8
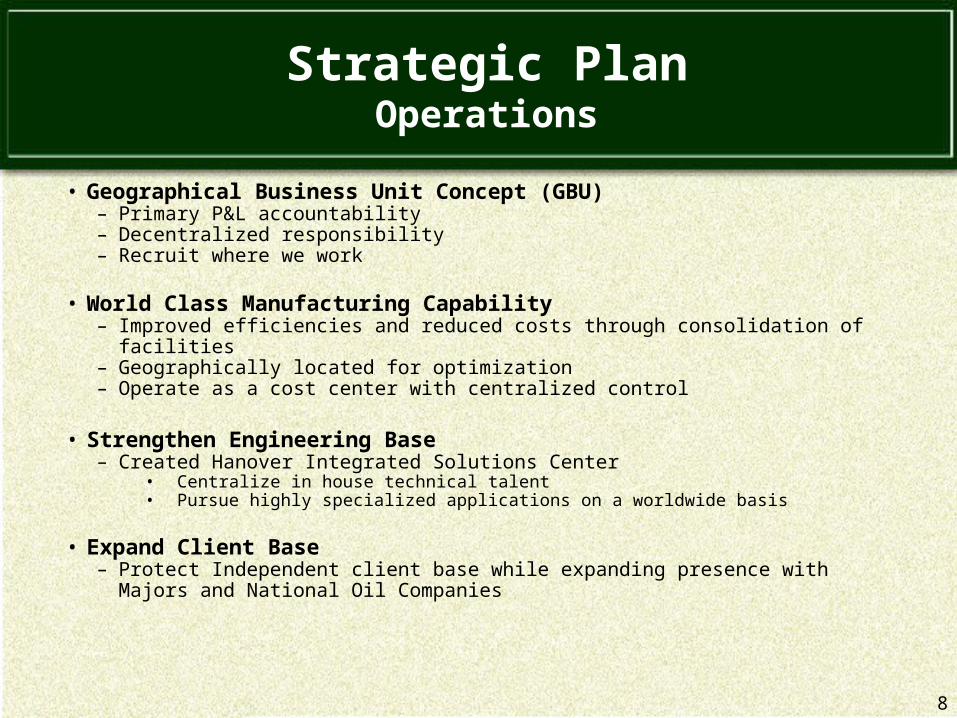
Strategic PlanOperations
• Geographical Business Unit Concept (GBU)– Primary P&L accountability– Decentralized responsibility– Recruit where we work
• World Class Manufacturing Capability– Improved efficiencies and reduced costs through consolidation of facilities– Geographically located for optimization– Operate as a cost center with centralized control
• Strengthen Engineering Base– Created Hanover Integrated Solutions Center
• Centralize in house technical talent • Pursue highly specialized applications on a worldwide basis
• Expand Client Base– Protect Independent client base while expanding presence with Majors and
National Oil Companies

9
Growth Opportunities
• Demand for Natural Gas
• Domestic Outsourcing
• Large Scale International Projects
• Total Solutions Focus

10
1994 1995 1996 1997 1998 1999 2000 2001 2002
Domestic International
Rental Fleet Growth
4,000
3,500
3,0002,500
2,000
1,500
1,000
500Ho
rse
po
wer
– (
00
0’s
)

11
Worldwide Operations

12
Total Solutions Capabilities

13
Global Market Share
• E&P Estimated Annual Capital Expenditures:– $115 billion per year– Exxon $9.9B, Shell $8B, ChvTex $7.5B, BP $7.5B, Woodside $2.4B– Does not include NOCs: (Pemex, PDVSA, Sonotrac, Sonogal, ADNOC,
etc)
• Compression Sales:– 10% of global market
• Compression Rental Revenue:– 15% of potential US market
• Standard Production Equipment– 12% of US market
• Custom Production Equipment– 4% of global market
14
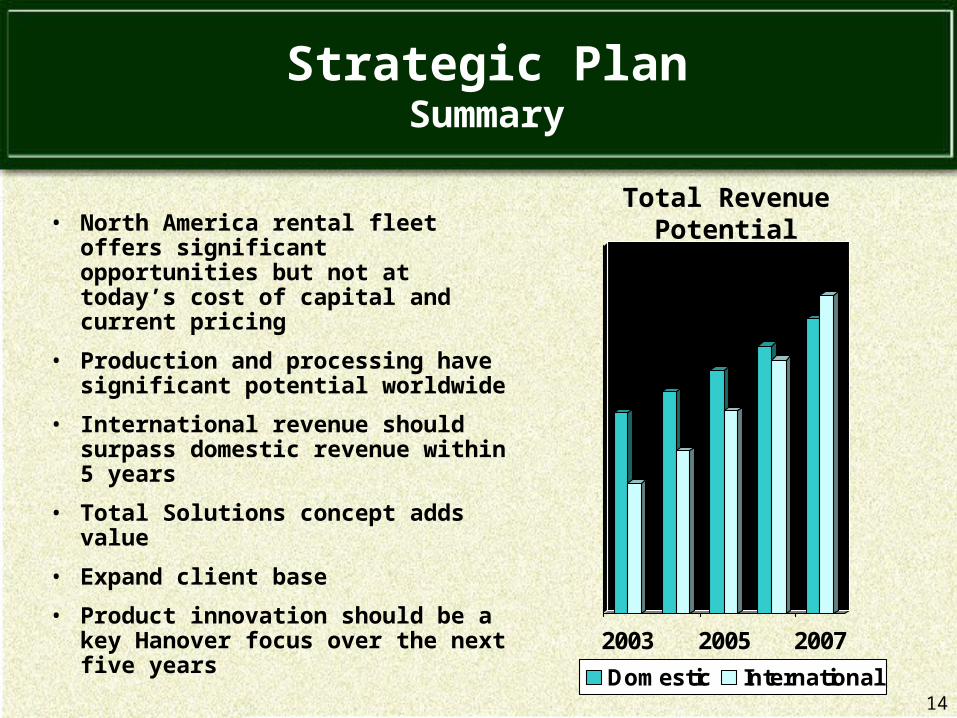
Strategic PlanSummary
• North America rental fleet offers significant opportunities but not at today’s cost of capital and current pricing
• Production and processing have significant potential worldwide
• International revenue should surpass domestic revenue within 5 years
• Total Solutions concept adds value
• Expand client base
• Product innovation should be a key Hanover focus over the next five years
2003 2005 2007
Domestic International
Total Revenue Potential

15
Financial Overview
16
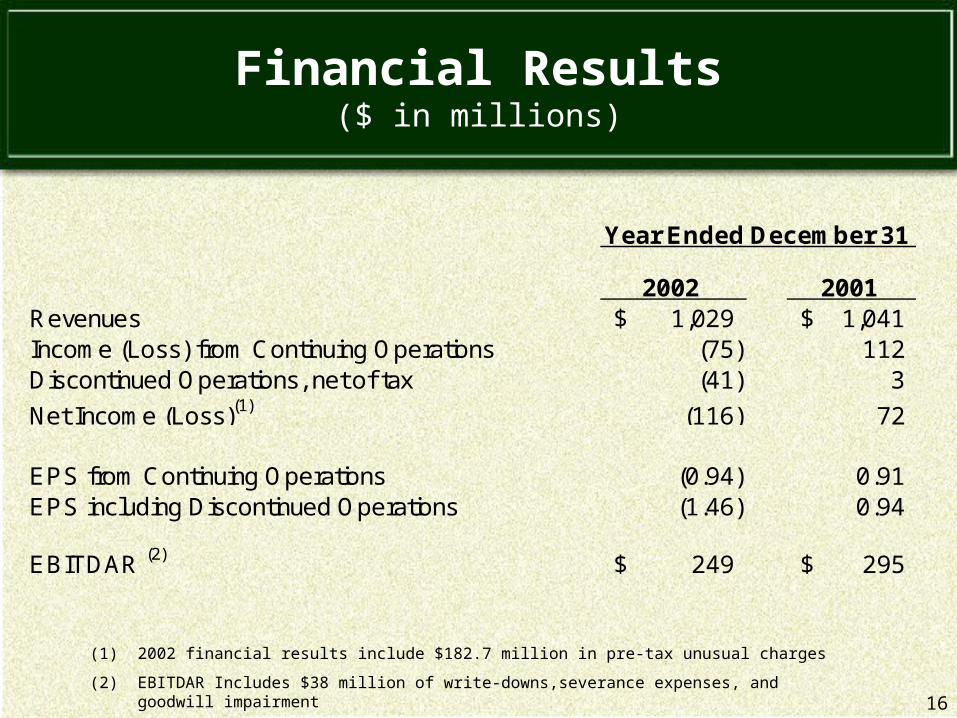
2002 2001Revenues 1,029$ 1,041$ Income (Loss) from Continuing Operations (75) 112Discontinued Operations, net of tax (41) 3
Net Income (Loss)(1) (116) 72
EPS from Continuing Operations (0.94) 0.91EPS including Discontinued Operations (1.46) 0.94
EBITDAR (2) 249$ 295$
Year Ended December 31
Financial Results($ in millions)
(1) 2002 financial results include $182.7 million in pre-tax unusual charges
(2) EBITDAR Includes $38 million of write-downs,severance expenses, and goodwill impairment
17
0
50
100
150
200
250
300
350
2001 2002
0
50
100
150
200
250
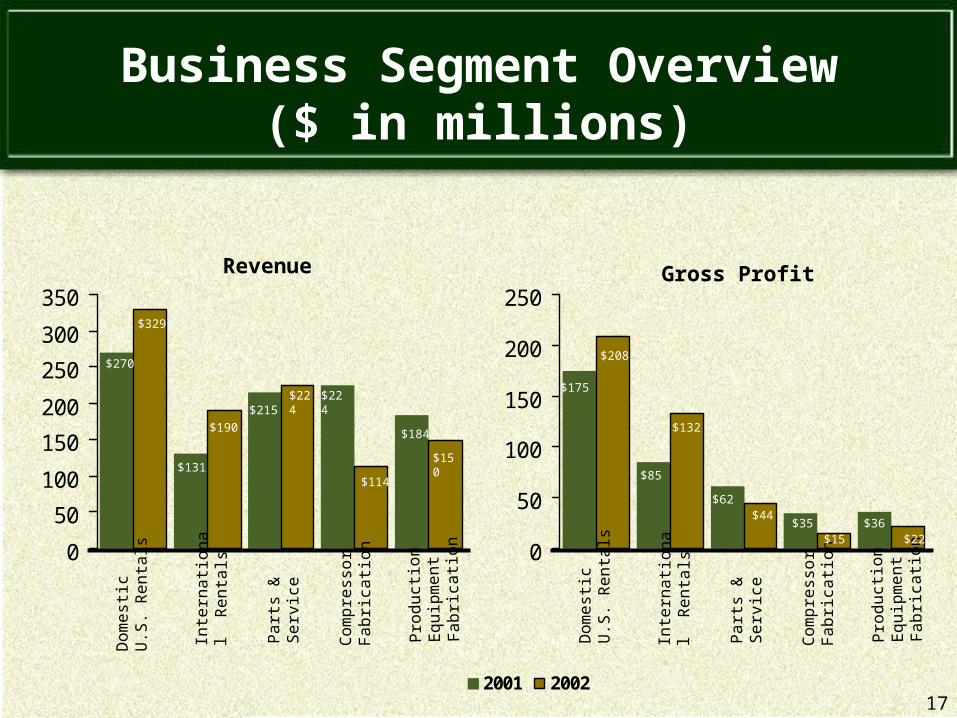
Business Segment Overview($ in millions)
Co
mp
ress
or
Fa
bric
atio
n
Do
me
stic
U.S
. R
en
tals
Pa
rts
&
Se
rvic
e
Inte
rna
tion
al
Re
nta
ls
Pro
du
ctio
n
Eq
uip
me
nt
Fa
bric
atio
n$131
$190
$270
$329
$215$224 $224
$114
$184
$150
Co
mp
ress
or
Fa
bric
atio
n
Do
me
stic
U.S
. R
en
tals
Pa
rts
&
Se
rvic
e
Inte
rna
tion
al
Re
nta
ls
Pro
du
ctio
n
Eq
uip
me
nt
Fa
bric
atio
n
$175
$208
$85
$132
$62$44
$35$15
$36$22
Revenue Gross Profit

18
Compression Rental Fleet Composition by Geographic Region
860 HP
International
2,654 HPDomestic
Total Horsepower (000’s)3,514 HP
International Horsepower (000’s)860 HP
Venezuela
41%
Other 15%
Mexico
11%
Canada11%
Argentina22%
As of December 31, 2002

19
Impact of Changes in Utilization
EBITDA
87 93
$2.5 MM per 1% Increase
% Fleet Utilization
$15 MM
$0
Represents Annualized Impact

20
Impact of Changes in Pricing
$/HP per month
EBITDA
$35 MM
$15.00$13.50
$3.5 MM per $0.15/HP Increase
$0
Represents Annualized Impact

21
Key Investment Considerations
• Total Solutions Provider
• Refocused Operating Model
• Strong Diversified Cash Flow Stream
• Significant Growth Opportunities
• Strengthened Management Team and Board Of Directors
• Focus On Reducing Leverage