W. McNair Bostick, Oumarou Badini, James W. Jones, Russell S. Yost, Claudio O. Stockle, and Amadou...
33
W. McNair Bostick, Oumarou Badini, James W. Jones, Russell S. Yost, Claudio O. Stockle, and Amadou Kodio Ensemble Kalman Filter Estimation of Soil Carbon in a Semi-Arid Rotational Grazing System
-
Upload
geoffrey-white -
Category
Documents
-
view
216 -
download
1
Transcript of W. McNair Bostick, Oumarou Badini, James W. Jones, Russell S. Yost, Claudio O. Stockle, and Amadou...
W. McNair Bostick, Oumarou Badini, James W. Jones, Russell S. Yost, Claudio O. Stockle, and
Amadou Kodio
Ensemble Kalman Filter Estimation of Soil Carbon in a Semi-Arid
Rotational Grazing System
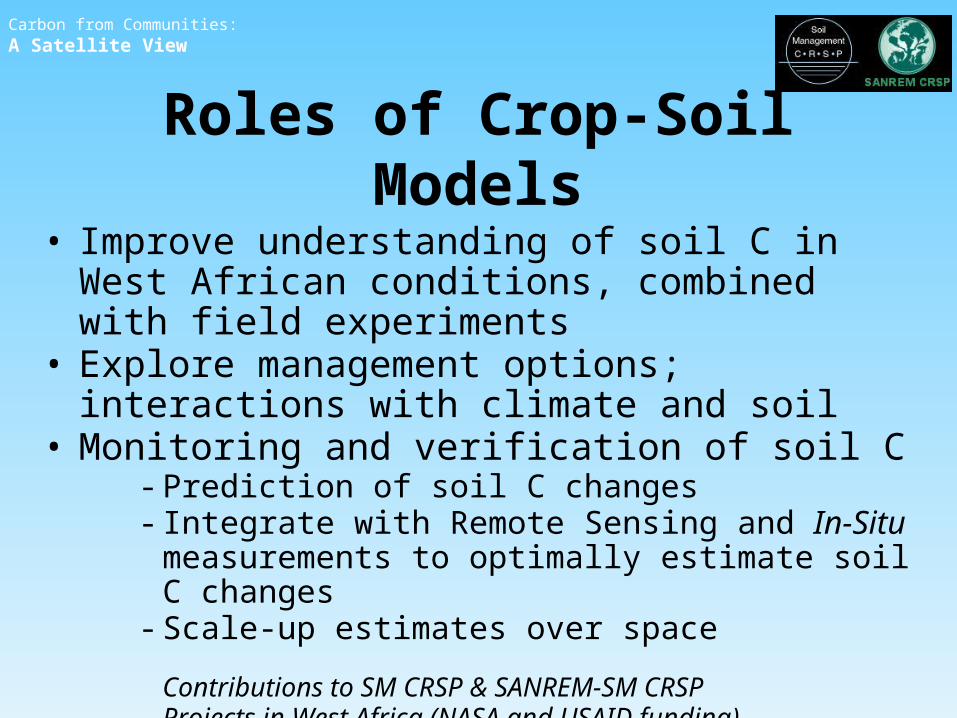
Roles of Crop-Soil Models
• Improve understanding of soil C in West African conditions, combined with field experiments
• Explore management options; interactions with climate and soil
• Monitoring and verification of soil C - Prediction of soil C changes- Integrate with Remote Sensing and In-Situ
measurements to optimally estimate soil C changes
- Scale-up estimates over space
Contributions to SM CRSP & SANREM-SM CRSP Projects in West Africa (NASA and USAID funding)
Carbon from Communities:A Satellite View
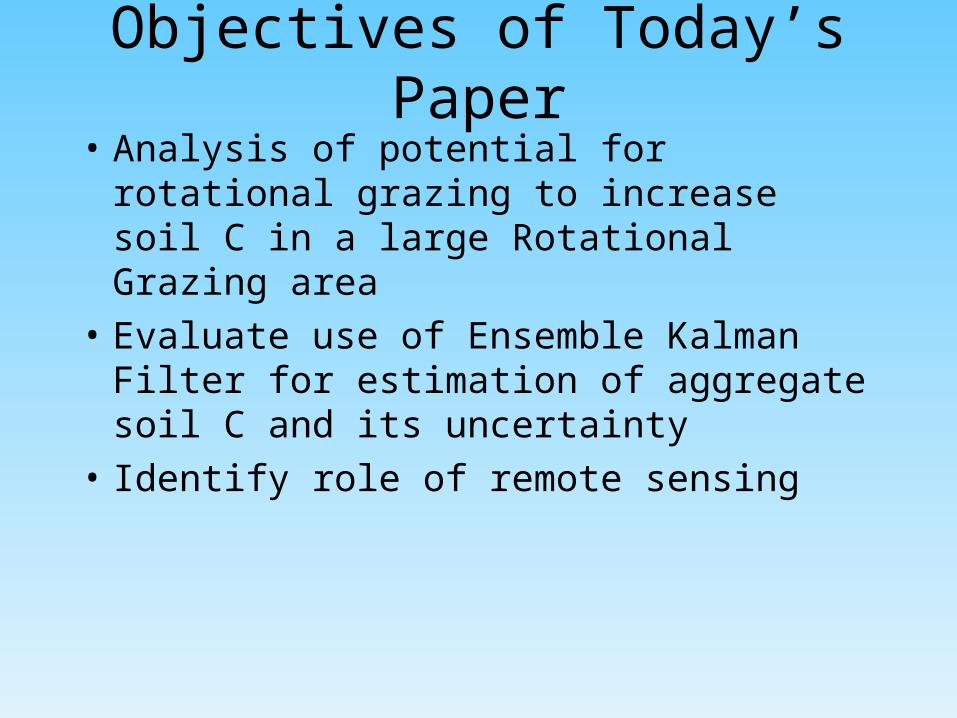
Objectives of Today’s Paper
• Analysis of potential for rotational grazing to increase soil C in a large Rotational Grazing area
• Evaluate use of Ensemble Kalman Filter for estimation of aggregate soil C and its uncertainty
• Identify role of remote sensing
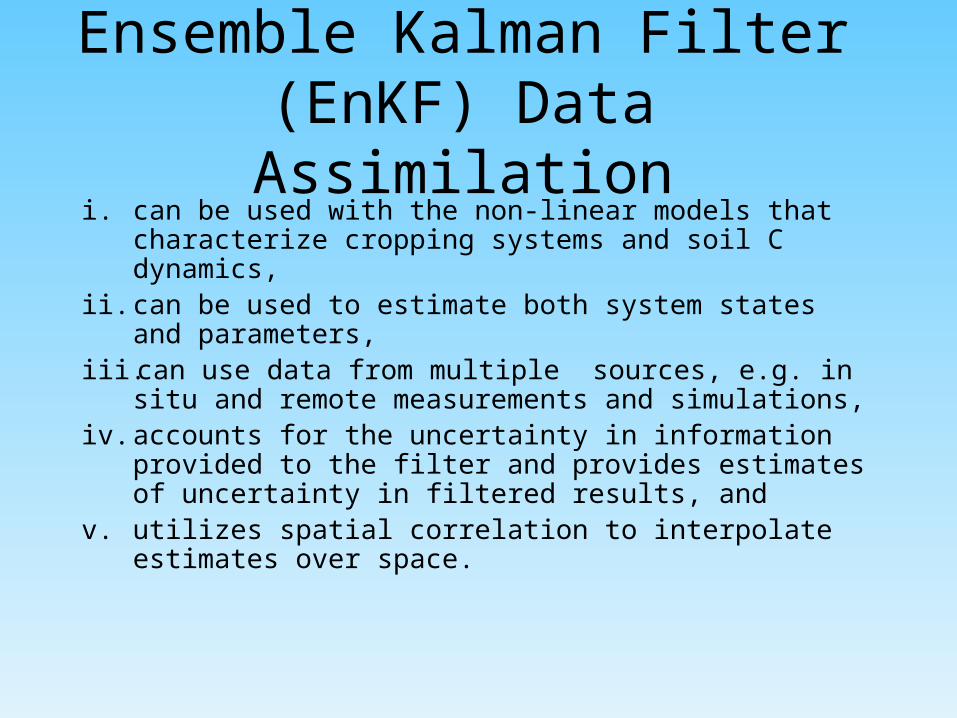
i. can be used with the non-linear models that characterize cropping systems and soil C dynamics,
ii. can be used to estimate both system states and parameters,
iii. can use data from multiple sources, e.g. in situ and remote measurements and simulations,
iv. accounts for the uncertainty in information provided to the filter and provides estimates of uncertainty in filtered results, and
v. utilizes spatial correlation to interpolate estimates over space.
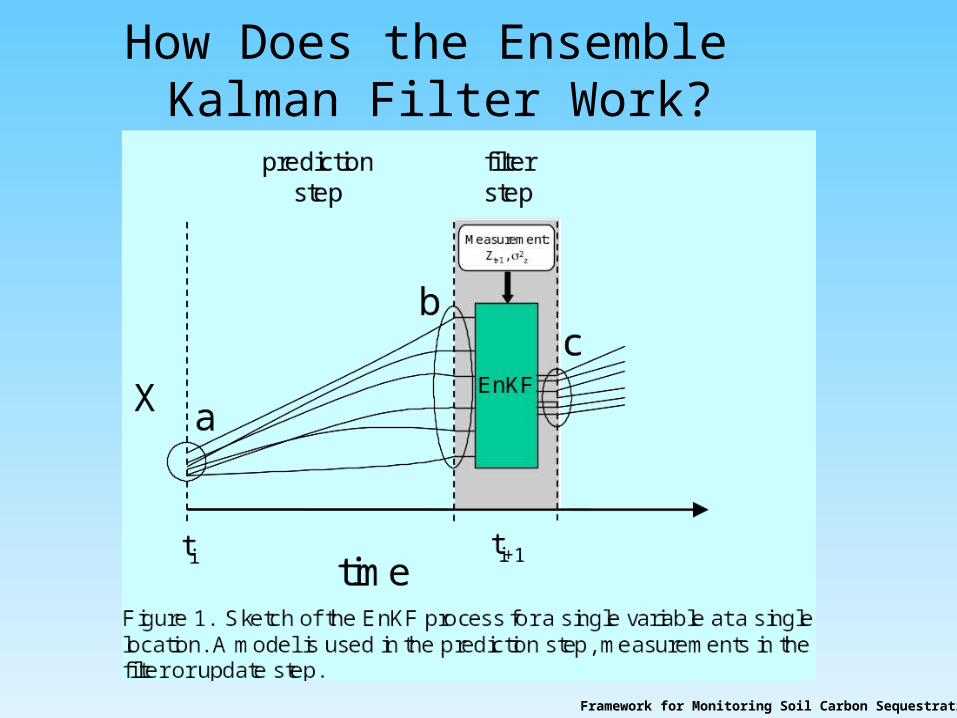
Ensemble Kalman Filter (EnKF) Data Assimilation
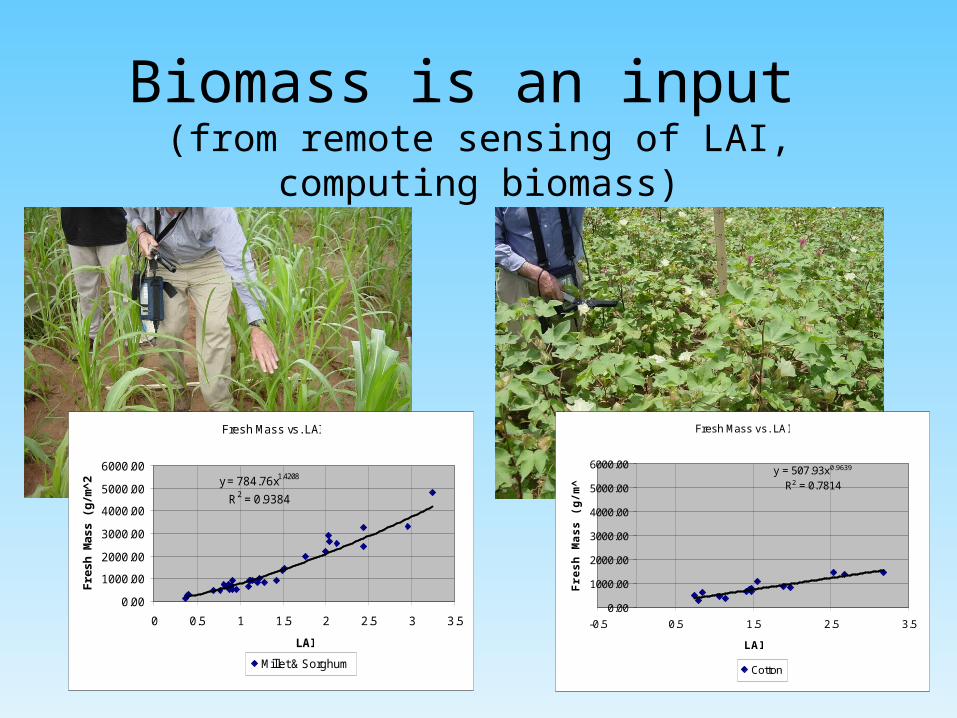
Biomass is an input (from remote sensing of LAI, computing biomass)
Fresh Mass vs. LAI
y = 784.76x1.4208
R2 = 0.9384
0.00
1000.00
2000.00
3000.00
4000.00
5000.00
6000.00
0 0.5 1 1.5 2 2.5 3 3.5
LAI
Fre
sh
Ma
ss
(g
/m^
2)
Millet & Sorghum
Fresh Mass vs. LAI
y = 507.93x0.9639
R2 = 0.7814
0.00
1000.00
2000.00
3000.00
4000.00
5000.00
6000.00
-0.5 0.5 1.5 2.5 3.5
LAI
Fre
sh M
ass
(g/m
^2)
Cotton
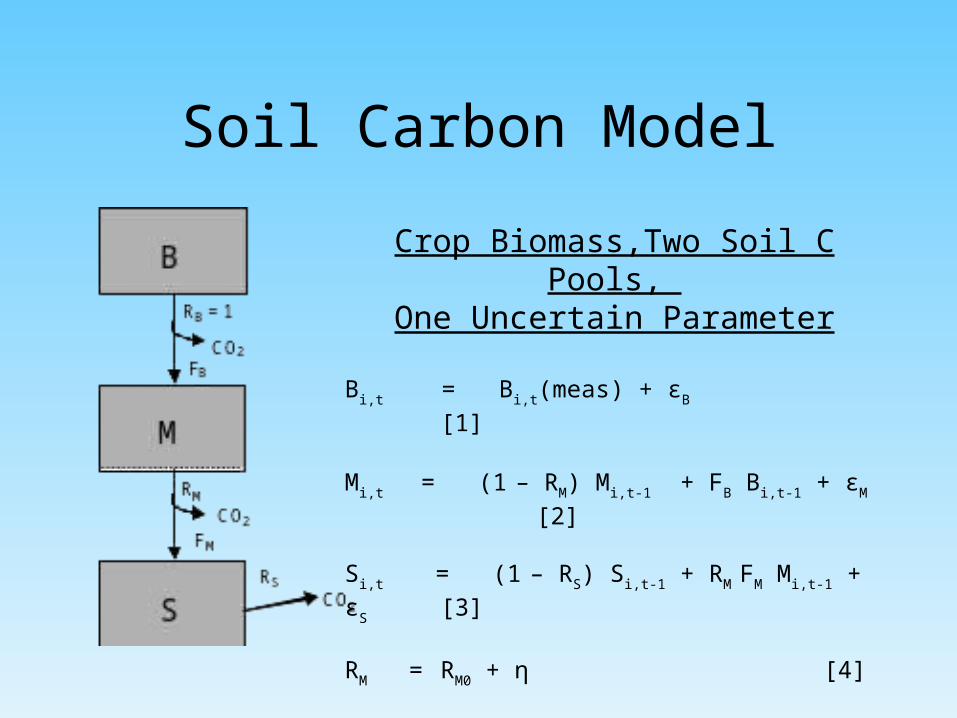
Soil Carbon Model
Crop Biomass,Two Soil C Pools, One Uncertain Parameter
Bi,t = Bi,t(meas) + εB [1]
Mi,t = (1 – RM) Mi,t-1 + FB Bi,t-1 + εM [2]
Si,t = (1 – RS) Si,t-1 + RM FM Mi,t-1 + εS [3]
RM = RM0 + η [4]
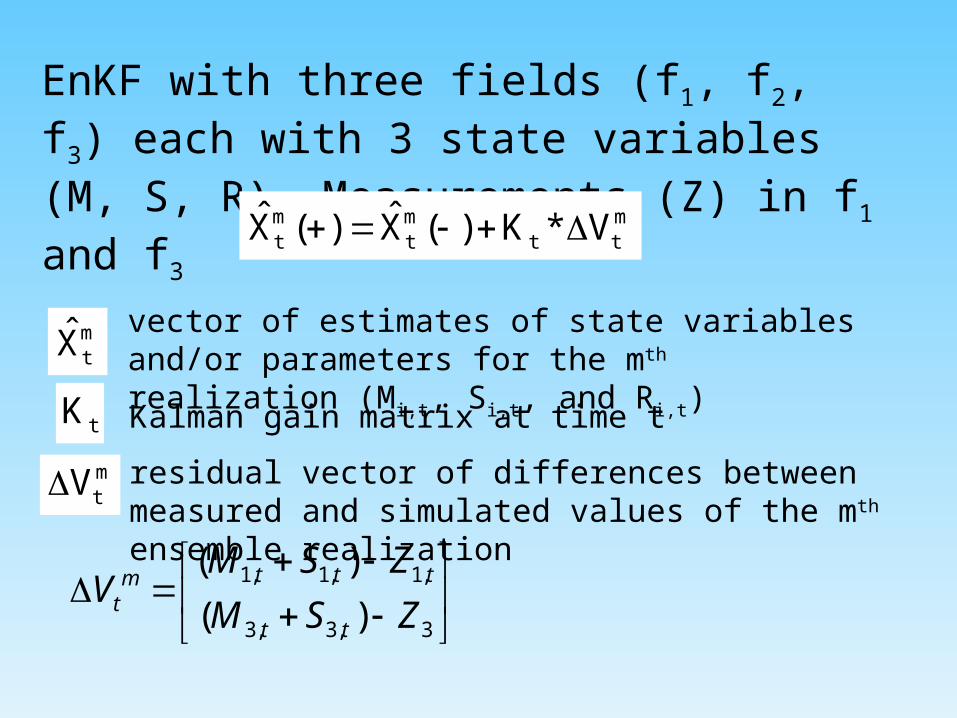
EnKF with three fields (f1, f2, f3) each with 3 state variables (M, S, R). Measurements (Z) in f1 and f3
mtt
mt
mt V*K)(X̂)(X̂
3,3,3
,1,1,1
)(
)(
ZSM
ZSMV
tt
tttmt
mtX̂
vector of estimates of state variables and/or parameters for the mth realization (Mi,t, Si,t, and Ri,t)
mtV residual vector of differences between measured and
simulated values of the mth ensemble realization
tK Kalman gain matrix at time t
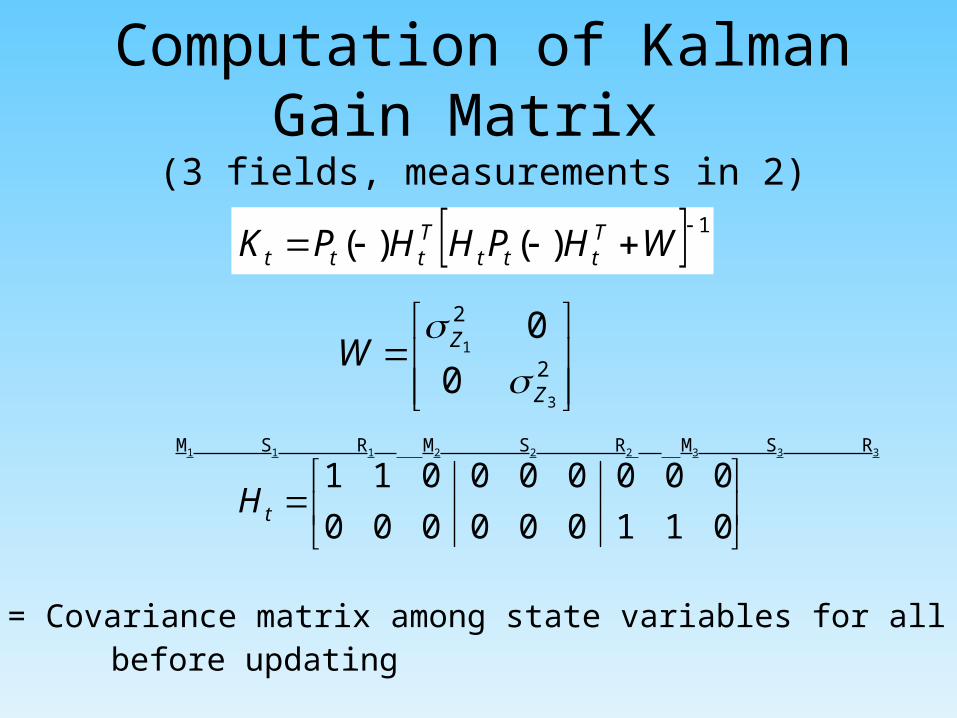
Computation of Kalman Gain Matrix (3 fields, measurements in 2)
1)()(
WHPHHPK T
tttTttt
2
2
3
1
0
0
Z
ZW
011000000
000000011tH
M1 S1 R1 M2 S2 R2 M3 S3 R3
Pt (-) = Covariance matrix among state variables for all fields before updating
Framework for Monitoring Soil Carbon Sequestration
How Does the Ensemble Kalman Filter Work?
Analysis
• Demonstrate the performance of the EnKF in estimating aggregate soil C in the Torokoro grazing site– Rotational grazing vs. conventional grazing– Different estimates of initial parameters
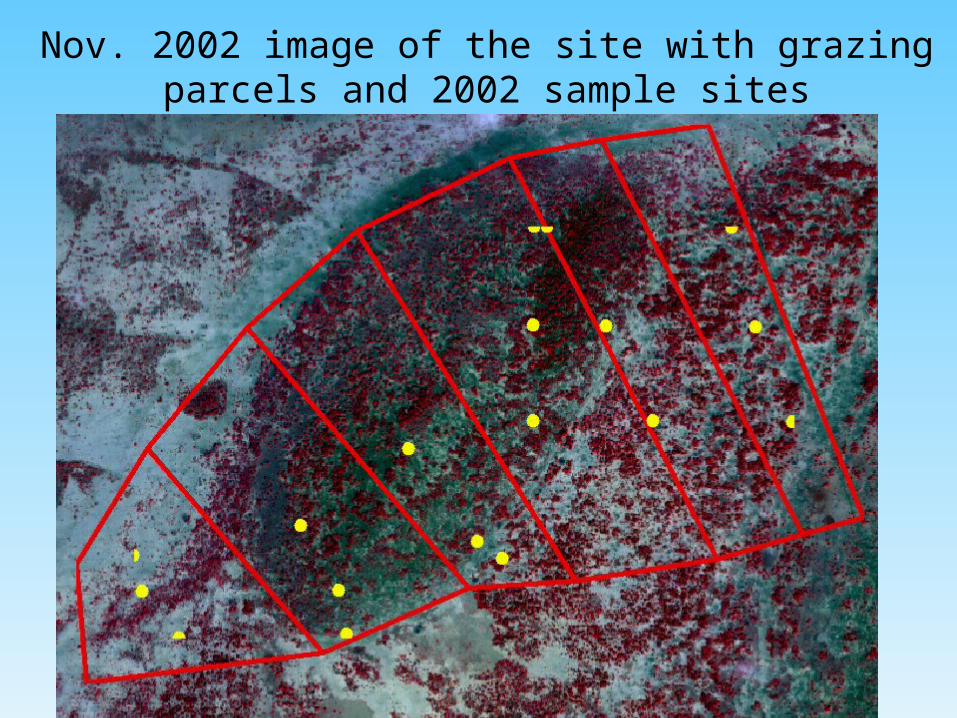
Nov. 2002 image of the site with grazing parcels and 2002 sample sites
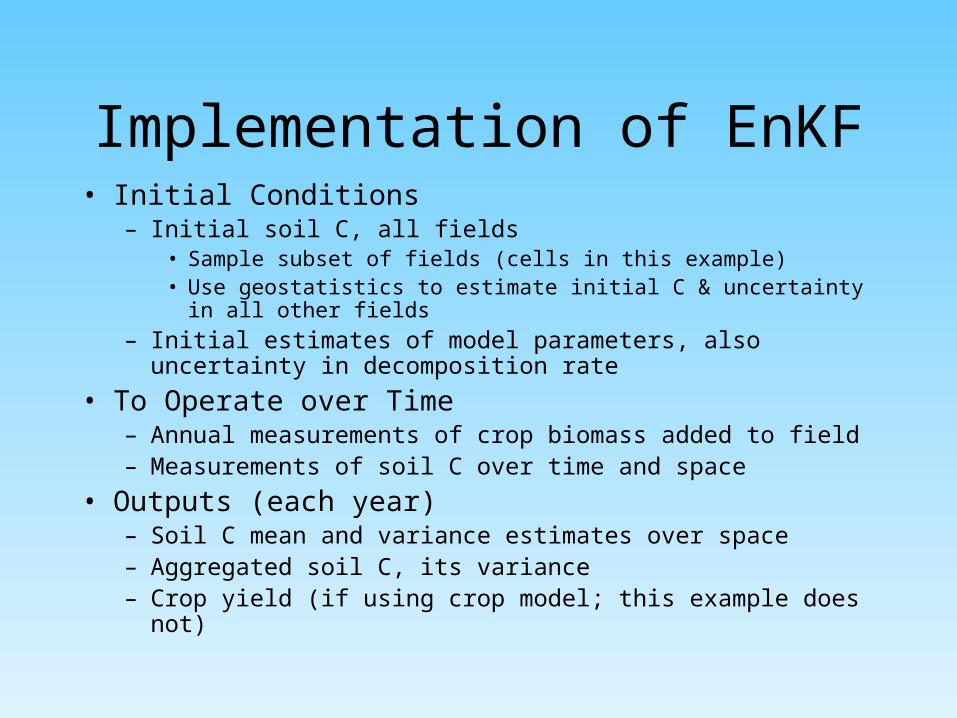
Implementation of EnKF• Initial Conditions
– Initial soil C, all fields• Sample subset of fields (cells in this example) • Use geostatistics to estimate initial C & uncertainty in all other fields
– Initial estimates of model parameters, also uncertainty in decomposition rate
• To Operate over Time– Annual measurements of crop biomass added to field – Measurements of soil C over time and space
• Outputs (each year)– Soil C mean and variance estimates over space– Aggregated soil C, its variance– Crop yield (if using crop model; this example does not)
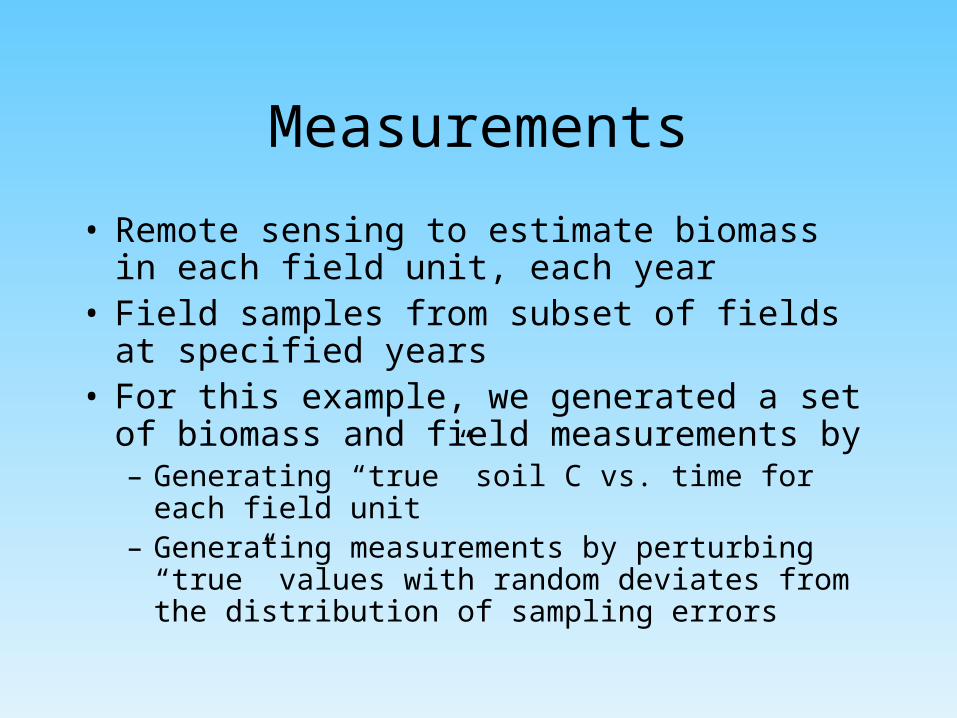
Measurements
• Remote sensing to estimate biomass in each field unit, each year
• Field samples from subset of fields at specified years
• For this example, we generated a set of biomass and field measurements by – Generating “true” soil C vs. time for each field unit– Generating measurements by perturbing “true” values
with random deviates from the distribution of sampling errors

EnKF Outputs, Annually
• Soil C estimates in each field in study area• Estimate of Variance of soil C, each field• Estimate of aggregate soil C• Estimate of aggregate soil C change• Variance of aggregate estimates• Refined parameter estimate for each field• Updated estimate of parameter uncertainty• Aggregate crop biomass, its uncertainty
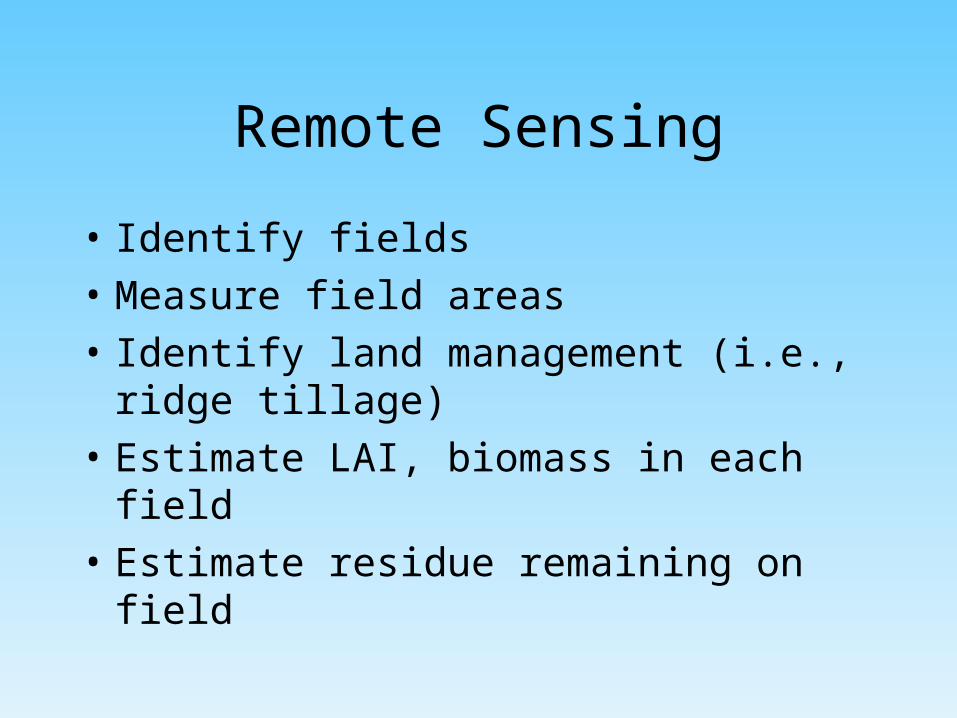
Remote Sensing
• Identify fields
• Measure field areas
• Identify land management (i.e., ridge tillage)
• Estimate LAI, biomass in each field
• Estimate residue remaining on field
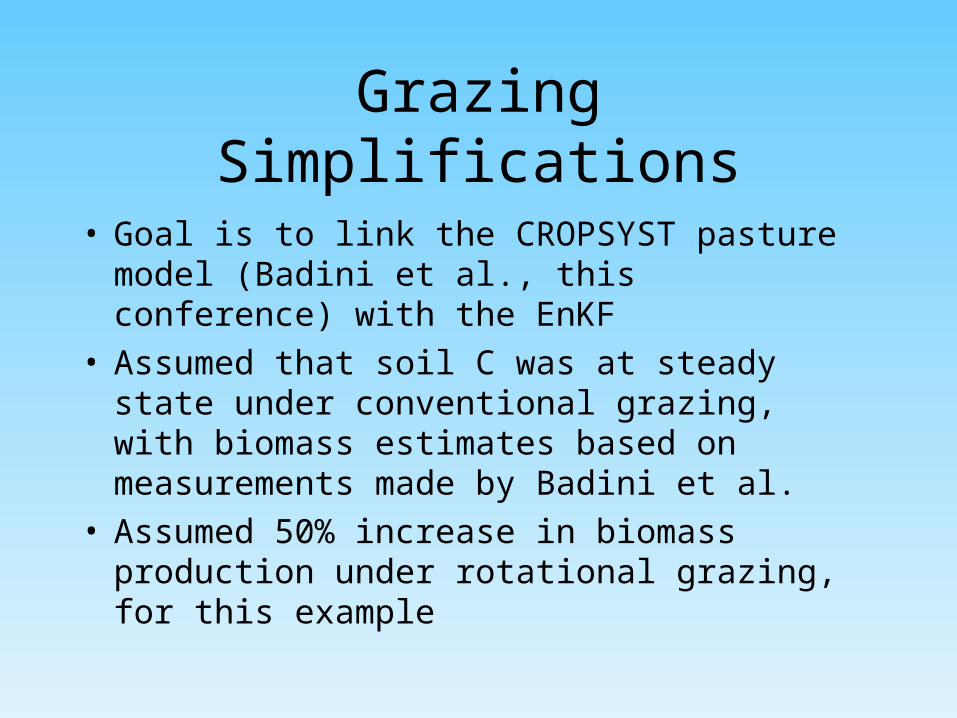
Grazing Simplifications
• Goal is to link the CROPSYST pasture model (Badini et al., this conference) with the EnKF
• Assumed that soil C was at steady state under conventional grazing, with biomass estimates based on measurements made by Badini et al.
• Assumed 50% increase in biomass production under rotational grazing, for this example
-100
0
100
200
300
400
500
600
700
800
0 5 10 15 20 25 30
year
chan
ge in
C (
tonn
es)
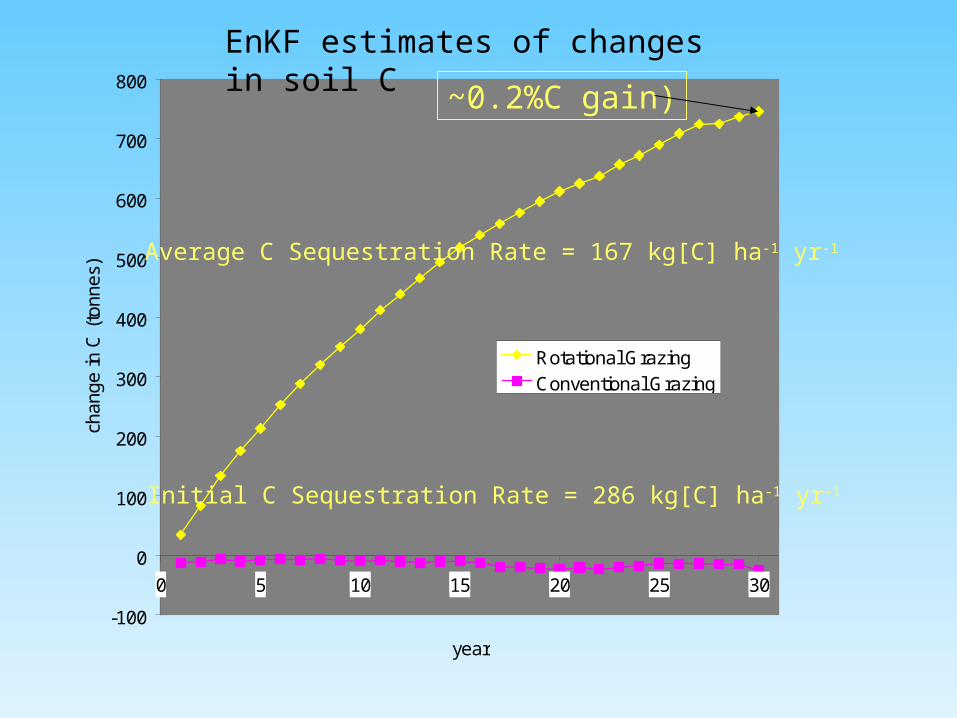
Rotational GrazingConventional Grazing
EnKF estimates of changes in soil C
~0.2%C gain)
Initial C Sequestration Rate = 286 kg[C] ha-1 yr-1
Average C Sequestration Rate = 167 kg[C] ha-1 yr-1
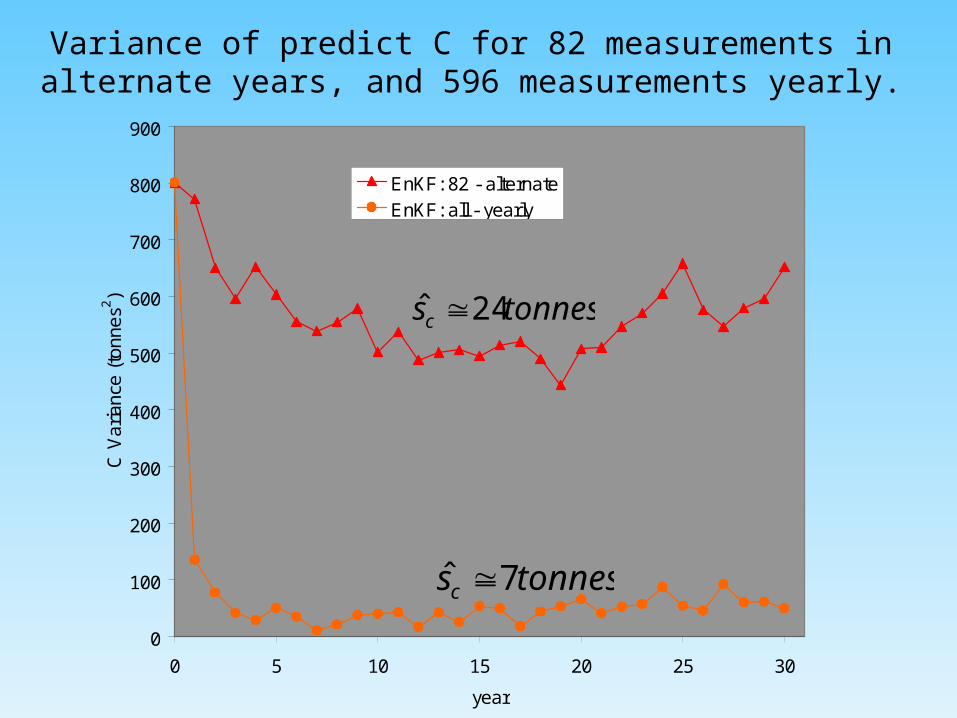
Variance of predict C for 82 measurements in alternate years, and 596 measurements yearly.
0
100
200
300
400
500
600
700
800
900
0 5 10 15 20 25 30
year
C V
aria
nce
(ton
nes2 )
EnKF: 82 - alternateEnKF: all - yearly
tonnessc 7ˆ
tonnessc 24ˆ
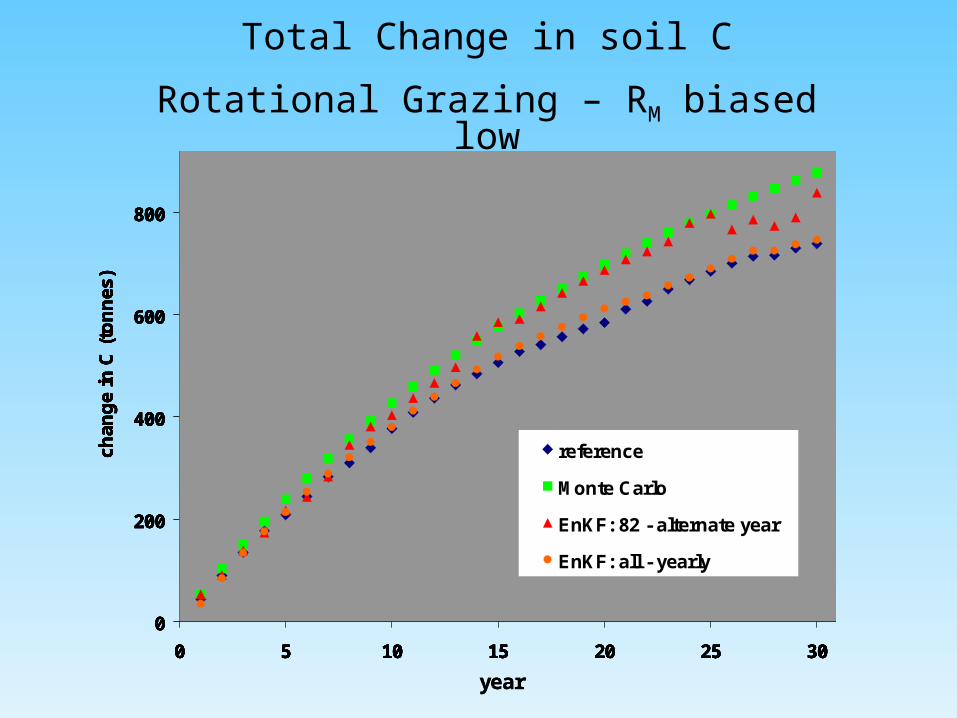
Total Change in soil C
Rotational Grazing – RM biased low
0
200
400
600
800
1000
0 5 10 15 20 25 30
year
ch
ang
e i
n C
(to
nn
es)
reference
Monte Carlo
EnKF: 82 - alternate year
EnKF: all - yearly
-25
-15
-5
5
15
25
0 5 10 15 20 25 30
year
esti
mat
ion
err
or
(%)
Monte Carlo
EnKF: 82 - alternate year
EnKF: all - yearly
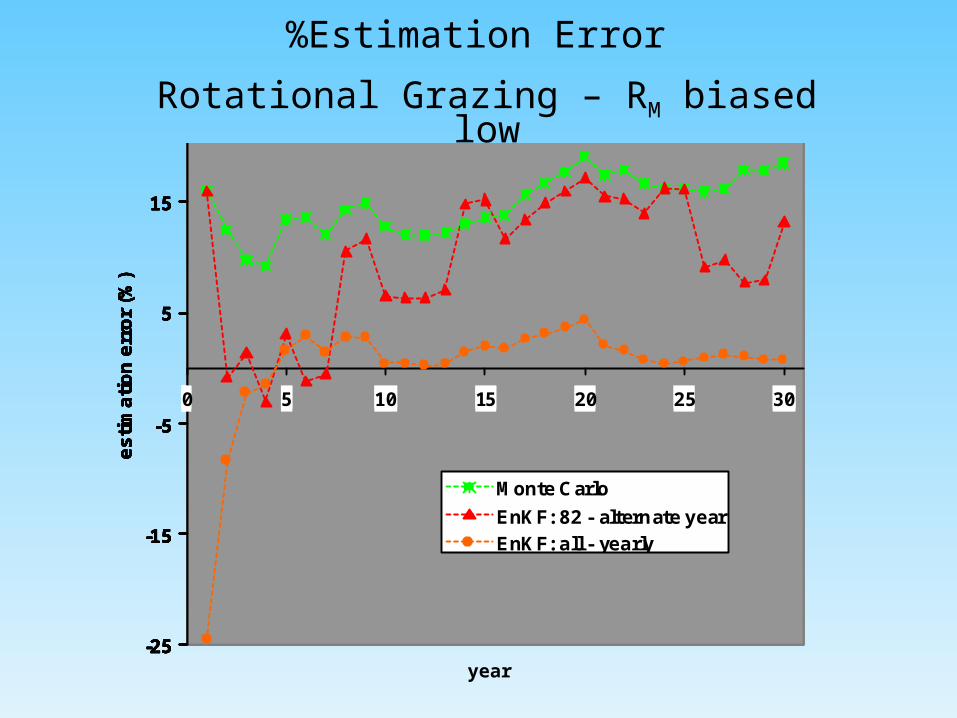
Figure 3.2 Error in estimation of change in C relative to reference C for the 150 ha site under rotational grazing and the RM biased low case.
Figure 3.1 Estimated and reference change in C for the 150 ha site under rotational grazing for the RM biased low case. The three estimations were made using Monte-Carlo simulation, EnKF with 82 measurements in alternate years, and EnKF with measurements in all model cells in all years.
0
200
400
600
800
1000
0 5 10 15 20 25 30
year
ch
ang
e i
n C
(to
nn
es)
reference
Monte Carlo
EnKF: 82 - alternate year
EnKF: all - yearly
-25
-15
-5
5
15
25
0 5 10 15 20 25 30
year
esti
mat
ion
err
or
(%)
Monte Carlo
EnKF: 82 - alternate year
EnKF: all - yearly
0
200
400
600
800
1000
0 5 10 15 20 25 30
year
ch
ang
e i
n C
(to
nn
es)
reference
Monte Carlo
EnKF: 82 - alternate year
EnKF: all - yearly
-25
-15
-5
5
15
25
0 5 10 15 20 25 30
year
esti
mat
ion
err
or
(%)
Monte Carlo
EnKF: 82 - alternate year
EnKF: all - yearly
Figure 3.2 Error in estimation of change in C relative to reference C for the 150 ha site under rotational grazing and the RM biased low case.
Figure 3.1 Estimated and reference change in C for the 150 ha site under rotational grazing for the RM biased low case. The three estimations were made using Monte-Carlo simulation, EnKF with 82 measurements in alternate years, and EnKF with measurements in all model cells in all years.
year
0
200
400
600
800
1000
0 5 10 15 20 25 30
year
ch
ang
e i
n C
(to
nn
es)
reference
Monte Carlo
EnKF: 82 - alternate year
EnKF: all - yearly
-25
-15
-5
5
15
25
0 5 10 15 20 25 30
year
esti
mat
ion
err
or
(%)
Monte Carlo
EnKF: 82 - alternate year
EnKF: all - yearly
Figure 3.2 Error in estimation of change in C relative to reference C for the 150 ha site under rotational grazing and the RM biased low case.
Figure 3.1 Estimated and reference change in C for the 150 ha site under rotational grazing for the RM biased low case. The three estimations were made using Monte-Carlo simulation, EnKF with 82 measurements in alternate years, and EnKF with measurements in all model cells in all years.
0
200
400
600
800
1000
0 5 10 15 20 25 30
year
ch
ang
e i
n C
(to
nn
es)
reference
Monte Carlo
EnKF: 82 - alternate year
EnKF: all - yearly
-25
-15
-5
5
15
25
0 5 10 15 20 25 30
year
esti
mat
ion
err
or
(%)
Monte Carlo
EnKF: 82 - alternate year
EnKF: all - yearly
0
200
400
600
800
1000
0 5 10 15 20 25 30
year
ch
ang
e i
n C
(to
nn
es)
reference
Monte Carlo
EnKF: 82 - alternate year
EnKF: all - yearly
-25
-15
-5
5
15
25
0 5 10 15 20 25 30
year
esti
mat
ion
err
or
(%)
Monte Carlo
EnKF: 82 - alternate year
EnKF: all - yearly
Figure 3.2 Error in estimation of change in C relative to reference C for the 150 ha site under rotational grazing and the RM biased low case.
Figure 3.1 Estimated and reference change in C for the 150 ha site under rotational grazing for the RM biased low case. The three estimations were made using Monte-Carlo simulation, EnKF with 82 measurements in alternate years, and EnKF with measurements in all model cells in all years.
year
-25
-15
-5
5
15
25
0 5 10 15 20 25 30
es
tim
ati
on
err
or
(%)
Monte Carlo
EnKF: 82 - alternate year
EnKF: all - yearly
Figure 3.2 Error in estimation of change in C relative to reference C for the 150 ha site under rotational grazing and the RM biased low case.
Figure 3.1 Estimated and reference change in C for the 150 ha site under rotational grazing for the RM biased low case. The three estimations were made using Monte-Carlo simulation, EnKF with 82 measurements in alternate years, and EnKF with measurements in all model cells in all years.
-25
-15
-5
5
15
25
0 5 10 15 20 25 30
es
tim
ati
on
err
or
(%)
Monte Carlo
EnKF: 82 - alternate year
EnKF: all - yearly
-25
-15
-5
5
15
25
0 5 10 15 20 25 30
es
tim
ati
on
err
or
(%)
Monte Carlo
EnKF: 82 - alternate year
EnKF: all - yearly
Figure 3.2 Error in estimation of change in C relative to reference C for the 150 ha site under rotational grazing and the RM biased low case.
Figure 3.1 Estimated and reference change in C for the 150 ha site under rotational grazing for the RM biased low case. The three estimations were made using Monte-Carlo simulation, EnKF with 82 measurements in alternate years, and EnKF with measurements in all model cells in all years.
year-25
-15
-5
5
15
25
0 5 10 15 20 25 30
es
tim
ati
on
err
or
(%)
Monte Carlo
EnKF: 82 - alternate year
EnKF: all - yearly
Figure 3.2 Error in estimation of change in C relative to reference C for the 150 ha site under rotational grazing and the RM biased low case.
Figure 3.1 Estimated and reference change in C for the 150 ha site under rotational grazing for the RM biased low case. The three estimations were made using Monte-Carlo simulation, EnKF with 82 measurements in alternate years, and EnKF with measurements in all model cells in all years.
-25
-15
-5
5
15
25
0 5 10 15 20 25 30
es
tim
ati
on
err
or
(%)
Monte Carlo
EnKF: 82 - alternate year
EnKF: all - yearly
-25
-15
-5
5
15
25
0 5 10 15 20 25 30
es
tim
ati
on
err
or
(%)
Monte Carlo
EnKF: 82 - alternate year
EnKF: all - yearly
Figure 3.2 Error in estimation of change in C relative to reference C for the 150 ha site under rotational grazing and the RM biased low case.
Figure 3.1 Estimated and reference change in C for the 150 ha site under rotational grazing for the RM biased low case. The three estimations were made using Monte-Carlo simulation, EnKF with 82 measurements in alternate years, and EnKF with measurements in all model cells in all years.
yearyear
%Estimation Error
Rotational Grazing – RM biased low
Conclusions
• Method can estimate aggregate soil C values and uncertainties in those estimates
• Adaptive, but good estimates are needed for initial soil C, model parameters, and their uncertainties
• More work is needed to refine method and provide inputs– Remote sensing estimates of biomass– Scale up to larger areas– Sensitivity analysis– Compare with measurements alone, kriging– Etc.

Nov. 2002 image of the site with grazing parcels and 2002 sample sites

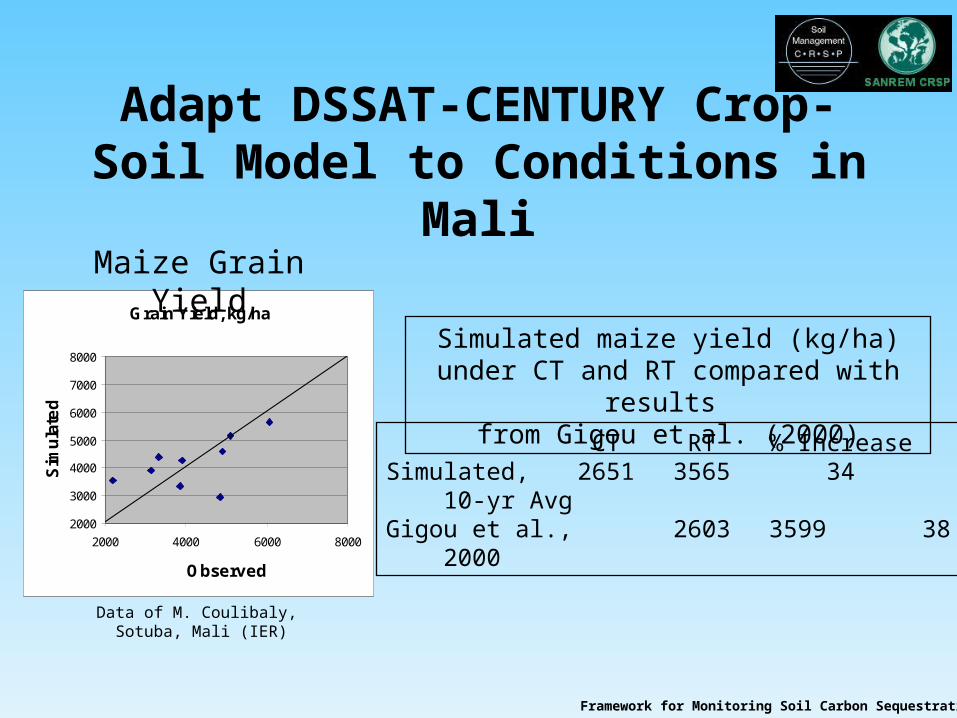
Adapt DSSAT-CENTURY Crop-Soil Model to Conditions in Mali
Grain Yield, kg/ha
2000
3000
4000
5000
6000
7000
8000
2000 4000 6000 8000
Observed
Sim
ula
ted
Maize Grain Yield
Data of M. Coulibaly, Sotuba, Mali (IER)
Simulated maize yield (kg/ha)under CT and RT compared with
results from Gigou et al. (2000) CT RT % Increase
Simulated, 2651 3565 34 10-yr AvgGigou et al., 2603 3599 38 2000
Framework for Monitoring Soil Carbon Sequestration
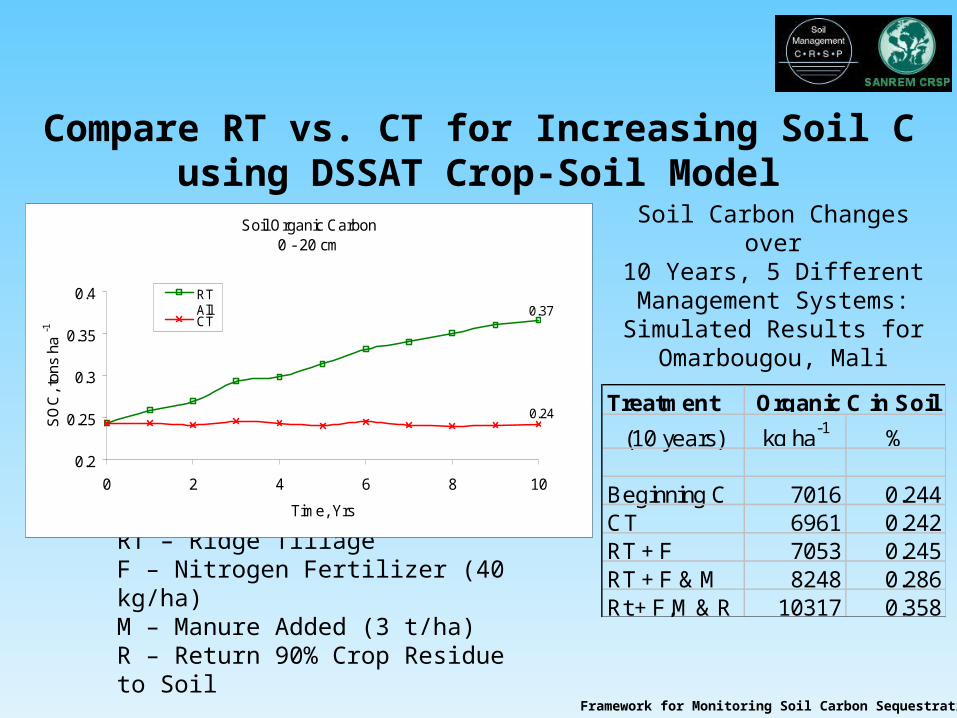
Compare RT vs. CT for Increasing Soil C using DSSAT Crop-Soil Model
Treatment
(10 years) kg ha-1 %
Beginning C 7016 0.244CT 6961 0.242RT + F 7053 0.245RT + F & M 8248 0.286Rt + F,M & R 10317 0.358
Organic C in Soil
Soil Carbon Changes over
10 Years, 5 Different Management Systems:Simulated Results for
Omarbougou, Mali
CT – Conventional TillageRT – Ridge TillageF – Nitrogen Fertilizer (40 kg/ha)M – Manure Added (3 t/ha)R – Return 90% Crop Residue to Soil
Soil Organic Carbon 0 - 20 cm
0.37
0.24
0.2
0.25
0.3
0.35
0.4
0 2 4 6 8 10
Time, Yrs
SO
C, t
ons
ha-1
RTAllCT
Framework for Monitoring Soil Carbon Sequestration
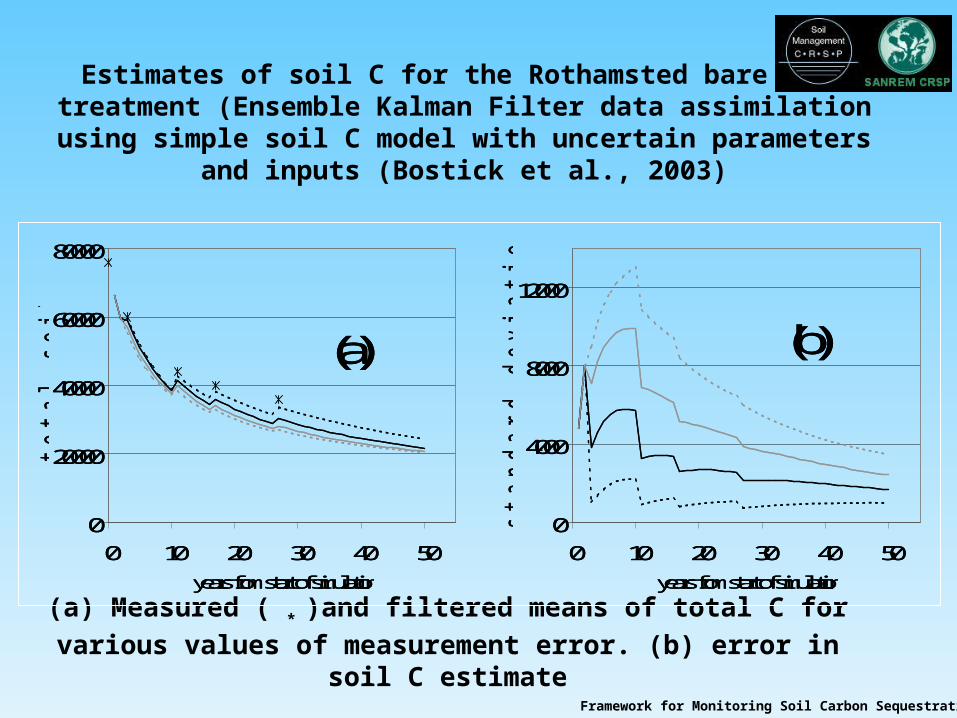
(a) Measured ( * )and filtered means of total C for various values
of measurement error. (b) error in soil C estimate
Estimates of soil C for the Rothamsted bare soil treatment (Ensemble Kalman Filter data assimilation using simple soil C
model with uncertain parameters and inputs (Bostick et al., 2003)
0
20000
40000
60000
80000
0 10 20 30 40 50
years from start of simulation
tota
l soil C
(kg h
a-1
)
0
4000
8000
12000
0 10 20 30 40 50
years from start of simulation
sta
ndard
devia
tion o
f to
tal C
(kg h
a-1
)
(a) (b)
0
20000
40000
60000
80000
0 10 20 30 40 50
years from start of simulation
tota
l soil C
(kg h
a-1
)
0
4000
8000
12000
0 10 20 30 40 50
years from start of simulation
sta
ndard
devia
tion o
f to
tal C
(kg h
a-1
)
(a) (b)
Framework for Monitoring Soil Carbon Sequestration
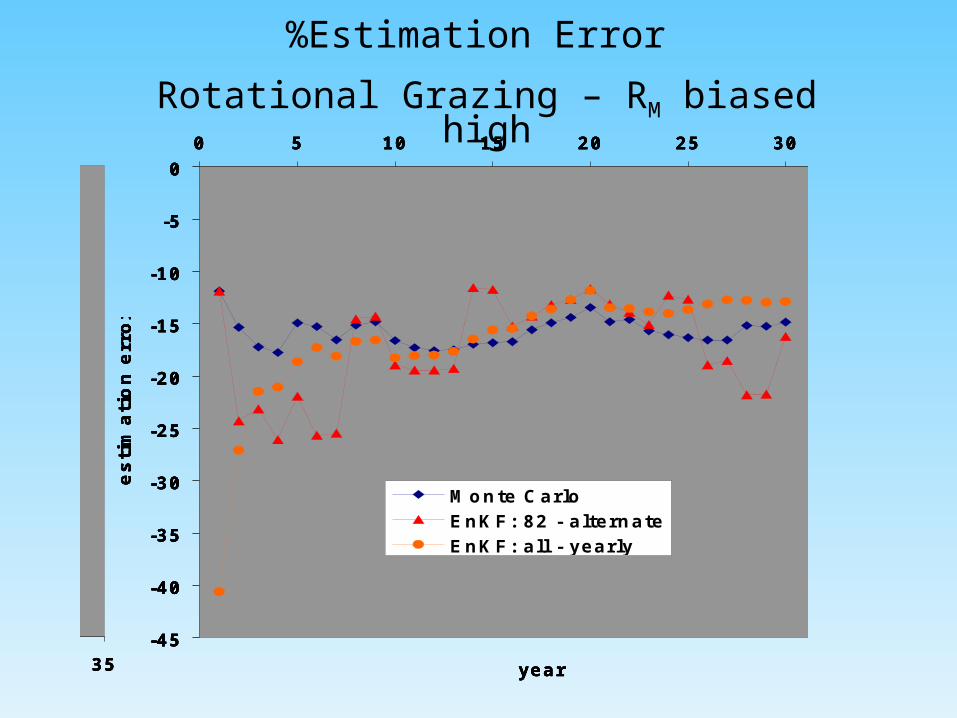
Figure 4.1 Estimated and reference change in C for the 150 ha site under rotational grazing for the RM biased high case. The three estimations were made using Monte-Carlo simulation, EnKF with 82 measurements in alternate years, and EnKF with measurements in all model cells in all years.
Figure 4.2 Error in estimation of change in C relative to reference C for the 150 ha site under rotational grazing and the RM biased high case.
0
1 0 0
2 0 0
3 0 0
4 0 0
5 0 0
6 0 0
7 0 0
8 0 0
0 5 1 0 1 5 2 0 2 5 3 0 3 5-4 5
-4 0
-3 5
-3 0
-2 5
-2 0
-1 5
-1 0
-5
0
0 5 1 0 1 5 2 0 2 5 3 0 3 5
ye a r
es
tim
ati
on
err
or
(%)
M o n te C a r lo
E n K F : 8 2 - a lte rn a te
E n K F : a ll - ye a r ly
0
1 0 0
2 0 0
3 0 0
4 0 0
5 0 0
6 0 0
7 0 0
8 0 0
0 5 1 0 1 5 2 0 2 5 3 0 3 5-4 5
-4 0
-3 5
-3 0
-2 5
-2 0
-1 5
-1 0
-5
0
0 5 1 0 1 5 2 0 2 5 3 0 3 5
ye a r
es
tim
ati
on
err
or
(%)
M o n te C a r lo
E n K F : 8 2 - a lte rn a te
E n K F : a ll - ye a r ly
%Estimation Error
Rotational Grazing – RM biased high
-40
-20
0
20
40
60
80
100
0 5 10 15 20 25 30
cha
ng
e in
C (
ton
nes)
referenceMonte Carlo
EnKF: 82 - alternateEnKF: all - yearly
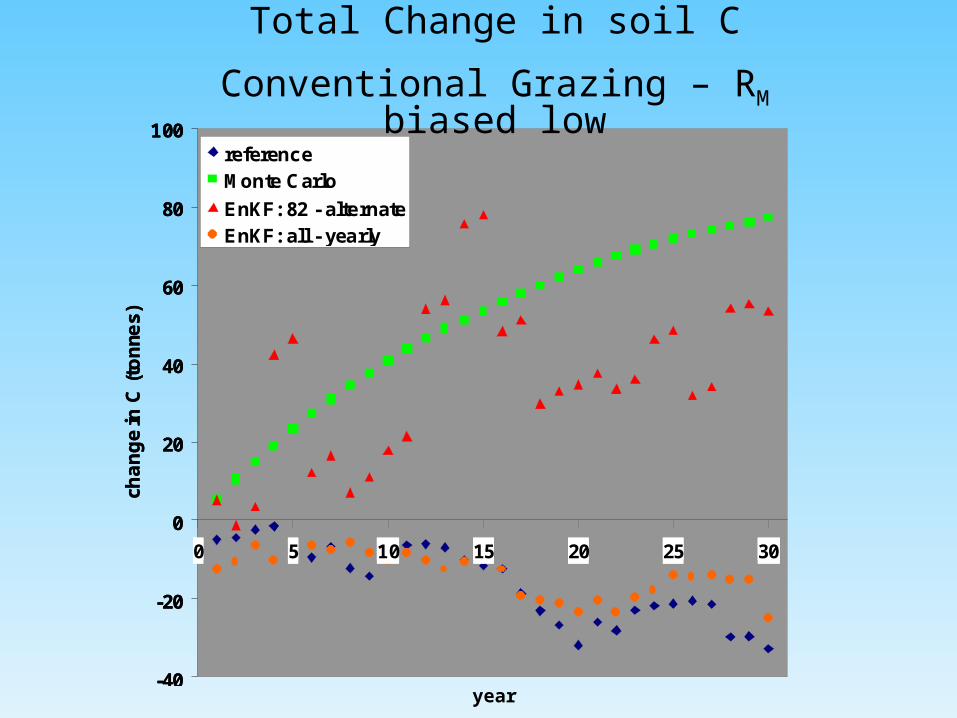
Figure 5. Estimated and reference change in C for the 150 ha site under conventional grazing for the RM biased low case. The three estimations were made using Monte-Carlo simulation, EnKF with 82 measurements in alternate years, and EnKF with measurements in all model cells in all years.
-40
-20
0
20
40
60
80
100
0 5 10 15 20 25 30
cha
ng
e in
C (
ton
nes)
referenceMonte Carlo
EnKF: 82 - alternateEnKF: all - yearly
Figure 5. Estimated and reference change in C for the 150 ha site under conventional grazing for the RM biased low case. The three estimations were made using Monte-Carlo simulation, EnKF with 82 measurements in alternate years, and EnKF with measurements in all model cells in all years.
year
Total Change in soil C
Conventional Grazing – RM biased low
-140
-120
-100
-80
-60
-40
-20
0
20
0 5 10 15 20 25 30 35
chan
ge
in C
(to
nn
es)
reference
Monte Carlo
EnKF: 82 - alternate
EnKF: all - yearly
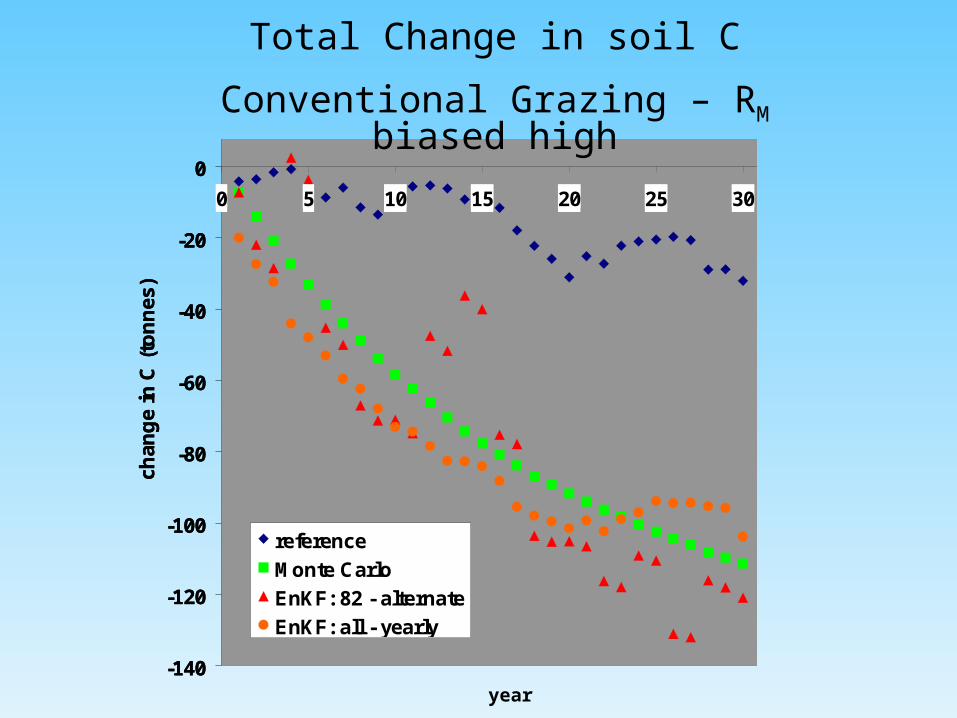
Figure 6. Estimated and reference change in C for the 150 ha site under conventional grazing for the RM biased low case. The three estimations were made using Monte-Carlo simulation, EnKF with 82 measurements in alternate years, and EnKF with measurements in all model cells in all years.
-140
-120
-100
-80
-60
-40
-20
0
20
0 5 10 15 20 25 30 35
chan
ge
in C
(to
nn
es)
reference
Monte Carlo
EnKF: 82 - alternate
EnKF: all - yearly
Figure 6. Estimated and reference change in C for the 150 ha site under conventional grazing for the RM biased low case. The three estimations were made using Monte-Carlo simulation, EnKF with 82 measurements in alternate years, and EnKF with measurements in all model cells in all years.
year
Total Change in soil C
Conventional Grazing – RM biased high
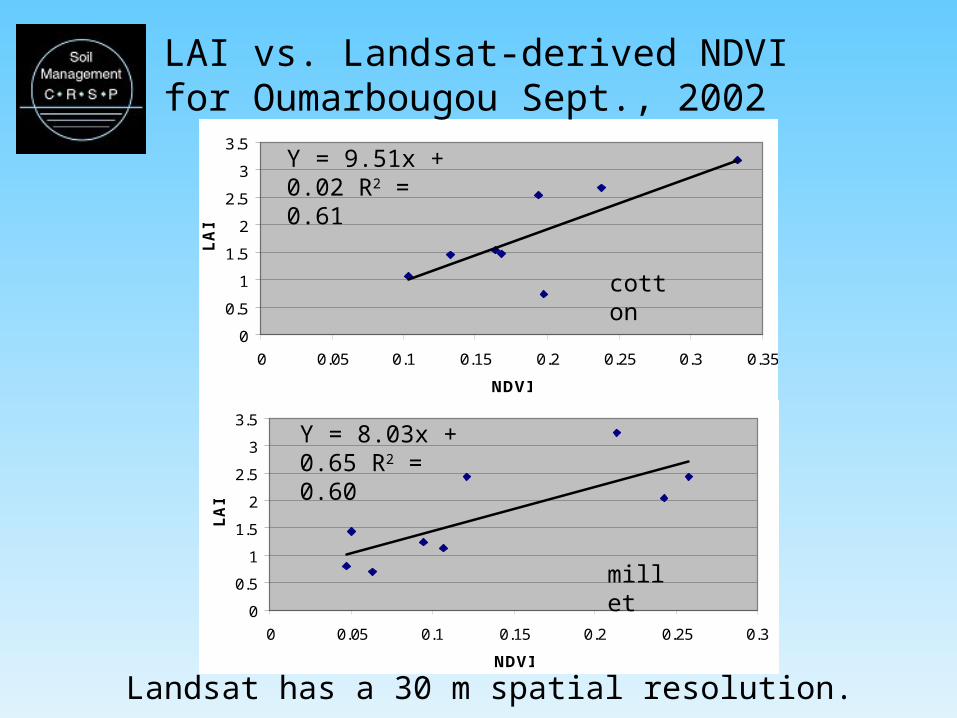
y = 9.5096x + 0.0151
R2 = 0.609
0
0.5
1
1.5
2
2.5
3
3.5
0 0.05 0.1 0.15 0.2 0.25 0.3 0.35
NDVI
LA
I
Y = 9.51x + 0.02 R2 = 0.61
cotton
y = 8.0394x + 0.6465
R2 = 0.5993
0
0.5
1
1.5
2
2.5
3
3.5
0 0.05 0.1 0.15 0.2 0.25 0.3
NDVI
LA
I
Y = 8.03x + 0.65 R2 = 0.60
millet
LAI vs. Landsat-derived NDVI for Oumarbougou Sept., 2002
Landsat has a 30 m spatial resolution.
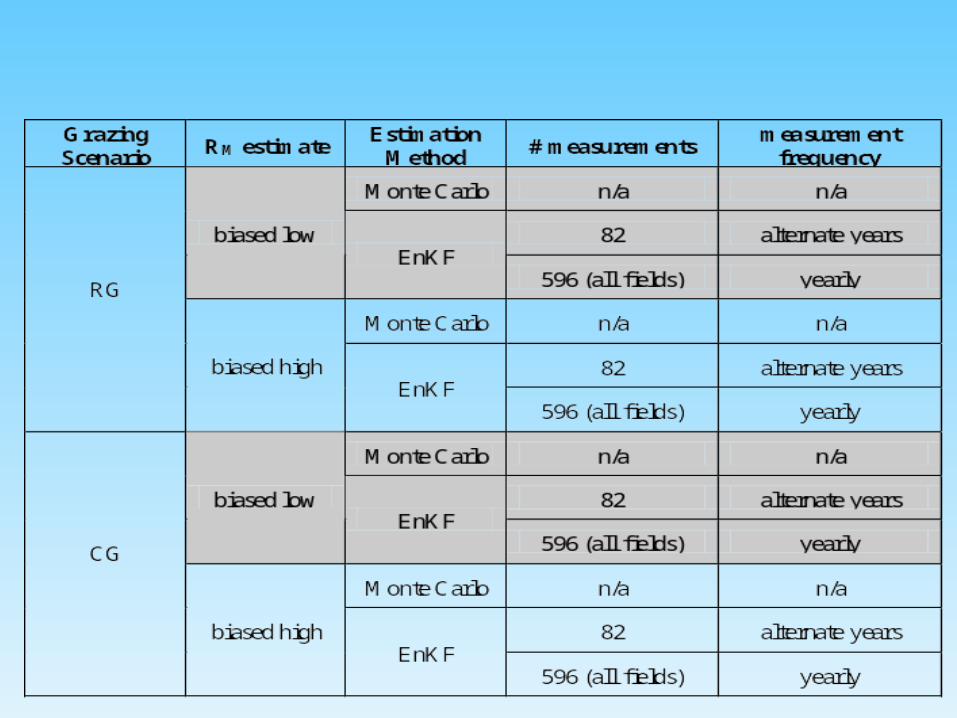
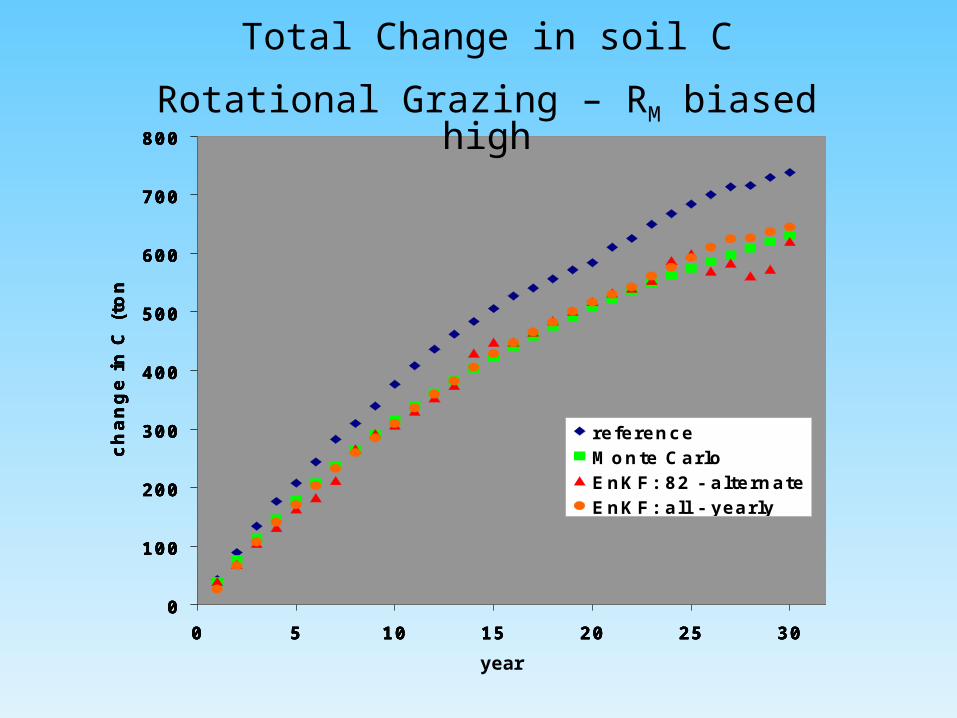
Figure 4.1 Estimated and reference change in C for the 150 ha site under rotational grazing for the RM biased high case. The three estimations were made using Monte-Carlo simulation, EnKF with 82 measurements in alternate years, and EnKF with measurements in all model cells in all years.
Figure 4.2 Error in estimation of change in C relative to reference C for the 150 ha site under rotational grazing and the RM biased high case.
0
1 0 0
2 0 0
3 0 0
4 0 0
5 0 0
6 0 0
7 0 0
8 0 0
0 5 1 0 1 5 2 0 2 5 3 0 3 5
ye a r
ch
an
ge
in
C (
ton
ne
s)
r e fe re n c e
M o n te C a r lo
E n K F : 8 2 - a lte rn a te
E n K F : a ll - ye a r ly
-4 5
-4 0
-3 5
-3 0
-2 5
-2 0
-1 5
-1 0
-5
0
0 5 1 0 1 5 2 0 2 5 3 0 3 5
ye a r
es
tim
ati
on
err
or
(%)
M o n te C a r lo
E n K F : 8 2 - a lte rn a te
E n K F : a ll - ye a r ly
0
1 0 0
2 0 0
3 0 0
4 0 0
5 0 0
6 0 0
7 0 0
8 0 0
0 5 1 0 1 5 2 0 2 5 3 0 3 5
ye a r
ch
an
ge
in
C (
ton
ne
s)
r e fe re n c e
M o n te C a r lo
E n K F : 8 2 - a lte rn a te
E n K F : a ll - ye a r ly
-4 5
-4 0
-3 5
-3 0
-2 5
-2 0
-1 5
-1 0
-5
0
0 5 1 0 1 5 2 0 2 5 3 0 3 5
ye a r
es
tim
ati
on
err
or
(%)
M o n te C a r lo
E n K F : 8 2 - a lte rn a te
E n K F : a ll - ye a r ly
year
Total Change in soil C
Rotational Grazing – RM biased high