Vulnerable young people - Disability Justice...
68
Vulnerable young people Interactions across homelessness, youth justice and child protection
Transcript of Vulnerable young people - Disability Justice...
Vulnerable young people
Interactions across homelessness, youth justice and child protection
This report reveals that individuals who experience multiple, cross-sector services in the specialist homelessness, protection or youth justice service areas are a particularly vulnerable group. Clients experiencing 2 or more of these services were more likely than specialist homelessness services-only clients: to report having mental health issues; to require more days of support and more support periods; and to remain homeless following support from specialist homelessness services agencies.


Vulnerable young people: interactions across homelessness, youth justice
and child protection
1 July 2011 to 30 June 2015
Australian Institute of Health and Welfare Canberra
Cat. no. HOU 279
The Australian Institute of Health and Welfare is a major national agency that provides reliable, regular and relevant information and statistics on Australia’s health and welfare.
The Institute’s purpose is to provide authoritative information and statistics to promote better health and wellbeing among Australians.
© Australian Institute of Health and Welfare 2016
This product, excluding the AIHW logo, Commonwealth Coat of Arms and any material owned by a third party or protected by a trademark, has been released under a Creative Commons BY 3.0 (CC-BY 3.0) licence. Excluded material owned by third parties may include, for example, design and layout, images obtained under licence from third parties and signatures. We have made all reasonable efforts to identify and label material owned by third parties.
You may distribute, remix and build upon this work. However, you must attribute the AIHW as the copyright holder of the work in compliance with our attribution policy available at <www.aihw.gov.au/copyright/>. The full terms and conditions of this licence are available at <http://creativecommons.org/licenses/by/3.0/au/>.
A complete list of the Institute’s publications is available from the Institute’s website <www.aihw.gov.au>.
ISBN 978-1-76054-056-2 (PDF) ISBN 978-1-76054-057-9 (Print)
Suggested citation Australian Institute of Health and Welfare 2016. Vulnerable young people: interactions across homelessness, youth justice and child protection—1 July 2011 to 30 June 2015. Cat. no. HOU 279. Canberra: AIHW.
Australian Institute of Health and Welfare Director Mr Barry Sandison
Any enquiries relating to copyright or comments on this publication should be directed to: Digital and Media Communications Unit Australian Institute of Health and Welfare GPO Box 570 Canberra ACT 2601 Tel: (02) 6244 1000 Email: [email protected]
Published by the Australian Institute of Health and Welfare
This publication is printed in accordance with ISO 14001 (Environmental Management Systems) and ISO 9001 (Quality Management Systems). The paper is sourced from sustainably managed certified forests.
Please note that there is the potential for minor revisions of data in this report. Please check the online version at <www.aihw.gov.au> for any amendments.

Contents Acknowledgments............................................................................................................................... v
Abbreviations ...................................................................................................................................... vi
Summary ............................................................................................................................................. vii
1 Introduction ................................................................................................................................... 1
1.1 Aims of the current study ...................................................................................................... 1
1.2 Data matching processes ........................................................................................................ 1
1.3 Overview of client groups ..................................................................................................... 3
2 Homelessness and child protection .......................................................................................... 6
2.1 Introduction ............................................................................................................................. 6
2.2 What were the characteristics of the SHS–CP cohort? ....................................................... 7
2.3 Why did they seek SHS assistance? .................................................................................... 11
2.4 What services did they receive? .......................................................................................... 12
2.5 What were the housing outcomes for clients? .................................................................. 15
2.6 What does this tell us? .......................................................................................................... 17
3 Homelessness and youth justice .............................................................................................. 19
3.1 Introduction ........................................................................................................................... 19
3.2 What were the characteristics of the SHS–YJ cohort? ...................................................... 21
3.3 Why did they seek SHS assistance? .................................................................................... 25
3.4 What services did they receive? .......................................................................................... 26
3.5 What were the housing outcomes for clients? .................................................................. 29
3.6 What does this tell us? .......................................................................................................... 31
4 Homelessness, child protection and youth justice ............................................................... 32
4.1 Introduction ........................................................................................................................... 32
4.2 What were the characteristics of the SHS–CP–YJ cohort? ............................................... 33
4.3 Why did they seek SHS assistance? .................................................................................... 36
4.4 What services did they receive? .......................................................................................... 38
4.5 What were the housing outcomes for clients? .................................................................. 41
4.6 What does this tell us? .......................................................................................................... 42
Appendix A: Data linkage, data gaps and limitations ................................................................ 43
Linkage .......................................................................................................................................... 43
Scope and coverage ..................................................................................................................... 43
Data availability ........................................................................................................................... 45
iii

Glossary ................................................................................................................................................ 47
References ............................................................................................................................................ 53
List of tables ........................................................................................................................................ 54
List of figures ...................................................................................................................................... 55
Related publications .......................................................................................................................... 56
iv

Acknowledgments This report was prepared by the staff of the Housing and Homelessness Reporting and Development Unit of the Australian Institute of Health and Welfare (AIHW).
We are grateful to the state and territory departments responsible for the delivery of specialist homelessness services for funding this research.
The contributions, comments and advice from the Juvenile Justice Research and Information Group, the Australasian Juvenile Justice Administrators, the Children and Families Data Network, and the Housing and Homelessness Data Network are gratefully acknowledged.
We are especially appreciative of all homelessness agencies, child protection services, youth justice services and their clients for their participation in these data collections, making research of this nature possible.
v

Abbreviations ABS Australian Bureau of Statistics
AIHW Australian Institute of Health and Welfare
CP NMDS Child Protection National Minimum Data Set
CP child protection
JJ NMDS Juvenile Justice National Minimum Data Set
METeOR Metadata Online Registry
SHS specialist homelessness services
SHSC Specialist Homelessness Services Collection
YJ youth justice
vi
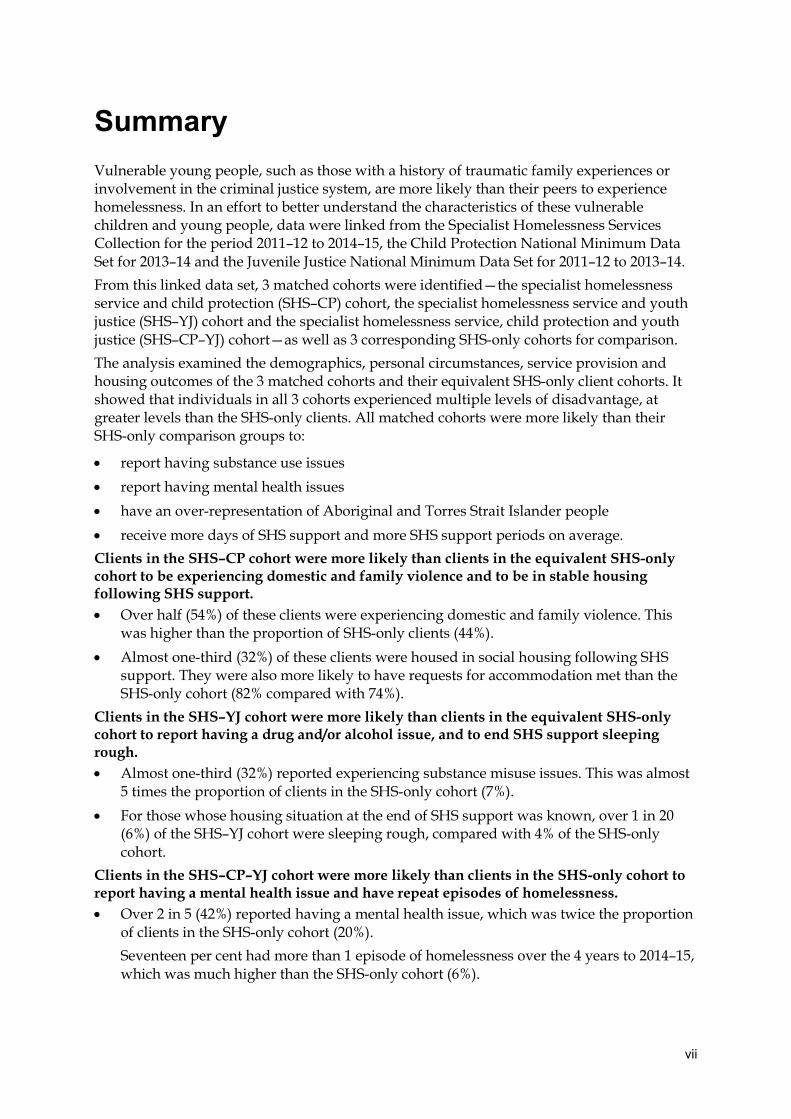
Summary Vulnerable young people, such as those with a history of traumatic family experiences or involvement in the criminal justice system, are more likely than their peers to experience homelessness. In an effort to better understand the characteristics of these vulnerable children and young people, data were linked from the Specialist Homelessness Services Collection for the period 2011–12 to 2014–15, the Child Protection National Minimum Data Set for 2013–14 and the Juvenile Justice National Minimum Data Set for 2011–12 to 2013–14. From this linked data set, 3 matched cohorts were identified—the specialist homelessness service and child protection (SHS–CP) cohort, the specialist homelessness service and youth justice (SHS–YJ) cohort and the specialist homelessness service, child protection and youth justice (SHS–CP–YJ) cohort—as well as 3 corresponding SHS-only cohorts for comparison. The analysis examined the demographics, personal circumstances, service provision and housing outcomes of the 3 matched cohorts and their equivalent SHS-only client cohorts. It showed that individuals in all 3 cohorts experienced multiple levels of disadvantage, at greater levels than the SHS-only clients. All matched cohorts were more likely than their SHS-only comparison groups to:
• report having substance use issues • report having mental health issues • have an over-representation of Aboriginal and Torres Strait Islander people • receive more days of SHS support and more SHS support periods on average. Clients in the SHS–CP cohort were more likely than clients in the equivalent SHS-only cohort to be experiencing domestic and family violence and to be in stable housing following SHS support. • Over half (54%) of these clients were experiencing domestic and family violence. This
was higher than the proportion of SHS-only clients (44%). • Almost one-third (32%) of these clients were housed in social housing following SHS
support. They were also more likely to have requests for accommodation met than the SHS-only cohort (82% compared with 74%).
Clients in the SHS–YJ cohort were more likely than clients in the equivalent SHS-only cohort to report having a drug and/or alcohol issue, and to end SHS support sleeping rough. • Almost one-third (32%) reported experiencing substance misuse issues. This was almost
5 times the proportion of clients in the SHS-only cohort (7%). • For those whose housing situation at the end of SHS support was known, over 1 in 20
(6%) of the SHS–YJ cohort were sleeping rough, compared with 4% of the SHS-only cohort.
Clients in the SHS–CP–YJ cohort were more likely than clients in the SHS-only cohort to report having a mental health issue and have repeat episodes of homelessness. • Over 2 in 5 (42%) reported having a mental health issue, which was twice the proportion
of clients in the SHS-only cohort (20%). Seventeen per cent had more than 1 episode of homelessness over the 4 years to 2014–15, which was much higher than the SHS-only cohort (6%).
vii


1 Introduction Specialist homelessness agencies have provided services to an estimated 628,000 people over the 4 years to 2014–15. Of these, approximately 187,500 (30%) were children and young people under the age of 18. Other studies have shown that vulnerable young people, such as those with a history of traumatic family experiences or involvement in the criminal justice system, are more likely than their peers to experience long-term homelessness (Chamberlain & Johnson 2011; MacKenzie et al. 2016). Previous research by the AIHW demonstrated that children and young people who are involved in homelessness services, child protection services or youth justice are more likely to be involved in another of the sectors than the general population (AIHW 2012). This highlights the importance of better understanding the characteristics of children and young people who are accessing homelessness services, who have also been involved in the child protection system or under youth justice supervision. This information can assist policymakers, service program developers and case workers to achieve the best outcomes for these children and young people.
This report provides an analysis of vulnerable children and young people who accessed homelessness services between 2011–12 and 2014–15, and who were also under child protection in 2013–14 and/or youth justice supervision between 2011–12 and 2013–14. The report examines the personal circumstances, service needs and housing outcomes of these vulnerable young people and highlights differences for comparable young people who only had contact with specialist homelessness services (SHS).
1.1 Aims of the current study This report, funded by the state/territory departments responsible for homelessness services, explores young people’s interaction with specialist homelessness services and implications for service delivery. Therefore the variables within the Specialist Homelessness Services Collection (SHSC) data are the primary focus of the analyses.
The main aims of the study are to:
• gain a better understanding of the characteristics of the children and young people who have accessed SHS agencies and have undergone youth justice supervision and/or received child protection services
• explore the trends in SHS service provision and housing outcomes for these children and young people.
1.2 Data matching processes In order to analyse the circumstances of clients who accessed specialist homelessness services and who were also involved in the child protection system and/or under youth justice supervision, the AIHW linked data from the following data sets:
• SHSC (2011–12, 2012–13, 2013–14, 2014–15) • Child Protection National Minimum Data Set (CP NMDS) (2013–14) • Juvenile Justice National Minimum Data Set (JJ NMDS) (2011–12, 2012–13, 2013–14)
(Box 1.1).
Vulnerable young people: interactions across homelessness, youth justice and child protection 1

Box 1.1: Data sets used in the linkage • SHSC: This national data collection contains information collected from homelessness
agencies funded under the National Affordable Housing Agreement and National Partnership Agreement on Homelessness. This includes information about clients receiving the services, the assistance they requested and outcomes achieved. National data from 4 collection years were available for the purposes of this study.
• CP NMDS: This person-based data set contains information on the demographics of children and young people (aged 0–17) who receive child protection services, the details of the investigated notifications received by child protection departments, and the care and protection orders and out-of-home care placements relating to these children and young people in a financial year. The 2013–14 data used for this study were available for all states and territories except New South Wales and Queensland. Together, these 2 states accounted for 58% of those receiving child protection services in Australia in 2013–14.
• JJ NMDS: This longitudinal person-based data set contains information on the demographics of young people (aged 10–17) who are supervised by youth justice departments in the financial year and the details of their unsentenced and/or sentenced supervision, both in the community and in youth justice detention centres. The 3 years of data used for this study were available for all states and territories except Western Australia and the Northern Territory. Together, these two jurisdictions accounted for 22% of those aged 10–17 under youth justice supervision in Australia in 2013–14.
Linkage was carried out between these data by using a statistical linkage key known as an SLK-581 (Box 1.2). Further detail on the linkage undertaken for this study can be found in Appendix A.
Box 1.2: What is an SLK-581? An SLK-581 is a code that uses selected letters from a person’s first and last names together with sex and date of birth to produce a statistical linkage key (SLK). This form of SLK is not fully ‘de-identified’; but it is used to avoid immediate recognition of individuals’ personal details in the certain data sets that are provided to AIHW. This SLK is then used to link an individual’s data across data sources that have an SLK-581 supplied. SLK-581s are securely transmitted to AIHW. AIHW does not include them in any linked datasets that are created for use by external researchers. Therefore those researchers do not ever see the SLK-581s, nor are they ever made publicly available.
It is important to note that although these data sets contain a significant number of children and young people across Australia, they do not represent a complete picture. They only represent those people who have presented for SHS and received a service from an SHS agency. Therefore, children and young people who were homeless/at risk of homelessness but who did not receive an SHS from 2011–12 to 2014–15, are not captured in the SHSC, nor are children and young people who tried to access SHS but were unsuccessful. Interpretability of results may also be affected by different reference periods for each collection being linked. Further information can be found in the Data Quality Statement.
2 Vulnerable young people: interactions across homelessness, youth justice and child protection

1.3 Overview of client groups Linking of the CP NMDS and the JJ NMDS to the SHSC produced data on 3 cohorts of interest: the SHS–CP cohort; the SHS–YJ cohort; and the SHS–CP–YJ cohort (Figure 1.1). Three other cohorts were also created, consisting of SHS-only clients of the same age and from the same jurisdictions, to allow comparisons between different types of service users.
Notes
1. The symbol := represents ‘equivalent by definition’.
2. For demographic comparisons only, equivalent non-matched CP-only, YJ-only and CP–YJ-only cohorts were also created. These are not included in this flow chart. For the number of individuals in the CP-only cohort, see Table 2.1. For the number of individuals in the YJ-only cohort, see Table 3.1. For the number of individuals in the CP–YJ-only cohort, see Table 4.1.
3. The SHS–CP–YJ cohort is mutually exclusive from the other 2 matched cohorts.
Figure 1.1: Flow chart of data linkage process and creation of matched cohorts and comparison groups
SHS Specialist Homelessness
Services Collection 2011–12 to 2014–15
CP Child Protection National
Minimum Data Set 2013–14
YJ Juvenile Justice National
Minimum Data Set 2011–12 to 2013–14
Data linked
Matched cohort groups
SHS–CP–YJ
n = 590
10–17 years
Vic, SA, Tas and ACT
SHS–CP
n = 11,973
0–17 years
Vic, WA, SA, Tas, ACT and NT
SHS–YJ
n = 5,133
10–17 years
NSW, Vic, Qld, SA, Tas and ACT
SHS-only
n = 60,061
10–17 years
NSW, Vic, Qld, SA, Tas and ACT
SHS equivalent comparison groups
SHS-only
n = 26,487
10–17 years
Vic, SA, Tas and ACT
SHS-only
n = 82,483
0–17 years
Vic, WA, SA, Tas, ACT and NT
:= := :=
Source data sets
Vulnerable young people: interactions across homelessness, youth justice and child protection 3

It was clear from this analysis that individuals in all 3 cohorts were experiencing multiple levels of disadvantage, at greater levels than the SHS-only clients. All matched cohorts were more likely than their SHS-only comparison groups to:
• report having substance use issues • report having mental health issues • have an over-representation of Aboriginal and Torres Strait Islander people • receive more days of SHS support and more SHS support periods on average. In addition, each matched cohort also presented with additional complex circumstances that were more strongly exhibited among that group.
SHS–CP cohort This cohort contained information on 11,973 children and young people who received both child protection services in 2013–14 and specialist homelessness services between 2011–12 and 2014–15. Generally, these clients were similar to the SHS-only clients. For example, both the SHS–CP cohort and the SHS-only cohort comprised 52% females and living arrangements were also similar between the 2 groups.
However, the SHS–CP cohort was more likely to be experiencing domestic and family violence (54% compared with 44%). Further information on the SHS–CP cohort can be found in Chapter 2.
SHS–YJ cohort This cohort contained information on 5,133 young people who were under youth justice supervision between 2011–12 and 2013–14 and received specialist homelessness services between 2011–12 and 2014–15. These clients appeared to be particularly vulnerable—they were more likely than the SHS-only cohort to need assistance with challenging social/behavioural problems (39% compared with 20%), seek SHS support due to lack of family and/or community support (38% compared with 21%), and to live alone on presentation to SHS agencies (38% compared with 15%).
Additionally, they received fewer nights of accommodation, on average, compared with the SHS-only cohort (100 nights compared with 132 nights). Further information on the SHS–YJ cohort can be found in Chapter 3.
SHS–CP–YJ cohort This cohort contained information on 590 young people who received child protection services in 2013–14 as well as specialist homelessness services between 2011–12 and 2014–15, and were also under youth justice supervision between 2011–12 and 2013–14. This cohort was the most likely of all cohorts to experience more than 1 episode of homelessness over the 4 years to 2014–15 (17%). This proportion was also much higher than for the SHS-only cohort (6%).
Additionally, although 1 in 2 (51%) of this cohort requested long-term housing, 60% were not provided with this service. Further information on the SHS–CP–YJ cohort can be found in Chapter 4.
4 Vulnerable young people: interactions across homelessness, youth justice and child protection

Characteristics across matched cohorts Although the main focus of this report is comparisons between the matched cohorts and their SHS-only equivalent cohort, the analysis also highlighted that each matched cohort presented with additional complex circumstances that were more strongly exhibited among that cohort, compared with the other matched cohorts. However, analyses across the matched cohorts will be affected by a number of factors, including the different age structures of the cohorts and the different jurisdictions and collection periods included. Comparisons across the matched cohorts should therefore be made with caution.
The SHS–CP cohort had the highest proportion of clients across matched cohorts to be:
• experiencing domestic and family violence (54%) • ending SHS support housed (68%) (Table 1.1). The SHS–YJ cohort had the highest proportion of clients across matched cohorts to be: • Indigenous (39%) • reporting having a drug and/or alcohol issue (32%) • requesting accommodation (80%) • ending SHS support sleeping rough (see Glossary) (6%) • homeless following SHS support (50%) (Table 1.1). The SHS–CP–YJ cohort had the highest proportion of clients across matched cohorts to be: • reporting having a mental health issue (42%) • reporting repeat episodes of homelessness (17%) • having requests for long-term accommodation go unmet (60%) (Table 1.1). SHS–CP–YJ clients also had, on average, more SHS support periods (4.0) than the other matched cohorts (3.5 for SHS–YJ clients and 2.6 for SHS–CP clients).
Table 1.1: Selected characteristics across matched cohorts
Characteristic SHS–CP SHS–YJ SHS–CP–YJ
Indigenous Australian 33% 39% 25%
Experiencing mental health issue 26% 39% 42%
Experiencing drug/alcohol issues 8% 32% 30%
Experiencing domestic and family violence 54% 34% 38%
Need accommodation 66% 80% 73%
Long-term accommodation needs unmet 50% 56% 60%
Average number of SHS support periods 2.6 3.5 4.0
Experience repeat episodes of homelessness 6% 15% 17%
End SHS support sleeping rough 3% 6% 5%
End SHS support homeless 32% 50% 43%
End SHS support housed 68% 50% 57%
Supplementary tables accompany this release; they are available online and referenced throughout the report as Table S.x.
Vulnerable young people: interactions across homelessness, youth justice and child protection 5
2 Homelessness and child protection
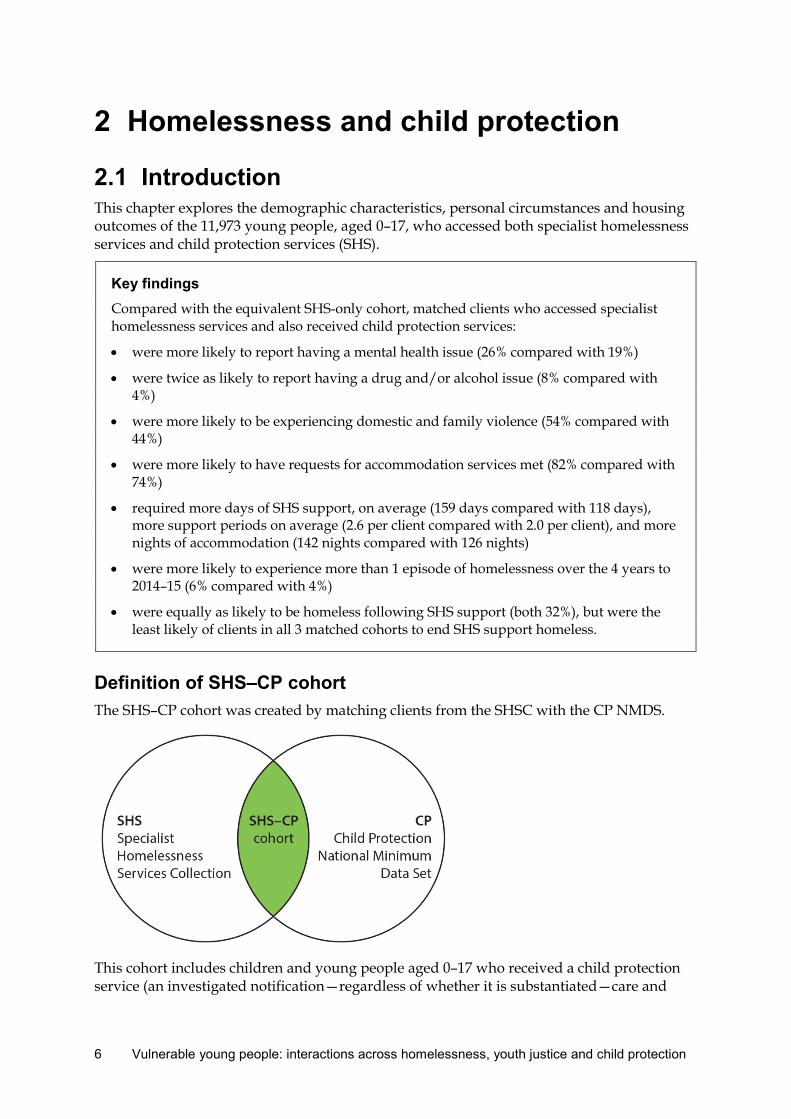
2.1 Introduction This chapter explores the demographic characteristics, personal circumstances and housing outcomes of the 11,973 young people, aged 0–17, who accessed both specialist homelessness services and child protection services (SHS).
Key findings Compared with the equivalent SHS-only cohort, matched clients who accessed specialist homelessness services and also received child protection services:
• were more likely to report having a mental health issue (26% compared with 19%)
• were twice as likely to report having a drug and/or alcohol issue (8% compared with 4%)
• were more likely to be experiencing domestic and family violence (54% compared with 44%)
• were more likely to have requests for accommodation services met (82% compared with 74%)
• required more days of SHS support, on average (159 days compared with 118 days), more support periods on average (2.6 per client compared with 2.0 per client), and more nights of accommodation (142 nights compared with 126 nights)
• were more likely to experience more than 1 episode of homelessness over the 4 years to 2014–15 (6% compared with 4%)
• were equally as likely to be homeless following SHS support (both 32%), but were the least likely of clients in all 3 matched cohorts to end SHS support homeless.
Definition of SHS–CP cohort The SHS–CP cohort was created by matching clients from the SHSC with the CP NMDS.
This cohort includes children and young people aged 0–17 who received a child protection service (an investigated notification—regardless of whether it is substantiated—care and
6 Vulnerable young people: interactions across homelessness, youth justice and child protection

protection order or out-of-home care) between 1 July 2013 and 30 June 2014 and also accessed homelessness services between 1 July 2011 and 30 June 2015. Children and young people who also were under youth justice supervision between 1 July 2011 and 30 June 2014 were not included in this cohort.
Due to jurisdictional data limitations in the CP NMDS, only clients who accessed both homelessness services and child protection services in Victoria, Western Australia, South Australia, Tasmania, the Australian Capital Territory and the Northern Territory child protection systems are included in this cohort.
Previous research findings Previous research conducted by the AIHW in 2012 found that young people exiting the child protection system were at risk of seeking support from homelessness services agencies (AIHW 2012). The study found that:
• Of young people exiting child protection (aged 15 and over), 8% sought homelessness services within 12 months, and 18% within 2 years.
• Four per cent of young people received SHS in the 12 months before their most recent notification.
Not all transitions from care for young people are smooth, because some young people leaving care experience difficulty accessing and maintaining stable housing. Those young people leaving care and experiencing difficulty with housing stability or homelessness were twice as likely to have reported problematic substance use in their lifetime, compared with young people who reported more stable housing outcomes following care (Johnson et al. 2010).
2.2 What were the characteristics of the SHS–CP cohort?
Client demographics Of all clients who received both child protection and specialist homelessness services:
Just over half (52%) were female
2 in 3 (66%) were aged 0–9 1 in 3 (33%) were Indigenous Australians
For demographic comparisons only, in addition to generating an SHS-only equivalent cohort of clients from the same jurisdictions and age group as those in the SHS–CP cohort, an equivalent non-matched child protection group (CP-only) was produced.
Vulnerable young people: interactions across homelessness, youth justice and child protection 7
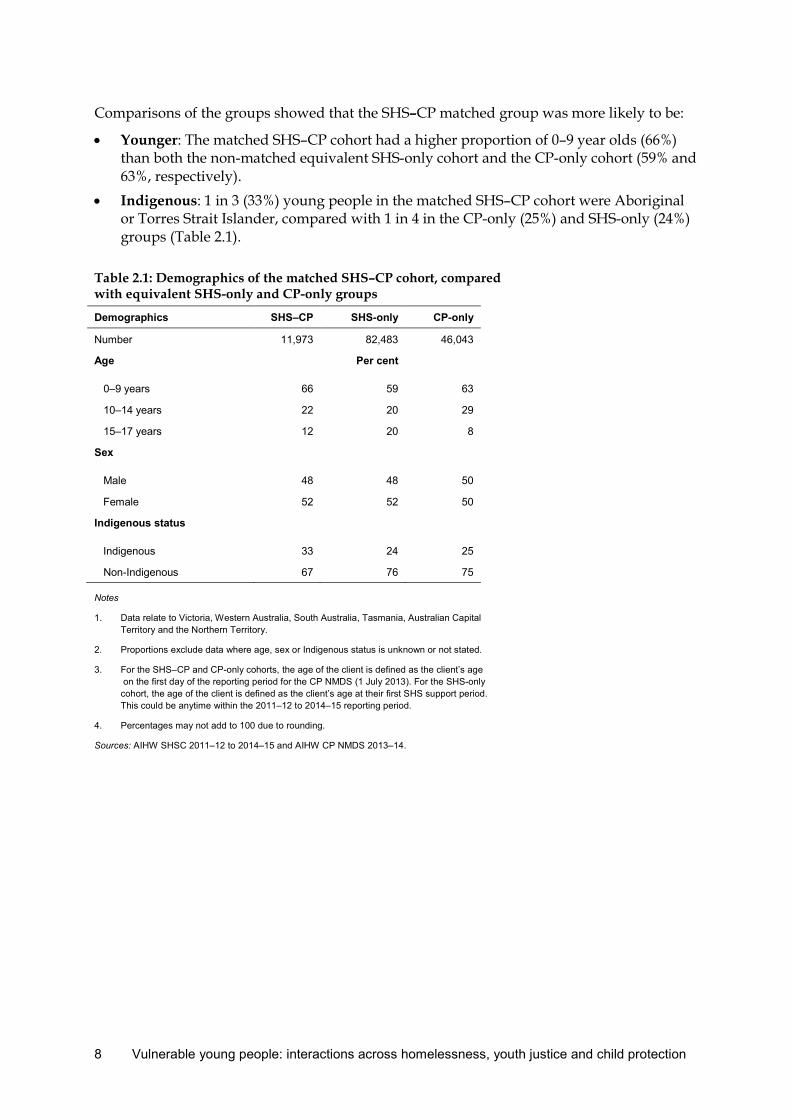
Comparisons of the groups showed that the SHS–CP matched group was more likely to be:
• Younger: The matched SHS–CP cohort had a higher proportion of 0–9 year olds (66%) than both the non-matched equivalent SHS-only cohort and the CP-only cohort (59% and 63%, respectively).
• Indigenous: 1 in 3 (33%) young people in the matched SHS–CP cohort were Aboriginal or Torres Strait Islander, compared with 1 in 4 in the CP-only (25%) and SHS-only (24%) groups (Table 2.1).
Table 2.1: Demographics of the matched SHS–CP cohort, compared with equivalent SHS-only and CP-only groups
Demographics SHS–CP SHS-only CP-only
Number 11,973 82,483 46,043
Age
Per cent
0–9 years 66 59 63
10–14 years 22 20 29
15–17 years 12 20 8
Sex
Male 48 48 50
Female 52 52 50
Indigenous status
Indigenous 33 24 25
Non-Indigenous 67 76 75
Notes
1. Data relate to Victoria, Western Australia, South Australia, Tasmania, Australian Capital Territory and the Northern Territory.
2. Proportions exclude data where age, sex or Indigenous status is unknown or not stated.
3. For the SHS–CP and CP-only cohorts, the age of the client is defined as the client’s age on the first day of the reporting period for the CP NMDS (1 July 2013). For the SHS-only cohort, the age of the client is defined as the client’s age at their first SHS support period. This could be anytime within the 2011–12 to 2014–15 reporting period.
4. Percentages may not add to 100 due to rounding.
Sources: AIHW SHSC 2011–12 to 2014–15 and AIHW CP NMDS 2013–14.
8 Vulnerable young people: interactions across homelessness, youth justice and child protection

Mental health
The SHSC identifies those clients aged 10 or older who seek specialist homelessness services and are experiencing a mental health issue. Around 1 in 4 (26%) young people aged 10–17 in the matched SHS–CP cohort reported having a mental health issue. This was higher than for clients aged 10–17 in the SHS-only cohort (19%).
Drugs and alcohol use
Young people in the SHS–CP cohort were twice as likely as those in the SHS-only cohort to be identified as having a current drug and alcohol issue (8% versus 4%).
Experiencing domestic and family violence
Fifty-four per cent of the SHS–CP cohort reported experiencing domestic and family violence (see Glossary). This was higher than in the SHS-only cohort (44%). This is unsurprising given that domestic and family violence can often be a driver for entry into the child protection system.
Young person presenting alone
Young people in the SHS–CP cohort aged 15–17 were less likely than clients in the SHS-only cohort to present to SHS agencies alone (11% compared with 14%).
Vulnerable young people: interactions across homelessness, youth justice and child protection 9

Personal circumstances on presentation to specialist homelessness services
Living arrangement on presentation The large majority of young people in this group were living as a member of a family group on presentation. The most common living arrangement on presentation for the SHS–CP cohort was as part of a one parent family with child(ren) (50%) (Figure 2.1). The living circumstances for this cohort were similar to the SHS-only group, with the only notable (but small) difference being the proportion of clients living as part of a couple with children (15% SHS–CP compared with 18% SHS-only).
Sources: AIHW SHSC 2011–12 to 2014–15 and AIHW CP NMDS 2013–14.
Figure 2.1: Living arrangement, by SHS–CP clients and SHS-only equivalent clients, 2011–12 to 2014–15
This cohort was more likely to live with other family (20%) when compared with the other matched cohorts and less likely than the other matched cohorts to report living as part of a group (6%).
Housing circumstances on first presentation SHS clients present with a variety of housing circumstances: some clients are at imminent risk of losing their housing and others are already homeless when they seek support. The service agencies offer many options for those clients that lack the resources or support to cope with a housing crisis.
Clients were assessed by the AIHW as being homeless or at risk of homelessness based on their dwelling type, tenure type and conditions of occupancy when first presenting to a homelessness agency, and again when their support had ended. A client is considered homeless if they fall into 1 of 3 categories when seeking assistance: having no shelter or living in an improvised dwelling; in short-term accommodation; or couch surfing or
Lone personchild(ren)
One parent withchild(ren)
Couple withchild(ren)
Couple without Other family Group
Living arrangement
0
10
20
30
40
50
60
Clients (per cent)
SHS-onlySHS–CP
10 Vulnerable young people: interactions across homelessness, youth justice and child protection
otherwise in accommodation where they have no tenure. A client is considered at risk of homelessness if they are in any other housing situation and for whatever reason are seeking assistance from the homelessness services agency. These housing situations include living in public or community housing, private housing or in institutional settings (see Glossary for detailed housing status definitions).
Fifty-nine per cent of the SHS–CP cohort presented to SHS agencies at risk of homelessness, with 41% presenting as homeless. By comparison, 61% of the SHS-only cohort was classified at risk of homelessness on first presentation, with 39% homeless. The most common housing situation at the beginning of SHS support, for those whose housing status was known, was private housing (35%)—the highest compared with the other matched cohorts. This group also reported the highest proportion of clients whose housing situation was short-term emergency accommodation (21%). Similar proportions of SHS–CP and SHS-only clients presented to services couch surfing (16% and 18%, respectively) and sleeping rough (7% and 5%, respectively).
2.3 Why did they seek SHS assistance? SHS clients can identify a number of reasons for seeking assistance from SHS agencies. These reasons can highlight risk factors for homelessness. Although the children/young people in this cohort predominantly lived with a family group on presentation to SHS, the reasons for seeking assistance reflect the circumstances of the young people themselves.
Compared with SHS-only clients, clients in the SHS–CP cohort were: • more likely to report family and domestic violence as a reason for seeking assistance
(51% compared with 43%) • more likely to seek assistance due to lack of family and/or community support
(15% compared with 12%) (Figure 2.2). Similar proportions of SHS–CP and SHS-only clients identified the following as reasons for seeking assistance: • housing crisis (28% and 26%, respectively) • inadequate or inappropriate dwelling conditions (21% and 19%) • relationship/family breakdown (24% and 22%) (Figure 2.2).
Vulnerable young people: interactions across homelessness, youth justice and child protection 11
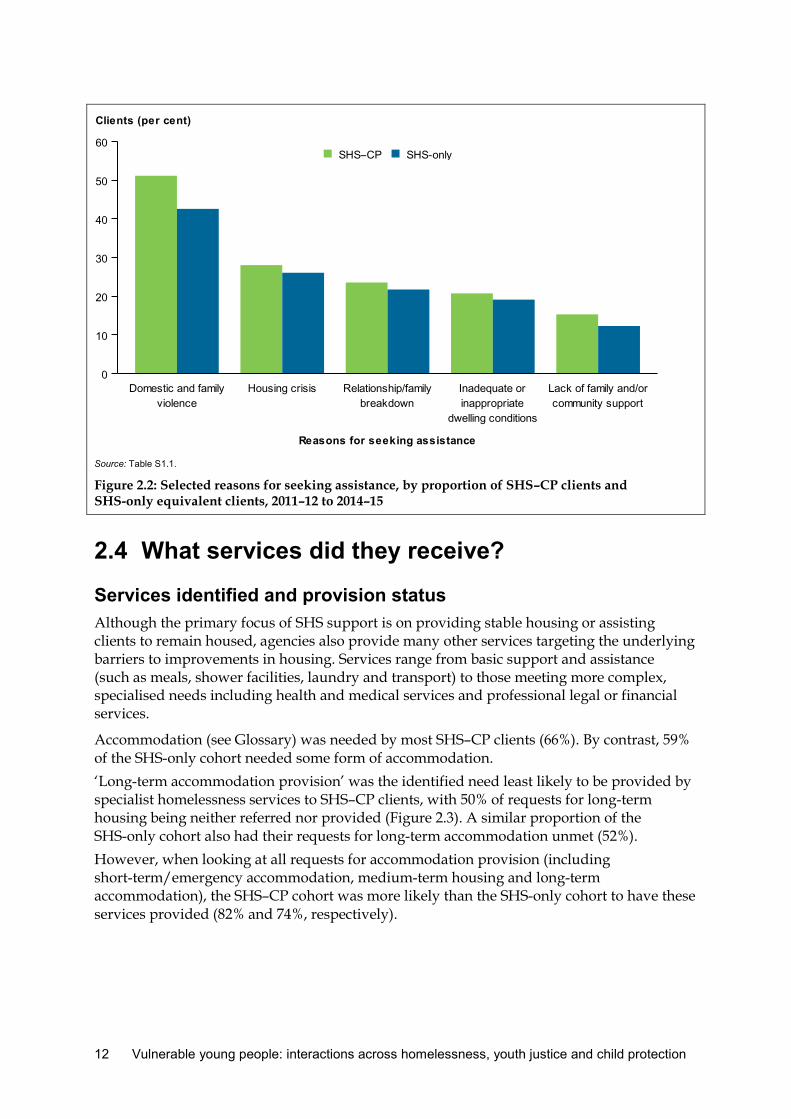
Source: Table S1.1.
Figure 2.2: Selected reasons for seeking assistance, by proportion of SHS–CP clients and SHS-only equivalent clients, 2011–12 to 2014–15
2.4 What services did they receive?
Services identified and provision status Although the primary focus of SHS support is on providing stable housing or assisting clients to remain housed, agencies also provide many other services targeting the underlying barriers to improvements in housing. Services range from basic support and assistance (such as meals, shower facilities, laundry and transport) to those meeting more complex, specialised needs including health and medical services and professional legal or financial services.
Accommodation (see Glossary) was needed by most SHS–CP clients (66%). By contrast, 59% of the SHS-only cohort needed some form of accommodation. ‘Long-term accommodation provision’ was the identified need least likely to be provided by specialist homelessness services to SHS–CP clients, with 50% of requests for long-term housing being neither referred nor provided (Figure 2.3). A similar proportion of the SHS-only cohort also had their requests for long-term accommodation unmet (52%). However, when looking at all requests for accommodation provision (including short-term/emergency accommodation, medium-term housing and long-term accommodation), the SHS–CP cohort was more likely than the SHS-only cohort to have these services provided (82% and 74%, respectively).
violenceDomestic and family Housing crisis
breakdownRelationship/family
dwelling conditionsinappropriateInadequate or
community supportLack of family and/or
Reasons for seeking assistance
0
10
20
30
40
50
60
Clients (per cent)
SHS-onlySHS–CP
12 Vulnerable young people: interactions across homelessness, youth justice and child protection

Note: The denominator for the proportions ‘provided’, ‘referred’ and ‘neither’ is the number of clients who identified a need for the service.
Source: Table S1.2.
Figure 2.3: Proportion of clients who needed accommodation services, by service provision status, SHS–CP and SHS-only clients, 2011–12 to 2014–15
Clients in the SHS–CP cohort were more than 3 times as likely as the SHS-only cohort to need child protection services (24% compared with 7%) (Figure 2.4). Compared with those in the SHS-only cohort, clients in the SHS–CP cohort were more likely to request: • domestic and family violence services (44% compared with 32%) • family, relationship assistance (33% compared with 23%) • assistance for challenging social/behavioural problems (23% compared with 13%) • assistance for trauma (18% compared with 10%) • court support (17% compared with 9%) • specialist counselling services (13% compared with 7%) (Table S1.2). The majority of clients in this cohort who requested these services were provided with them.
0 10 20 30 40 50 60 70
Clients (per cent)
Short-term or emergency accommodation
Medium-term/transitional housing
Long-term housing
NeitherReferredProvided
Short-term or emergency accommodation
Medium-term/transitional housing
Long-term housing
NeitherReferredProvided
SHS–CP
SHS-only
Vulnerable young people: interactions across homelessness, youth justice and child protection 13
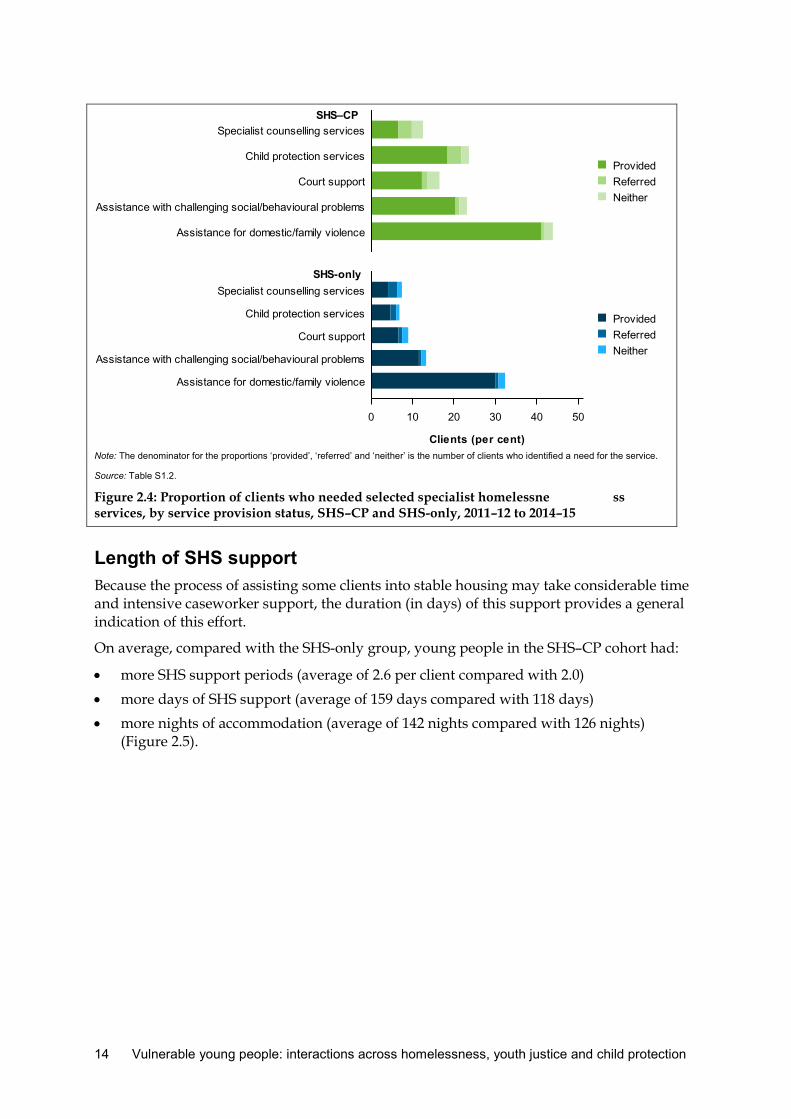
Note: The denominator for the proportions ‘provided’, ‘referred’ and ‘neither’ is the number of clients who identified a need for the service.
Source: Table S1.2.
Figure 2.4: Proportion of clients who needed selected specialist homelessne ss services, by service provision status, SHS–CP and SHS-only, 2011–12 to 2014–15
Length of SHS support Because the process of assisting some clients into stable housing may take considerable time and intensive caseworker support, the duration (in days) of this support provides a general indication of this effort.
On average, compared with the SHS-only group, young people in the SHS–CP cohort had:
• more SHS support periods (average of 2.6 per client compared with 2.0) • more days of SHS support (average of 159 days compared with 118 days) • more nights of accommodation (average of 142 nights compared with 126 nights)
(Figure 2.5).
0 10 20 30 40 50
Clients (per cent)
Assistance for domestic/family violence
Assistance with challenging social/behavioural problems
Court support
Child protection services
Specialist counselling services
NeitherReferredProvided
Assistance for domestic/family violence
Assistance with challenging social/behavioural problems
Court support
Child protection services
Specialist counselling services
NeitherReferredProvided
SHS–CP
SHS-only
14 Vulnerable young people: interactions across homelessness, youth justice and child protection

Sources: AIHW SHSC 2011–12 to 2014–15 and AIHW CP NMDS 2013–14.
Figure 2.5: SHS–CP and SHS-only clients, by average number of support days and accommodation nights, 2011–12 to 2014–15
Young people who accessed specialist homelessness services following contact with the child protection system The scope of this cohort included children and young people who received child protection services between 1 July 2013 and 30 June 2014 and SHS from 1 July 2011 to 30 June 2015. It is possible that these children/young people could have accessed these services earlier than these dates. The dates of any earlier activity can be identified in the CP NMDS, but not in the SHSC.
Using the earliest dates available across both data sets, just over half of the clients in the SHS–CP cohort (53%) were identified as having accessed SHS after being involved in the child protection system.
This analysis is limited to the availability and quality of data across both child protection and SHS collections. In particular, although earlier dates of child protection activity are available in the CP NMDS, data in the SHSC are restricted to support periods between 1 July 2011 and 30 June 2015. This creates a potential bias in assessing the proportion of clients who had CP activity before SHSC services. As years of data accumulate for both data collections, a more in-depth examination of the pathways between child protection and homelessness services can be explored.
2.5 What were the housing outcomes for clients? Specialist homelessness agencies aim to assist clients either presenting homeless into stable housing or to assist clients at risk of homelessness to remain housed.
Days of support Nights of accommodation0
50
100
150
200
Average number of days/nights
SHS-onlySHS–CP
Vulnerable young people: interactions across homelessness, youth justice and child protection 15

The analysis of housing outcomes requires a client to have all SHS support periods closed at the end of the study period. Most (88%) clients in the SHS–CP cohort and the SHS-only cohort (91%) had all support periods closed at the end of the study period and their housing outcomes have been included in the analysis. Although the AIHW can identify the housing situation immediately after the last support period reported, it is not possible to determine whether the outcome was sustained. Following SHS support, housing outcomes across both groups were similar. Over two-thirds (68%) of the SHS–CP cohort ended their support at risk of homelessness (see Glossary), rather than homeless: an 11 percentage point increase from first presentation. Sixty-eight per cent of the SHS-only cohort also ended support in housing (including social housing, private or other housing or an institutional setting). This represented a 10 percentage point increase on presentation. Following SHS support, there were improvements in housing outcomes across both the SHS–CP matched group and the SHS-only group (Figure 2.6), but compared with SHS-only clients, SHS–CP clients were: • more likely to be housed in public or community (social) housing (32% compared with
25%) following SHS support. This was an 11 percentage point increase on first presentation.
• less likely to be housed in private or other housing (34% compared with 44%) following SHS support. Nevertheless, this was the most likely housing outcome for SHS–CP clients.
Both the SHS–CP matched and SHS-only cohorts experienced similar rates of living in short-term accommodation (20% compared with 17%), couch surfing (9% compared with 11%) and living with no shelter or in improvised/inadequate dwelling (sleeping rough) (both 3%) at the end of SHS support. SHS agencies were also successful in reducing the proportion of clients in the SHS–CP cohort living in the most unstable of situations—sleeping rough (from 8% on first presentation to 3% on final presentation) and couch surfing (from 15% on first presentation to 9% on final presentation).
16 Vulnerable young people: interactions across homelessness, youth justice and child protection

Note: Proportions include only clients with closed support at the end of the study period, 2014–15.
Source: Table S1.3.
Figure 2.6: SHS–CP and SHS-only clients, by housing situation at beginning and end of support, 2011–12 to 2014–15
Repeat episodes of homelessness Six per cent of SHS–CP clients experienced repeat homelessness over the 4 years to 2014–15. This means that the client had transitioned between being homeless, housed and then homeless again at least once during this time. This was less than half the rate experienced in SHS–YJ (15%) and the SHS–CP–YJ (17%) cohorts but higher than the SHS-only cohort (4%).
2.6 What does this tell us? Children and young people in the SHS–CP cohort shared many of the same demographics and characteristics as those in the SHS-only cohort. There were some key differences, however, which indicate additional vulnerabilities.
Although previous analysis of SHSC data by the AIHW has shown that domestic and family violence was a key reason for children and young people accessing SHS agencies, with those aged 0–17 representing 33% of all people requesting assistance experiencing domestic and family violence in 2014–15 (AIHW 2015), the current report reveals matched young clients were particularly impacted by these experiences. SHS–CP clients were more likely than the SHS-only cohort to report experiencing domestic and family violence.
Achieving a stable housing outcome was less difficult for this cohort than the other 2 matched cohorts, with more clients in this cohort ending support housed. In particular, there were large increases in the proportion of clients living in social housing following support. This reflects not only the assistance provided by agencies to obtain a stable housing outcome for their clients, but also the crucial role that social housing plays in accommodating those with multiple levels of disadvantage and vulnerability.
50 40 30 20 10 0 10 20 30 40 50
Clients (per cent)
Institutional settings
Private or other housing
Public or community housing
Couch surfing or no tenure
Short-term temporary accommodation
No shelter or improvised dwelling
Housing situation
SHS-onlySHS–CP
First reported Last reported
Vulnerable young people: interactions across homelessness, youth justice and child protection 17

Despite reporting higher rates of drug and alcohol or mental health issues than the SHS-only clients, SHS–CP clients reported these issues at lower rates than clients in the other matched cohorts. These may be factors influencing the better housing prospects of these clients compared with the other matched cohorts.
18 Vulnerable young people: interactions across homelessness, youth justice and child protection
3 Homelessness and youth justice
3.1 Introduction This chapter explores the demographic characteristics, personal circumstances and housing outcomes of the 5,133 young people, aged 10–17, who accessed specialist homelessness services (SHS) and had also been under youth justice supervision.
Key findings Matched clients who accessed specialist homelessness services and had also been under youth justice supervision:
• were almost 5 times as likely to report having an issue with drugs and/or alcohol (32% compared with 7%) as the equivalent SHS-only cohort
• were almost twice as likely to report having a mental health issue (39% compared with 22%) as the SHS-only cohort
• were more than twice as likely as the SHS-only cohort to report repeat homelessness between 2011–12 and 2014–15 (15% versus 6%).
Matched clients receiving both specialist homelessness services and under youth justice supervision had poorer housing outcomes and appeared to have more barriers to overcome compared with the SHS-only cohort:
• They had, on average, more SHS support periods (3.5 compared with 2.0 for SHS-only). They also received more SHS support days (average of 151 days compared with 120 days for SHS-only).
• They spent fewer nights, on average, in accommodation than SHS-only clients (100 nights compared with 132 nights), despite being the most likely of all matched cohorts to need accommodation at 80%, and higher than the SHS-only clients (63%).
• They were almost twice as likely to need assistance with challenging social/behavioural problems (39% compared with 20%). They were more than twice as likely to live alone on presentation to SHS agencies (38% compared with 15%) and more likely to report lack of family and/or community support as a reason for seeking assistance from SHS agencies (38% compared with 21%).
• They were the most likely of all cohorts to be homeless following SHS support (50%).
The SHS–YJ matched group were also more likely to be male than the SHS-only group (69% and 44%, respectively), but less likely to be male than the YJ-only cohort (86%), indicating that females under youth justice supervision may be more likely than males to seek SHS support when facing a housing crisis.
Vulnerable young people: interactions across homelessness, youth justice and child protection 19

Definition of SHS–YJ cohort The SHS–YJ cohort was created by matching clients from the SHSC with the JJ NMDS.
This cohort includes young people aged 10–17 who were supervised by youth justice departments between 1 July 2011 and 30 June 2014 and also accessed homelessness services between 1 July 2011 and 30 June 2015. Young people who also accessed child protection services between 1 July 2013 and 30 June 2014 were not included in this cohort.
Due to jurisdictional data limitations in the JJ NMDS, only clients reported in New South Wales, Victoria, Queensland, South Australia, Tasmania, and the Australian Capital Territory youth justice systems are included in this cohort.
Previous research findings Journeys Home, a longitudinal survey of over 1,500 people conducted over approximately 3 years to examine housing stability and homelessness in Australia found that participants who had been involved with youth justice before the Journeys Home survey were more likely to be homeless than those who had no interaction with the youth justice system (28% compared with 20%). These individuals were also almost twice as likely to be rough sleepers as those with no involvement with youth justice (5.5% compared with 2.9%) (Bevitt et al. 2015).
Further, previous research conducted by the AIHW found that:
• almost 15% of young people under juvenile justice supervision accessed homelessness support services within the 12 months before the start of their most recent youth justice supervision, and almost 20% within the previous 2 years
• one in 12 (8%) young people accessed homelessness support services within 12 months after the end of their most recent juvenile justice supervision, while 1 in 8 (12%) received it within 2 years (AIHW 2012).
It is therefore evident that homelessness may be a risk factor for, and/or consequence of, involvement in the youth justice system.
20 Vulnerable young people: interactions across homelessness, youth justice and child protection

3.2 What were the characteristics of the SHS–YJ cohort?
Client demographics Of all clients under youth justice supervision and who also accessed specialist homelessness services:
7 in 10 (69%) were male 3 in 5 (58%) were aged 15–17 2 in 5 (39%) were Indigenous Australians
For demographic comparisons the equivalent (from the same jurisdictions and age group) non-matched groups were produced for young people only in YJ and those in SHS-only. Comparisons of the groups showed that the SHS–YJ matched group were more likely to be:
• Indigenous: Almost 2 in 5 (39%) were Indigenous, compared with clients in the YJ-only cohort (35%) and SHS-only (23%).
• Older: The matched SHS–YJ cohort was more likely to be aged 15–17 (58%) compared with both the YJ-only cohort (55%) and SHS-only (52%) (Table 3.1).
The SHS–YJ matched group were also more likely to be male than the SHS-only group (69% and 44%, respectively), but less likely to be male than the YJ-only cohort (86%), indicating that females under youth justice supervision may be more likely than males to seek SHS support when facing a housing crisis.
Vulnerable young people: interactions across homelessness, youth justice and child protection 21

Table 3.1: Demographics of the matched SHS–YJ cohort, compared with equivalent SHS-only and YJ-only groups
Demographics SHS–YJ SHS-only YJ-only
Number 5,133 60,061 8,971
Age
Per cent
10–14 years 42 48 45
15–17 years 58 52 55
Sex
Male 69 44 86
Female 31 56 14
Indigenous status
Indigenous 39 23 35
Non-Indigenous 61 77 65
Notes
1. Data relate to New South Wales, Victoria, Queensland, South Australia, Tasmania and the Australian Capital Territory.
2. Proportions exclude data where age, sex or Indigenous status is unknown or not stated.
3. For the SHS–YJ and YJ-only cohorts, the age of the client is defined as the client’s age on the first day of the reporting period for the JJ NMDS (1 July 2011). For the SHS-only cohort, the age of the client is defined as the client’s age at their first SHS support period. This could be anytime within the 2011–12 to 2014–15 reporting period.
Sources: AIHW SHSC 2011–12 to 2014–15 and AIHW JJ NMDS 2011–12 to 2013–2014.
22 Vulnerable young people: interactions across homelessness, youth justice and child protection
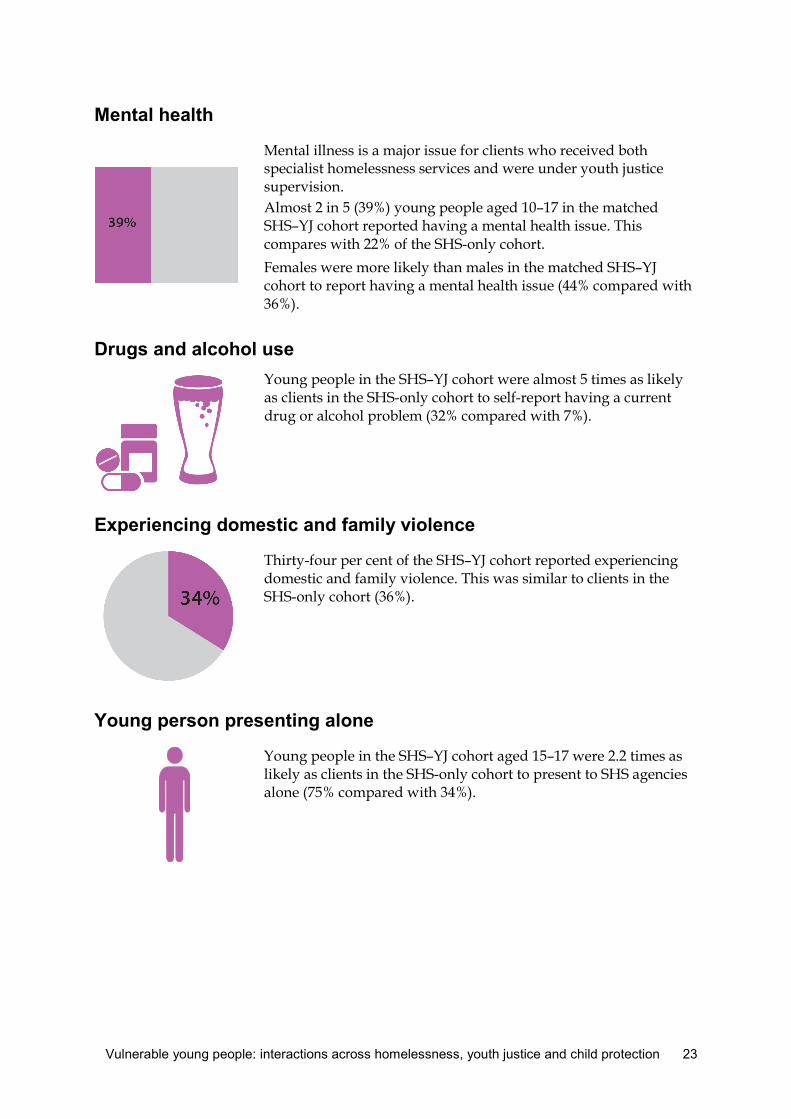
Mental health
Mental illness is a major issue for clients who received both specialist homelessness services and were under youth justice supervision. Almost 2 in 5 (39%) young people aged 10–17 in the matched SHS–YJ cohort reported having a mental health issue. This compares with 22% of the SHS-only cohort. Females were more likely than males in the matched SHS–YJ cohort to report having a mental health issue (44% compared with 36%).
Drugs and alcohol use
Young people in the SHS–YJ cohort were almost 5 times as likely as clients in the SHS-only cohort to self-report having a current drug or alcohol problem (32% compared with 7%).
Experiencing domestic and family violence
Thirty-four per cent of the SHS–YJ cohort reported experiencing domestic and family violence. This was similar to clients in the SHS-only cohort (36%).
Young person presenting alone
Young people in the SHS–YJ cohort aged 15–17 were 2.2 times as likely as clients in the SHS-only cohort to present to SHS agencies alone (75% compared with 34%).
Vulnerable young people: interactions across homelessness, youth justice and child protection 23

Personal circumstances on presentation to specialist homelessness services
Living arrangement on presentation In contrast to the SHS-CP cohort, more than half of the young people here lived alone or in a non-family group on presentation. The most common living arrangement on presentation to SHS agencies for this cohort was living alone (38%), which was much higher than the SHS-only cohort (15%) (Figure 3.1).
Sources: AIHW SHSC 2011–12 to 2014–15 and AIHW JJ NMDS 2011–12 to 2013–2014.
Figure 3.1: Living arrangement, by SHS–YJ clients and SHS-only equivalent clients, 2011–12 to 2014–15
This cohort was twice as likely to live with others in a group (15%) than the SHS-only cohort (7%) and much less likely to report their living arrangement as one parent with child(ren) (16% compared with 42%).
Housing at first presentation Fifty-four per cent of the matched cohort presented to SHS agencies as homeless, with 46% presenting at risk of homelessness (see Glossary). By comparison, 44% of the SHS-only group presented as homeless. Of those whose housing situation at the beginning of SHS support was known, the most common housing situation first reported to SHS agencies was couch surfing or no tenure (30%)—the highest of all the matched cohorts. This group also reported the highest proportion of clients whose housing situation on presentation was rough sleeping (no shelter or improvised dwelling) (10%) and institutional settings (9%).
Lone personchild(ren)
One parent withchild(ren)
Couple withchild(ren)
Couple without Other family Group
Living arrangement
0
10
20
30
40
50
Clients (per cent)
SHS-onlySHS–YJ
24 Vulnerable young people: interactions across homelessness, youth justice and child protection

3.3 Why did they seek SHS assistance? Clients in the SHS–YJ cohort identified considerably more reasons for seeking assistance than those in the SHS-only cohort. This suggests that these clients were experiencing multiple levels of disadvantage.
Compared with clients in the SHS-only cohort, clients in the SHS–YJ cohort were:
• far more likely to identify problematic drug use (25% compared with 5%) or alcohol use (12% compared with 2%) as reasons for seeking assistance
• more likely to seek assistance following a transition from custodial arrangements (16% compared with 1%)
• almost twice as likely to identify mental health issues as a reason for seeking assistance (21% compared with 11%)
• more than twice as likely to identify disengagement with school or other education training as a reason for seeking assistance (21% compared with 9%)
• more than 3 times as likely to be itinerant, with no fixed address (13% compared with 4%)
• more than 3 times as likely to seek assistance due to unemployment (22% compared with 7%)
• more likely to seek assistance due to a housing crisis (50% compared with 34%) • more likely to identify lack of family and/or community support as a reason for seeking
assistance (38% compared with 21%) • more likely to identify relationship/family breakdown (55% compared with 35%), and
time out from family situation (40% compared with 20%) as reasons for seeking assistance (Figure 3.2; Table S2.1).
Twenty-eight per cent of the SHS–YJ cohort identified domestic and family violence as a reason for seeking assistance. This was slightly lower than for the SHS-only cohort (31%).
Vulnerable young people: interactions across homelessness, youth justice and child protection 25

Source: Table S2.1.
Figure 3.2: Selected reasons for seeking assistance, by proportion of SHS–YJ clients and SHS-only equivalent clients, 2011–12 to 2014–15
3.4 What services did they receive?
Services identified and provision status Four in 5 clients in the SHS–YJ cohort requested assistance with some form of accommodation (80%). By comparison, 63% of the SHS-only cohort requested accommodation services.
‘Long-term accommodation provision’ was the need least able to be provided by SHS agencies to SHS–YJ clients, with 56% of requests for long-term housing being neither referred nor provided (Figure 3.3). Slightly fewer of the SHS-only cohort had their requests for long-term accommodation unmet (53%). However, when looking at short-term/emergency accommodation provision, the SHS–YJ cohort was more likely than the SHS-only cohort to have their needs met (73% and 67%, respectively).
breakdownRelationship/family Housing crisis
community supportLack of family and/or
substance useProblematic drug or
useProblematic alcohol
Reasons for seeking assistance
0
10
20
30
40
50
60
Clients (per cent)
SHS-onlySHS–YJ
26 Vulnerable young people: interactions across homelessness, youth justice and child protection

Note: The denominator for the proportions ‘provided’, ‘referred’ and ‘neither’ is the number of clients who identified a need for the service.
Source: Table S2.2.
Figure 3.3: Proportion of clients who needed accommodation services, by service provision status, SHS–YJ and SHS-only, 2011–12 to 2014–15
The SHS–YJ clients were almost 5 times as likely as the SHS-only cohort to need drug/alcohol counselling (19% compared with 4%) (Figure 3.4). They were also nearly twice as likely to need mental health services (20% compared with 12%). General services (see Glossary) were the most common identified need for clients in SHS–YJ cohort (97%). Within general services, the SHS–YJ cohort requested almost all services at a higher rate than the SHS-only cohort, particularly for: • assistance for challenging social/behavioural problems (39% compared with 20%) • living skills/personal development (53% compared with 32%) • court support (23% compared with 9%) • legal information (30% compared with 16%) (Table S2.2). However, need for domestic/family violence assistance was lower in the SHS–YJ cohort compared with the SHS-only (21% and 25%, respectively).
0 10 20 30 40 50 60 70
Clients (per cent)
Short-term or emergency accommodation
Medium-term/transitional housing
Long-term housing
NeitherReferredProvided
Short-term or emergency accommodation
Medium-term/transitional housing
Long-term housing
NeitherReferredProvided
SHS–YJ
SHS-only
Vulnerable young people: interactions across homelessness, youth justice and child protection 27

Note: The denominator for the proportions ‘provided’, ‘referred’ and ‘neither’ is the number of clients who identified a need for the service.
Source: Table S2.2.
Figure 3.4: Proportion of clients who needed selected specialist homelessness services, by service provision status, SHS–YJ and SHS-only, 2011–12 to 2014–15
Length of SHS support Young people in the SHS–YJ cohort, compared with the SHS-only cohort, received:
• more SHS support periods (average of 3.5 per client compared with 2.0 support periods per client
• more days of SHS support (average of 151 days compared with 120 days) (Figure 3.5). They were, however, accommodated for fewer nights (average of 100 nights compared with 132 nights for SHS-only), despite being more likely to request accommodation services than the SHS-only cohort, and being the most likely of all matched cohorts to request accommodation (80%). This could be for a variety of reasons, including the inability of specialist homelessness services to accommodate the more complex needs of this cohort. Clients in this cohort were also the most likely to be living alone on presentation to SHS agencies. The fewer nights of accommodation provided may be reflective of homelessness services prioritising available longer term accommodation for those who present as families. Young people in this cohort who have been remanded in custody or sentenced to detention will also not receive nights of accommodation during this period.
0 10 20 30 40 50 60
Clients (per cent)
Assistance for domestic/family violence
Assistance with challenging social/behavioural problems
Living skills/personal development
Mental health service
Drug/alcohol counselling
NeitherReferredProvided
Assistance for domestic/family violence
Assistance with challenging social/behavioural problems
Living skills/personal development
Mental health service
Drug/alcohol counselling
NeitherReferredProvided
SHS–YJ
SHS-only
28 Vulnerable young people: interactions across homelessness, youth justice and child protection

Sources: AIHW SHSC 2011–12 to 2014–15 and AIHW JJ NMDS 2011–12 to 2013–2014.
Figure 3.5: SHS–YJ and SHS-only clients, by average number of support days and accommodation nights, 2011–12 to 2014–15
Young people who accessed specialist homelessness services following involvement with the youth justice system An objective of the National Partnership Agreement on Homelessness 2015–17 is ensuring that individuals do not exit youth justice into homelessness (COAG 2015).
This analysis is limited to the availability and quality of data across both juvenile justice and specialist homelessness services collections. Young people who were under youth justice supervision any time between 1 July 2011 and 30 June 2014 and who received SHS services between 1 July 2011 and 30 June 2015 were included in this cohort. However, the date of first youth justice supervision for this group is available from the JJ NMDS and may be before this reference period. Therefore, interpretation of this analysis should consider potential bias due to data set limitations. When comparing the earliest date of youth justice supervision with the first recorded homelessness support period, three-quarters (75%) of clients in the SHS–YJ cohort accessed specialist homelessness services after experiencing youth justice supervision.
3.5 What were the housing outcomes for clients?
Housing outcomes The analysis of housing outcomes required a client to have all periods of SHS support received, closed. A large proportion (89%) of young clients in the SHS–YJ matched group and the SHS-only clients (90%) were not being supported by specialist homelessness agencies at the end of the study period and their housing outcomes were able to be measured.
Days of support Nights of accommodation0
50
100
150
200
Average number of days/nights
SHS-onlySHS–YJ
Vulnerable young people: interactions across homelessness, youth justice and child protection 29
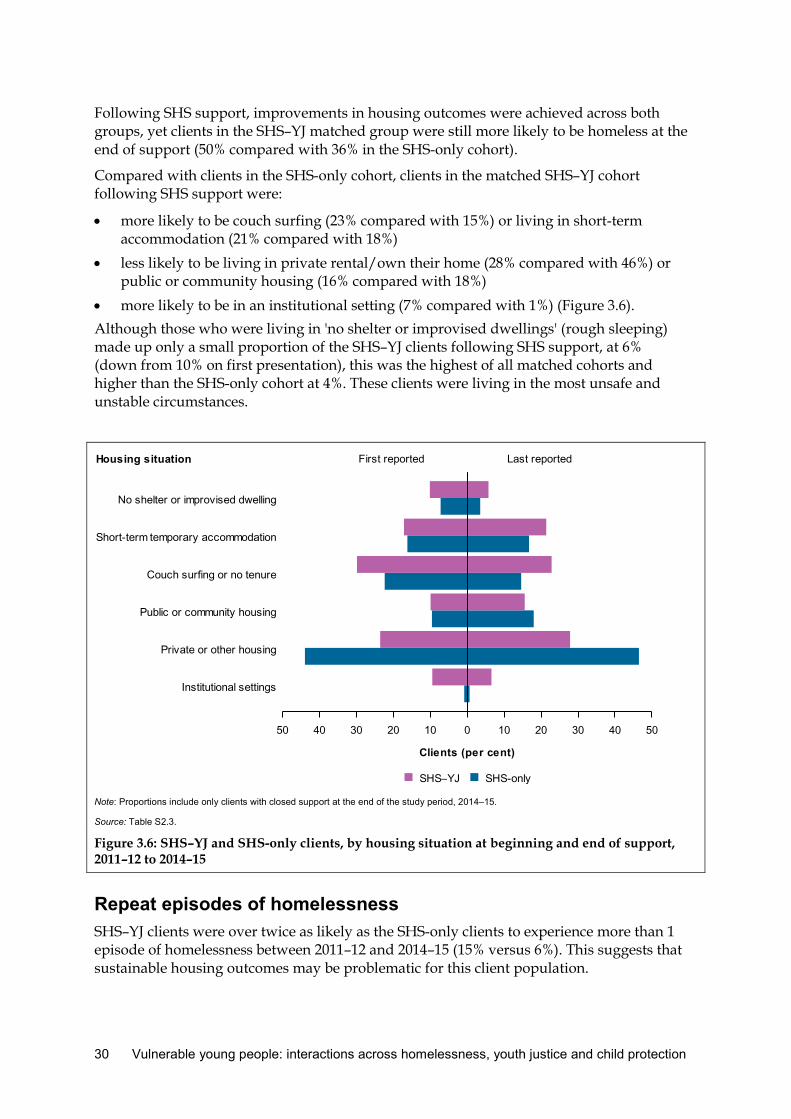
Following SHS support, improvements in housing outcomes were achieved across both groups, yet clients in the SHS–YJ matched group were still more likely to be homeless at the end of support (50% compared with 36% in the SHS-only cohort).
Compared with clients in the SHS-only cohort, clients in the matched SHS–YJ cohort following SHS support were:
• more likely to be couch surfing (23% compared with 15%) or living in short-term accommodation (21% compared with 18%)
• less likely to be living in private rental/own their home (28% compared with 46%) or public or community housing (16% compared with 18%)
• more likely to be in an institutional setting (7% compared with 1%) (Figure 3.6). Although those who were living in 'no shelter or improvised dwellings' (rough sleeping) made up only a small proportion of the SHS–YJ clients following SHS support, at 6% (down from 10% on first presentation), this was the highest of all matched cohorts and higher than the SHS-only cohort at 4%. These clients were living in the most unsafe and unstable circumstances.
Note: Proportions include only clients with closed support at the end of the study period, 2014–15.
Source: Table S2.3.
Figure 3.6: SHS–YJ and SHS-only clients, by housing situation at beginning and end of support, 2011–12 to 2014–15
Repeat episodes of homelessness SHS–YJ clients were over twice as likely as the SHS-only clients to experience more than 1 episode of homelessness between 2011–12 and 2014–15 (15% versus 6%). This suggests that sustainable housing outcomes may be problematic for this client population.
50 40 30 20 10 0 10 20 30 40 50
Clients (per cent)
Institutional settings
Private or other housing
Public or community housing
Couch surfing or no tenure
Short-term temporary accommodation
No shelter or improvised dwelling
Housing situation
SHS-onlySHS–YJ
First reported Last reported
30 Vulnerable young people: interactions across homelessness, youth justice and child protection

Female clients in this cohort were more likely than males to experience repeat homelessness (19% compared with 13%).
3.6 What does this tell us? In general, young clients who had accessed homelessness services and who were also under youth justice supervision appeared to be much more vulnerable than SHS-only clients.
SHS–YJ clients received more SHS support periods and more days of SHS support, on average, than SHS-only clients. Despite this, half of clients in this matched cohort ended support as homeless. They also reported experiencing higher rates of mental health issues and problems with drugs and/or alcohol. This combination of complex circumstances, including higher levels of itinerancy and lower levels of accommodation provision, highlights the potential difficulty experienced by specialist homelessness services in accommodating these high-needs clients.
Additionally, this research suggests that these clients had fewer support networks and were therefore at greater risk of social exclusion. They were almost twice as likely as those in the SHS-only cohort to need assistance with challenging social/behavioural problems, report a lack of family and/or community support as a reason for seeking assistance from SHS agencies, and live alone on presentation to SHS agencies.
Vulnerable young people: interactions across homelessness, youth justice and child protection 31

4 Homelessness, child protection and youth justice
4.1 Introduction This chapter explores the demographic characteristics, personal circumstances and housing outcomes of the 590 young people, aged 10–17, who had accessed specialist homelessness services, received child protection services and been under youth justice supervision.
Key findings Compared with the equivalent SHS-only cohort, matched clients who accessed specialist homelessness services, were involved in the child protection system and had also been under youth justice supervision:
• were 6 times more likely to report having a drug and/or alcohol issue (30% compared with 5%)
• were twice as likely to report having a mental health issue (42% compared with 20%), with females more likely than males to report a mental health issue (47% compared with 39%)
• were more than twice as likely to seek assistance for challenging social/behavioural problems (35% compared with 14%)
• were nearly 3 times as likely to experience more than 1 episode of homelessness between 2011–12 and 2014–15 (17% versus 6%). This was the highest proportion of all matched cohorts
• received, on average, more SHS support periods (4.0 compared with 2.3 and more SHS support days (average of 209 days compared with 131 days)
• were accommodated for fewer nights (average of 124 nights compared with 157 nights), despite being more likely to request accommodation services (73% compared with 52%). This may indicate that SHS–CP–YJ clients had greater difficulty in retaining provided accommodation.
SHS–CP–YJ clients were also the most likely of all matched cohorts to have requests for long-term accommodation go unmet (60%).
These findings highlight the complex and challenging situations young people who are experiencing homelessness or who are at risk of homelessness are faced with when they have also been involved with both child protection services and youth justice supervision. Unsurprisingly, achieving a stable housing situation was more difficult for these young people than the SHS-only young people, with 43% being homeless at the end of SHS support. By comparison, 33% of clients in the SHS-only cohort were homeless following support.
32 Vulnerable young people: interactions across homelessness, youth justice and child protection
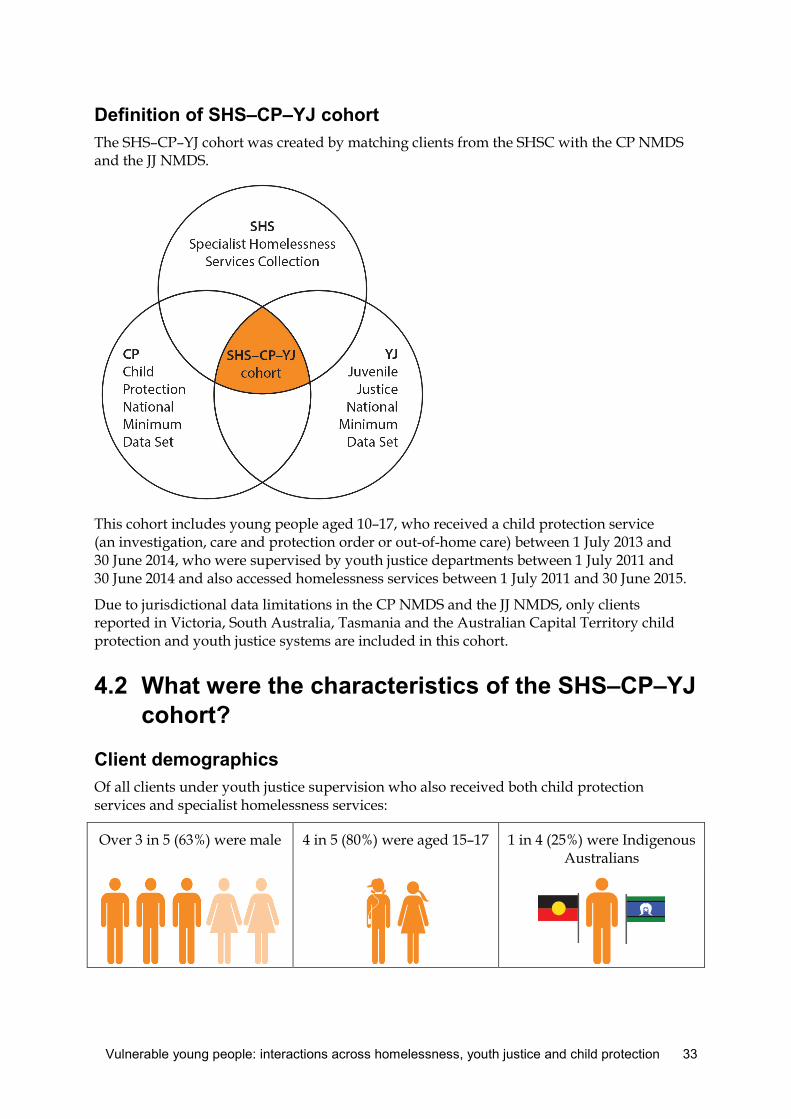
Definition of SHS–CP–YJ cohort The SHS–CP–YJ cohort was created by matching clients from the SHSC with the CP NMDS and the JJ NMDS.
This cohort includes young people aged 10–17, who received a child protection service (an investigation, care and protection order or out-of-home care) between 1 July 2013 and 30 June 2014, who were supervised by youth justice departments between 1 July 2011 and 30 June 2014 and also accessed homelessness services between 1 July 2011 and 30 June 2015.
Due to jurisdictional data limitations in the CP NMDS and the JJ NMDS, only clients reported in Victoria, South Australia, Tasmania and the Australian Capital Territory child protection and youth justice systems are included in this cohort.
4.2 What were the characteristics of the SHS–CP–YJ cohort?
Client demographics Of all clients under youth justice supervision who also received both child protection services and specialist homelessness services:
Over 3 in 5 (63%) were male 4 in 5 (80%) were aged 15–17 1 in 4 (25%) were Indigenous Australians
Vulnerable young people: interactions across homelessness, youth justice and child protection 33
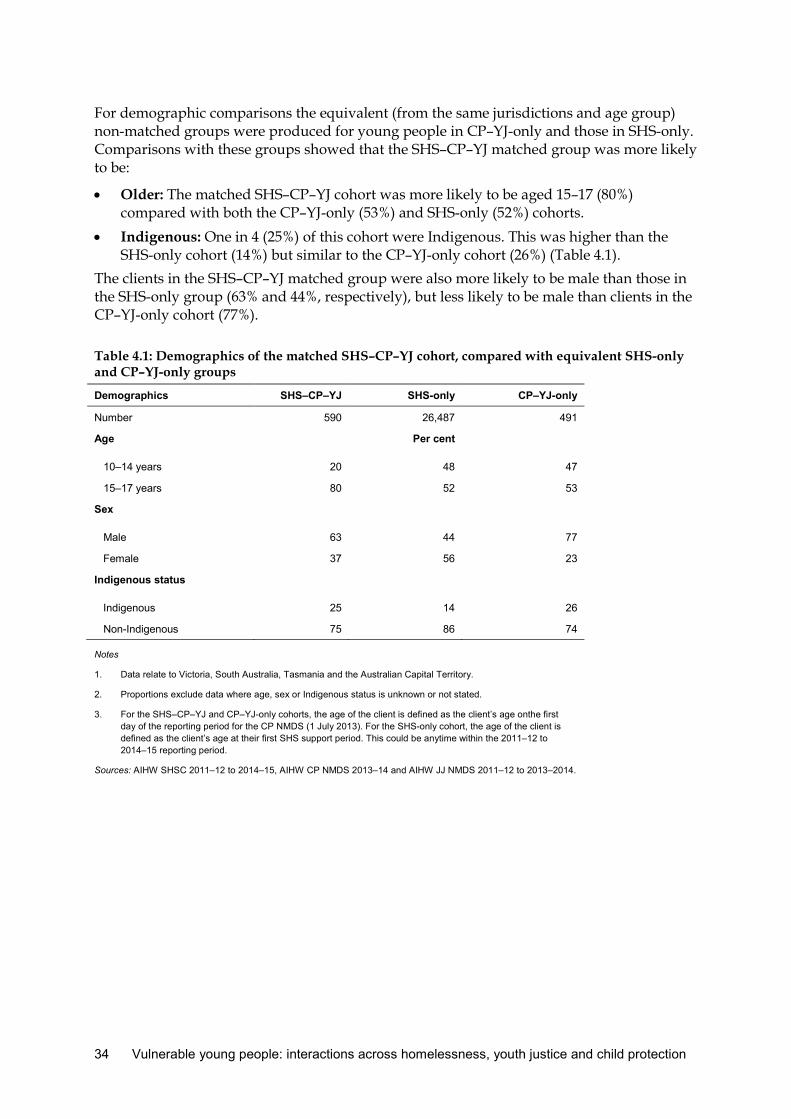
For demographic comparisons the equivalent (from the same jurisdictions and age group) non-matched groups were produced for young people in CP–YJ-only and those in SHS-only. Comparisons with these groups showed that the SHS–CP–YJ matched group was more likely to be:
• Older: The matched SHS–CP–YJ cohort was more likely to be aged 15–17 (80%) compared with both the CP–YJ-only (53%) and SHS-only (52%) cohorts.
• Indigenous: One in 4 (25%) of this cohort were Indigenous. This was higher than the SHS-only cohort (14%) but similar to the CP–YJ-only cohort (26%) (Table 4.1).
The clients in the SHS–CP–YJ matched group were also more likely to be male than those in the SHS-only group (63% and 44%, respectively), but less likely to be male than clients in the CP–YJ-only cohort (77%).
Table 4.1: Demographics of the matched SHS–CP–YJ cohort, compared with equivalent SHS-only and CP–YJ-only groups
Demographics SHS–CP–YJ SHS-only CP–YJ-only
Number 590 26,487 491
Age
Per cent
10–14 years 20 48 47
15–17 years 80 52 53
Sex
Male 63 44 77
Female 37 56 23
Indigenous status
Indigenous 25 14 26
Non-Indigenous 75 86 74
Notes
1. Data relate to Victoria, South Australia, Tasmania and the Australian Capital Territory.
2. Proportions exclude data where age, sex or Indigenous status is unknown or not stated.
3. For the SHS–CP–YJ and CP–YJ-only cohorts, the age of the client is defined as the client’s age onthe first day of the reporting period for the CP NMDS (1 July 2013). For the SHS-only cohort, the age of the client is defined as the client’s age at their first SHS support period. This could be anytime within the 2011–12 to 2014–15 reporting period.
Sources: AIHW SHSC 2011–12 to 2014–15, AIHW CP NMDS 2013–14 and AIHW JJ NMDS 2011–12 to 2013–2014.
34 Vulnerable young people: interactions across homelessness, youth justice and child protection

Mental health
2 in 5 (42%) of the SHS–CP–YJ cohort reported having a mental health issue. SHS-only clients were half as likely to report having a mental health issue (20%).
Within the SHS–CP–YJ cohort, females were more likely than males to report having a mental health issue (47% compared with 39%). Also those aged 15–17 were more likely than those aged 10–14 to report having a mental health issue (46% compared with 26%).
Drugs and alcohol use
Young people in the SHS–CP–YJ cohort were 6 times as likely as clients in the SHS-only cohort to report having a drug and alcohol issue (30% compared with 5%).
Experiencing domestic and family violence
Thirty-eight per cent of the SHS–CP–YJ cohort reported experiencing domestic and family violence. This was similar to clients in the SHS-only cohort (36%).
Young person presenting alone
Young people in the SHS–CP–YJ cohort aged 15–17 were almost twice as likely as clients in the SHS-only cohort to present to SHS agencies alone (69% compared with 35%).
Vulnerable young people: interactions across homelessness, youth justice and child protection 35

Personal circumstances on presentation to specialist homelessness services
Living arrangement on presentation Similar to the SHS–YJ cohort, the most common living arrangement on presentation for this cohort was living alone (35%), which was much higher than the SHS-only cohort (14%) (Figure 4.1). In the matched cohort, males were more likely to live alone (38% compared with 31% of females), while females were more likely to live with other family members (18% compared with 14% of men) or as part of a group (22% compared with 19%). The SHS–CP–YJ cohort was more likely to report their living arrangement as part of a group (20%) when compared with the other matched cohorts and the SHS-only cohort (7%), and much less likely to report living in a one parent with child(ren) arrangement (20% compared with 42%) or couple with child(ren) (5% compared with 14%).
Sources: AIHW SHSC 2011–12 to 2014–15, AIHW CP NMDS 2013–14 and AIHW JJ NMDS 2011–12 to 2013–2014.
Figure 4.1: Living arrangement, by SHS–CP–YJ clients and SHS-only equivalent clients, 2011–12 to 2014–15
Housing at first presentation Half (50%) of the SHS–CP–YJ clients presented to SHS agencies as homeless (see Glossary). This was higher than for clients in the SHS-only cohort at 41%. Of those whose housing situation at the beginning of SHS support was known, the most common housing situation first reported to SHS agencies for the SHS–CP–YJ cohort was private housing (31%), with a similar proportion couch surfing or with no tenure (27%).
4.3 Why did they seek SHS assistance? Like the SHS–YJ cohort, the SHS–CP–YJ cohort identified a wider range of reasons for seeking assistance than SHS-only clients.
Lone personchild(ren)
One parent withchild(ren)
Couple withchild(ren)
Couple without Other family Group
Living arrangement
0
10
20
30
40
50
Clients (per cent)
SHS-onlySHS–CP–YJ
36 Vulnerable young people: interactions across homelessness, youth justice and child protection

Young people in the SHS–CP–YJ cohort were more likely than those in the SHS-only cohort to present to services due to:
• health-related reasons (36% compared with 15%), such as mental health issues (25% compared with 10%), problematic drug or substance use (22% compared with 3%) and problematic alcohol use (8% compared with 1%)
• accommodation-related reasons (67% compared with 48%), such as housing crisis (51% compared with 33%), inadequate or inappropriate dwelling conditions (40% compared with 25%) and previous accommodation ending (34% compared with 16%)
• family-related issues, such as relationship/family breakdown (49% compared with 32%) or time out from family (29% compared with 17%)
• being itinerant (11% compared with 4%) • transitioning from custody (14% compared with 1%), or foster care and child safety
residential placements (23% compared with 1%) • lack of family and/or community support (40% compared with 16%) • disengagement with school or other education and training (23% compared with 10%)
(Figure 4.2; Table S3.1). Young people in the SHS–CP–YJ cohort were almost as likely as the SHS-only cohort to seek assistance due to domestic and family violence (32% and 34%, respectively).
Source: Table S3.1.
Figure 4.2: Selected reasons for seeking assistance, by proportion of SHS–CP–YJ clients and SHS-only equivalent clients, 2011–12 to 2014–15
Housing crisisbreakdown
Relationship/familycommunity support
Lack of family and/orsubstance use
Problematic drug oruse
Problematic alcohol
Reasons for seeking assistance
0
10
20
30
40
50
60
Clients (per cent)
SHS-onlySHS–CP–YJ
Vulnerable young people: interactions across homelessness, youth justice and child protection 37

4.4 What services did they receive?
Services identified and provision status Almost three-quarters (73%) of clients in the SHS–CP–YJ cohort requested assistance with some form of accommodation. By comparison, just over half (52%) of the SHS-only group requested accommodation. ‘Long-term accommodation provision’ was the identified need least able to be provided by SHS agencies to SHS–CP–YJ clients, with 60% of requests for long-term housing being neither referred nor provided (Figure 4.3). Fifty-five per cent of requests for long-term accommodation by the SHS-only clients went unmet. When looking at medium-term/transitional housing provision, the SHS–CP–YJ cohort was also more likely than the SHS-only group to have their needs go unmet (49% and 36%, respectively).
Note: The denominator for the proportions ‘provided’, ‘referred’ and ‘neither’ is the number of clients who identified a need for the service.
Source: Table S3.2.
Figure 4.3: Proportion of clients who needed accommodation services, by service provision status, SHS–CP–YJ and SHS-only, 2011–12 to 2014–15
The SHS–CP–YJ clients were 5 times as likely as the SHS-only clients to need drug/alcohol counselling (15% compared with 3%) (Figure 4.4). They were also more than twice as likely to need mental health services (19% compared with 9%). General services (see Glossary) were the most common identified need for clients in SHS–CP–YJ cohort (98%). Within general services, the SHS–CP–YJ clients requested almost all services at a higher rate than SHS-only clients, particularly for: • assistance for challenging social/behavioural problems (35% compared with 14%) • living skills/personal development (44% compared with 21%) • court support (17% compared with 8%)
0 10 20 30 40 50 60 70
Clients (per cent)
Short-term or emergency accommodation
Medium-term/transitional housing
Long-term housing
NeitherReferredProvided
Short-term or emergency accommodation
Medium-term/transitional housing
Long-term housing
NeitherReferredProvided
SHS–CP–YJ
SHS-only
38 Vulnerable young people: interactions across homelessness, youth justice and child protection

• legal information (24% compared with 13%). However, as with the SHS–YJ cohort, the need for domestic/family violence assistance was lower in the SHS–CP–YJ cohort compared with the SHS-only cohort (23% and 25%, respectively).
Note: The denominator for the proportions ‘provided’, ‘referred’ and ‘neither’ is the number of clients who identified a need for the service.
Source: Table S3.2.
Figure 4.4: Proportion of clients who needed selected specialist homelessness services, by service provision status, SHS–CP–YJ and SHS-only, 2011–12 to 2014–15
Length of SHS support Young people in the SHS–CP–YJ cohort, compared with the SHS-only group, received:
• more SHS support periods (average of 4.0 per client compared with 2.3) • more days of SHS support (average of 209 days compared with 131 days) (Figure 4.5). They were, however, accommodated for fewer nights (average of 124 nights compared with 157 nights for SHS-only), despite being more likely to request accommodation services than the SHS-only cohort (73% compared with 52%). This may indicate that SHS–CP–YJ clients had greater difficulty in retaining provided accommodation.
0 10 20 30 40 50
Clients (per cent)
Assistance for domestic/family violence
Assistance with challenging social/behavioural problems
Living skills/personal development
Mental health service
Drug/alcohol counselling
NeitherReferredProvided
Assistance for domestic/family violence
Assistance with challenging social/behavioural problems
Living skills/personal development
Mental health service
Drug/alcohol counselling
NeitherReferredProvided
SHS–CP–YJ
SHS-only
Vulnerable young people: interactions across homelessness, youth justice and child protection 39

Sources: AIHW SHSC 2011–12 to 2014–15, AIHW CP NMDS 2013–14 and AIHW JJ NMDS 2011–12 to 2013–2014.
Figure 4.5: SHS–CP–YJ and SHS-only clients, by average number of support days and accommodation nights, 2011–12 to 2014–15
Young people who accessed specialist homelessness services following involvement with the child protection and youth justice system When comparing the earliest recorded date a young person received child protection services, entered youth justice supervision and received support from SHS agencies, 44% of clients in the SHS–CP–YJ cohort accessed child protection services, then youth justice, followed by SHS. Similar to the other cohorts, this analysis is limited to the availability of data across the child protection, youth justice and SHS collections. In particular, earlier dates of child protection services and youth justice supervision can be identified for this cohort, but SHS services data are restricted to support periods between 1 July 2011 and 30 June 2015. Further, the age structure of these data suggests a potential age bias in the progression of young people accessing these services. For example, although all young people in this cohort are aged 10–17 within the reference period, when exploring earlier child protection and youth justice activity, clients in this cohort would have been younger. Because the CP NMDS collects data on children aged 0–17, and the JJ NMDS collects data for 10–17 year olds, when clients are present across both collections it is possible the order of accessing child protection and youth justice is due to age progression. A more detailed analysis of the pathways between these services will be possible as more years are collected, reducing potential bias due to data limitations.
Days of support Nights of accommodation0
50
100
150
200
250
Average number of days/nights
SHS-onlySHS–CP–YJ
40 Vulnerable young people: interactions across homelessness, youth justice and child protection
4.5 What were the housing outcomes for clients?
Housing outcomes Compared with in the SHS-only group, clients in the SHS–CP–YJ matched group were more likely to be still receiving SHS support at the end of the study (28% compared with 10%, respectively). The remaining 72% of the SHS–CP–YJ cohort had their housing outcomes included in the analysis.
Following SHS support, housing outcomes improved for those in the SHS–CP–YJ cohort. However, 43% of the SHS–CP–YJ cohort were homeless following support—higher than the proportion of SHS-only clients (33%).
When SHS–CP–YJ clients were compared with SHS-only clients, they:
• were more likely to finish SHS support in short-term or emergency accommodation (22% compared with 14%)
• were more likely to be rough sleeping following SHS support (5% compared with 3%)—however, the rate of rough sleeping halved from 10% over this 4-year period
• were less likely to live in private housing following SHS support (32% compared with 49%) (Figure 4.6).
This matched cohort also experienced an 11 percentage point improvement in social housing rates following SHS support, from 10% to 21%.
Vulnerable young people: interactions across homelessness, youth justice and child protection 41

Note: Proportions include only clients with closed support at the end of the study period, 2014–15.
Source: Table S3.3.
Figure 4.6: SHS–CP–YJ and SHS-only clients, closed support periods, by housing situation at beginning and end of support, 2011–12 to 2014–15
Repeat episodes of homelessness SHS–CP–YJ clients were nearly 3 times as likely as the SHS-only clients to experience more than 1 episode of homelessness between 2011–12 and 2014–15 (17% versus 6%). This was the highest proportion of all matched cohorts and suggests that sustainable housing outcomes may be problematic for this cohort. Female clients in this cohort were almost twice as likely as males to experience repeat homelessness (25% compared with 13%).
4.6 What does this tell us? The vulnerability of the SHS–CP–YJ cohort was reflected in their characteristics, reasons for seeking SHS assistance and housing outcomes.
Achieving a stable housing outcome was more difficult for SHS–CP–YJ clients than for clients in the SHS-only cohort, despite receiving, on average, more SHS support periods and many more days of support. They were also more likely to report having mental health issues, issues with drugs and/or alcohol, and to seek assistance for challenging social/behavioural issues. These additional vulnerabilities and challenging behavioural issues would likely contribute to the housing instability and repeat episodes of homelessness observed within this cohort. These data reveal that for many of these young people there are multiple barriers to overcome in achieving long-term outcomes.
50 40 30 20 10 0 10 20 30 40 50
Clients (per cent)
Institutional settings
Private or other housing
Public or community housing
Couch surfing or no tenure
Short-term temporary accommodation
No shelter or improvised dwelling
Housing situation
SHS-onlySHS–CP–YJ
First reported Last reported
42 Vulnerable young people: interactions across homelessness, youth justice and child protection

Appendix A: Data linkage, data gaps and limitations
Linkage The AIHW is an accredited Commonwealth Integrating Authority and is therefore responsible for ensuring data are managed and governed soundly and, in compliance with the Privacy Act 1988, ensuring data are kept and accessed securely. Further information on data linkage at the AIHW can be found at <http://www.aihw.gov.au/data-linking/>.
For this study, data from the SHSC was linked with data from the CP NMDS and JJ NMDS, with the aim of analysing the characteristics and circumstances of clients who presented in both the SHS and CP and/or YJ collections. SHSC data from July 2011 to June 2015 were linked to CP NMDS data from July 2013 to June 14 and JJ NMDS data from July 2011 to June 2014.
Linkage was performed using a statistical linkage key referred to as an SLK-581. The SLK-581 uses components of a person’s first and last name, date of birth, and their sex to create an identifier. Further common information, specifically the postcode and state/territory of the client was also used to determine matches across the data sets. This method has been shown to be highly effective, with linkage quality that is comparable to name-based linkage strategies (AIHW 2011).
Scope and coverage
Specialist homelessness services data The Specialist Homelessness Services Collection (SHSC) was established on 1 July 2011 and covers a wide range of people experiencing issues with homelessness. The collection captures information on people who seek and receive services from specialist homelessness agencies. Therefore, this study excludes people who were homeless or at risk of homelessness and did not receive specialist homelessness services between 1 July 2011 and 30 June 2015.
Not all in-scope agencies submit data, and not all information sought from SHS clients is answered. This means data may not be completely representative of people receiving specialist homelessness services.
Further information can be found in the SHSC data quality statement available on the AIHW Metadata Online Registry (METeOR) <http://meteor.aihw.gov.au/content/index.phtml/itemId/626455>.
Child protection data The Child Protection National Minimum Data Set (CP NMDS) is a person-based data set established in 2012–13. It contains information on the demographics of 0–17 year olds who receive child protection services, the details of the notifications received by child protection departments, investigations undertaken on the basis of these notifications, and substantiated cases. It also includes data on the care and protection orders and out-of-home care
Vulnerable young people: interactions across homelessness, youth justice and child protection 43

placements relating to these children and young people. The data used for this study were available for all states and territories except New South Wales and Queensland (for whom data were only available on an aggregate, non-linkable basis).
The scope of this report is restricted to children who had investigated notifications (regardless of whether they are substantiated), care and protection orders or out-of-home care during 2013–14. Children who were only the subject of a notification which was not subsequently investigated have not been included in this analysis. This is because, apart from an initial risk assessment, it is expected that the department responsible for child protection would have a limited level of involvement with these children and their families. Notifications that were not investigated, care and protection orders that were ‘other’ or not stated’ and living arrangements that do not constitute out-of-home care are excluded from this report.
National child protection data are based on those cases reported to departments responsible for child protection and, therefore, are likely to understate the true prevalence of child abuse and neglect across Australia. Further, notifications made to other organisations, such as the police or non-government welfare agencies, are only included if these notifications were also referred to departments responsible for child protection.
Further information can be found in the CP NMDS data quality statement available on the AIHW Metadata Online Registry (METeOR) <http://meteor.aihw.gov.au/content/index.phtml/itemId/607938>
Youth justice supervision data The Juvenile Justice National Minimum Data Set (JJ NMDS) is a longitudinal person-based data set established in 2004, with data supplied back to 2000–01. The JJ NMDS contains information on the demographics of young people aged 10–17 who are supervised by youth justice departments and the details of their unsentenced and sentenced supervision, both in the community and in youth justice detention centres. The 3 years of data provided for the purposes of this study were available from all states and territories except Western Australia and the Northern Territory (who currently provide AIHW with non-standard data).
In this report, ‘youth justice supervision’ refers only to supervised community-based orders and detention orders (both unsentenced and sentenced). It does not include unsupervised orders such as unsupervised bail, or diversionary activities that are not supervised orders.
Further information can be found in the JJ NMDS data quality statement available on the AIHW Metadata Online Registry (METeOR) <http://meteor.aihw.gov.au/content/index.phtml/itemId/601986>.
44 Vulnerable young people: interactions across homelessness, youth justice and child protection

Data availability The availability of data varies by jurisdiction and reference period across the linked data sets (Table A1).
Table A1: Availability of data by year and state or territory
Year NSW Vic Qld WA SA Tas ACT NT
2011–12 SHSC JJ NMDS
SHSC JJ NMDS
SHSC JJ NMDS
SHSC
SHSC JJ NMDS
SHSC JJ NMDS
SHSC JJ NMDS
SHSC
2012–13 SHSC JJ NMDS
SHSC JJ NMDS
SHSC JJ NMDS
SHSC
SHSC JJ NMDS
SHSC JJ NMDS
SHSC JJ NMDS
SHSC
2013–14 SHSC JJ NMDS
SHSC JJ NMDS
CP NMDS
SHSC JJ NMDS
SHSC
CP NMDS
SHSC JJ NMDS
CP NMDS
SHSC JJ NMDS
CP NMDS
SHSC JJ NMDS
CP NMDS
SHSC
CP NMDS
2014–15 SHSC SHSC SHSC SHSC SHSC SHSC SHSC SHSC
For comparability, data within each study cohort were restricted to jurisdictions available across the linked data sets. Therefore, the SHS–CP cohort includes young people who received specialist homelessness services or child protection services in Victoria, Western Australia, South Australia, Tasmania, the Australian Capital Territory and the Northern Territory only. The SHS–YJ cohort only includes young people who received specialist homeless services and were involved in the youth justice system in New South Wales, Victoria, Queensland, South Australia, Tasmania and the Australian Capital Territory. When all 3 data sets were combined in the SHS–CP–YJ cohort, only the 4 common jurisdictions (Victoria, South Australia, Tasmania and the Australian Capital Territory) were included.
As data for more states and territories become available in the CP NMDS and JJ NMDS, the demographics, characteristics and services of these groups can be further explored and potentially compared across jurisdictions.
When considering the results of this analysis, it is also important to note that the reference periods for each of the 3 linked data sets are different. The SHSC data covers the period 2011–12 to 2014–15, the JJ NMDS data the period 2011–12 to 2013–14 and the CP NMDS data 2013–14 only. This means that, for example, for an individual to fall into the matched SHS–CP–YJ cohort, they had to access a SHS in the period 2011–12 to 2014–15 and receive a child protection service in the year 2013–14 and be under youth justice supervision in the period 2011–12 to 2013–14. It follows that there will be some individuals who are not included in this cohort, not because they had no contact with the youth justice system, but rather because they had no contact during 2011–12 to 2013–14.
The choice of the respective reference periods has been controlled by the availability of data. Interpretation of results would be more straightforward if all the linked data sets shared the same reference period but, given the small number of individuals in each cohort, restricting all reference periods to the shortest reference period would have resulted in insufficient data for a robust analysis.
Vulnerable young people: interactions across homelessness, youth justice and child protection 45

Although at present there is insufficient data to verify such an assumption, the AIHW believe it is reasonable to assume that the impact of the differing reference periods is likely to be a reduction in the observed differences between the matched cohorts and the SHS-only equivalent. As such, it has been decided that using different reference periods, with the attendant difficulties in interpretation, is at present the better approach. As the amount of available data increases over time, this decision will be revisited until such time as there is sufficient data to have consistent reference periods across all the linked data sets.
In addition, it is important to note that the pathway of the young person was not considered when determining the results presented in this report. For example, a young person who accessed youth justice services before accessing specialist homelessness services is considered to be in the same cohort group as a young person who accessed specialist homelessness services before accessing youth justice services. For this reason, the results presented in this report should not be interpreted as service use patterns, and they should also not be interpreted as being due to causal relationships between respective services.
46 Vulnerable young people: interactions across homelessness, youth justice and child protection
Glossary accommodation services (SHSC): Accommodation services include short-term or emergency accommodation, medium-term/transitional housing, assistance to obtain long-term housing (such as social housing or private accommodation), assistance to sustain tenancy or prevent tenancy failure or eviction and assistance to prevent foreclosures or for mortgage arrears.
care and protection orders (CP NMDS): Legal orders or arrangements that give child protection departments some responsibility for a child’s welfare.
child protection: In Australia, state and territory departments responsible for child protection provide assistance to vulnerable children and young people who have been, or are at risk of being, abused, neglected or otherwise harmed, or whose parents are unable to provide adequate care or protection.
There are 3 main components of the child protection system:
• The assessment and investigation of notifications of possible abuse, neglect or other harm: these notifications are screened by child protection departments and if required, the report is investigated. If the investigation finds that the child is being, or is likely to be, abused, neglected or otherwise harmed, the notification is recorded as substantiated.
• Care and protection orders are legal orders or arrangements that give child protection departments some responsibility for a child's welfare.
• When either parents are unable to provide adequate care, children require a more protective environment, or alternative accommodation is needed during family conflict, children may be placed in out-of-home care, which is overnight care where the department has made or offered a financial payment to the carer. Consistent with the principle of keeping children with their families, out-of-home care is considered an intervention of last resort.
It is possible for children and young people to be involved in each of these 3 components at the same time.
For more information on child protection in Australia, see Child protection in Australia 2014–15 (AIHW 2016a).
children receiving child protection services: Children who are: the subjects of an investigation of a notification; on a care and protection order; and/or in out-of-home care.
clients experiencing domestic and family violence (SHSC): Clients in the SHSC were counted as ‘experiencing domestic and family violence’ if, as part of any support period during the study period: ‘domestic and family violence’ was reported as a reason they sought assistance, or if, as part of any support period, they required domestic or family violence assistance. The SHSC reports on all clients who experience domestic and family violence, both victims and perpetrators. The SHSC data are not able to distinguish between these 2 groups.
clients of specialist homelessness services: A client is a person who receives a specialist homelessness service. A specialist homelessness service is assistance provided to a client aimed at responding to, or preventing, homelessness. A client can be of any age—children are also clients if they receive a service from a specialist homelessness agency.
Vulnerable young people: interactions across homelessness, youth justice and child protection 47

clients with a mental health issue (SHSC): Clients with a mental health issue were identified in the SHSC data set. SHS clients with a current mental health issue are identified as such if they meet any of these criteria:
• they indicated that at the beginning of a support period they were receiving services or assistance for their mental health issues (or had done so in the last 12 months)
• their formal referral source to the specialist homelessness agency was a mental health service
• they reported ‘mental health issues’ as a reason for seeking assistance • their dwelling type, either a week before presenting to an agency, or when presenting to
an agency, was as a psychiatric hospital or unit • they had been in a psychiatric hospital or unit in the last 12 months • at some stage during their support period, a need was identified for psychological
services, psychiatric services or mental health services.
This analysis does not include clients aged under 10.
community-based supervision (JJ NMDS): a legal arrangement that requires the young person to be supervised by a youth justice agency, within the community. This includes both sentenced and unsentenced community-based supervision. This includes legal orders such as probation, suspended detention, parole and supervised release.
detention (JJ NMDS): a legal arrangement that requires the young person to be detained in a youth justice facility. This includes both sentenced and unsentenced detention.
general services (SHSC): General services include:
• family/relationship assistance • assistance for incest/sexual assault • legal information • material aid/brokerage • financial information • educational assistance • training assistance • employment assistance • assistance to obtain/maintain government allowances • assertive outreach • child care • assistance for trauma • assistance for challenging social/behavioural problems • living skills/personal development • court support • advice/information • retrieval/storage/removal of personal belongings • advocacy/liaison on behalf of client
48 Vulnerable young people: interactions across homelessness, youth justice and child protection

• school liaison • structured play/skills development • child contact and residence arrangements • meals • laundry/shower facilities • recreation • transport and • other basic assistance. housing status (and other housing categories) (SHSC): All clients of SHS agencies are considered to be either homeless or at risk of homelessness. Homelessness and ‘at risk’ status are assigned to those clients whose housing circumstances meet the specific criteria described below. Clients who did not provide sufficient information to make this assessment are excluded.
These categories are assigned to homeless and at risk categories as much as possible to align with the Australian Bureau of Statistics (ABS) statistical definition of homelessness (ABS 2012). However, there are some key areas where alignment may not occur. The ABS definition includes people living in severely crowded dwellings, but no specific question is asked in the SHSC on crowding, so this group cannot be separately identified.
Also, certain decisions are made by the ABS to exclude groups of people from the homeless count where they appear to have accommodation alternatives or there is a clear choice about the type of accommodation (for example, people who are travelling, people returning from overseas, certain owner builders or hobby farmers, and students living in halls of residence). However, if people in these circumstances become clients of specialist homelessness agencies, they are included here as either ‘homeless’ or ‘at risk of homelessness’, depending on their housing situation as reported.
Clients are considered to be ‘homeless’ if they are living in any of the following circumstances:
• No shelter or improvised dwelling: includes where dwelling type is ‘no dwelling/street/park/in the open, motor vehicle, improvised building/dwelling, caravan, cabin, boat or tent’, or tenure type is ‘renting or living rent-free in a caravan park’.
• Short-term temporary accommodation: dwelling type is ‘boarding/rooming house, emergency accommodation, hotel/motel/bed and breakfast’; or tenure type is ‘renting or living rent-free in boarding/rooming house, renting or living rent-free in emergency accommodation or transitional housing’.
• House, townhouse or flat (couch surfing or with no tenure): tenure type is ‘no tenure’; or conditions of occupancy are ‘living with relatives fee-free, couch surfing’.
Clients are considered to be ‘at risk of homelessness’ if they are living in any of the following circumstances:
• Public or community housing (renter or rent free): dwelling type is ‘house/townhouse/flat’ and tenure type is ‘renter or rent-free public housing, renter or rent-free–community housing’.
Vulnerable young people: interactions across homelessness, youth justice and child protection 49

• Private or other housing (renter, rent-free or owner): dwelling type is ‘house/townhouse/flat’ and tenure type is ‘renter–private housing, life tenure scheme, owner―shared equity or rent/buy scheme, owner—being purchased/with mortgage, owner—fully owned, rent-free–private/other housing’.
Indigenous: A client is considered as Indigenous if, at any time in the reporting period, they identified as being of Aboriginal and/or Torres Strait Islander origin.
In the SHSC, information on Indigenous status is only provided with the explicit consent of the client to report this information.
investigation (CP NMDS): The process whereby the relevant department obtains more detailed information about a child who is the subject of a notification. Departmental staff assess the harm, or degree of harm, to the child and their protective needs. An investigation includes sighting or interviewing the child where it is practical to do so.
meeting clients’ service needs (SHSC): There are several aspects to analysing the extent to which clients’ needs for assistance are met. The first is to analyse the services provided to a client directly by the specialist homelessness agency. Where agencies are unable to provide services directly to clients, or unable to fully meet the need, they often refer the client to other organisations (other specialist homelessness agencies or other organisations) that can provide those services. This information is also collected in the SHSC and is considered an important form of assistance that agencies provide, although it is not possible to know if these referrals resulted in the provision of services.
All information on services that are provided, whether referred or not, are recorded in the same way as service needs. That is, a service is recorded as provided if the client was provided that type of assistance at any time in between 2011–12 and 2014–15.
In some circumstances, an agency will not be able to either provide required services directly to clients, or refer them to another organisation—this is considered to be an unmet need.
need for a service (SHSC): The SHSC collects information on the needs of clients during their period of support from a specialist homelessness agency. Needs may be identified by the client and/or the service provider. Although this information is collected at the beginning of a support period, updated at the end of each month a client is supported and again at the end of each support period, each individual need is only recorded once in any collection month. For these analyses, a client’s need for a service was recorded if the client needed that service at any time between 2011–12 and 2013–14. For example, a client was recorded as needing short-term or emergency accommodation if they were recorded as needing short-term or emergency accommodation in any collection month between 2011–12 and 2013–14, regardless of the number of months over which this need was recorded, or the number of times during over the reporting period they presented with this need.
notifications (CP NMDS): contacts made to an authorised department by persons or other bodies making allegations of child abuse or neglect, child maltreatment or harm to a child.
out-of-home care (CP NMDS): Overnight care for children aged 0–17, where the state makes a financial payment or where a financial payment has been offered but has been declined by the carer.
SHS clients with a drug and/or alcohol use issue: Include those clients:
• who reported they had been in rehabilitation in the last 12 months
50 Vulnerable young people: interactions across homelessness, youth justice and child protection

• whose formal referral source to the specialist homelessness agency was a drug and alcohol service
• who reported ‘problematic drug or substance use’ or ‘problematic alcohol use’ as a reason for seeking assistance
• whose dwelling type either a week before presenting to an agency, or when presenting to an agency was rehabilitation
• who at some stage during their support period, were identified as needing drug and/or alcohol counselling.
sleeping rough (SHSC): A term used to refer to those people who are:
• living in an improvised building or dwelling, or • sleeping on the street, in a park or in the open. social housing: Rental housing that is funded or partly funded by government, and that is owned or managed by the government or a community organisation and let to eligible persons. This includes public rental housing, state owned and managed Indigenous housing, mainstream and Indigenous community housing and housing provided under the Crisis Accommodation Program.
specialist homelessness agency: A specialist homelessness agency is an organisation that receives government funding to deliver specialist homelessness services to a client. These can be either not-for-profit and for-profit agencies.
specialist homelessness services: A specialist homelessness service is assistance provided by a specialist homelessness agency to a client aimed at responding to, or preventing, homelessness. The specialist homelessness services in scope for this collection include: accommodation provision; assistance to sustain housing; domestic/family violence services; mental health services; family/relationship assistance; disability services; drug/alcohol counselling; legal/financial services; immigration/cultural services; other specialist services; and general assistance and support.
substantiation of notification (CP NMDS): Child protection notification made to relevant authorities during the current year (for example, 1 July 2013 to 30 June 2014) that was investigated (with the investigation finalised by 31 August) and where it was concluded that there was reasonable cause to believe that the child had been, was being, or was likely to be, abused, neglected or otherwise harmed. Substantiation does not necessarily require sufficient evidence for a successful prosecution and does not imply that treatment or case management were provided. Substantiations may also include cases where there is no suitable caregiver, such as children who have been abandoned or whose parents are deceased.
support period (SHSC): The period of time a client receives services from a specialist homelessness agency is referred to as a ‘support period’. A support period begins the day the client receives a service and ends when:
• the relationship between the client and the agency ends, or • the client has reached the maximum amount of support the agency can offer, or • a client has not received any services from the agency for a calendar month and there is
no other ongoing relationship.
The end of the support period is the day the client last received service from the agency.
Vulnerable young people: interactions across homelessness, youth justice and child protection 51

total length of support and total length of accommodation (SHSC): To calculate support length and accommodation, every day (for length of support) or every night (for length of accommodation) the client received support or accommodation over the reporting period is added together. This means that the total number of days/nights presented for clients does not necessarily represent a consecutive number of days/nights the client received support/accommodation. For example, a client who received accommodation for 7 nights may have had 2 separate periods of accommodation: 1 for 5 nights and another for 2 nights.
youth justice supervision: In Australia, the states and territories are responsible for dealing with young people who have committed, or who are alleged to have committed, criminal offences. The youth justice system applies to children and young people aged 10–17 at the time of the offence in all states and territories except Queensland, where it applies to those aged 10–16. Children aged under 10 cannot be charged with a criminal offence in any state or territory. Young people enter the system when they are investigated by police for allegedly committing an offence and (depending on the outcome of the investigation) charges may be laid. If the young person is proven guilty, they will then be sentenced by a court.
Youth justice supervision is a component of the youth justice system. Young people may be supervised by a youth justice department at any stage of the youth justice system. There are 2 main types of supervision:
• young people who reside in the community and are supervised by the youth justice department are under community-based supervision. Young people may be unsentenced (before a court hearing or while awaiting the outcome of a trial or sentencing) or may have been sentenced to a period of community-based supervision by a court. Community-based supervision also includes young people who have been released from sentenced detention on parole or supervised release.
• young people who are detained in a youth justice centre or detention facility are in detention. As with those under community-based supervision, these young people may be unsentenced or may have been sentenced to a period of detention by a court.
Young people may be under multiple types of youth justice supervision in the same year, and may be under multiple types at the same time, where these supervision orders relate to different court matters.
For more information on youth justice supervision in Australia, see Youth justice in Australia 2014–15 (AIHW 2016b).
52 Vulnerable young people: interactions across homelessness, youth justice and child protection

References ABS (Australian Bureau of Statistics) 2012. Census of population and housing: estimating homelessness, 2011. ABS cat. no. 4906.0. Canberra: ABS.
AIHW (Australian Institute of Health and Welfare) 2011. Comparing an SLK-based and a name-based data linkage strategy: an investigation into the PIAC linkage. Data linkage series no. 11. Cat. no. CSI 11. Canberra: AIHW.
AIHW 2012. Children and young people at risk of social exclusion: links between homelessness, child protection and juvenile justice. Data linkage series no. 13 Cat. no. CSI 13. Canberra: AIHW.
AIHW 2015. Specialist homelessness services 2014–15. Canberra: AIHW. Viewed 28 March 2016, <http://www.aihw.gov.au/homelessness/specialist-homelessness-services-2014-15/>.
AIHW 2016a. Child protection Australia 2014–15. Child welfare series no. 63. Cat. no. CWS 57. Canberra: AIHW.
AIHW 2016b. Youth justice in Australia 2014–15. Bulletin 133. Cat. no. AUS 198. Canberra: AIHW.
Bevitt A, Chigavazira A, Herault N, Johnson G, Moschion J, Scutella R et al. 2015. Journeys home research report no. 6. Melbourne: University of Melbourne.
Chamberlain C & Johnson G 2011. Pathways into adult homelessness. Journal of Sociology 49:60–77.
COAG (Council of Australian Governments) 2015. National Partnership Agreement on Homelessness—2015–2017. Canberra: Commonwealth of Australia.
Johnson G, Natalier K, Mendes P, Liddiard M, Thoresen S, Hollows A et al. 2010. Pathways from out of home care AHURI Final Report No. 147. Melbourne: Australian Housing and Urban Research Institute.
MacKenzie D, Flatau P, Steen A & Thielking M 2016. The cost of youth homelessness in Australia: research brief. Melbourne: Swinburne Institute for Social Research.
Vulnerable young people: interactions across homelessness, youth justice and child protection 53

List of tables Table 1.1: Selected characteristics across matched cohorts ......................................................................... 5
Table 2.1: Demographics of the matched SHS–CP cohort, compared with equivalent SHS-only and CP-only groups ...................................................................................................... 8
Table 3.1: Demographics of the matched SHS–YJ cohort, compared with equivalent SHS-only and YJ-only groups .............................................................................................................. 22
Table 4.1: Demographics of the matched SHS–CP–YJ cohort, compared with equivalent SHS-only and CP–YJ-only groups .............................................................................................. 34
Table A1: Availability of data by year and state or territory .................................................................... 45
54 Vulnerable young people: interactions across homelessness, youth justice and child protection

List of figures Figure 1.1: Flow chart of data linkage process and creation of matched cohorts and
comparison groups ......................................................................................................................... 3
Figure 2.1: Living arrangement, by SHS–CP clients and SHS-only equivalent clients, 2011–12 to 2014–15 ....................................................................................................................................... 10
Figure 2.2: Selected reasons for seeking assistance, by proportion of SHS–CP clients and SHS-only equivalent clients, 2011–12 to 2014–15 ..................................................................... 12
Figure 2.3: Proportion of clients who needed accommodation services, by service provision status, SHS–CP and SHS-only clients, 2011–12 to 2014–15 ..................................................... 13
Figure 2.4: Proportion of clients who needed selected specialist homelessness services, by service provision status, SHS–CP and SHS-only, 2011–12 to 2014–15 .................................. 14
Figure 2.5: SHS–CP and SHS-only clients, by average number of support days and accommodation nights, 2011–12 to 2014–15 .............................................................................. 15
Figure 2.6: SHS–CP and SHS-only clients, by housing situation at beginning and end of support, 2011–12 to 2014–15 ........................................................................................................ 17
Figure 3.1: Living arrangement, by SHS–YJ clients and SHS-only equivalent clients, 2011–12 to 2014–15 ........................................................................................................................................... 24
Figure 3.2: Selected reasons for seeking assistance, by proportion of SHS–YJ clients and SHS-only equivalent clients, 2011–12 to 2014–15 ..................................................................... 26
Figure 3.3: Proportion of clients who needed accommodation services, by service provision status, SHS–YJ and SHS-only, 2011–12 to 2014–15 ................................................................... 27
Figure 3.4: Proportion of clients who needed selected specialist homelessness services, by service provision status, SHS–YJ and SHS-only, 2011–12 to 2014–15 .................................... 28
Figure 3.5: SHS–YJ and SHS-only clients, by average number of support days and accommodation nights, 2011–12 to 2014–15 .............................................................................. 29
Figure 3.6: SHS–YJ and SHS-only clients, by housing situation at beginning and end of support, 2011–12 to 2014–15 ........................................................................................................ 30
Figure 4.1: Living arrangement, by SHS–CP–YJ clients and SHS-only equivalent clients, 2011–12 to 2014–15 ........................................................................................................................ 36
Figure 4.2: Selected reasons for seeking assistance, by proportion of SHS–CP–YJ clients and SHS-only equivalent clients, 2011–12 to 2014–15 ..................................................................... 37
Figure 4.3: Proportion of clients who needed accommodation services, by service provision status, SHS–CP–YJ and SHS-only, 2011–12 to 2014–15 ........................................................... 38
Figure 4.4: Proportion of clients who needed selected specialist homelessness services, by service provision status, SHS–CP–YJ and SHS-only, 2011–12 to 2014–15 ............................ 39
Figure 4.5: SHS–CP–YJ and SHS-only clients, by average number of support days and accommodation nights, 2011–12 to 2014–15 .............................................................................. 40
Figure 4.6: SHS–CP–YJ and SHS-only clients, closed support periods, by housing situation at beginning and end of support, 2011–12 to 2014–15 ................................................................. 42
Vulnerable young people: interactions across homelessness, youth justice and child protection 55
Related publications The following AIHW publications containing further information on youth and homelessness might also be of interest:
• AIHW 2015. Specialist homelessness services 2014–15. Canberra: AIHW. Viewed 28 March 2016, <http://www.aihw.gov.au/homelessness/specialist-homelessness-services-2014-15/>.
• AIHW 2016. Domestic and family violence and homelessness 2011–12 to 2013–14. Canberra: AIHW. Viewed 26 August 2016, <http://www.aihw.gov.au/homelessness/domestic-violence-and-homelessness/>.
• AIHW 2016. Exploring drug treatment and homelessness in Australia: 1 July 2011 to 30 June 2014. Cat. no. CSI 23. Canberra: AIHW.
Details of other publications on homelessness, as well as youth justice and child protection produced by the AIHW can be found on the AIHW’s website: <www.aihw.gov.au>.
56 Vulnerable young people: interactions across homelessness, youth justice and child protection


Vulnerable young people
Interactions across homelessness, youth justice and child protection
This report reveals that individuals who experience multiple, cross-sector services in the specialist homelessness, protection or youth justice service areas are a particularly vulnerable group. Clients experiencing 2 or more of these services were more likely than specialist homelessness services-only clients: to report having substance use issues; to report having mental health issues; to have an over-representation of Aboriginal and Torres Strait Islander people; and to receive more days of support and more support periods from specialist homelessness services agencies.


![Shs meetings[4]](https://static.fdocuments.us/doc/165x107/548431a95806b5d1588b45d4/shs-meetings4.jpg)