VSM - 2.pdf
43
Engineering Management Learning to See Parts IV, V A Value Stream Mapping Workshop Mike Rother & John Shook Lean Enterprise Institute MSE507 Lean Manufacturing
-
Upload
nicolas-pesquer-avellanas -
Category
Documents
-
view
283 -
download
1
Transcript of VSM - 2.pdf

Engineering Management
Learning to See Parts IV, V A Value Stream Mapping Workshop
Mike Rother & John Shook Lean Enterprise Institute
MSE507 Lean Manufacturing

Value Stream Mapping Workshop Goals
l To understand the complete value stream l To introduce Value Stream Mapping (VSM) l To draw a current state map
• Learn the mapping concepts and icons l To be able to design an improved value stream
• Develop the ability to “see the flow” of a value stream l To draw a future state map
• Learn the mapping concepts and icons
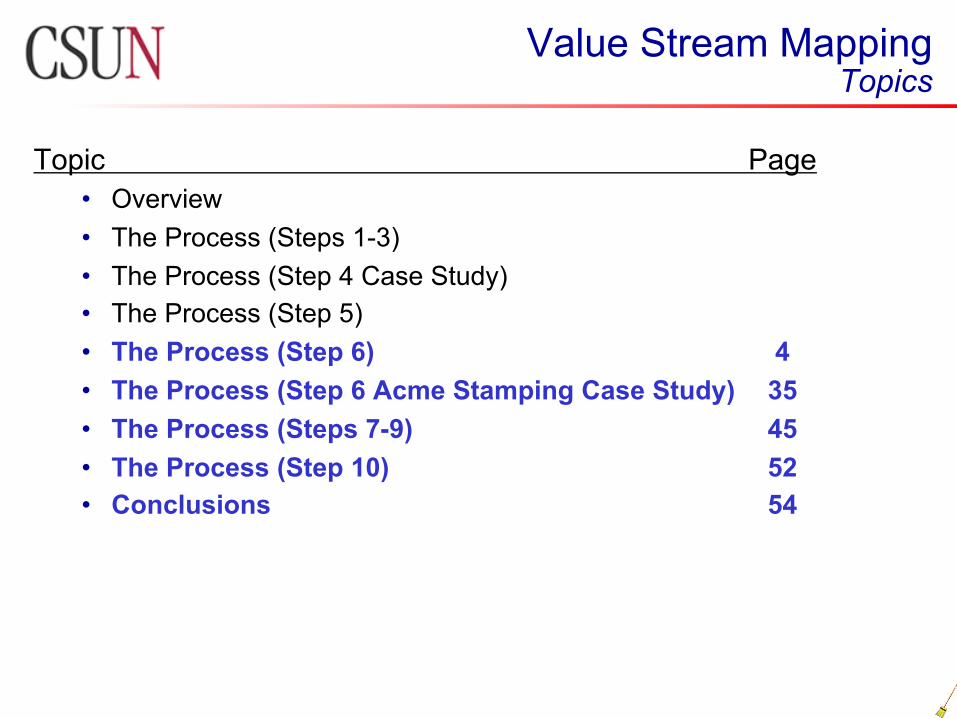
Value Stream Mapping Topics
Topic Page • Overview • The Process (Steps 1-3) • The Process (Step 4 Case Study) • The Process (Step 5) • The Process (Step 6) 4 • The Process (Step 6 Acme Stamping Case Study) 35 • The Process (Steps 7-9) 45 • The Process (Step 10) 52 • Conclusions 54

Value Stream Step 6 Draw the Future State Map
THE PURPOSE: l Highlight sources of waste l Eliminate them l In a short period of time.
THE GOAL: To build a chain of production where the individual processes are linked to the customer(s) either by continuous flow (the best) or pull and each process gets as close as possible to producing only what the customer(s) need when they need it.
What can we do with what we have?

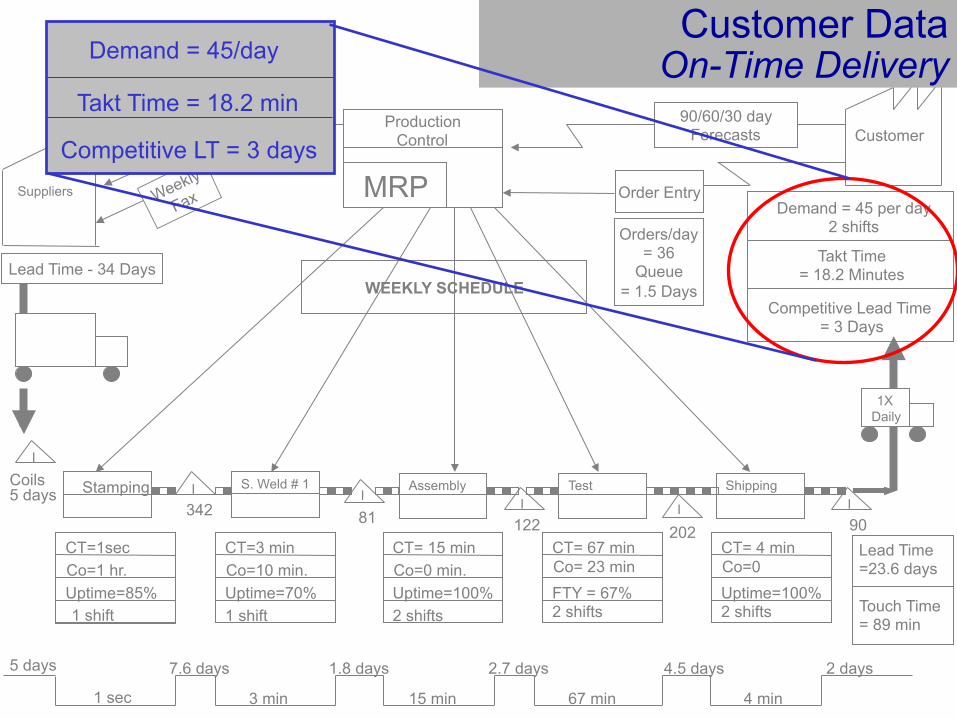
Value Stream Map - Current State
Customer
Demand = 45 per day 2 shifts
Stamping
342
CT=1sec Co=1 hr. Uptime=85%
S. Weld # 1
CT=3 min Co=10 min. Uptime=70%
I
I
I I Coils
5 days
CT= 15 min Co=0 min. Uptime=100% 2 shifts
CT= 67 min Co= 23 min FTY = 67% 2 shifts
Shipping I I 81
202 122
Assembly Test
90
1X Daily
90/60/30 day Forecasts
Order Entry
Production Control
MRP
6 WEEK Forecast
Suppliers
WEEKLY SCHEDULE Lead Time - 34 Days
5 days
1 sec
7.6 days
3 min
1.8 days
15 min
2.7 days
67 min
4.5 days
4 min
2 days
Lead Time =23.6 days
1 shift 1 shift
CT= 4 min Co=0 Uptime=100% 2 shifts
Competitive Lead Time = 3 Days
Takt Time = 18.2 Minutes
Orders/day = 36
Queue = 1.5 Days
Touch Time = 89 min
Competitive LT = 3 days
Takt Time = 18.2 min
Customer Data On-Time Delivery Demand = 45/day

Customer
Demand = 45 per day 2 shifts
Stamping
342
CT=1sec Co=1 hr. Uptime=85%
S. Weld # 1
CT=3 min Co=10 min. Uptime=70%
I
I
I I Coils
5 days
CT= 15 min Co=0 min. Uptime=100% 2 shifts
CT= 67 min Co= 23 min FTY = 67% 2 shifts
Shipping I I 81
202 122
Assembly Test
90
1X Daily
90/60/30 day Forecasts
Order Entry
Production Control
MRP
6 WEEK Forecast
Suppliers
WEEKLY SCHEDULE Lead Time - 34 Days
5 days
1 sec
7.6 days
3 min
1.8 days
15 min
2.7 days
67 min
4.5 days
4 min
2 days
Lead Time =23.6 days
1 shift 1 shift
CT= 4 min Co=0 Uptime=100% 2 shifts
Competitive Lead Time = 3 Days
Takt Time = 18.2 Minutes
Orders/day = 36
Queue = 1.5 Days
Touch Time = 89 min
Raw = 5 days
WIP = 12.1 days
FG = 6.5 days
Inventory

Customer
Demand = 45 per day 2 shifts
Stamping
342
CT=1sec Co=1 hr. Uptime=85%
S. Weld # 1
CT=3 min Co=10 min. Uptime=70%
I
I
I I Coils
5 days
CT= 15 min Co=0 min. Uptime=100% 2 shifts
CT= 67 min Co= 23 min FTY = 67% 2 shifts
Shipping I I 81
202 122
Assembly Test
90
1X Daily
90/60/30 day Forecasts
Order Entry
Production Control
MRP
6 WEEK Forecast
Suppliers
WEEKLY SCHEDULE Lead Time - 34 Days
5 days
1 sec
7.6 days
3 min
1.8 days
15 min
2.7 days
67 min
4.5 days
4 min
2 days
Lead Time =23.6 days
1 shift 1 shift
CT= 4 min Co=0 Uptime=100% 2 shifts
Competitive Lead Time = 3 Days
Takt Time = 18.2 Minutes
Orders/day = 36
Queue = 1.5 Days
Touch Time = 89 min
Touch Time = 89 min
Flow of Value Lead Time Lead Time = 23.6 days

Customer
Demand = 45 per day 2 shifts
Stamping
342
CT=1sec Co=1 hr. Uptime=85%
S. Weld # 1
CT=3 min Co=10 min. Uptime=70%
I
I
I I Coils
5 days
CT= 15 min Co=0 min. Uptime=100% 2 shifts
CT= 67 min Co= 23 min FTY = 67% 2 shifts
Shipping I I 81
202 122
Assembly Test
90
1X Daily
90/60/30 day Forecasts
Order Entry
Production Control
MRP
6 WEEK Forecast
Suppliers
WEEKLY SCHEDULE Lead Time - 34 Days
5 days
1 sec
7.6 days
3 min
1.8 days
15 min
2.7 days
67 min
4.5 days
4 min
2 days
Lead Time =23.6 days
1 shift 1 shift
CT= 4 min Co=0 Uptime=100% 2 shifts
Competitive Lead Time = 3 Days
Takt Time = 18.2 Minutes
Orders/day = 36
Queue = 1.5 Days
Touch Time = 89 min
CT (67) > Takt Time (18)
Constraints OTD, Lead Time Max Wip = 7.6 days

Customer
Demand = 45 per day 2 shifts
Stamping
342
CT=1sec Co=1 hr. Uptime=85%
S. Weld # 1
CT=3 min Co=10 min. Uptime=70%
I
I
I I Coils
5 days
CT= 15 min Co=0 min. Uptime=100% 2 shifts
CT= 67 min Co= 23 min FTY = 67% 2 shifts
Shipping I I 81
202 122
Assembly Test
90
1X Daily
90/60/30 day Forecasts
Order Entry
Production Control
MRP
6 WEEK Forecast
Suppliers
WEEKLY SCHEDULE Lead Time - 34 Days
5 days
1 sec
7.6 days
3 min
1.8 days
15 min
2.7 days
67 min
4.5 days
4 min
2 days
Lead Time =23.6 days
1 shift 1 shift
CT= 4 min Co=0 Uptime=100% 2 shifts
Competitive Lead Time = 3 Days
Takt Time = 18.2 Minutes
Orders/day = 36
Queue = 1.5 Days
Touch Time = 89 min
CO = 23 min
CO = Changeover
Setup Times OP Margin, Lead Time CO = 1 hour

Customer
Demand = 45 per day 2 shifts
Stamping
342
CT=1sec Co=1 hr. Uptime=85%
S. Weld # 1
CT=3 min Co=10 min. Uptime=70%
I
I
I I Coils
5 days
CT= 15 min Co=0 min. Uptime=100% 2 shifts
CT= 67 min Co= 23 min FTY = 67% 2 shifts
Shipping I I 81
202 122
Assembly Test
90
1X Daily
90/60/30 day Forecasts
Order Entry
Production Control
MRP
6 WEEK Forecast
Suppliers
WEEKLY SCHEDULE Lead Time - 34 Days
5 days
1 sec
7.6 days
3 min
1.8 days
15 min
2.7 days
67 min
4.5 days
4 min
2 days
Lead Time =23.6 days
1 shift 1 shift
CT= 4 min Co=0 Uptime=100% 2 shifts
Competitive Lead Time = 3 Days
Takt Time = 18.2 Minutes
Orders/day = 36
Queue = 1.5 Days
Touch Time = 89 min
Maintenance OTD, Lead Time Uptime = 70%
Customer
Demand = 45 per day 2 shifts
Stamping
342
CT=1sec Co=1 hr. Uptime=85%
S. Weld # 1
CT=3 min Co=10 min. Uptime=70%
I
I
I I Coils
5 days
CT= 15 min Co=0 min. Uptime=100% 2 shifts
CT= 67 min Co= 23 min FTY = 67% 2 shifts
Shipping I I 81
202 122
Assembly Test
90
1X Daily
90/60/30 day Forecasts
Order Entry
Production Control
MRP
6 WEEK Forecast
Suppliers
WEEKLY SCHEDULE Lead Time - 34 Days
5 days
1 sec
7.6 days
3 min
1.8 days
15 min
2.7 days
67 min
4.5 days
4 min
2 days
Lead Time =23.6 days
1 shift 1 shift
CT= 4 min Co=0 Uptime=100% 2 shifts
Competitive Lead Time = 3 Days
Takt Time = 18.2 Minutes
Orders/day = 36
Queue = 1.5 Days
Touch Time = 89 min
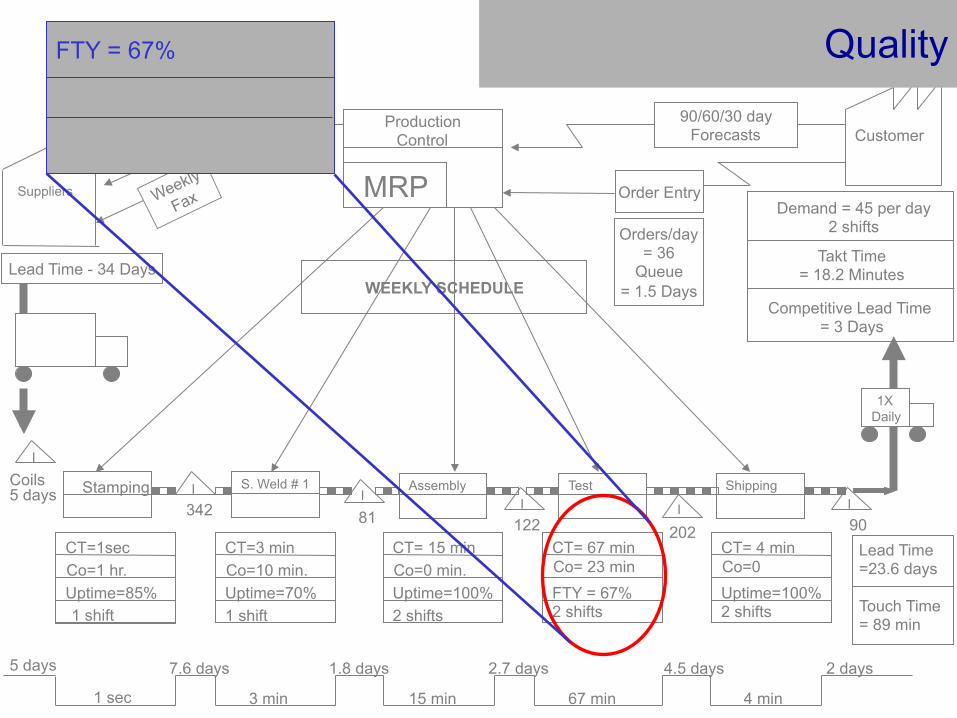
Quality FTY = 67%

Customer
Demand = 45 per day 2 shifts
Stamping
342
CT=1sec Co=1 hr. Uptime=85%
S. Weld # 1
CT=3 min Co=10 min. Uptime=70%
I
I
I I Coils
5 days
CT= 15 min Co=0 min. Uptime=100% 2 shifts
CT= 67 min Co= 23 min FTY = 67% 2 shifts
Shipping I I 81
202 122
Assembly Test
90
1X Daily
90/60/30 day Forecasts
Order Entry
Production Control
MRP
6 WEEK Forecast
Suppliers
WEEKLY SCHEDULE Lead Time - 34 Days
5 days
1 sec
7.6 days
3 min
1.8 days
15 min
2.7 days
67 min
4.5 days
4 min
2 days
Lead Time =23.6 days
1 shift 1 shift
CT= 4 min Co=0 Uptime=100% 2 shifts
Competitive Lead Time = 3 Days
Takt Time = 18.2 Minutes
Orders/day = 36
Queue = 1.5 Days
Touch Time = 89 min
What is the pitch time?
Flow of Value OTD, Lead Time Who is setting the pace?
The Office
l Office functions support many shop floor value streams - purchasing, payroll
l The rate of customer demand is often hard to “see” l Inventory can be forms, paperwork, in-baskets, out-baskets,
voicemail, email l Cycles of activity often are random - little standard work l Confusion about who the customer is and what is value

The Office
HOWEVER, THE OBJECTIVE IS TO
ELIMINATE WASTE!

The Office Current State
l Define boundaries of your value stream l “There has to be a ‘product’ or ‘service’ to follow - like a
purchase order or payroll document - otherwise use a normal flowchart” (LEI)

The Office Current State
l What capability do you provide? l Is the demand stable?
• If not, what is the range ? l What is the customers expectation of performance?
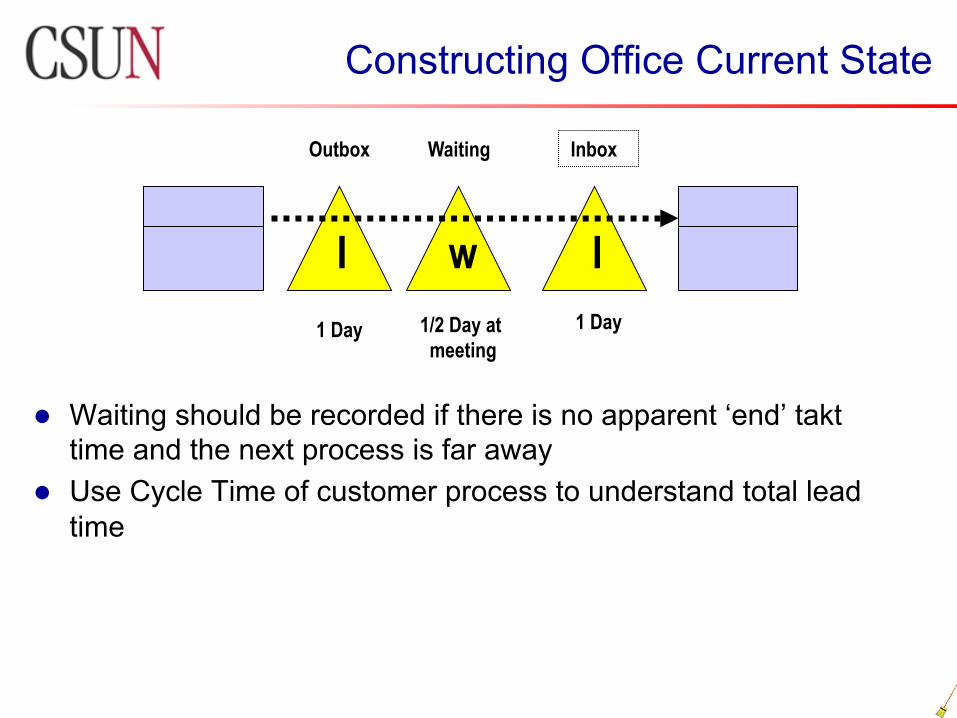
Constructing Office Current State
l Waiting should be recorded if there is no apparent ‘end’ takt time and the next process is far away
l Use Cycle Time of customer process to understand total lead time
I
Outbox
1 Day
w
Waiting
1/2 Day at meeting
I
Inbox
1 Day
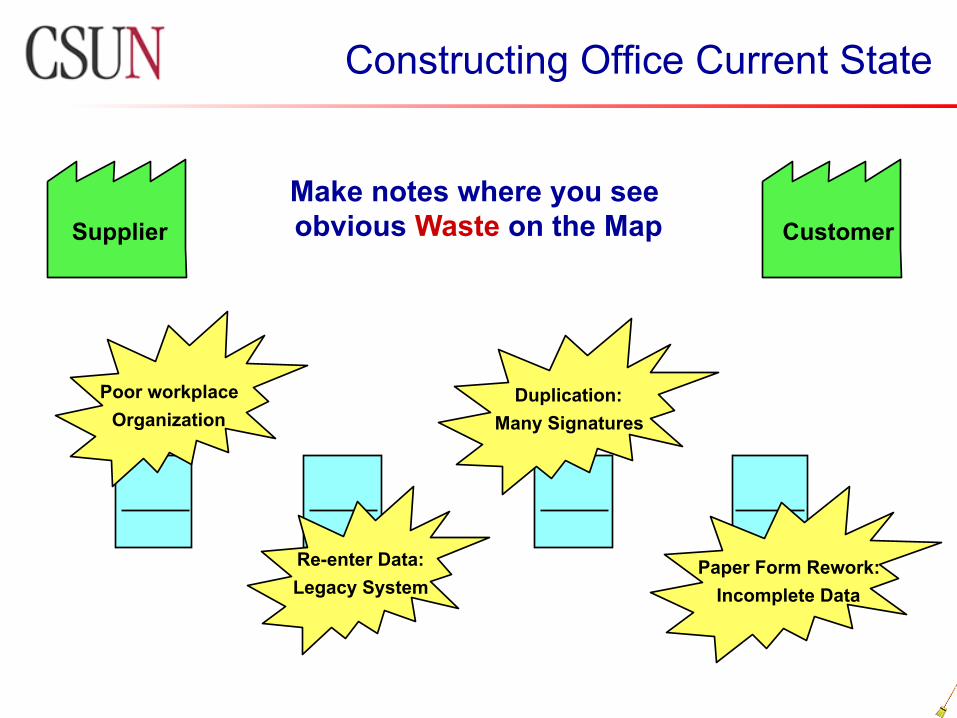
Constructing Office Current State
State Street Assembly Customer
Make notes where you see obvious Waste on the Map
Poor workplace Organization
Re-enter Data: Legacy System
Duplication: Many Signatures
Paper Form Rework: Incomplete Data
State Street Assembly Supplier

1 sales Rep
State Street Assembly Michigan Steel
Company Customer Customer
Central database
Engineering database
I
Outbox
2 files 1 Day
w
Waiting
1/2 Day at meeting
I
Inbox
2 files 1 Day
I
Outbox
3 files 1 Day
w
Waiting
1/2 Day Customer
I
Inbox
10 files 1 Day
I
Outbox
4 files 1 Day
w
Waiting
I
Inbox
2 files 1 Day
w
Waiting
1/2 Day Purchasing quote
I
Inbox
7 files 1 Day
Clarify 1 Day
I
Email / voicemail
W
Meeting 3 hours
4 Estimates .5 hours
Total 10 Days Total CT 8 hrs 20 min
60 min 3 hrs 20 min 4 hrs 10 min
.5 hr 3 hr 1 Day .5 Day 1 Day 1 Day .5 Day 1 Day .5 Day 1 Day 1 Day 1 Day 1 Day
Order Receipt
Manf. Eng.
Eng. Review
Quote Prep
BOM Validation
1 Sales Rep 1 Eng. 1 Eng. 1 sales Rep
Email Quote Design
Log file
Phone Clarification
Email -Clarification
EmailOrder Phone
Clarification
Phone Clarification
Constructing Office Current State

Product Family
Plan & Implementation
Current State Drawing
Future State Drawing
Value Stream Step 6 Draw the Future State Map
Designing a Lean Flow • You always need a future state • Use pencil, update regularly, 70%
correct is fine • Basis for work plan - blueprint • Begin by drawing a current state • 1st iteration assumes using existing
equipment, only minor purchases • Use the list of future state questions

Value Stream Step 6 Future State Map - Icons

Value Stream Step 6 Future State Map – Question Summary
What is the takt time? Will we build to shipping or to a supermarket? Where can we use continuous flow? Where do we have to use supermarket pull systems? At what single point in the production chain do we trigger
production? What levels of work will we release and take away from the
pacemaker process? How will we level the production mix at the pacemaker
process? What supporting improvements will be necessary?
(e.g. uptime, set-up, training)

ACME Stamping Case Study
Value Stream Step 6 Future State Map – Acme Co. Example
First View of the Future-State map Showing
Takt Time, Weld/Assembly Cell, and the
Finished-Goods Supermarket
Value Stream Step 6 Acme Co. Future State – 1st View
Stamping
Takt=60 sec. C/T=56 sec.
C/O= 0 Uptime=100%l
2 shifts
Weld& Assy
LR Shipping
Staging
1X Daily
State St. Assembly
18,400 pcs/mo
-12,000 “L”
-6,400 “R” Tray=20 pcs.
2 Shifts
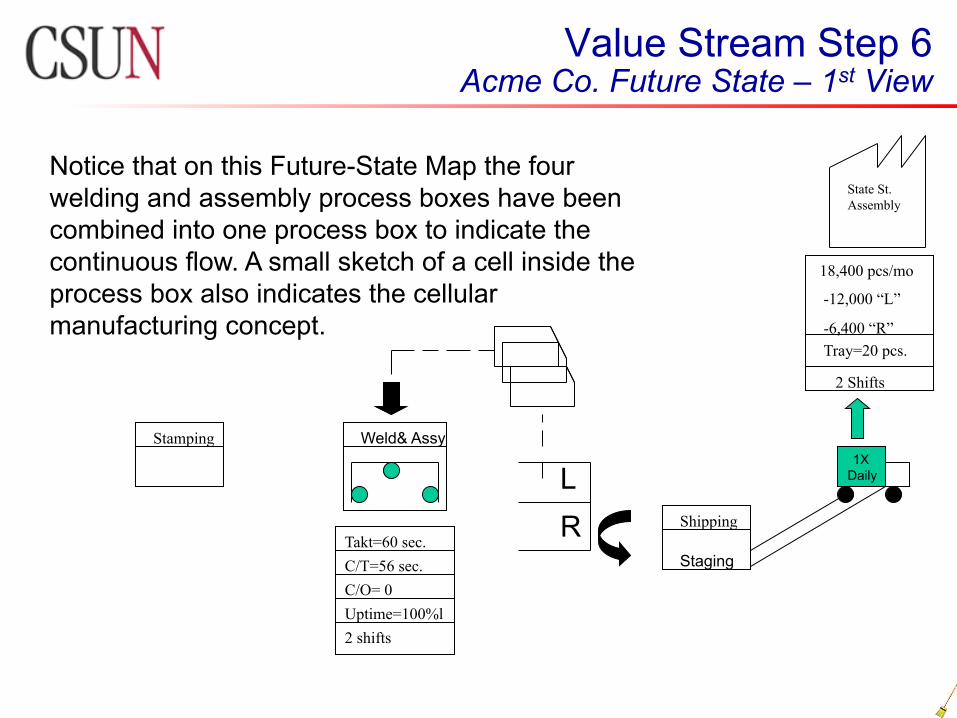
Notice that on this Future-State Map the four welding and assembly process boxes have been combined into one process box to indicate the continuous flow. A small sketch of a cell inside the process box also indicates the cellular manufacturing concept.

Value Stream Step 6 Acme Co. Future State – 2nd View
Second View of the Future-State Map
Showing Stamping and Raw Material
Supermarkets

Value Stream Step 6 Acme Co. Future State
Signal or Batch kanban
l The stamping process needs to produce batches larger than 60 pieces.
l A trigger point is set up in the stamping supermarket which includes changeover, replenishment delay and other stamping problems. In this case stamping will keep 1.5 days of parts in its supermarket
l A signal Kanban is sent to the stamping process whenever the number of bins remaining drops to a trigger ( minimum ) level

Value Stream Step 6 Acme Co. Future State
What about Raw Material? l To build a plant level value stream the Future State must also
show a third supermarket at the receiving dock which holds coils of steel
l Acme can attach an internal withdrawal Kanban to each coil and send these Kanbans to their own production control department whenever another coil is used.
l Production control can order coils based on their actual usage instead of a best guess determined by MRP
l The cards are then returned to the receiving dock as a signal for shipments that are due.
l Milk runs for daily deliveries should be considered at this point

Stamping
Takt=60 sec. C/T=56 sec.
C/O= 0 Uptime=100%l
2 shifts
Weld& Assy
LR Shipping
Staging
1X Daily
State St. Assembly
18,400 pcs/mo
-12,000 “L”
-6,400 “R” Tray=20 pcs.
2 Shifts
20
1.5 days
batch
bin
Coils
PRODUCTION CONTROL
State St. Assembly
6-WEEK Forecast
Daily Order
1X Daily
coil
coil
(at the press)
Value Stream Step 6 Acme Co. Future State – 2nd View
Value Stream Step 6 Acme Co. Future State – 3rd View
Third (Final) view of the Future State Map
Showing Load Leveling, Changeovers, and Timeline
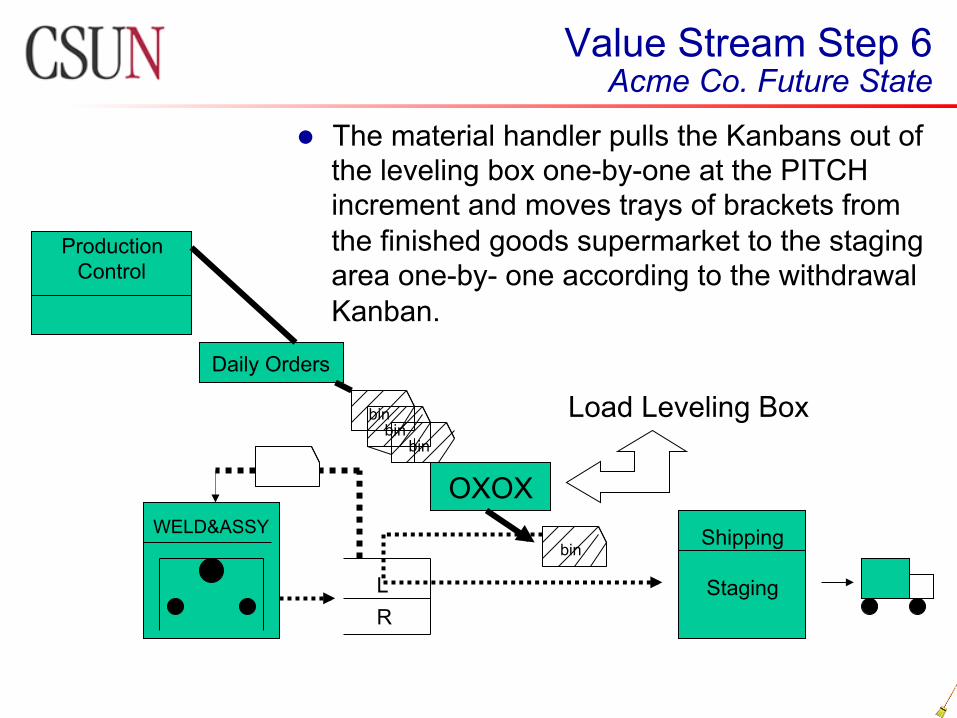
l The material handler pulls the Kanbans out of the leveling box one-by-one at the PITCH increment and moves trays of brackets from the finished goods supermarket to the staging area one-by- one according to the withdrawal Kanban.
Production Control
Daily Orders
bin bin
bin
OXOX WELD&ASSY
L R
bin Shipping
Staging
Load Leveling Box
Value Stream Step 6 Acme Co. Future State

Stamping
Takt=60 sec. C/T=56 sec.
C/O= 0 Uptime=100%l
2 shifts
Weld& Assy
LR Shipping
Staging
1X Daily
State St. Assembly
18,400 pcs/mo
-12,000 “L”
-6,400 “R” Tray=20 pcs.
2 Shifts
1.5 days
batch
bin
Coils
PRODUCTION CONTROL
State St. Assembly
6-WEEK Forecast
Daily Order
1X Daily
coil
coil
(at the press)
EPE= 1 shift. EPE <10 min..
changeover
Weld
changeover Welder
uptime
1 sec.
1.5 days
1 day
168 sec
2 days Production Lead-time= 4.5 days
Processing Time= 169sec
20
20
20
20
OXOX
Daily order
90/60/30 day Forecasts
Daily Order
Value Stream Step 6 Acme Co. Future State – Complete View

Value Stream Step 7 Generate a Value Stream Plan
l Create the yearly Value Stream Plan l Tie it to business objectives l Relate the Future State Map to your layout l What to do, by when, by whom
l Fix the obvious l Broken equipment, needed maintenance l Purchase small tools, replace home-made fixtures
l 5S l Break the implementation into steps
l Break your future state into “loops” l Each loop contains the flow up to and including a supermarket
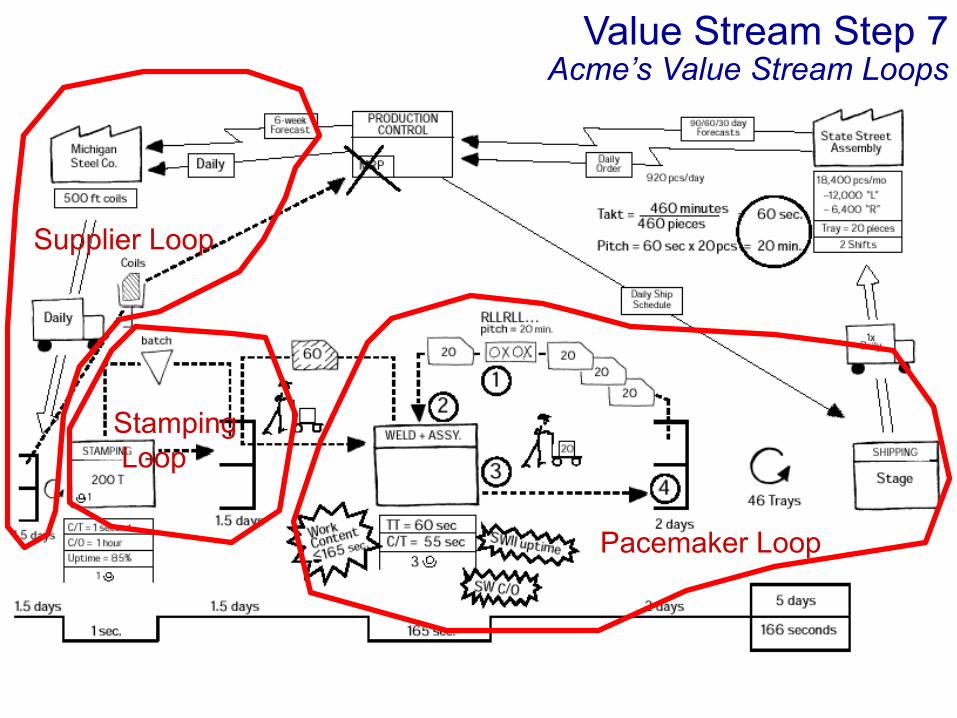
Pacemaker Loop
Stamping Loop
Supplier Loop
Value Stream Step 7 Acme’s Value Stream Loops

Value Stream Step 7 Example Value Stream Plan
Value Stream Step 8 Start Making the Improvements
l Make continuous Value Stream Improvement the responsibility of management
l Don’t wait to get your future state map perfect l The main point is ACHIEVING the future state

Value Stream Step 9 Conduct Value Stream Reviews
l Make continuous Value Stream Improvement the responsibility of management
l Conduct regular Value Stream Reviews while walking the floor l Value Stream Manager and Plant Manager l Focus on obstacles to implementation
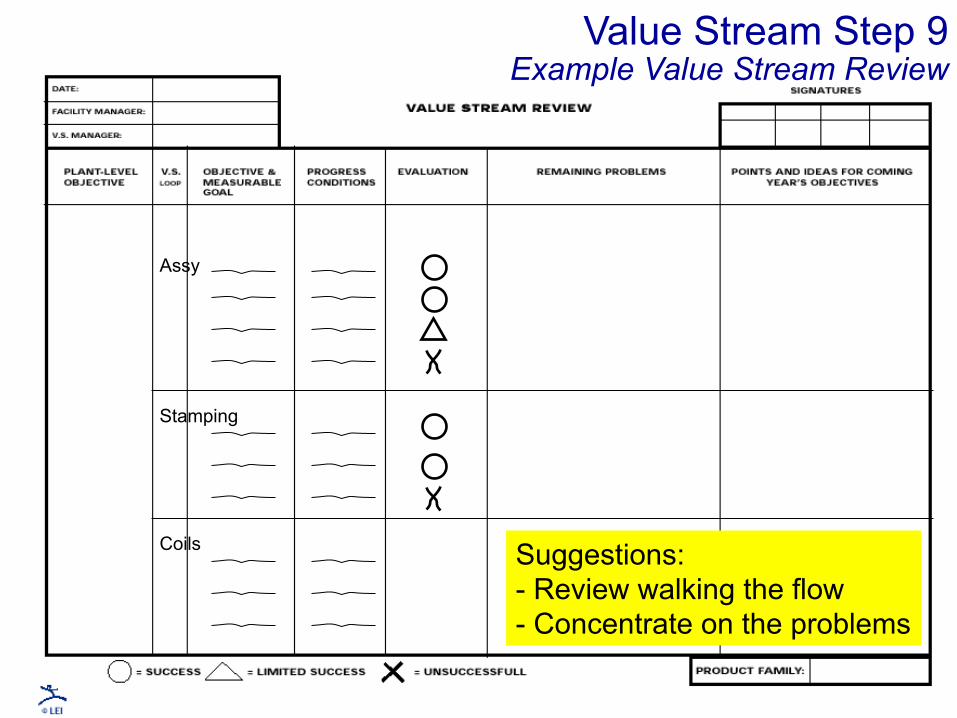
Assy
Stamping
Coils Suggestions: - Review walking the flow - Concentrate on the problems
Value Stream Step 9 Example Value Stream Review

Value Stream Step 10 Repeat the Cycle
l Keep working for perfection

What Can Be Achieved?
l 75% of wasted steps eliminated
l Throughput time shrinks to less than 10% of current state time
l Demand amplification is eliminated
l Quality higher and consistent from start to finish
l Transport links and information needs shrink dramatically

Concluding Comments
l A future state can’t be implemented all at once l Kaizen events help work towards the future state l Value Stream Mapping:
l Helps you visualise more than a single process level l Links the material and information flows l Provides a common language l Provides a blueprint for implementation l Can be more useful than quantitative tools l Ties together lean concepts and techniques

Review of Goals and Expectations
l To introduce Value Stream Mapping (VSM) l To draw a current state map
l Learn the mapping concepts and icons l To be able to design an improved value stream
l Develop the ability to “see the flow” of a value stream l To draw a future state map
l Learn the mapping concepts and icons