Voting after bombing: the electoral effect - Universitat Pompeu Fabra
33
Voting after the bombing: Can terrorist attacks change the outcome of democratic elections? Jose G. Montalvo Department of Economics Universitat Pompeu Fabra IVIE and CREA Abstract Economists have recently turned their attention to the effects of terrorism. One much debated effect of terrorist attacks is its impact on the results of democratic elections. To answer this question we use the terrorist attacks of the 11-M in Madrid as a natural experiment. We consider this particular case since the attack took place only three days before the 2004 Congressional Election, which allows the use of credible identification criterion. In particular, we use the advance voting by Spanish residents abroad, who cast their vote before the terrorist attack, to identify the effect of the bombing on the electoral result. We exploit this macabre natural experiment to run a difference-in- differences estimation using data on three consecutive Congressional elections. Our empirical results indicate that a terrorist attack can have a large impact on the outcome of democratic elections. Keywords: difference-in-differences, terrorism, elections, natural experiment. JEL classification numbers: C21, C23, D72.
Transcript of Voting after bombing: the electoral effect - Universitat Pompeu Fabra

Voting after the bombing: Can terrorist attacks change the outcome of democratic elections?
Jose G. Montalvo Department of Economics Universitat Pompeu Fabra
IVIE and CREA
Abstract Economists have recently turned their attention to the effects of terrorism. One much debated effect of terrorist attacks is its impact on the results of democratic elections. To answer this question we use the terrorist attacks of the 11-M in Madrid as a natural experiment. We consider this particular case since the attack took place only three days before the 2004 Congressional Election, which allows the use of credible identification criterion. In particular, we use the advance voting by Spanish residents abroad, who cast their vote before the terrorist attack, to identify the effect of the bombing on the electoral result. We exploit this macabre natural experiment to run a difference-in-differences estimation using data on three consecutive Congressional elections. Our empirical results indicate that a terrorist attack can have a large impact on the outcome of democratic elections. Keywords: difference-in-differences, terrorism, elections, natural experiment. JEL classification numbers: C21, C23, D72.

Voting after the bombing
1. Introduction.
Economists have recently focused some efforts on analyzing the effects of terrorism and
terrorist attacks. The influence of 9/11 on the interest of economist for these issues is
strong. Additionally, economists are also interested in explaining voting behaviour and
predicting the results of elections using techniques alternative to the usual procedures
based on polls.
This paper is located in the crossing path of these two lines of research. One much
debated effect of terrorist attacks is its impact on the results of democratic elections1.
To answer this question we use the terrorist attacks of the 11-M in Madrid as a natural
experiment. A special characteristic of this terrorist attack is that took place only three
days before the election date. The popular press has argued that the objective of the
attack was to change the Spanish government since the incumbent party (conservative)
had supported the war in Iraq while the contestant (socialist party) was opposed. In fact
during the 2004 US presidential election there was a broadly shared fear that terrorists
may tried to affect the election outcome by performing an attack. But, is it possible to
find empirical evidence to support the claim that the terrorist attacks changed the
identity of the winner of the 2004 Congressional election?
Several studies, mostly by political scientists using post-electoral survey data, have tried
to argue that the outcome of the Spanish congressional election of 2004 would have
been the same even without the terrorist attack. However, economists do not trust this
type of surveys and prefer to work with actual behaviour and not intentions or
recollections.
In general, it would be very difficult to evaluate properly the electoral effect of an
episode like this. Economics and political science are two disciplines were researchers
do not usually have the advantage of running experiments. This problem is particularly
important in the analysis of electoral processes. For this reason we have chosen the 11-
M terrorist attack in Madrid. Since it took place so close to the election day, it is
possible to find and count the actual votes of many voters that did not know about the
terrorist attack: these group are the Spanish nationals abroad. Using this macabre natural
1 There were many political analysts predicting a terrorist attack during the 2004 US presidential election.
2
Voting after the bombing
experiment we are able to identify the effect of the 11-M terrorist attack on the results of
the Spanish election using two alternative approaches.
The economic consequences of the change in the outcome of an election may be very
important. In the Spanish case the winner of the election, the (contestant) socialist party,
undertook many reforms with important economic effects: changes in the income and
the enterprises tax codes, regularization of immigrant workers, changes in the structure
of public expenditure, etc. These changes were not in the program of the incumbent
(conservative) party.
Finally, the issue of the impact of terrorist attack on elections is also important in the
process of peace negotiations with terrorist groups. In the Spanish case, the socialist
government initiated a difficult and controversial process of negotiation with the Basque
terrorist group ETA with the opposition of the conservative party. If terrorist acts can
change the outcome of elections, the closer the date of the election the higher would be
the negotiation power of the terrorist group.
The paper is organized as follows. Section 2 discusses the recent literature on the effects
of terrorism on the economy and recent contributions of economics to the explanation of
voting. Section 3 describes the set-up of the case under study and discusses the
application of the difference-in-differences methodology. Section 3 presents also a long
list of robustness checks. Section 4 considers an alternative approach based on the
transformation of the votes of nationals abroad into residents’ votes, which confirms
also the findings of the previous section. Section 5 contains the basic conclusions.
2. “Bombing” and “voting”: the economists’ perspective.
In the past, the economic effect of civil wars and terrorism has been considered only
exceptionally in the economics literature. This trend has changed dramatically in recent
years. In our days, civil wars and armed conflicts are considered one of the most
pervasive phenomena in the process of economic development (Montalvo and Reynal-
Querol 2005, Collier et al. 2003), although the identification of the direction of the
causality between civil wars and development is complex. In fact, Miguel at al. (2004)
3

Voting after the bombing
show that low economic growth increases the likelihood of civil wars using a sample of
African countries and negative exogenous shocks2.
Economists have recognized for a long time that political instability, and therefore
terrorism, increases uncertainty having an influence on economic growth3 and the
expected return to investment. Several papers have explored the economic impact of
terrorism using cross-country or regional macro data. Abadie and Gardeazabal (2003)
find that terrorism in the Basque Country produced a reduction of 10% in GDP per
capita over two decades compared with a synthetic region without terrorism. They use a
cease-fire period as a natural experiment to identify the effect of terrorism on the market
value of Basque firms4. More recently, Abadie and Gardeazabal (2006) have analyzed
the effect of international terrorism on the net FDI position of countries. Their estimates
indicate that an increase of one standard deviation in the intensity of terrorism implies a
5 percent fall in the net FDI position of the country.
Other papers take a microeconomic approach on the relationship between economics
and terrorism. Angrist and Kugler (2005) analyze the connexion between the production
of coca leaf and terrorism. They show that a shift in the production of coca paste from
Peru and Bolivia to Colombia provided an exogenous increase in the demand for
Colombian coca leaf, which produce localized gains in rural areas that did not spread to
the rest of the country. The regions where coca production increased the most were,
subsequently, the ones that became more violent. Angrist and Kugler (2005) interpret
this finding as support for the theory that terrorism in Colombia is caused by the
financial advantages of producing coca. On the methodological side Angrist and Kugler
(2005) use a quasi-experiment based on the sharp change in the structure of the drug
industry in Latin America caused by the increase in the interdiction by American and
local authorities in non-Colombian countries in 1994. They divide the regions of
Colombia into coca-growing and non-growing regions for the analysis, claiming that the
cross-country analysis in unable to identify the effects.
Miguel and Roland (2006) study the long run economic impact of the U.S. bombing of
Vietnam. They compare the districts that were heavily bombed to other districts,
2 Abadie (2006) cannot find any significant relationship between terrorism and income after considering other characteristics of the countries. 3 Mauro (1995) or Alesina et al. (1996). 4 Abadie and Gardeazabal (2003) find that Basque firms outperformed the control group during the truce period.
4

Voting after the bombing
conditioning on demographic and geographic factors and find that the bombing did not
have a robust negative impact on poverty rates, consumption or levels of literacy
through 2002. Miguel and Roland (2006) use the distance to the 17th parallel
demilitarized zone as the instrumental variable to identify the impact of the bombing.
Economists have not only being interested on “bombings”. We have also being
interested on “voting”. The traditional approach of the empirical literature deals with the
ability of economic models, variables and techniques to forecast election results. Leigh
and Wolfers (2006) provide a recent summary of alternative approaches to forecasting
elections using the economist’s toolkit. In particular, Leigh and Wolfers (2006) show
that the performance of polls is uneven and vary too much to be useful. They argue that
predictive markets, based on bets by individuals, provide useful forecasts with a
reasonable degree of volatility. These results point in the traditional direction of
economics research: we should trust only actual behaviour and not opinions in polls.
Recently, Mullainathan and Washington (2006) have analyzed the causal direction
between votes and beliefs. The traditional view points out that beliefs and preferences
influence vote. However, psychologists have recognized for a long time the possibility
that actions (voting) can drive preferences and beliefs: a vote for a particular candidate
may lead to a favourable interpretation of her actions. Therefore, as in the cases
discussed previously, there maybe an important issue of endogeneity between voter’s
choice and preferences. Mullainathan and Washington (2006) use the Presidential
election to analyze this issue. They use as exogenous factors the age of the voter and the
timing of the election. Their methodological approach is based on a version of the
regression discontinuity design that uses the fact that only individual that reach their
18th birthday by the date of the election are eligible to vote. The regression is basically a
difference-in-differences specification. Using this approach Mullainathan and
Washington (2006) find support for the cognitive dissonance of voting behaviour and,
therefore, for the incumbency advantage. These results show also the problems
generated by using post-electoral polls when trying to analyze the preferences of voters
prior to the election5. Lee et al. (2004) use a quasi-experiment to analyze whether voter
can affect the policy choices of politicians or they just elect policies. They use as
exogenous shocks the change in electoral strength. The electoral rules of the US
5 Post-electoral polls are the basic data for the justification of the victory of the socialist party in the Spanish case even under the counterfactual situation of no terrorist attack.
5
Voting after the bombing
Congressional electoral system generate a close to random assignment of which party
holds a seat in close elections. As in the previous case this is a version of the regression
discontinuity design approach. The assumption is that a close election (the incumbent
barely won the previous election) is the same no matter if the district is Democratic or
Republican. Lee et al. (2004) analyze the effect of close elections on subsequent
representatives’ roll-call voting records and find that electors vote policies and do not
seem to affect their Representatives’ choices during general elections.
For the purposes of our study there is a relevant paper on the intersection of “bombing”
and “voting”. Karol and Miguel (2005) analyze the effect that Iraq War casualties had
on the 2004 Presidential election. They show that the 10.000 US dead and wounded in
Iraq reduced in 2 percent the popular vote of George W. Bush in the 2004 Presidential
election. More interestingly, Karol and Miguel (2005) find that the results after
eliminating the effect of US casualties in Iraq would have been close to the predictions
of statistical models that did not consider the impact of the war.
In the following section we analyze the effect of the 11M terrorist attack and the
counterfactual results of the Spanish Congressional election of 2004 if there had been
no terrorist attack three days before the election date.
3. Voting after the bombing.
In this paper we use study the effect of terrorist attack on the results of democratic
elections. For this purposes we use the 11-M terrorist attack on Madrid because it can
be considered as a suitable natural experiment given the particular timing of events that
took place around the election date. This is the sequence of events that led to the 2004
Spanish Congressional election.
March 2003. President Bush decides the invasion of Iraq. The President of the Spanish
Government, Mr. Aznar (from the conservative party) joins the US in the war
against terrorism in Iraq as part of the international coalition.
October 18, 2003. Bin Laden sends a message in Al Yazeera: “We have the right to
retaliate whenever and wherever we believe it is adequate against the countries
involved in the international coalition against Iraq, specially United Kingdom,
Spain, Australia, Poland, Italy and Japan”.
6

Voting after the bombing
March 11, 2004 (30 months after 9/11). Islamic terrorists deposit nine backpacks full of
explosive in several trains in Madrid. The explosions kill 191 people and wound
1,500.
March 14, 2004. Spanish Congressional election date. Unexpectedly, the socialist party
wins the election.
Initially, after the terrorist attack, the conservative government pointed in the direction
of ETA, the Basque separatist group that seeks the independence of the Basque country,
as the author of the attack. However, very soon there were many hints in the direction of
radical Islamic groups. Despite these hints the government continued arguing that ETA
was, most likely, responsible for the killing. By the afternoon of the 13th of March, it
was already quite clear that the attack was executed by an Islamic terrorist group.
Was the terrorist attack the cause of the defeat of the incumbent conservative party?
Some political scientists have given a negative answer, using post-electoral polls.
However, polls taken before the election date showed a clear victory for the incumbent.
Table 1 shows that the average percentage of vote for the conservative was around 42-
43% in the months previous to the election6. These simple statistics show an important
difference in the polls in favour of the conservative party7 at least until the 7th of March.
Table 1. Monthly average proportions of votes across different polls. % Conservative % Socialist Difference
January 42.92% 36.32% 6.60
February 42.90% 36.35% 6.55
March 42.36% 37.60% 4.76
Election March 14 37.71% 42.59% -4.88
Source: Several sources.
Since Table 1 shows an average of proportions coming from many different sources
(basically polls paid by pro-conservative or pro-socialist mass media8) the figures may
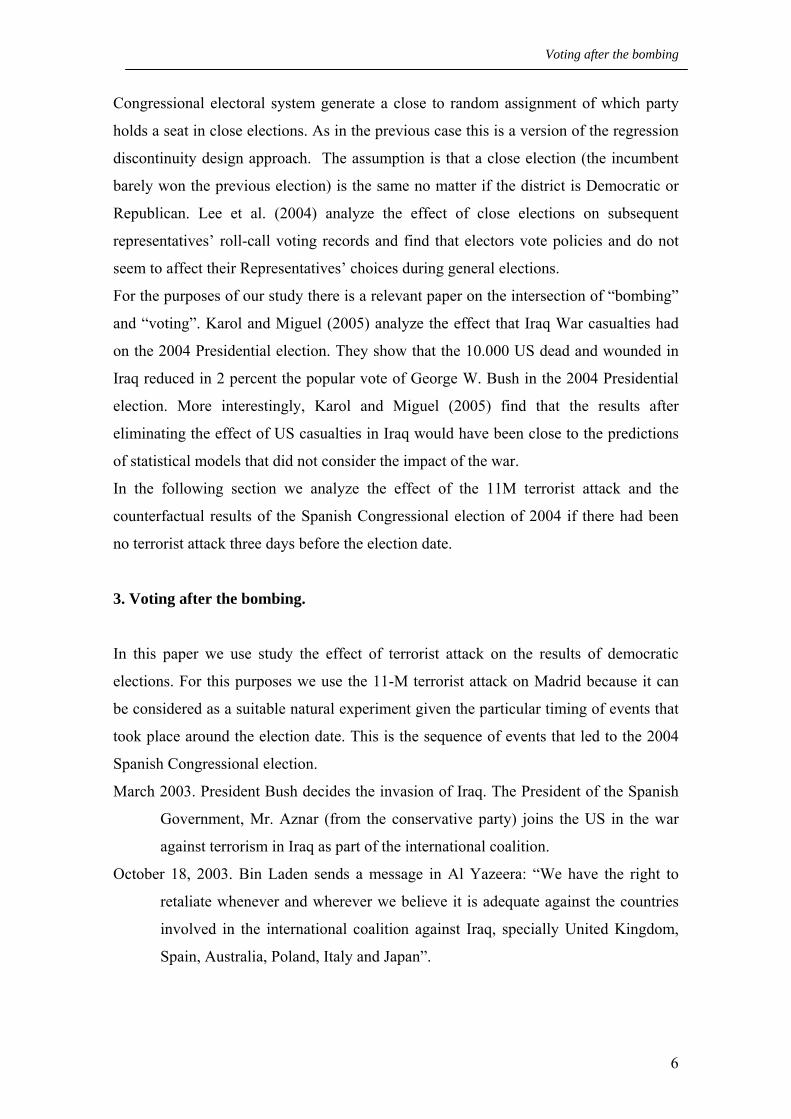
be subject to bias. However Figure 1, which comes from a homogeneous source (the
Gallup survey) shows a similar picture of the voting intention of Spanish electors. 6 The averages are taken over five polls in January, ten in February and seven in March. 7 In fact as late as the 7th of March the basic question in the mass media was if the conservative party would be able to obtain the absolute majority. 8 Recently economists have considered the influence of mass media on the outcome of elections. For instance, DellaVigna and Kaplan (2006) discuss the impact of Fox News in the Presidential elections between 1996 and 2000.
7

Voting after the bombing
Figure 1, as Table 1, does not show any trend in the months previous to the election
(March 2004). If anything, it seems that the conservative party was gaining some
momentum during February 2004. In fact, the last poll of Gallup shows that 44 percent
of the voters were planning to vote for the conservative party.
[Insert figure 1 around here]
Most of the negative answers come from the use of post-electoral polls. Lago and
Montero (2005) use intensively a post-electoral survey by Demoscopia and argue that
the terrorist attack did not have any significant impact on the result of the election. Lago
and Montero (2005) estimate a logit model, using the individual microdata of
Demoscopia, for the probability of voting for the conservative party versus the socialist
party9. Based on these estimations they construct a counterfactual simulation under the
assumption that some of the explanatory variables in the logit model (for instance the
answer to the question “Was the terrorist attack the result of the political position of the
conservative party?”) were equal to 0 even when the answer was affirmative. They
argue that using this strategy it is possible to evaluate the counterfactual situation were
nobody thought that the attack was the result of the policy of the Government, or
nobody was influenced by the informative policy of the Government, or both hypothesis
simultaneously. Assuming that nobody thought that the conservative Government was
at least partly responsible for the attacks, nor it tried in purpose a confusing informative
policy, the socialist party would have lost 3.5 percentage points while the conservative
party would have won 1.2 percentage points10. Therefore, Lago and Montero (2005)
conclude that the incidence of the terrorist attack was very limited.
However, these results are biased by many factors. The estimation of the logit models is
plagued by many endogenous variables that are assumed exogenous. The sample of
Demoscopia is clearly biased since it grossly under represents the voters for the
conservative party. In the survey there are almost 2 voters of the Socialist party for each
voter of the conservative party when, in the actual election, there were only 1.12. In
addition, being a post-electoral survey asking for the reasons why voters change their
vote after the bombing, the answers are plagued with all the problems associated with
retrospective questions and cognitive dissonance. In this particular case, the problems
are much more important since the terrorist attack, which is the event being analyzed,
9 They use the 50 percent threshold to assign a vote. 10 The difference would have gone mostly to the communist party.
8

Voting after the bombing
could have a critical impact in the recollection/perception of what voters thought before
the attack.
3.1. Analyzing the counterfactual: the identification strategy
In general, the issues related with political elections are difficult to analyze with the
usual tools of econometrics because of endogeneity problems. In section 2 we show that
the problem of endogeneity is present in all the literature on “bombing” and “voting”.
For this reason our identification strategy relies on a natural experiment11. The
particular case we analyze in this paper is a very special situation because of the timing
of the terrorist attack and the deadlines for the voting of Spanish nationals living in
foreign countries. This timing generates a macabre natural experimental, which relies
only on observed voting behaviour, without any reference to opinion polls (neither pre-
electoral, nor post-electoral). The presential voters, who cast their vote the 14th of
March, obviously knew about the terrorist attack. However, there is a body of electors
who voted before the election date. The Spanish legislation calls them “absentee
voters”12. In many countries the regulation imposes a deadline for the vote of the
citizens abroad, which is several days before the official day of the election.
Notice that we are not referring to mail voters in general. The non-presential vote by
residents in Spain13 cannot be differentiated from the presential vote because it is
introduced in the same urn. The “absentee voters” are non-presential voters who live in
a foreign country and are registered in a Spanish consulate. The electoral rules for
absentee voting in the 2004 Elections allowed them to vote before the day of the
bombing. In particular, they could start voting from the 2nd of March14 with two
possible options: to cast their vote in person before the 7th of March in a Spanish
Consulate or by certified mail. We can use two groups, the Spanish residents and the
Spanish nationals abroad, to evaluate the effect of the terrorist attack on the results of 11 For a clarifying discussion on the differences between experiments, quasi-experiments and natural experiments see Meyer (1995) or Shadish et al. (2002). 12 In Spain these voters are counted in the CERA (Census of Absentee Voters Resident Abroad). These persons are basically Spanish nationals with right to vote who are living in foreign countries and who are registered in the Spanish Consulates around the world. 13 Mail voters who live in Spain, but for some reason, are not going to be in their electoral district the day of the election. In strict sense these voters are also “absentee voters” but they are not included in the CERA because their official residence is a Spanish address. 14 A caveat we discuss in the section 3.5 is the possibility of other important news (apart from the terrorist attack) that changed the intention of vote of electors between the 2nd of March and the election date.
9

Voting after the bombing
the election. Using the terminology of causal inference we have two groups: the treated
group is the set of voters resident in Spain, who where subject to the treatment
(information about the terrorist attack) before they vote; and the control group, which is
formed by the absentee voting of Spanish national abroad, who did not know about the
terrorist attack before they cast their vote. For both groups we have the results of three
Congressional elections. This set up allows the use the difference-in-differences (DID)
methodology to evaluate the impact of the terrorist attack. The standard DID estimator,
in non-parametric form, is
[ ] [[ ][ ] [[ 0,0|1,0|
0,1|1,1|==−==−
]]]
==−===DGYEDGYE
DGYEDGYEδ (1)
where Y is the outcome variable (percentage of vote cast for the conservative party), D
is a time dummy variable (D=0 if the time period is before the terrorist attack and D=1
if it is after) and G is a dummy variable that denotes the group (G=0 if the observation
belong to the control group and G=1 if it belong to the treatment group).
A sufficient condition for the identification of the treatment effect is that the selection
for treatment does not depend on the individual-transitory perturbation of the primitive
specification. This is to say that, in the absence of treatment, the average outcome for
the treated and the untreated would have presented the same change15. If we have a
sample with repeated pre-treatment and post-treatment observation for the outcome
variable we can estimate the difference-in-differences estimator, δ using a regression
formulation
ititit uGDY ++=Δ δβ1 (2)
If we have data on more than two periods and the specification in levels includes a time
trend with a time specific coefficient16 then the regression (2) should include a dummy
variable for each new time period.
There has been a growing interest for this type of estimators in the empirical economic
literature. Bertrand et al. (2004) found 92 papers that use the difference-in-differences
approach written between 1990 and 2000 in a selected set of journals. Many of these
applications refer to labor economics although there have been applications in many
15 This is also referred to as the parallelism assumption. 16 See Ashenfelter and Card (1985) or Abadie (2005).
10

Voting after the bombing
other fields17. Recently, several authors have proposed extensions to the basic linear
parametric specification. Athey and Imbens (2006) proposed an identification strategy
for non-linear difference-in differences model that includes the standard DID as a
particular case. Bertrand et al (2004) notice that the inconsistency of standard errors
when outcomes are serially correlated and data are individual (not grouped), could
generate a severe understatement of their value. They propose two corrections based on
grouping in the time and the cross section dimensions. Donald and Lang (2004) discuss
inference in panel data when the number of groups is small (typical of DID estimation)
and some variables are group specific. Conley and Taber (2004) provide a new method
of inference in DID models when there are a small number of policy changes.
In some situations the dynamics of the outcome variable may depend on covariates.
This is more likely the more unbalanced are the covariates between groups. If this is the
case, the difference-in-differences estimator (1) could be written analogously but
conditional also on the covariates. If we include the covariates linearly in the previous
regression we get18
itj
jitjitit uXGDY +++=Δ ∑γδβ1 (3)
3.2. Data and basic results
Our data contains 52 observations for each time period for the treated group (Spanish
residents) and the control group (Spanish citizens in a foreign country). These
observations correspond to the results of the Congressional elections of 1993, 1996,
2000 and 200419 in each of the 50 provinces of Spain plus the two Spanish cities in
Africa (Ceuta and Melilla)20. All the data are taken from the database of the Spanish
Secretary of Homeland Security (Ministerio del Interior). The electoral census is
divided in two parts: the regular census and the census of “residents absent”, or voters
17 A basic reference for the estimation of linear difference-in-differences models is Blundell and MaCurdy (2000). 18 Abadie (2005) has recently proposed a semiparametric approach to the estimation of difference-in-differences models with covariates. See also the related work by Heckman et al. (1998). 19 Notice that we only consider Congressional elections since it is well-known that the choices of voters in other type of elections (local, regional or European) is significantly different. 20 Ceuta and Melilla have a special status since from an administrative point of view they are cities, provinces and Autonomous Communities. They are located in the Northern coast of Africa. Given their population and ethnic mix these two cities are quite different from the rest of Spain.
11

Voting after the bombing
who have registered in a Spanish consulate because they live abroad (CERA or Census
of “Absent Residents”)21.
Our specification includes also several covariates. The use of additional regressors can
improve the efficiency of the estimation. In addition, by including these covariates we
can deal with compositional differences between the treated and the control group
caused by potential failures in the parallelism hypothesis. Therefore, the variables
included in X control for potential differences in the outcome distributional dynamics.
There are two basic covariates: the number of voters and the participation rate. Table 2
presents the results of the following specification, using these Congressional elections
ititititttit uPOTVOTPARTDGDDY ++++++=Δ − 211321 0400 λλδβββ (4)
where the outcome ΔY is the change in the proportion of vote for the incumbent
(conservative) party, D04 and D00 are two time dummies, and DGit is the interaction
term that represents the resident voters after the terrorist attack (treated group after the
treatment was received). We consider two covariates related with the level of the
participation rate and the number of potential voters. Since the covariates have to be
predetermined at the initial time we use the lag of the participation rate (PART)22. The
number of potential voters (POTVOT) was unaffected by the terrorist attack since the
electoral lists are constructed before the beginning of the election period.
[Insert table 2 around here]
Table 2 presents the estimation of the basic specification. All the regressions show a
highly significant reduction in the proportion of voters for the incumbent (conservative)
party as a consequence of the terrorist attack. The direct interpretation of the coefficient
on DG as the effect of the terrorist attack on the proportion of vote of the incumbent
party is not totally adequate since the provinces do not have the same number of voters.
Then, the effect on the average proportion of provincial voters for the incumbent party
could not represent appropriately the overall proportion for the whole country. We need
to construct the counterfactual number of votes for the incumbent (conservative) party if
there had not been a terrorist attack. For this purpose we predict the proportion of votes
for the conservative party in each province if there had been no bombing and multiply
21 Notice that the total number of voters includes the votes of the residents absent in the CERA. For this reason the numbers presented in the following sections are not identical to the ones reported in Colomer (2005), which do not include the votes of residents absent. Including the previous Congressional elections (like 1993) does not affect the basic findings presented in the paper. 22 The participation rate was also affected by the terrorist attack as we discuss later in the paper.
12

Voting after the bombing
this by the number of potential voters times the counterfactual participation rate of each
province. Notice that the participation rate was also affected by the terrorist attack.
Therefore, we consider that possibility and we estimate the “no bombing” participation
rate. To obtain this objective we run a DID estimator on the participation rate by
provinces with the results shown below
ittit DGDRTAP )66.3(73.200)78.17(39.95(6.12)D049.3)91.1(71.0ˆt +−+−−=Δ (5)
where the t-statistic is included between parenthesis23. The R2 of this regression is 0.78.
The estimation shows that the bombing had a positive effect, increasing the average
provincial participation rate in 2.7 percentage points. Using the predicted participation
rate and the predicted proportion of vote for the conservative party under the
counterfactual situation, the specification in column 1 of table 2 delivers a 42.8% of the
counterfactual voters for the incumbent (conservative) party. This proportion is almost
identical to the results of the polls during March of 200424.
Column 2 in Table 2 includes the lagged participation rate as an additional explanatory
variable. The results are very similar to the ones obtained in column 1. The treatment
effect of the terrorist attack is negative and highly significant. Under the counterfactual
situation the incumbent (conservative) party would have received the support of 42.5%
of the counterfactual voters. Columns 3 to 6 include additional covariates: the lagged
participation rate for the treated group (column 3), the number of potential voters
(column 4), the combination of potential voter and lagged participation rate, total and
for the treated group (column 5). Column 6 considers jointly all the previous covariates.
The R2 in the regression with covariates reaches 0.56.
No matter what set of covariates we use, the counterfactual vote for the incumbent party
oscillates between 42.4% and 42.8%, close to the results predicted by the polls taken
before the terrorist attack. This means that the terrorist attack reduced in approximately
5 percentage points the support for the incumbent party.
[Insert table 3 around here]
Among the observations (provinces) included in the sample there are two potential
outliers: Ceuta and Melilla. These are the last two colonial cities that Spain keeps in the
North of Africa. Given their population and ethnic mix these two cities are quite
23 In all the regressions presented in the paper we have computed a HAC, or robust, estimator of the standard deviation, using the typical sandwich formula. 24 See table 1.
13
Voting after the bombing
different from the rest of Spain. They also have a low number of potential voters and,
since we are running un-weighted regressions, they could affect the aggregate result
even if we control for the number of voters as a covariate. Table 3 replicates the
specifications in Table 2 but without including these provinces. All the regressions
show an effect of the terrorist attack a little higher than in Table 2. The coefficient
ranges between -5.29 and -5.60 while in Table 2 the range of variation was between -
4.90 and -5.29. We can use the procedure discussed before to calculate the number of
voters for the incumbent (conservative) party under the no terrorist attack
counterfactual, correcting also the participation rate by province. The DID estimation of
the participation rate equation is practically identical to the results presented in (5). In
particular, the estimated coefficient for the treatment dummy is 2.6. The estimations in
Table 3 imply a counterfactual proportion of votes for the incumbent (conservative)
between 42.9% and 43.1%. The R2 has increased (0.62) with respect to the regression
that included all the observations (0.56). Following the results in Table 3 the terrorist
attack reduced the proportion of voters for the incumbent party by approximately 5.4
percentage points.
3.3. Weighted regressions
Table 2 and 3 present the results of the counterfactual (no terrorist attack) aggregating to
the national level the results obtained at the provincial level using province specific
potential voters and participation rates. However, the regressions are estimated using as
observations the outcomes of provinces that have a very different number of potential
voters. In this section we re-estimate the specifications of Tables 2 and 3, weighting
each observation by the potential number of voter. Table 4 replicates the specifications
of Table 2 but weighting the observations by the number of potential voters in each
province. Column 1 presents the basic specification. The weighted regressions increase
the impact of the terrorist attack on the proportion of vote for the incumbent party. In
particular, column 1 shows that the terrorist attack reduced the electoral support for the
incumbent party in 7.5 percentage points. Columns 2 to 6 include the same regressions
of Table 1 but weighting the observations by the number of potential voters. The results
indicate a clear increase in the effect of the terrorist attack on the electoral support of the
incumbent (conservative) party with respect to the results of the unweighted regressions
14

Voting after the bombing
of Table 2. The R2 is around 0.8. The average reduction in the proportion of votes for
the incumbent party is around 7.2 percentage points while in Table 2 the average effect
was around 5.1 percentage points.
[Insert table 4 around here]
Table 4 includes all the provinces in the regressions. However, as we discussed in
section 3.2, there are two observations that are potentially outliers: the two African
cities of Ceuta and Melilla. It is reasonable to expect that eliminating these observations
in a weighted regression will have less of an impact than in the case of the unweighted
regression. Table 5 present the results of the weighted regressions excluding these two
potential outliers. Column 1 confirms that the effect of eliminating these observations is
very small. The increase in the coefficient on the treatment effect is 0.1%, while the
effect in column 1 of table 3 (unweighted regressions without outliers) is an increase of
5.6%. Something similar happens in the rest of the regressions. As in table 3, the
elimination of these observations increases the absolute value of the coefficient of the
treatment variable but, in the case of the weighted regressions, the proportional increase
(around 1.8%) is smaller than in Table 3 (around 7.5%). Finally, the R2 has also
increased (0.82) with respect to the weighted regressions with the full sample but the
influence of the elimination of the outliers in the improvement of the fit of the
regressions is not as large as in the case of the unweighted regressions.
[Insert Table 5 around here]
As an additional robustness test, we consider running the weighted regressions with
three Congressional (two cross-sectional changes). The results in the previous tables
include data on three changes. Bertrand et al (2004) recommend collapsing the data into
a pre- and post- treatment period to obtain consistent estimates of the standard errors
when the number of aggregated observations is small. Following their suggestion, and
the standard of many applications, we discuss in this section the sensitivity of the results
to the use of only differences in Congressional elections (1996 to 2000 and 2000 to
2004).
[Insert Table 6 around here]
Column 1 of Table 6 shows the estimation of the basic regression. In this case the
terrorist attack reduced the proportion of vote for the conservative party in 7.5
percentage points. This estimator is almost identical to the one obtained for the basic
regression with three Congressional elections (columns 1 in Tables 4 and 5). Column 2
15

Voting after the bombing
includes the lagged participation rate as a covariate, while column 3 adds also the
number of potential voters. The estimation of the effect of the terrorist attack ranges
between -6.9 and -7.5 percentage points. The R2 is 0.86 in the last regression, higher
than the corresponding coefficient of determination in column 4 of table 4 (0.80) where
the estimation included three Congressional elections.
The last three columns of Table 6 present the weighted regressions using two
Congressional elections but eliminating the potential outliers (Ceuta and Melilla). The
effect of the terrorist attack is very similar to the one obtained in the initial three
columns. The absolute value of the coefficient increases when the outliers are
eliminated, as we already reported in the case of the weighted and unweighted
regressions with data on three Congressional elections. However, the difference in the
coefficient is very small, as we observed in the comparison of the weighted regressions
of Table 5 with Table 4. The R2 increases marginally when the outliers are not included
in the sample, in agreement with the results reported in previous sections.
3.4. Discussion of the results
The results of the DID estimation presented in the previous subsection are robust to
different specifications, samples and weights of the observations. The terrorist attack
had a significantly negative effect on the electoral support of the incumbent
(conservative) party in the 2004 Congressional election. The estimation of the treatment
effect is always negative and statistically significant, no matter what specification is
used. The estimated counterfactual percentage of votes for the conservative party
ranges, depending on the specification, between 42.5% and 45%. The lower bound of
the range is similar to the average of the polls presented in Table 1 while the upper
bound corresponds closely to the latest Gallup poll presented in Figure 1.
In this section we discuss the interpretation of these findings and some possible threats
to their validity. First of all, the results should be interpreted as a molar descriptive
causation in the terminology of Shadish et al. (2002)25, by contrast with a molecular
interpretation. Many researchers have argued that the terrorist attack was only a small
part of the reason why the incumbent (conservative) party lost the election. These
authors argue that the informative treatment of the terrorist attack by the Government 25 See pages 10 and 54.
16

Voting after the bombing
was more important than the attack “per se”. Following this interpretation, voters felt
deceived by the attempt of the Government to make ETA, the Basque terrorist group,
responsible of the attack even after they got clear hints that an Islamic terrorist group
was the most likely suspect. We interpret our results as molar because we cannot
identify separately the effect of the terrorist attack in its multiple molecular elements
(the attack “per se”, the informative policy of the Government, the effect of watching in
TV the concentration of people in front of the headquarters of the conservative party,
etc.). We consider the effect of the terrorist attack as a complex package that includes
all the previously cited components. We believe that it is impossible to discern the
effect of each of the components using data on actual voting. In addition, the terrorist
attack is the reason why there were attempts to mislead public opinion about the identity
of the perpetrators. The Government thought that accusing the Basque separatists would
produce some electoral return (since the conservative party represented the tough
approach towards the Basque problem). On the other hand, accusing an Islamic group
had negative consequences on their electoral prospects. In any case the terrorist attack
was a necessary condition for what happen afterwards. Therefore, the results can be
safely interpreted as the consequence of the terrorist attack in a molar causal approach.
Secondly, we should discuss some possible threats to the internal validity of the
findings. Basically, we want to distinguish between possible and plausible, or likely,
threats for the particular case under study. Shadish et al. (2002) provide the standard
classification of these potential problems. They classify the threats to the validity of the
findings in natural experiments and quasi-experiments in three groups: statistical
validity, internal validity and external validity26. At the beginning of this section we
discussed the robustness of the basic results to alternative specifications and data
structures. Even in the lower bound of the counterfactual, the proportion of votes for the
incumbent (conservative) party is 42.5%, while the actual proportion was 37.4%.
Therefore, the findings are substantive27 and statistically robust.
26 We do not consider external validity since it is unlikely that a situation like the one considered in this paper could happen again, although there were indications that a terrorist attack could had happened during the US Presidential election of 2004. 27 The socialist party won the election, and the presidency of the Government, with a percentage of votes similar to our estimated counterfactual (no terrorist attack) proportion for the conservative party.
17

Voting after the bombing
Are there plausible threats to the internal validity of these results? Are there reasons to
believe that the data cannot be treated as a natural experiment28? Meyer (1995) and
Shadish et al. (2002)29 describe a full list of threats to internal validity. Some of them do
not apply to our case. For instance, the first item in the list is an ambiguous temporal
precedence between the assumed cause and the effect. However, in the episode that we
are analyzing it is clear that some voters cast their vote after knowing about the terrorist
attack and some others did not know30. Among the possible threats we can include
selection and history.
We believe there is no sample selection, since the decisions of Spaniards to live outside
of Spain was not caused by the terrorist attack. In fact, Spanish residents in foreign
countries had to be listed in the electoral Census of “residents absent” well before the
attack took place. It is true that Al-Qaeda had threaten Spain with terrorist attacks but it
is unlikely that any individual would have taken her decision of residence outside of
Spain because of this. It would be possible that the Spaniards who migrated to other
countries between 2000 and 2004 had a conservative bias. However, this is not very
likely. The conservative party was in power during these years and, therefore, it seems
reasonable to assume that the policies and measures adopted by the Government
favoured specially their conservative voters. Additionally, in many specifications we
include some covariates to control for this possibility without altering the basic findings.
The possibility of Spanish nationals abroad to handle their vote since the second of
March, while the terrorist attack was on the 11th, could also be a source of threats to the
internal validity of the results31. If there were negative news about the incumbent
(conservative) party, or positive about the contestant (socialist) party, between the
second of March and the terrorist attack, then the treatment effect estimated previously
could not be attributed totally to the terrorist attack. We have checked the best selling
newspapers of Spain32 during the period between the second of March and the 11th
28 Obviously, in our case the cause is not manipulable and, therefore, it cannot be considered as an experimental study. Nevertheless, the particular timing of the events generates a sort of randomization in the reception or not of information about the terrorist attack. 29 Page 55. 30 Other possible problems that do not apply are attrition, failure to follow the protocol and experimental effects. 31 This is called history in the terminology of Shadish et al. (2002), or the possibility that events occurring concurrently to the treatment could cause the observed effect. 32 We included all the newspapers with a net circulation daily average over 100,000 copies (except sport newspapers). The list includes the ABC (278,000), El Correo (124,999), El Mundo (314,000), El País (453,000), El Periódico (170,000), La Razón (140,000) y La Vanguardia (208,000). Source: OJD.
18
Voting after the bombing
searching for negative news about the conservative party (corruption scandals,
worsening of the prospects of victory in the Congressional election, etc.). There are
many news related with the two largest political parties (conservative and socialist). We
analyze more than 200 news during the period. However, we were unable to find any
clear bias of the news pro- or against the conservative party. The fact that there were not
important news during the period, that almost every newspaper has a clear bias pro- or
against one of the two largest parties and that the circulation of newspapers favouring
each option is quite balance can explain this absence of aggregated bias over the period
and the set of chosen newspapers33.
4. A transformation approach.
In this section we analyze an alternative specification to tackle the issue of evaluating
the counterfactual percentage of votes for the conservative party under the “no attack”
situation. We use basically the same data of section 3. We should notice that in our
sample the same provinces are included in the treated and control group in each
Congressional election. Obviously the voters are different since both groups are
exclusive: the treated group is composed by presential voters while the untreated group
includes only residents abroad. Nevertheless, province 1 is counted twice: into the
treated group (for the residents in province 1) and into the non-treated group (for the
residents abroad who were residents of province 1 when they lived in Spain). Therefore,
it would be reasonable to think that there is a province specific component that affects
individuals of province 1 included in both groups (treated and untreated) since the initial
pool of residents in province 1 is the same.
In this section we consider that there is a stable relationship across provinces between
the vote of resident in Spain and Spanish nationals abroad. We proposed a specification
that represents the transformation of votes of Spanish citizens in a foreign country into
presential votes. Empirically, there is a positive and quite robust relationship between
the proportion of voters resident in Spain and the vote of Spanish nationals abroad for
each political party at the province level. Figure 2 shows, by year, the relationship
(Institutional Supervisor of circulation in written mass media). Net circulation daily average between parenthesis. 33 We also checked the same for the 1996 and 2000 Congressional elections without finding any significant event.
19
Voting after the bombing
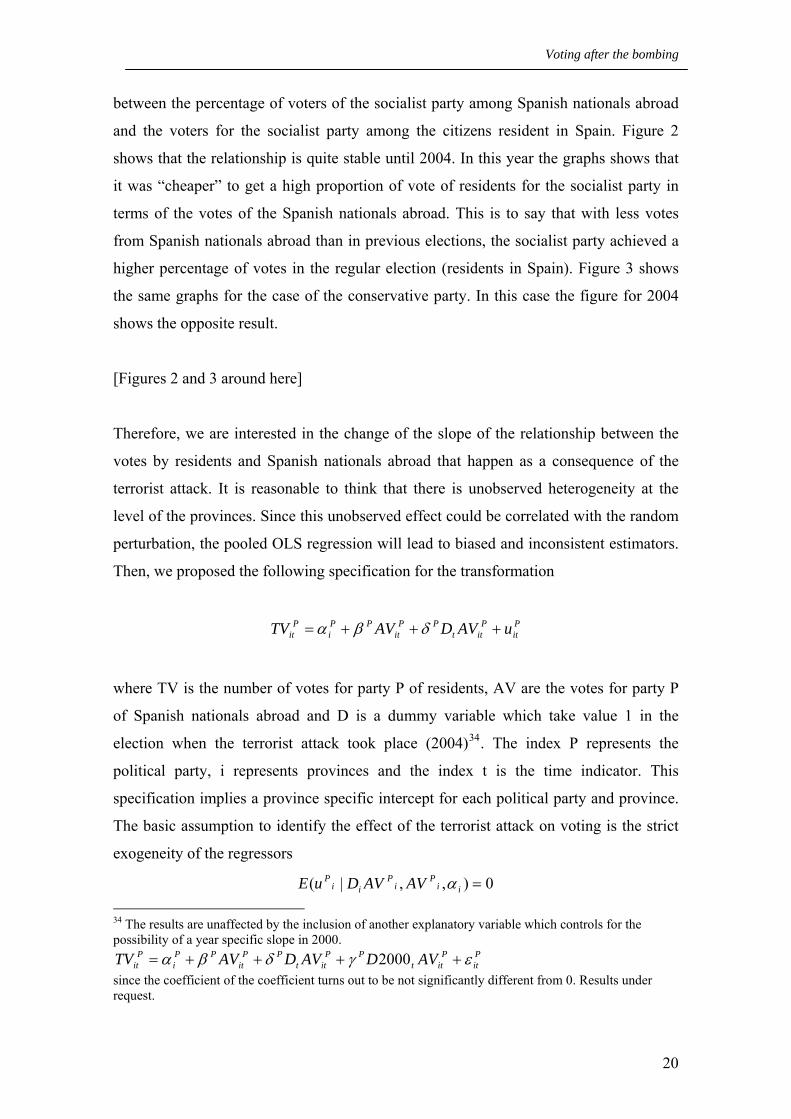
between the percentage of voters of the socialist party among Spanish nationals abroad
and the voters for the socialist party among the citizens resident in Spain. Figure 2
shows that the relationship is quite stable until 2004. In this year the graphs shows that
it was “cheaper” to get a high proportion of vote of residents for the socialist party in
terms of the votes of the Spanish nationals abroad. This is to say that with less votes
from Spanish nationals abroad than in previous elections, the socialist party achieved a
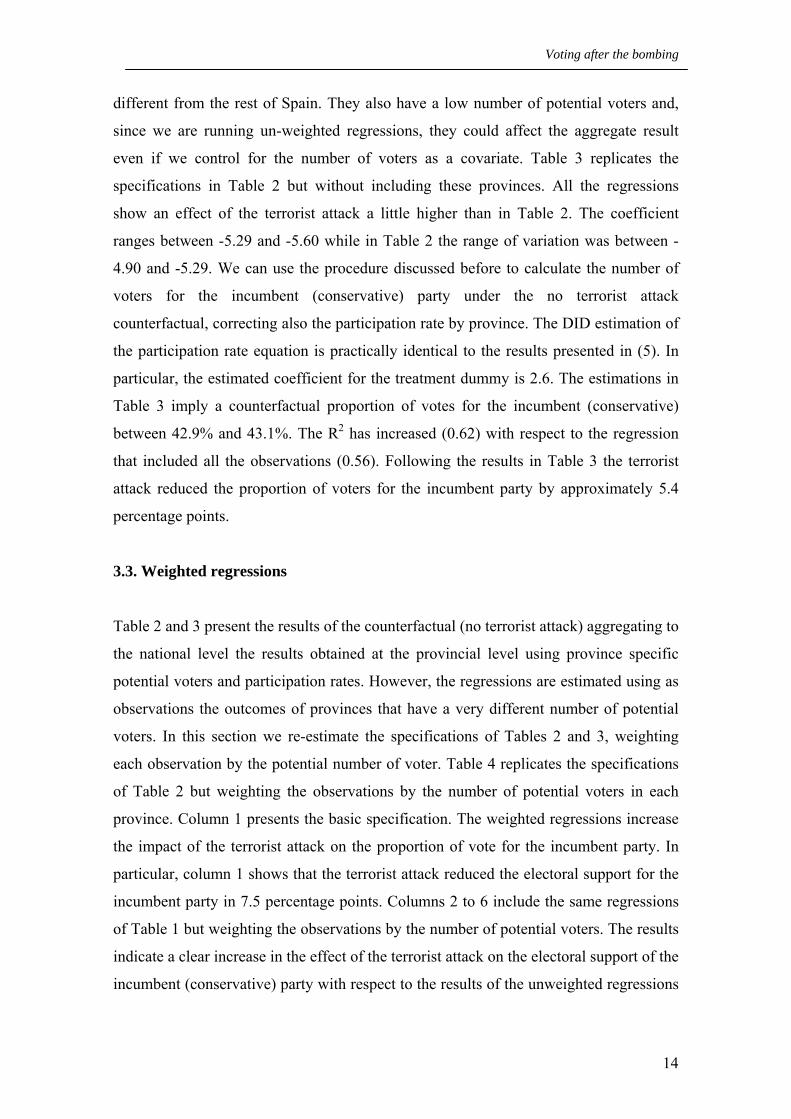
higher percentage of votes in the regular election (residents in Spain). Figure 3 shows
the same graphs for the case of the conservative party. In this case the figure for 2004
shows the opposite result.
[Figures 2 and 3 around here]
Therefore, we are interested in the change of the slope of the relationship between the
votes by residents and Spanish nationals abroad that happen as a consequence of the
terrorist attack. It is reasonable to think that there is unobserved heterogeneity at the
level of the provinces. Since this unobserved effect could be correlated with the random
perturbation, the pooled OLS regression will lead to biased and inconsistent estimators.
Then, we proposed the following specification for the transformation
Pit
Pitt
PPit
PPi
Pit uAVDAVTV +++= δβα
where TV is the number of votes for party P of residents, AV are the votes for party P
of Spanish nationals abroad and D is a dummy variable which take value 1 in the
election when the terrorist attack took place (2004)34. The index P represents the
political party, i represents provinces and the index t is the time indicator. This
specification implies a province specific intercept for each political party and province.
The basic assumption to identify the effect of the terrorist attack on voting is the strict
exogeneity of the regressors
0),,|( =iiP
iP
iiP AVAVDuE α
34 The results are unaffected by the inclusion of another explanatory variable which controls for the possibility of a year specific slope in 2000.
Pit
Pitt
PPitt
PPit
PPi
Pit AVDAVDAVTV εγδβα ++++= 2000
since the coefficient of the coefficient turns out to be not significantly different from 0. Results under request.
20

Voting after the bombing
where ui=(ui1,…, uiT) and AVi=(AVi1, …, AViT) corresponding to the T periods
included. In the case under consideration this assumption is likely to hold since the
terrorist attack was unexpected and the voting of the Spanish nationals abroad was cast
before the attack took place. The coefficient δ measures the change in the sensitivity of
the votes of residents with respect to the votes of Spanish nationals abroad. The basic
hypothesis is that the terrorist attack reduced the votes of the conservative party (PP)
and increased the votes of the socialist party (PSOE), which took a large part of the
increase from the communist party (IU)35. If the terrorist attack had an influence in the
results of the election then we should find that δPP (conservative party) and δIU
(communist party) are negative while δPSOE (socialist party) is positive.
Table 6: Results of the estimation of the transformation model.
Conservative (PP) Socialist (PSOE) Communist (IU) Coeff. t-stat Coeff. t-stat Coeff. t-stat β 5.68 2.81 22.47 2.34 437.08 10.37δ -3.66 -3.43 13.31 4.24 -130.57 -10.07F(2,112) 5.96 p=0.00 51.63 p=0.00 72.98 p=0.00F(51,102) 524.9 p=0.00 56.52 p=0.00 2.8 p=0.00
Table 6 presents the results of the estimation together with several specification tests.
The estimation shows that, based on the vote by Spanish nationals abroad, it is more
“expensive” each vote for the conservative party than for the socialist party. Since we
allow each party to have a different slope we can check the size of the difference. Table
6 also provides evidence that confirms the basic hypothesis: the coefficient δ is negative
and statistically significant in both, the case of the conservative party and the
communist party. By the contrary, the coefficient for the socialist party is positive and
also statistically significant. The ratio of the variance of the individual effects with
respect to the idiosyncratic variance shows that most of the variability is due to the first
(the province specific component). The test for the joint significance of the slopes
(F(2,112)) rejects the null hypothesis that both are jointly equal to 0. Finally the joint
35 We are going to use the name “communist” to refer in English to the basic ideology of Izquierda Unida (IU) although this is not totally correct. IU is a federation of parties with different ideologies. However, the fact that most of the political parties in the federation are to the left of the socialist party and the importance of the communist party in the coalition makes it reasonable to include all of them under the “communist” umbrella.
21

Voting after the bombing
test for the statistical significance of the intercepts (F(51,102)) rejects the null
hypothesis that all are jointly equal to 0.
Using the estimations in table 6 we can construct the counterfactual of what would had
happened if the terrorist attack would not have taken place. For this purpose we have to
calculate the fitted values for the total number of votes for each party in 2004 assuming
that δ=0. Table 7 shows the comparison of the actual votes in the 2004 election and the
counterfactual calculation. The results of the counterfactual show proportions similar to
the polls taken days before the terrorist attack. The conservative party would have got a
bit less than the prediction of the polls while the socialist party would have been around
the same value. Using these numbers we can conclude that the bombing reduced the
number of votes to the conservative party by 563,061 and increase the votes of the
socialist party by 1,768,979. On the other hand, the communist party lost 1,195,627
votes. The total number of votes increased by 1,113,674 voters.
Table 7. Number of voters for each political party: actual and counterfactual (Main national political parties) 2004 % Counterfactual
PP 9,763,144 37.71% 10,326,195 41.24%
PSOE 11,026,163 42.59% 9,257,184 36.97%
IU 1,324,135 4.96% 2,519,762 10.06%
Total* 25,891,299 24,777,625
* Total= total number of valid votes.
The method of estimation used in this section, as in the previous one, is transparent,
uses the exogeneity of the terrorist attack as the fundamental identification device and it
is based on voting behaviour, not opinions.
Are the statistical results of this section plausible? There are several ways of arguing
that the results in table 7 are reasonable. First, and most important, the estimated
coefficient for the interaction effect and the results of the counterfactual calculation are
basically in line with the evidence presented in section 3. Secondly, the results are also
in line with the outcomes of the study by the Spanish Center of Sociological Research
(CIS) of April 200436. This study concludes, from a large survey37, that 1 million
36 CIS (2004) Study No 2559. 37 The sample size is 5,377 individuals in the national sample. This post-electoral survey is not able to reproduce precisely the results of the actual vote. In fact, in the CIS study for each vote to the
22

Voting after the bombing
people decided to vote after the terrorist attack and 1.6 million changed their vote in
favour of the socialist party, mostly from the communist party38. These numbers are
close to the ones obtained by the estimation presented in table 7, providing additional
evidence of the plausibility of the results. Finally, the counterfactual evaluation based
no the estimators in table 7 is basically in line with the polls taken in the weeks before
the election’s day, which is an additional indication that the estimation provides
reasonable results.
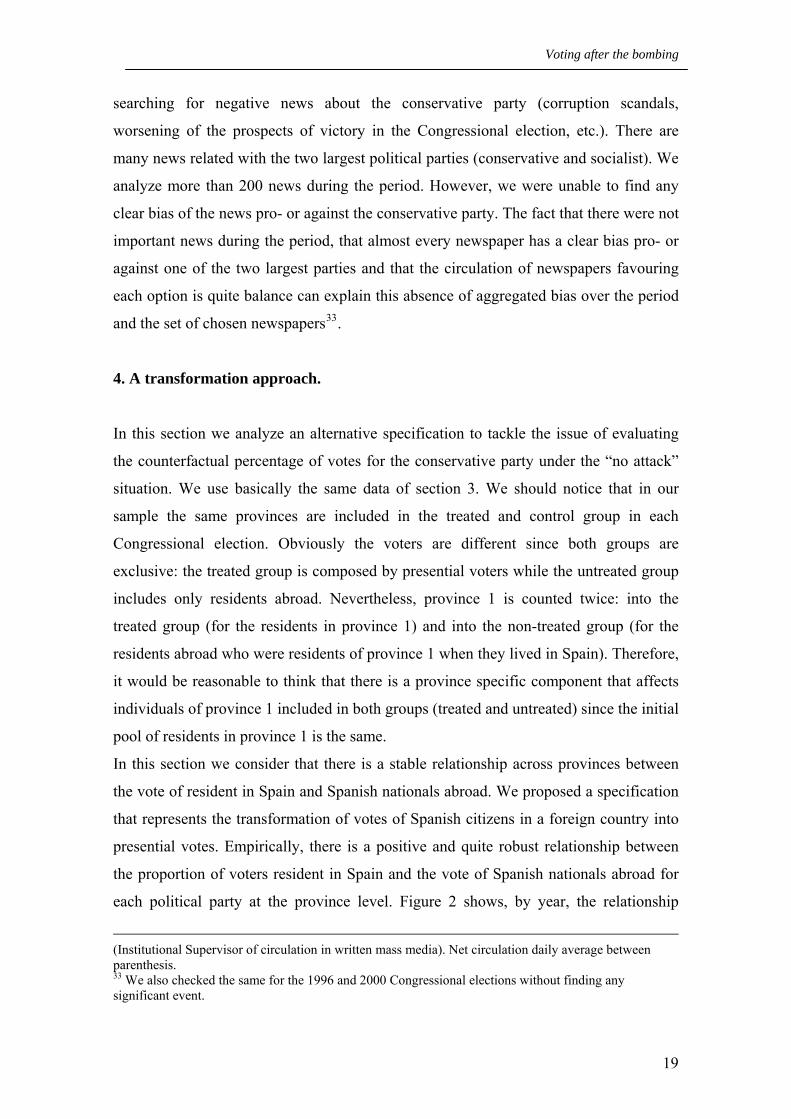
Another indication comes from the behaviour of the participation rates for the potential
resident voters and registered Spanish nationals abroad. Figure 4 shows a large increase
in the participation rate for resident voters in 2004. The increase is so large that it
almost recovered the level of the 1996 Congressional election. The participation of
Spanish nationals abroad is higher in 2004 than in 2000, but only very modestly and in
line with the increase of the general participation rate expected from the polls previous
to the terrorist attack. The results of the CIS post-electoral survey indicate that the
influence of the terrorist attack was very important to push people to cast their vote,
even though before the attack they had decided not to vote. Therefore, the predictable
and very modest increase of the participation rate of Spanish nationals abroad is another
indicator of the appropriateness of our specification. Finally, notice that the CIS survey
points out that almost all the voters that argue that the terrorist attack was the reason to
vote the party they decided to vote for, did so in favour of the socialist party (88%). The
predicted vote for the conservative and the socialist party under the counterfactual is
compatible with these changes in vote intention.
5. Conclusions.
Could terrorist attacks be timed in order to alter the result of democratic elections? This
paper answers this question by analyzing the effect of the 11M terrorist attacks in
Madrid. This choice is justified by the particular circumstances that took place in that
case, which generate the typical structure of a natural experiment.
conservative party, the socialist party has 1.64 votes while in the actual voting the ratio is 1.12. However, notice that the Demoscopia survey, used by Lago and Montero (2005), delivers a ratio of 2 and includes a smaller sample (2,929) than the CIS survey. 38 Some questions in the survey were specifically designed to measure the influence of the terrorist attack in the behaviour of voters. See also Colomer (2005).
23

Voting after the bombing
There is still a heated debate on the electoral effect of the 11M terrorist attacks in
Madrid. One week before the election, opinion polls showed a clear advantage for the
incumbent (conservative) party. After the terrorist attack, the contestant (socialist) party
won the 2004 Congressional election. Studies, using post-electoral survey data, have
tried to argue that the socialist party would have won the election even without the
terrorist attack. However, the use of post-electoral survey data guarantees the wrong
answer to the counterfactual question of what would have happened if the terrorist
attack would not had taken place.
Usually it is very difficult to evaluate properly the electoral effect of an episode like a
terrorist attack. However, in this particular case, the fact that the Spanish nationals
abroad had a deadline to vote before the bombing, generates a very special situation. We
use this macabre natural experiment to identify the electoral effect of the 11M terrorist
attack. Instead of using data on opinions from post-electoral polls, we only consider
data on actual voting decisions by voters resident in Spain and citizens abroad. The
calculations under the counterfactual of “no terrorist attack” support the forecasts of the
polls taken previous to the terrorist attack. The incumbent (conservative) party would
have won the election reaching a range between the 42% and the 45% of the voters,
while the socialist party would have obtained 37% of the votes. Under these conditions
the incumbent (conservative) party would have won the election.
24

Voting after the bombing
REFERENCES
Abadie, A. and J. Gardeazabal (2003), “The economic cost of conflict: a case of study
of the Basque Country,” American Economic Review, 93, 113-132.
Abadie, A. and J. Gardeazabal (2006), “Terrorism and the world economy,” mimeo.
Abadie, A. (2005), “Semiparametric difference-in-differences estimator,” Review of
Economic Studies, 72, 1, 1-19.
Abadie, A. (2006), “Poverty, political freedom and the roots of terrorism,” American
Economic Review: Papers and Proceedings, forthcoming.
Alesina, A., Ozler, S., Roubini, N. and P. Swagel (1996), “Political instability and
economic growth,” European Economic Review, 40 (6), 189-211.
Angrist, J. and A. Kugler (2005), “Rural windfall or a new resource curse? Coca,
income and civil conflict in Colombia,” mimeo.
Athey, S. and G. Imbens (2006), “Identification and inference in nonlinear difference-
in-difference models,” Econometrica, 74, 2, 431-497.
Ashenfelter, O. and D. Card (1985), “Using the longitudinal structure of earnings to
estimate the effects of training programs,” Review of Economics and Statistics, 648-660.
Bertrand, M., Duflo, E. and S. Mullainathan (2004), "How much should we trust
differences in differences estimates?," Quarterly Journal of Economics, 119 (1), 249-
275.
Blundell, T. and T. MaCurdy (2000), “Labor supply,” O. Ashenfelter and D. Card (eds),
Handbook of Labor Economics, 1559-1695.
Collier, P. et al (2003), Breaking the conflict trap: civil war and development policy,
Oxford University Press.
Colomer, J. M. (2005), "The general election in Spain, March 2004," Electoral Studies,
123-160.
Conley, T. and C. Taber (2004), “Inference with difference-in-differences with small
number of policy changes,” mimeo.
DellaVigna, S. and E. Kaplan (2006), The Fox News Effect: Media Bias and Voting,
NBER Working Paper No. 12169.
Donald, S. and K. Lang (2004), “Inference in difference-in-differences and other panel
data,” mimeo.
25

Voting after the bombing
Easterly, W., R. Gatti and S. Kurlat (2005), “Development, democracy and mass
killings,” forthcoming in the Journal of Economic Growth.
Heckman, J., Ichimura, H. and P. Todd (1998), “Matching as an econometric evaluation
estimator,” Review of Economic Studies, 65, 261-294.
Karol, D. and E. Miguel (2005), “Iraq war casualties and the 2004 U.S. Presidential
election,” mimeo.
Leight, A. and J. Wolfers (2006), “Competing approaches to forecasting elections:
economic models, opinion polling and prediction markets,” NBER Working Paper
12053.
Lago, I. Y J. R. Montero (2005), “The mechanics of electoral change,” Claves de la
Razón Práctica, 149, 36-44.
Lee, D. Moretti, E. and M. Butler (2004), “Do voters affect or elect policies? Evidence
from the U.S. house,” Quarterly Journal of Economics.
Mauro, P. (1995), “Corruption and growth,” Quarterly Journal of Economics, 110 (3),
681-712.
Meyer, B. (1995), “Natural and quasi-experiments in economics,” Journal of Business
and Economic Statistics, 13, 2, 151-161.
Miguel, E., Satyanath, S. and E. Sergenti (2004), “Economic shocks and civil conflict:
an instrumental variables approach,” Journal of Political Economy, 112 (4), 725-753.
Miguel, E. and G. Roland (2006), “The long run impact of the bombing of Vietnam,”
NBER Working Paper 11954.
Montalvo, J. G. and M. Reynal-Querol (2005), “Ethnic polarization, potential conflict
and civil wars,” American Economic Review, 2005, 95 (3), 796-816.
Mullainathan, S. and E. Washington (2006), “Sticking to your vote: cognitive
dissonance and voting,” NBER Working Paper 11910.
Torcal, M. y G. Rico (2004), "The Spanish general election: in the shadow of Al-
Qaeda," Southern European Society and Politics, 107-121.
Shadish, W., Cook, T. and D. Campbell (2002), Experimental and quasi-experimental
design for generalized causal inference, Boston: Houghton Mifflin Company.
Wand, J., Shotts, K., Sekhon, J., Mebane, W., Herron, M. and H. Brady (2001), “The
Butterfly did it: the aberrant vote for Buchanan in Palm Beach county, Florida,”
American Political Science Review, 95, 4, 793-810.
26

Voting after the bombing
Figures
Figure 1. Evolution of voting intention.
30
32
34
36
38
40
42
44
46
feb03 mar03 apr03 may03 jun03 jul03 aug03 sept03 oct03 nov03 dec03 jan04 feb04
Conservative
Socialist
Source: Gallup.
Figure 2. Relationship between residents and residents absent votes (socialist party)
27

Voting after the bombing
Figure 3. Relationship between residents and residents absent votes (conservative party)
Figure 4. Evolution of the participation rates: residents in Spain versus Spanish nationals abroad.
67%
69%
71%
73%
75%
77%
79%
1,996 2,000 2,004
Part
icip
atio
n ra
te a
mon
g na
tiona
ls re
side
nts
in S
pain
20%
22%
24%
26%
28%
30%
32%
34%
36%
38%
Part
icip
atio
n ra
te a
mon
g ci
tizen
s re
side
nts
abro
ad
Residents in Spain
Citizens abroad
28

Table 2. Estimation using four Congressional elections (unweighted)
All the sample(1) (2) (3) (4) (5) (6)
D04 -3.52 -4.58 -4.50 -4.53 -4.51 -4.56(-4.05) (-5.27) (-2.88) (-4.81) (-2.88) (-2.90)
D00 3.24 3.18 3.19 3.19 3.19 3.15(5.67) (5.40) (5.62) (5.54) (5.61) (5.58)
DG (treatment) -5.29 -4.90 -4.94 -4.90 -4.91 -4.91(-5.02) (-4.60) (-3.35) (-4.33) (-3.31) (-3.25)
PART(t-1) -0.70 -0.07 -0.07 -0.07 -0.07(-5.56) (-0.75) (-5.14) (-0.75) (-0.70)
PART(t-1)*G 0.00 0.00 0.00(-0.06) (-0.01) (-0.02)
ELEC(t-1) -0.25 -0.25 0.11(-1.10) (-1.03) (0.63)
ELEC(t-1)*G -0.11(-0.64)
constant 6.29 9.15 8.93 9.02 8.97 8.66(12.93) (10.07) (2.50) (10.06) (2.50) (2.37)
R2 0.52 0.56 0.56 0.56 0.56 0.56N 312 312 312 312 312 312
Counterfactual% voters incumbent 42.8% 42.5% 42.5% 42.5% 42.5% 42.4%The t-statistic is presented between parenthesis. The standard deviation is calculated usinga robust HAC estimator. Dependent variable is the change in the proportion of votes for the conservative(incumbent) party in four consecutive elections. D04 and D00 are two time dummies. PART is the participation rate. ELEC is the number of potential voters. DG is a dummy variablethat is 1 for the treatment group after the treatment period. G is equal to 1 for the treatment group.

Table 3. Estimation using four Congressional elections (unweighted) without outliers
(1) (2) (3) (4) (5) (6)D04 -3.81 -4.77 -4.34 -4.72 -4.37 -4.39
(-4.37) (-5.04) (-2.84) (-5.62) (-3.67) (-3.68)D00 3.52 3.47 3.50 3.41 3.50 3.45
(6.17) (6.09) (6.17) (6.11) (6.11) (6.00)DG (treatment) -5.60 -5.29 -5.56 -5.29 -5.52 -5.47
(-5.75) (-5.16) (-4.22) (-5.16) (-4.76) (-4.71)PART(t-1) -0.05 -0.04 -0.07 -0.04 -0.03
(-5.45) (-0.46) (-4.82) (-0.67) (-0.55)PART(t-1)*G -0.01 -0.01 -0.01
(-0.36) (-0.41) (-0.46)ELEC(t-1) 0.24 -0.22 0.13
(-0.61) (-0.53) (0.92)ELEC(t-1)*G -0.13
(-0.83)constant 6.27 8.97 7.79 8.85 7.87 7.40
(12.58) (10.04) (2.27) (9.82) (3.13) (2.89)R2 0.61 0.62 0.62 0.62 0.62 0.62N 300 300 300 300 300 300
Counterfactual% voters incumbent 43.1% 43.1% 43.1% 42.9% 43.1% 43.0%The t-statistic is presented between parenthesis. The standard deviation is calculated usinga robust HAC estimator. Dependent variable is the change in the proportion of votes for the conservative(incumbent) party in four consecutive elections. D04 and D00 are two time dummies. PART is the participation rate. ELEC is the number of potential voters. DG is a dummy variablethat is 1 for the treatment group after the treatment period. G is equal to 1 for the treatment group.

Table 4. Weighted regressions. Four congressional elections.
(1) (2) (3) (4) (5) (6)D04 -3.02 -1.42 -3.38 -1.46 -3.37 -4.26
(-2.74) (-0.70) (-1.93) (-0.75) (-1.98) (-2.33)D00 1.44 1.41 1.35 1.42 1.36 1.35
(2.06) (2.03) (1.96) (2.14) (2.07) (2.06)DG (treatment) -7.57 -8.93 -6.49 -8.80 -6.43 -5.53
(-7.35) (-5.04) (-4.24) (-5.03) (-4.21) (-3.30)PART(t-1) 0.03 0.30 0.03 0.30 0.27
(0.93) (3.26) (1.24) (3.38) (3.20)PART(t-1)*G -0.21 0.21 -0.18
(-3.89) (-3.86) (-3.60)ELEC(t-1) 0.31 -0.31 0.26
(-1.90) (-1.86) (1.46)ELEC(t-1)*G -0.28
(-1.51)constant 4.04 1.75 -2.64 1.61 -2.66 -2.74
(7.63) (0.70) (-0.82) (0.68) (-0.87) (-0.89)R2 0.79 0.79 0.80 0.8 0.81 0.81N 312 312 312 312 312 312The t-statistic is presented between parenthesis. The standard deviation is calculated usinga robust HAC estimator. Dependent variable is the change in the proportion of votes for the conservative(incumbent) party in four consecutive elections. D04 and D00 are two time dummies. PART is the participation rate. ELEC is the number of potential voters. DG is a dummy variablethat is 1 for the treatment group after the treatment period. G is equal to 1 for the treatment group.
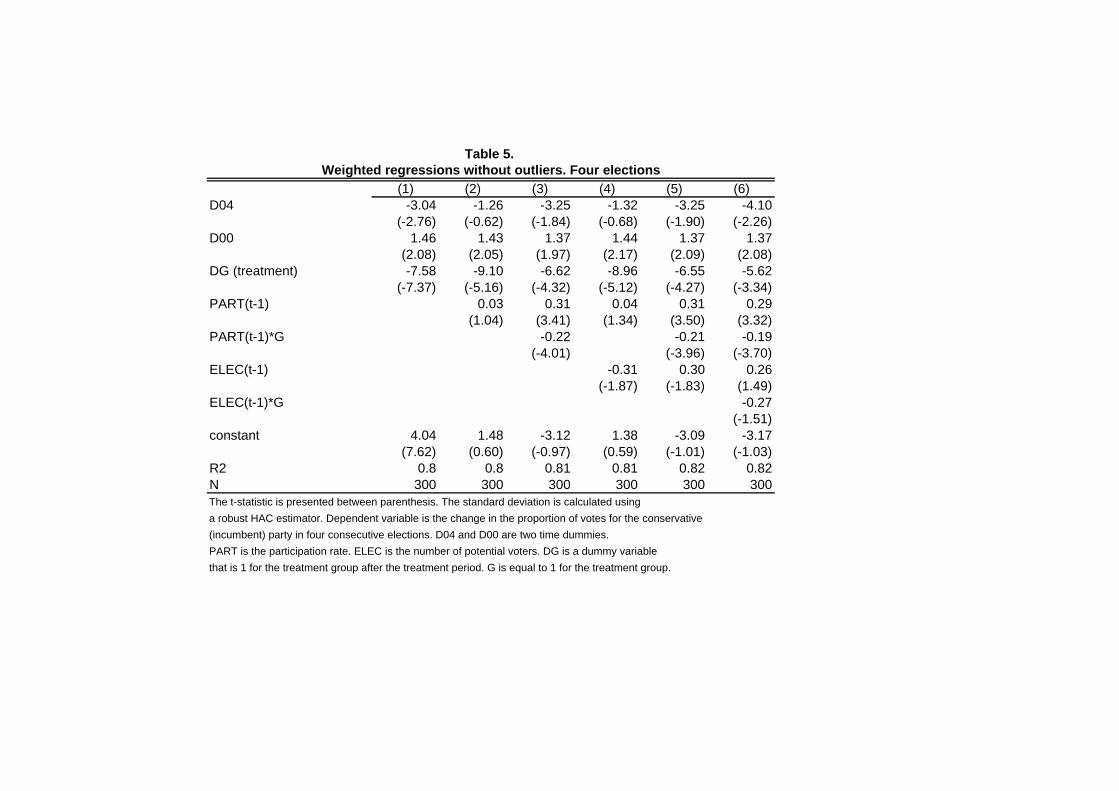
Table 5. Weighted regressions without outliers. Four elections
(1) (2) (3) (4) (5) (6)D04 -3.04 -1.26 -3.25 -1.32 -3.25 -4.10
(-2.76) (-0.62) (-1.84) (-0.68) (-1.90) (-2.26)D00 1.46 1.43 1.37 1.44 1.37 1.37
(2.08) (2.05) (1.97) (2.17) (2.09) (2.08)DG (treatment) -7.58 -9.10 -6.62 -8.96 -6.55 -5.62
(-7.37) (-5.16) (-4.32) (-5.12) (-4.27) (-3.34)PART(t-1) 0.03 0.31 0.04 0.31 0.29
(1.04) (3.41) (1.34) (3.50) (3.32)PART(t-1)*G -0.22 -0.21 -0.19
(-4.01) (-3.96) (-3.70)ELEC(t-1) -0.31 0.30 0.26
(-1.87) (-1.83) (1.49)ELEC(t-1)*G -0.27
(-1.51)constant 4.04 1.48 -3.12 1.38 -3.09 -3.17
(7.62) (0.60) (-0.97) (0.59) (-1.01) (-1.03)R2 0.8 0.8 0.81 0.81 0.82 0.82N 300 300 300 300 300 300The t-statistic is presented between parenthesis. The standard deviation is calculated usinga robust HAC estimator. Dependent variable is the change in the proportion of votes for the conservative(incumbent) party in four consecutive elections. D04 and D00 are two time dummies. PART is the participation rate. ELEC is the number of potential voters. DG is a dummy variablethat is 1 for the treatment group after the treatment period. G is equal to 1 for the treatment group.

Table 6. Weighted regressions. Three congressional elections.
All the sample Without outliers(1) (2) (3) (4) (5) (6)
D04 -4.46 -4.82 -5.09 -4.31 -4.61 -4.92(-4.16) (-1.98) (-2.21) (-4.20) (-1.91) (-2.15)
DG (treatment) -7.57 -7.26 -6.92 -7.58 -7.49 -7.12(-7.35) (-3.34) (-3.39) (-7.36) (-3.48) (-3.51)
PART(t-1) -0.006 0.00 0.00 0.02(-0.16) (-0.03) (-0.05) (0.07)
ELEC(t-1) -0.37 -0.36(-2.99) (-2.91)
constant 5.48 6.00 6.17 5.51 5.66 5.88(11.88) (1.87) (2.96) (11.86) (1.79) (2.00)
R2 0.85 0.85 0.86 0.86 0.86 0.87N 208 208 208 200 200 200The t-statistic is presented between parenthesis. The standard deviation is calculated usinga robust HAC estimator. Dependent variable is the change in the proportion of votes for the conservative(incumbent) party in three consecutive elections. D04 is a time time dummy. PART is the participation rate. ELEC is the number of potential voters. DG is a dummy variablethat is 1 for the treatment group after the treatment period.