Concrete, microstructure, properties and materials - Metha e Monteiro
Upload
doankhuongCategory
view
213download
0
An Artificial Neural Networks Model for Predicting PermeabilityProperties of Nano Silica–Rice Husk Ash Ternary Blended Concrete
Alireza Najigivi1),*, Alireza Khaloo2), Azam Iraji zad1), and Suraya Abdul Rashid3)
(Received November 20, 2012, Accepted March 21, 2013)
Abstract: In this study, a two-layer feed-forward neural network was constructed and applied to determine a mapping associating
mix design and testing factors of cement–nano silica (NS)–rice husk ash ternary blended concrete samples with their performance
in conductance to the water absorption properties. To generate data for the neural network model (NNM), a total of 174 field cores
from 58 different mixes at three ages were tested in the laboratory for each of percentage, velocity and coefficient of water
absorption and mix volumetric properties. The significant factors (six items) that affect the permeability properties of ternary
blended concrete were identified by experimental studies which were: (1) percentage of cement; (2) content of rice husk ash; (3)
percentage of 15 nm of SiO2 particles; (4) content of NS particles with average size of 80 nm; (5) effect of curing medium and (6)
curing time. The mentioned significant factors were then used to define the domain of a neural network which was trained based on
the Levenberg–Marquardt back propagation algorithm using Matlab software. Excellent agreement was observed between sim-
ulation and laboratory data. It is believed that the novel developed NNM with three outputs will be a useful tool in the study of the
permeability properties of ternary blended concrete and its maintenance.
Keywords: artificial neural networks, permeability, nano silica, rice husk ash, ternary blended concrete.
1. Introduction
Concrete is a man-made material produced by the propermixing of cement, coarse aggregate, fine aggregate plus anadequate and controlled amount of water. It is the mostconsumed worldwide material after water due to its exten-sive usage in most of structural applications. The rapidgrowth of construction and buildings in developing countriesin addition of vast formation of waste byproducts playinghigh role to concrete makers in creating sustainable product(Jamil et al. 2009). Therefore, utilization of mineral or arti-ficial waste materials in concrete can give an efficientsolution to disposal difficulty, sustainable development andmoderating the cost of concrete structures.Experience has revealed that by controlling some factors
of the fresh concrete, such as the amount of cement, thewater/cement ratios, dosage of admixtures in particular
limits the long-term properties of the cement based concretecan be improved. On the other hand, concrete mix designinvolves complex issues, and the accurate ways of per-forming its design can be achieved with expert informationand experience (Yeh et al. 1993).It is worth mentioning that the permeability of cement
based concrete plays an important role in the performanceand service life of concrete constructions. A highly perme-able concrete helps to place excessive water inside it (Bahiaand Benson 2001). Concrete resembles a ‘‘hard sponge’’ thatabsorbs liquids like water and other aggressive substances.The strength of concrete is reduced by the influence of suchsubstances. Therefore it is essential to produce concrete withmaximum impermeability to damaging liquids.Despite of the three basic ingredients which are cement,
aggregates and water in conventional concrete, active min-eral additives like fly ash (FA), blast furnace slag (BFS), ricehusk ash (RHA) and nano silica (NS) particles have beenincorporated to make high-strength and durable (low per-meable) concrete (Neville 1995; Metha and Artcin 1990;Alves et al. 2004). In addition, maintaining a low water tobinder ratio with adequate workability makes the designprocess more complicated (Parichatprecha and Nimityong-skul 2009).Conventionally, expert civil engineers could make HPC
mix designs by using empirical results from earlier researchplus their experience to obtain the required performance(Zain et al. 2005). However, existing results were often oflimited value because some types of components and someproperties have not been considered. Currently, concrete can
1)Institute for Nanoscience & Nanotechnology (INST),
Sharif University of Technology, Tehran, Iran.
*Corresponding Author; E-mail: [email protected])Center of Excellence in Structure & Earthquake
Engineering, Sharif University of Technology, Tehran,
Iran.3)Department of Chemical and Environmental
Engineering, Faculty of Engineering, Universiti Putra
Malaysia, Selangor, Malaysia.
Copyright � The Author(s) 2013. This article is published
with open access at Springerlink.com
International Journal of Concrete Structures and MaterialsVol.7, No.3, pp.225–238, September 2013DOI 10.1007/s40069-013-0038-zISSN 1976-0485 / eISSN 2234-1315
225
be made with about 10 diverse components. The quantity ofproperties to be adjusted has also enlarged, so experimentalmethods are no longer adequate in concrete mix design (Yeh1999). Unfortunately, standard and easy-to-use equations donot yet exist in design codes for accurately predicting theproperties of HPC. Furthermore, with the abovementionedmodels, the assessment of the effect of each factor on theproperties of concrete is approximately impossible (Akkurtet al. 2003; Oztas et al. 2006; Pala and Ozbay 2007; Caijun2004; Zhao et al. 1998; Sirivivatnanon and Cao 1998;Chindaprasirt et al. 2007).Currently, there has been a growing interest in a class of
computing programs which known as artificial neural net-works (ANNs) that function in a manner analogous to bio-logical nervous systems. The neural network modeling(NNM) approach is very accurate and more direct than otherconventional statistical methods, especially when modelingnonlinear multivariate interrelationships (Sobhani et al.2010; Hagan et al. 1996; Rumellhert et al. 1986). Veryrecently, many researchers have used neural networksmodels for predicting various properties of concrete. Theprincipal property of ANN in solving civil engineeringproblems are their learning ability directly from experiments.The other significant properties of ANN are their accurate ornearly accurate response to incomplete tasks, their with-drawal of information from noisy or poor data, and theircreation of generalized results from the novel cases. Theaforementioned potentials make ANN a very powerful toolfor solving many civil engineering problems which dealswith complex or an insufficient data (Ince 2004; Topcu andSarıdemir 2008; Topcu and Sarıdemir 2007, 2008; Pala andOzbay 2007; Adhikary and Mutsuyoshi 2006).The aim of this work is to create an ANN model to predict
the influences of mix proportion parameters on the resistanceof water absorption of ternary blended concrete incorporat-ing NS and RHAwhich was has not been investigated to thepresent. To this end, data for developing the NNM werecollected from our previous trials. The model was trainedwith 140 data of experimental results and then rests wereused as only experimental input values for testing and ver-ifying and values near to the experimental results wereobtained.
2. Experimental Map
2.1 Materials and Mixtures2.1.1 CementOrdinary Portland cement (OPC) obtained from Holcim
Cement Manufacturing Company of Malaysia conforming toASTM C150 standard was received and used. The chemicaland physical properties of the cement are shown in Table 1.
2.1.2 Rice Husk AshThe RHA was produced by controlled incineration by a
local supplier. The as-received ash was sieved and the par-ticles passing the finesses of 33 lm were grinded using LosAngeles mill for 180 min respectively which yielded RHA
samples having average particle size of 5 lm (Naji Giviet al. 2010). The chemical composition and physical prop-erties of RHA are given in Table 1. Also the particle sizedistribution curves of OPC and RHA with average particlesize of 5 lm are shown in Fig. 1.
2.1.3 SiO2 NanoparticlesTwo different SiO2 nano-particles with average diameters
of 15 and 80 nm obtained from Nanostructured & Amor-phous Materials, Inc. of USA were received and used. Theproperties of the utilized nano-particles are presented inTable 2.
2.1.4 AggregatesLocally available natural sand with particles smaller than
0.5 mm, fineness modulus of 2.25 and specific gravity of2.58 g/cm3 was used as fine aggregate. Crushed basalt storedin the laboratory with maximum size of 15 mm and specificgravity of 2.96 g/cm3 was used as coarse aggregate.
2.1.5 Mixture ProportioningA total of five series of mixtures were prepared in the
laboratory trials. C01 and C02 series mixtures were preparedas control specimens and cured in water and saturated limewater, respectively. The control mixtures were made ofnatural aggregates, cement and water. U (W and LW) seriesconcrete were made by partial replacement of cement withRHA average particle size of 5 lm and cured in water andsaturated lime water, respectively. Finally CN–RHA andFN–RHA series were prepared by different amounts of 5 lmRHA incorporating with 80 and 15 nm of SiO2 particles,respectively. The curing medium (CM) for these series wassaturate lime water.The water to binder ratio for all mixtures was set at 0.40.
The aggregates for the mixtures consisted of a combinationof crushed basalt and fine sand, with 30 wt.% of sand. Thebinder content of all mixtures was 450 kg/m3. The propor-tions of the mixtures are presented in Table 3.
2.2 Preparation of Test SpecimensThe mentioned mixtures were mixed in dry condition for
2 min followed by another 3 min after adding the water.Cubes of 100 mm edge were casted and compacted in twolayers on a vibrating table, where each layer was vibrated for10 s. The moulds were covered with polyethylene sheets andmoistened for 24 h. Then the specimens were demouldedand cured in water or saturated limewater at a temperature of20 �C prior to test days. The percentage, velocity andcoefficient of water absorption test of the concrete sampleswere determined at 7, 28 and 90 days. The reported resultsare the average of three trials.
2.3 Percentage of Water Absorption of NanoSilica–RHA Particles Blended ConcretePercentage of water absorption is an evaluation of the pore
volume or porosity of concrete after hardening, which isoccupied by water in saturated state. Water absorption valuesof NS–RHA particles blended concrete samples were
226 | International Journal of Concrete Structures and Materials (Vol.7, No.3, September 2013)

measured as per ASTM C 642 at 7, 28 and 90 days ofmoisture curing.
2.4 Velocity of Water Absorption of NS–RHAParticles Blended ConcreteSpeed of water absorption is a measure of the capillary
forces exerted by the pore structure causing fluids to bedrawn into the body of the material (Martys and Ferraris1997). In this experiment, the speed of water absorption byconcrete cubes were considered by measuring the increase inthe mass of samples due to water absorption at certain timeswhen only one surface of the specimen is exposed to water.Concrete samples were dried in an oven at 50 �C for threedays and then cooled in a sealed container at 23 �C forfifteen days as per ASTM C1585 at 7, 28 and 90 days ofmoist curing (Ransinchung et al. 2009). The sides of theconcrete samples were covered with epoxy resin in order toallow the flow of water in one direction. The end of thesamples were sealed with tightly attached plastic sheet andprotected in position by an elastic band. The initial mass ofthe samples were taken after which they were kept partlyimmersed to a depth of 5 mm in water as shown in Fig. 2.
The readings were started with the initial mass of thesample at selected times after first contact with water (typi-cally 1, 5, 10, 20, 30, 60, 110 and 120 min) (Ganesan et al.2008), the samples were removed, excess water was blottedoff using paper towel and then weighed. Then they werereplaced again in water for the chosen time period. The gainin mass (Dm, kg/s1/2) at time t (s), exposed area of thespecimen (a, m2), and density of water (d, kg/m3), were usedto obtain the rate of water absorption (I, m/s1/2) as per theequation (Ransinchung et al. 2009):
I ¼ Dma� dð Þ : ð1Þ
2.5 Coefficient of Water AbsorptionCoefficient of water absorption is considered as a measure
of permeability of water (Powers 1968). This was measuredby determining the rate of water uptake by dry concrete in aperiod of 1 h (Ganesan et al. 2008). The concrete sampleswere dried at 110 �C in an oven for one week until theyreached to constant weight and then were cooled in a sealedcontainer for 1 day. The sides of the samples were coveredwith epoxy resin, and were placed partly immersed in waterto a depth of 5 mm at one end, and at the other end a tightlyattached plastic was secured in position by an elastic band asshown in Fig. 2 (Ransinchung et al. 2009). The amount ofwater absorbed during the first 60 min was calculated forconcrete samples after 7, 28 and 90 days of moisture curingusing the formula (Ganesan et al. 2008):
Ka ¼ Q
A
� �2
:1
t; ð2Þ
where Ka is the coefficient of water absorption (m2/s), Q isthe quantity of water absorbed (m3) by the dried samples in3,600 s and A is the surface area (m2) of concrete samplesthrough which water penetrates.
Table 1 Chemical and physical properties of Portland cement and RHA (wt.%).
Chemical properties
Material SiO2 Al2O3 Fe2O3 CaO MgO SO3 Na2O K2O Loss onignition
Cement 21.89 5.3 3.34 53.27 6.45 3.67 0.18 0.98 3.21
RHA 87.86 0.68 0.93 1.30 0.35 – 0.12 2.37 –
Physical properties
Material Specific gravity (g/cm3) Specific surface(BET) (m2/g)
Specific surface(Blain) (m2/kg)
Cement 1.7 – 314
RHA U series – 36.47 –
RHA rice husk ash, U series ultra fine RHA blended concrete.
0
20
40
60
80
100
120
0 50 100 150 200
Per
cent
age
fine
r th
an
Particle size (µm)
5 µm RHA
cement
Fig. 1 The particle size distribution curves of OPC and RHA.
Table 2 The properties of NS.
Diameter (nm) Surface volume ratio (m2/g) Density (g/cm3) Purity (%)
15 ± 3 160 ± 12 \0.14 [99.9
80 ± 5 560 ± 32 \0.14 [99.9
International Journal of Concrete Structures and Materials (Vol.7, No.3, September 2013) | 227

Table 3 The proportions of the mixtures.
Sample number Sample designations Cement (kg/m3) RHAa (kg/m3) 15 nm nanoparticle(kg/m3)
80 nm nano particle(kg/m3)
1,2 C0a1,2 450 0 0 0
3,4 Ub1 427.5 22.5 0 0
5,6 U2 405 45 0 0
7,8 U3 382.5 67.5 0 0
9,10 U4 360 90 0 0
11,12 FN1c 447.75 0 2.25 0
13,14 FN2 445.5 0 4.5 0
15,16 FN3 443.25 0 6.75 0
17,18 FN4 441 0 9 0
19,20 CN1d 447.75 0 0 2.25
21,22 CN2 445.5 0 0 4.5
23,24 CN3 443.25 0 0 6.75
25,26 CN4 441 0 0 9
27 FN1–RHAe5 425.25 22.5 2.25 0
28 FN2–RHA5 423 22.5 4.5 0
29 FN3–RHA5 420.75 22.5 6.75 0
30 FN4–RHA5 418.5 22.5 9 0
31 FN1–RHA10 402.75 45 2.25 0
32 FN2–RHA10 400.5 45 4.5 0
33 FN3–RHA10 398.25 45 6.75 0
34 FN4–RHA10 396 45 9 0
35 FN1–RHA15 380.25 67.5 2.25 0
36 FN2–RHA15 378 67.5 4.5 0
37 FN3–RHA15 375.75 67.5 6.75 0
38 FN4–RHA15 373.5 67.5 9 0
39 FN1–RHA20 357.75 90 2.25 0
40 FN2–RHA20 355.5 90 4.5 0
41 FN3–RHA20 353.25 90 6.75 0
42 FN4–RHA20 351 90 9 0
43 CN1–RHAf5 425.25 22.5 0 2.25
44 CN2–RHA5 423 22.5 0 4.5
45 CN3–RHA5 420.75 22.5 0 6.75
46 CN4–RHA5 418.5 22.5 0 9
47 CN1–RHA10 402.75 45 0 2.25
48 CN2–RHA10 400.5 45 0 4.5
49 CN3–RHA10 398.25 45 0 6.75
50 CN4–RHA10 396 45 0 9
51 CN1–RHA15 380.25 67.5 0 2.25
52 CN2–RHA15 378 67.5 0 4.5
228 | International Journal of Concrete Structures and Materials (Vol.7, No.3, September 2013)

For development of an ANN model, a total of 38 differentC0, U, FN–RHA and CN–RHAwere selected. Each of thesemixes differs by material contents and CM from one another.Then, a total of 342 cubic samples were collected.
3. Experimental Results and Discussion
3.1 Percentage of Water AbsorptionThe results of saturated water absorption at 7, 28 and
90 days of moist curing are shown in Table 4 for C01,C02, U, CN–RHA and FN–RHA series concrete, respec-tively. The percentage of water absorption of concretesamples immersed in water or saturated lime water wasdecreased with increasing the age of moist curing from 7to 90 days for all five series during the hardening processof the concrete. By comparison the percentage of waterabsorption in FN series concrete and U series concrete,one could observe that the water permeability in FN seriesonly at 28 days of curing is lower than that of U seriesconcrete. This is due to the differences between the natureof the NS and RHA particles. SiO2 nanoparticles whichwere finely dispersed in the cement paste formed morenucleation sites with much higher specific surface resultedin rapid formation of C–S–H gel. Since formation of C–S–H gel requires water to complete the reaction, the
percentage of water absorption in FN series concrete wasmore than those of U series. After 28 days of curing,since formation of C–S–H gel was accelerated in U seriesin presence of RHA, the percentage of water absorption inU series was more than that of FN series. Finally at90 days of curing, more C–S–H gel was formed in pres-ence of RHA thus the percentage of water absorption in Useries (up to 10 wt.% replacement of concrete by RHA)was more than those of FN series. Since curing in waterresults in finishing Ca(OH)2 (Naji Givi et al. 2010a; b)and no more C–S–H gel was formed, the increase inwater absorption which is related to the increase in theamount of RHA could be resulted from the reducedamount of OPC.By comparison the percentage of water absorption of FN–
RHA series concrete (Table 4) with those of U and FNseries, it is seen that the percentage of water absorption inFN–RHA series concrete after 7 and 28 days of curing ismore than those of the other series (U and FN series). Thismay due to the sequence of C–S–H gel formation which wasaccelerated at 7 days as a result of SiO2 nanoparticlesreaction and at 28 days because of RHA particles reaction.After 90 days of curing, the percentage of water absorptionof ternary blended concrete was considerably lower thanthose of U and FN series. That was due to more C–S–H gelformation which blocks water diffusion paths and filling ofmicro- and nano-voids.Similarly, by comparison the percentage of water absorp-
tion of CN–RHA series concrete (Table 4) with those of Uand CN series, it was seen that the percentage of waterabsorption in CN–RHA series was more than those of U andCN series. This condition after 90 days of curing wasinverse and similar to FN–RHA series; the percentage ofwater absorption was much lower than those of U and CNseries. Also, this value for CN–RHA series was better thanFN–RHA series as a result of more C–S–H gel formation at90 days of moist curing.
Plastic sheet
100mm Covered sides by epoxy resin
50 mm
5mm
Concrete Sample
Fig. 2 Velocity and coefficient of water absorption testprocedure.
Table 3 continued
Sample number Sample designations Cement (kg/m3) RHAa (kg/m3) 15 nm nanoparticle(kg/m3)
80 nm nano particle(kg/m3)
53 CN3–RHA15 375.75 67.5 0 6.75
54 CN4–RHA15 373.5 67.5 0 9
55 CN1–RHA20 357.75 90 0 2.25
56 CN2–RHA20 355.5 90 0 4.5
57 CN3–RHA20 353.25 90 0 6.75
58 CN4–RHA20 351 90 0 9
a Control concrete.b Concrete samples containing 5 lm RHA particles.c Concrete samples containing 15 nm SiO2 particles.d Concrete samples containing 80 nm SiO2 particles.e Concrete samples containing 15 nm SiO2 particles together with 5 lm RHA particles.f Concrete samples containing 80 nm SiO2 particles together with 5 lm RHA particles.
International Journal of Concrete Structures and Materials (Vol.7, No.3, September 2013) | 229

Table 4 Experimental results of percentage, velocity and coefficient of water absorption.
Samplenumber
Sampledesignations
Percentage of water absorption (%) Velocity of water absorption (m/s1/2) Coefficient of water absorption (m2/s)
7 28 90 7 28 90 7 28 90
1 C01a 7.47 5.60 4.80 13.22 12.34 10.14 9.02 2.86 1.35
2 C02 8.32 5.71 4.92 13.26 12.56 10.18 9.06 2.98 1.40
3 U1b (W) 6.90 5.22 3.98 12.64 11.38 6.89 8.56 2.47 1.03
4 U1b (LW) 6.94 5.54 3.84 12.65 11.41 6.85 8.61 2.49 1.02
5 U2 (W) 6.67 5.11 3.51 10.72 8.64 5.14 7.30 1.97 0.89
6 U2 (LW) 6.73 5.42 3.36 10.80 8.67 5.09 7.33 2.00 0.88
7 U3 (W) 6.94 5.28 4.01 12.60 11.70 8.32 8.67 2.55 1.12
8 U3 (LW) 6.54 5.33 3.14 10.78 8.66 5.05 7.29 1.97 0.85
9 U4 (W) 7.10 5.41 4.14 12.86 11.73 9.16 8.83 2.57 1.20
10 U4 (LW) 6.32 5.19 3.02 10.69 8.62 4.99 7.26 1.96 0.84
11 FNc 1 (W) 7.15 4.82 4.12 12.83 7.51 7.09 7.82 1.53 1.30
12 FNc 1 (LW) 7.20 4.71 4.00 12.85 7.53 7.00 7.85 1.52 1.28
13 FN2 (W) 7.23 4.73 4.01 12.95 7.25 6.78 7.96 1.48 1.18
14 FN2 (LW) 7.28 4.56 3.86 13.00 7.23 6.67 7.98 1.46 1.12
15 FN3 (W) 7.31 4.60 3.92 13.07 6.99 6.52 8.15 1.44 1.07
16 FN3 (LW) 7.42 4.39 3.71 13.10 6.95 6.48 8.20 1.40 1.04
17 FN4 (W) 7.42 4.41 3.78 13.18 6.73 6.35 8.32 1.39 0.95
18 FN4 (LW) 7.56 4.22 3.54 13.21 6.69 6.31 8.37 1.36 0.92
19 CNd 1 (W) 7.02 5.00 4.05 12.67 8.01 6.81 7.69 1.56 1.25
20 CNd 1 (LW) 7.10 5.02 3.91 12.73 8.07 6.78 7.74 1.59 1.23
21 CN2 (W) 7.10 5.08 3.94 12.82 8.23 6.65 7.83 1.67 1.13
22 CN2 (LW) 7.16 5.12 3.80 12.87 8.27 6.63 7.85 1.69 1.09
23 CN3 (W) 7.21 5.17 3.87 12.91 8.42 6.42 7.99 1.79 1.01
24 CN3 (LW) 7.23 5.23 3.68 12.94 8.47 6.36 8.03 1.82 0.98
25 CN4 (W) 7.29 5.32 3.71 13.06 8.61 6.21 8.18 1.88 0.88
26 CN4 (LW) 7.34 5.35 3.51 13.09 8.65 6.18 8.21 1.89 0.85
27 FN1–RHAe5 7.22 5.00 3.32 13.48 7.93 4.71 9.18 1.49 0.83
28 FN2–RHA5 7.29 5.02 2.96 13.68 8.03 4.57 9.27 1.53 0.80
29 FN3–RHA5 7.46 5.07 2.71 13.86 8.08 4.46 9.34 1.58 0.72
30 FN4–RHA5 7.61 5.12 2.54 13.90 8.15 4.34 9.58 1.64 0.67
31 FN1–RHA10 7.24 5.03 3.30 13.50 7.96 4.69 9.21 1.56 0.81
32 FN2–RHA10 7.32 5.07 2.90 13.72 8.09 4.54 9.32 1.59 0.74
33 FN3–RHA10 7.51 5.13 2.62 13.95 8.16 4.38 9.43 1.65 0.63
34 FN4–RHA10 7.64 5.21 2.49 14.15 8.27 4.22 9.71 1.73 0.51
35 FN1–RHA15 7.43 5.14 3.11 13.71 8.11 4.51 9.38 1.59 0.69
36 FN2–RHA15 7.61 5.19 2.81 13.98 8.23 4.46 9.54 1.62 0.61
37 FN3–RHA15 7.82 5.25 2.50 14.18 8.34 4.28 9.68 1.69 0.54
38 FN4–RHA15 7.91 5.39 2.38 14.37 8.41 4.12 9.87 1.74 0.48
39 FN1–RHA20 7.62 5.19 2.99 13.86 8.21 4.38 9.49 1.61 0.63
40 FN2–RHA20 7.81 5.23 2.71 14.05 8.36 4.26 9.68 1.72 0.58
41 FN3–RHA20 7.95 5.42 2.42 14.26 8.44 4.11 9.79 1.79 0.50
230 | International Journal of Concrete Structures and Materials (Vol.7, No.3, September 2013)
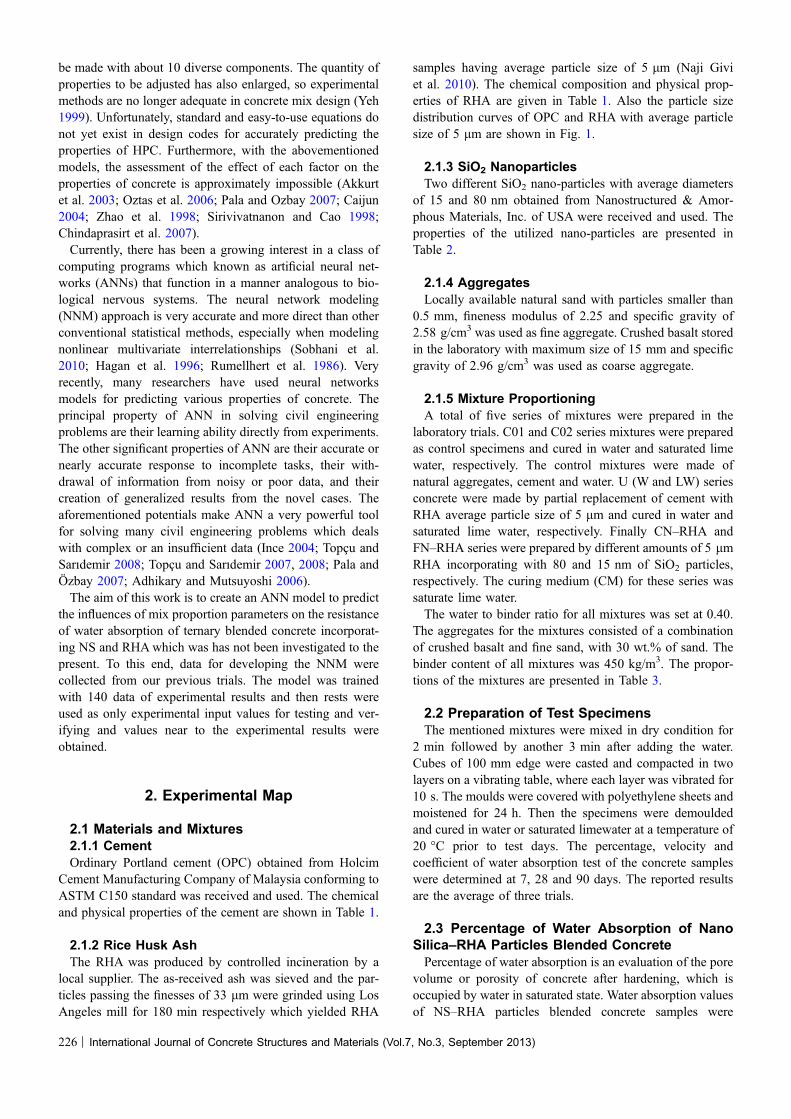
3.2 Velocity of Water AbsorptionThe velocity of water absorption of CN–RHA and FN–
RHA series concrete are listed in Table 4. The velocity of
water absorption also obeys the percentage of waterabsorption and in both FN–RHA and CN–RHA series wasbetter than those of U, FN and CN series. Since more C–S–
Table 4 continued
Samplenumber
Sampledesignations
Percentage of water absorption (%) Velocity of water absorption (m/s1/2) Coefficient of water absorption (m2/s)
7 28 90 7 28 90 7 28 90
42 FN4–RHA20 8.01 5.51 2.21 14.51 8.56 4.01 9.96 1.91 0.43
43 CN1–RHAf5 7.07 5.03 3.12 12.88 8.26 4.26 8.83 1.69 0.77
44 CN2–RHA5 7.16 5.08 2.80 12.92 8.31 4.01 8.92 1.72 0.71
45 CN3–RHA5 7.20 5.19 2.57 13.04 8.42 3.89 8.99 1.78 0.69
46 CN4–RHA5 7.28 5.23 2.46 13.21 8.58 3.72 9.11 1.84 0.60
47 CN1–RHA10
7.10 5.05 3.00 12.91 8.32 4.12 8.91 1.73 0.70
48 CN2–RHA10
7.19 5.14 2.61 13.08 8.45 3.89 9.05 1.82 0.65
49 CN3–RHA10
7.29 5.26 2.42 13.24 8.59 3.76 9.17 1.91 0.61
50 CN4–RHA10
7.47 5.38 2.24 13.45 8.73 3.52 9.26 2.01 0.54
51 CN1–RHA15
7.22 5.22 2.82 13.14 8.46 4.00 9.01 1.84 0.61
52 CN2–RHA15
7.31 5.34 2.61 13.29 8.61 3.72 9.15 1.96 0.53
53 CN3–RHA15
7.39 5.47 2.40 13.38 8.75 3.61 9.32 2.09 0.48
54 CN4–RHA15
7.51 5.58 2.22 13.54 8.91 3.41 9.44 2.21 0.42
55 CN1–RHA20
7.34 5.31 2.68 13.27 8.58 3.82 9.13 1.96 0.54
56 CN2–RHA20
7.45 5.49 2.50 13.42 8.73 3.61 9.32 2.11 0.46
57 CN3–RHA20
7.52 5.59 2.29 13.59 8.88 3.45 9.48 2.23 0.39
58 CN4–RHA20
7.61 5.80 2.08 13.71 9.04 3.29 9.66 2.35 0.31
a Control concrete.b Concrete samples containing 5 l RHA particles.c Concrete samples containing 15 nm SiO2 particles.d Concrete samples containing 80 nm SiO2 particles.e Concrete samples containing 15 nm SiO2 particles together with 5 l RHA particles.f Concrete samples containing 80 nm SiO2 particles together with 5 l RHA particles.
Input Hidden Layer Output Layer Output
6 3
20 3
w
b
w
b
Fig. 3 Schematic of a fully connected, two-layer feed-forward network. W and b denote weights and biases, respectively.
International Journal of Concrete Structures and Materials (Vol.7, No.3, September 2013) | 231

H gel was formed in FN–RHA and CN–RHA series, thewater diffusion paths are blocked together with filler effectsof SiO2 and RHA particles would result in reduced velocityof water absorption.It is well known that mineral admixtures with fine particles
can improve the filler effect and also the high pozzolanicaction of fine particles increases substantially the quantity ofC–S–H gel. If this phenomenon joins with low water cementratio, it can improve the microstructure in the interfacialtransition zones and thus the value of C–S–H gel, then thewater permeability can be considerably increased.All these events result in more homogeneous and stronger
interfacial transition zones and reduction of their thickness,with less potential of micro cracks and uniform particledistribution which lead to the grain refinement of hydratedcement paste in the interfacial transition zone (Monteiro andMehta 1986; Prabir et al. 2001). Hence, admixing of RHAand SiO2 nanoparticles to conventional concrete leads tophysically and chemically rearrangement and improvementof the concrete microstructures. The speed of waterabsorption is very important to predict the service life ofconcrete as a structural material and to improve its perfor-mance (Martys and Ferraris 1997). Micro filler materialswith fine particles can fill both the interfaces and the bulk
paste and develop discontinuous and tortuous pore in con-crete structure causing reduction in the rate of waterabsorption (Tasdemir 2003; Wee et al. 2000). Micro andmacro pores present in the concrete can be completely filledup by fine particles (Ganesan et al. 2008). The connectivityof pore system is characterized by the degree of water infilled voids in the concrete mix and the hydration products ofconcrete after hardening. Capillary pores are known as thosevoids which were originally filled with mixing water in therange of 3.2–3,000 nm diameter (Philleo 1986). Thesecapillary pores can become unconnected under moist curingsituation after about 3 days for concrete having w/c of 0.4(Powers et al. 1959). C–NS–RHA ternary blended concreteshows a continued decrease of pore size and its continuity byincreasing the curing time than OPC concretes.
3.3 Coefficient of Water AbsorptionThe coefficients of water absorption of NS–RHA particles
blended concrete samples for CN–RHA and FN–RHA seriesconcrete are also listed in Table 4. The obtained results aresimilar to the manner that percentage and velocity of waterabsorption obey. Thus, no more justifications are presentedhere.
4. Neural Network Modeling
4.1 Model DescriptionThe ANN trained in this study was a fully connected, two-
layer feed-forward network with sigmoid hidden neuronsand three outputs neurons. It could fit multi-dimensionalmapping problems arbitrarily well, given consistent data andenough neurons in its hidden layer as shown in Fig. 3. Theinput layer consists of 6 input nodes and the output layerconsists of 3 output nodes. Also the hidden layer has 6nodes, in each node; weighted inputs are processed by atransfer function as shown in Fig. 4 (Hornik et al. 1994).The network has been trained with Levenberg–Marquardt
Backpropagation (LMBP) algorithm. ANNs are computing
1
X2 W 1
3 W 2
3
4 W4 Outputs(y=fr(a))
5
5 W6
X
X
W
X
W
X
X 6
Inputs Weights Bias=w0 Transfer Function
Fig. 4 Schematic illustration of a neuron.
1. Initialize the weights and parameter µ (µ = 0.01 is appropriate).2. Compute the sum of the squared errors over all inputs F(w)F(w) = eTe (4)Where w = [w1, w2, …, wn] consists of all weights of the network, e is the error vector comprising the error for all the training examples.3. Solve (5) to obtain the increment of weights ΔwΔw = [JTJ + µI]-1JTe (5)Where J is the Jacobian matrix, µ is the learning rate which is to be updated using the β depending on the outcome. In particular, µ is multiplied by decay rate β (0<β<1).4. Using w+Δw as the trial w, and judge
IF trial F(w)<F(w) in step 2 THENW = w + Δwµ = µ.β (β = 0.1)
go back to step 2ELSE
µ = µ/βgo back to step 4
END IF
Fig. 5 Pseudo-code for LMBP algorithm.
232 | International Journal of Concrete Structures and Materials (Vol.7, No.3, September 2013)

systems that simulate the biological neural systems of humanbrain. Conceptually, a neural networks model consists of aset of computational units and a set of one-way data con-nection joining units or weights as shown in Fig. 4. Unitsthat receive no input from others are called input nodes,while those with no outgoing links are called output nodes.All other intermediate units are called hidden nodes.Traditionally, the learning process is used to determine
proper interconnection weights, and the network is trained tomake proper associations between the inputs and their cor-responding outputs (Yeh et al. 1993; Oztas et al. 2006, 1993;Kasperkiewicz et al. 1995). Errors that arise during thelearning process can be expressed in terms of mean squareerror (MSE) and are calculated using Eq. (3).
MSE ¼ 1
p
� ��Xj
tj� ojð Þ2 ð3Þ
In addition, the absolute fraction of variance (R2) andmean absolute percentage error (MAPE) are calculated usingEqs. (4) and (5), respectively.
R2 ¼ 1�P
j tj� ojð Þ2Pj ojð Þ2
!ð4Þ
MAPE ¼ 1
P
Xj
oj� tj
oj
�������� � 100� �
; ð5Þ
where tj is the target value of jth pattern, oj is the outputvalue of jth pattern, and p is the number of patterns.
4.2 Input FactorsThe significant factors, cement content, RHA content,
percentage of 15 nm SiO2 particles, 80 nm SiO2 particlescontent, curing media and curing time were used to describean ANN model. The model represents a mapping associatingthese six factors with the permeability properties of ternaryblended concrete. The ranges of these input factors, in a totalof 38 data sets used in this study. The trained neural networkarchitecture was applicable within this range.
4.3 Target VectorThe percentage, velocity and coefficient of water
absorption values are the target vector. The range of thepercentage, velocity and coefficient of water absorptionvalues are listed in Table 4. The domain of the ANN modelto be constructed and was trained. A data set was desig-nated to consist of data in the form of pairs of vectorscomposed of the six input factors and the associated per-centage, velocity and coefficient of water absorption astarget vectors. The total data sets (i.e., 174 data sets) foreach output were divided into three parts: 140 for training,17 for validation, and 17 for testing or prediction. Thetraining data sets were used to compute gradient andmodernizing weights and biases. The error of the validationsets was monitored during the training procedure to preventoverfitting of training data. The error of the test sets wasnot used during training, but it was used to comparemodel’s accuracy.
gure 6. A graph of a sigmoid function
5.5
0.510.5
1
5.5
Fig. 6 A graph of a sigmoid function.
Inverse Mapping
Permeability Properties
Real input data
Nor
mal
izat
ion
2
19
Curing Time
Cement
RHA
Nano-SiO2 15nm
Nano-SiO2 80nm
Curing Medium
MCT
MC
MR
M15nm
M80nm
MCM
Mapped Input Data
Inpu
t Lay
er
Hid
den
Lay
er N
orm
aliz
ed
Perm
eabi
lity
Prop
ertie
sD
ata
1
20
NNM Training (Levenberg-Marquardt backpropagation)
Fig. 7 Schematic of NNM architecture.
International Journal of Concrete Structures and Materials (Vol.7, No.3, September 2013) | 233

Table
5Summary
ofsixNNMsforperm
eability
propertiesofco
ncrete.
Nam
eNo.
ofPEsin
HLb
Trainingset
Validationset
Testing
set
All
Epochs
MSE
RMSE
RMSE
RR
NNM1
13.5103
0.95412
2.53146
0.95263
2.47188
0.97263
0.95979
224
Output
=0.94
9
target
?0.38
Output
=0.87
9
target
?0.43
Output
=0.97
9
target
?0.31
Output
=0.93
9
target
?0.37
NNM2
61.60119
0.98889
1.46301
0.98451
1.38133
0.97156
0.98165
16
Output
=0.99
9
target
?0.052
Output
=0.94
9
target
?0.18
Output
=1
9
target
?0.071
Output
=0.99
9
target
?0.05
NNM3
111.08359
0.98449
1.15492
0.97645
1.25615
0.98985
0.98359
16
Output
=0.98
9
target
?0.096
Output
=0.99
9
target
?0.21
Output
=0.98
9
target
?0.11
Output
=0.98
9
target
?0.12
NNM4
160.80060
0.98219
0.96029
0.99049
0.66266
0.97940
0.98402
15
Output
=0.99
9
target
?0.07
Output
=0.99
9
target
?0.185
Output
=1
9
target
?0.08
Output
=1
9
target
?0.049
NNM5
200.47303
0.9998
0.50148
0.99040
0.40688
0.99448
0.99303
14
Output
=1
9
target
?0.001
Output
=1
9
target
?0.32
Output
=0.94
9
target
?0.32
Output
=1
9
target
?0.04
NNM6
240.97703
0.97889
1.00621
0.96456
0.70978
0.97889
0.97411
10
Output
=97
9
target
?0.21
Output
=0.97
9
target
?0.21
Output
=0.98
9
target
?0.11
Output
=0.98
9
target
?0.21
PEprocessing
elem
ents,HLhidden
layer,NNM
neural
networkmodel.
234 | International Journal of Concrete Structures and Materials (Vol.7, No.3, September 2013)

4.4 Training StepsAs training steps which have been shown in Fig. 5, the
input layer takes an input column data contains six param-eters and passes it to the hidden layer. Then, the hidden layermaps the input column data to the transfer function witch so-called log-sigmoid and given by Eq. (6):
r tð Þ ¼ 1
1þ e�bt; ð6Þ
where b is a slope parameter. This function is called the log-sigmoid since a sigmoid can also be constructed using thehyperbolic tangent function rather than this relation, inwhich case it also can be called a tan-sigmoid. Sigmoidfunctions are also valued because of their easy calculablederivatives, which is useful for calculating the weightupdates in certain training algorithms. The relation is givenby Eq. (7):
drðtÞdt
¼ rðtÞ½1� r tð Þ� ð7Þ
In this study, it was referred to the log-sigmoid as simply‘‘sigmoid’’. The sigmoid function has the property of being
parallel to the step function, but by addition of a region ofuncertainty. To this end, sigmoid functions were very similarto the input–output interactions of biological neurons,although not exactly the same. A graph of sigmoidfunction is shown in Fig. 6. Finally, the resulting datawere mapped by the linear operation to the outputs ofpercentage, velocity and coefficient of water absorption bythe output layers.
4.5 Design AlgorithmThe numbers of hidden neurons were found out from a
sequential algorithm. At each step of training process, anew feed-forward neural was designed by adding neuronsinto the hidden layers one by one. The designed NNMwas trained using a Levenberg–Marquardt algorithm withMATLAB software’s support. LMBP is regularly thefastest existing back-propagation algorithm, and is vastlyrecommended as a first-choice supervised algorithm,although it needs more memory than other availablealgorithms. The standard LMBP training process can bedescribed in the simulated code of Fig. 5 (Martys andFerraris 1997).
1.5
3.5
5.5
7.5
1 5 913 17 21 25 29 33 37 41 45 49 53 57 61 65 69 73 77 81 85 89 93 97
101
105
109
113
Per
cent
age
of W
ater
Abs
orpt
ion
EXP.
NNM1
NNM2
NNM3
NNM4
NNM5
NNM6
0
2
4
6
8
10
1 5 913 17 21 25 29 33 37 41 45 49 53 57 61 65 69 73 77 81 85 89 93 97
101
105
109
113
Coe
ffic
ient
of
Wat
er A
bsor
ptio
n
Sample Number
2
7
12
17
22
1 611 16 21 26 31 36 41 46 51 56 61 66 71 76 81 86 91 96
101
106
111
Vel
ocity
of W
ater
Abs
orpt
ion
Fig. 8 Comparison of NNMs with experimental results.
International Journal of Concrete Structures and Materials (Vol.7, No.3, September 2013) | 235

For obtaining the main objective of this paper, threesamples of each mix design reported in Table 3 were madeand cured at different ages. Totally 522 records gatheredby 174 experiments from each percentage, velocity andcoefficient of water absorption in accordance to the ASTMC1585 and 642 standards test procedure to construct thetraining–testing database. For training (interpolation), test-ing and verification (extrapolation) of the proposed mod-els, 140 and 34 samples were randomly chosen,respectively. The structure of the input–output of themodeler systems were schematically shown in Fig. 7. Inthis figure, the input parameters are (1) CM, (2) curingtime (CT) (3) Cement (C), (4) RHA, (5) SiO2 particleswith average diameter of 15 nm (15n) and (6) SiO2 par-ticles with average diameter of 80 nm (80n) by weight perunit volume of concrete.
Matlab software and its corresponding neural networktools were used to construct and train the proposed NNMs.Table 5 summarizes the architecture of 6 proposed neuralnetworks models in companion with their correspondingvalidation and test results, means square of error (MSE),number of neurons in hidden layer and their applied epochs.To make a decision on the ending of the training proce-
dures, two termination statuses were confirmed. Status 1defines that the training of neural network was ended whenthe maximum epoch of procedure reached to 1,000 whilestatus 2 defines the training finished when minimum errornorm of network obtained. It is clear that the status 2 waspreferred termination state. In order to found out theappropriate number of neurons which used in the hiddenlayer, the number of processing elements (PEs) or neuronswas randomly selected to vary from 1 to 24. For a selected
y = 0.9986x + 0.014R² = 0.994
2
3
4
5
6
7
8
9
2 3 4 5 6 7 8 9Pred
ictiv
e R
esul
ts o
f Pe
rcen
tage
of
Wat
er A
bsor
btio
n
Experimental Results of Percentage of Water Absorbtion
y = 0.9833x + 0.1749R² = 0.9828
2.5
4.5
6.5
8.5
10.5
12.5
14.5
16.5
2.5 4.5 6.5 8.5 10.5 12.5 14.5 16.5
Pred
ictiv
e R
esul
ts o
f V
eloc
ity o
f W
ater
A
bsor
btio
n
Experimental Results of Velocity of water absorbtion
y = 0.995x + 0.0284R² = 0.9957
0
2
4
6
8
10
12
0 2 4 6 8 10 12
Pred
ictiv
e R
esul
ts o
f C
oeff
icie
nt o
f W
ater
Abs
orbt
ion
Experimental results of Coefficient of water absorbtion
Fig. 9 NNM6 predictions versus experimental results of percentage, velocity and coefficient of water absorption, respectively.
236 | International Journal of Concrete Structures and Materials (Vol.7, No.3, September 2013)

configuration, a network was trained six times, and eachtime, an MSE error and R were calculated on the train,validation and test data sets (Table 5). From Table 5, as itcan be seen, the R level of the outputs was increased step-by-step for determining the appropriate number of input nodesin the trial networks. By increasing the number of neurons inthe hidden layer up to 20, the level of R was increased innetworks 5, whereas the use of 24 nodes in the hidden layerdoes not increase the value of R in networks 6. For instanceNNM1 with one PE in its HL revealed the lowest perfor-mance with termination state of 1 (R of training and testingare 0.95412 and 0.97263, respectively). While NNM5 whichhas 20 PEs in its hidden layer was demonstrated the bestperformance (R of training and testing are 0.9998 and0.99448 respectively). It should be mentioned that NNM4with 16 PEs in its HL presented similar performance withmore epochs in contrast with NNM6.This result could be confirmed by a comparison of NNM
findings with respect to the experimental investigations asrepresented in Fig. 8. Therefore, NNM5 selected as the bestneural network for forecasting the percentage, velocity andcoefficient of water absorption. Again, X–Y plot was used toverify the accuracy of this model as shown in Fig. 9. As itcan be seen, more points were well-gathered around the bestfit line.
5. Conclusions
The experimental results show that laboratory-determinedpermeability properties of C–NS–RHA ternary blendedconcrete were correlated with mix design factors and testingparameters and there were six significant factors that affectedpermeability properties of concrete. These factors are: CM;curing time; percentage of cement; content of RHA; per-centage of 15 nm of SiO2 particles; content of NS particleswith average size of 80 nm. Totally 174 concrete mixtureswere made, cured and tested from each percentage, velocityand coefficient of water absorption of concrete samples toobtain the permeability properties records. Of these data, 140data were randomly selected as training sets and theremaining 34 data were used for validation and testing of themodel. As it can be seen by increasing the number of neu-rons in the hidden layer up to 20, the level of R wasincreased in network 5, whereas the use of 24 neurons in thehidden layer does not increase the value of R in networks 6.Therefore, ANN5 was selected as the best neural network
for predicting the permeability properties of ternary blendedconcretes. Based on the results mentioned above, it can beconcluded that the ANN model is an efficient way of pre-dicting physical properties of concrete. The present studyreaffirms that ANN methodology can be used to simulate theproblems that are not easily calculable via linear operationsand there are not enough theoretical justifications to explainthe behavior of the variables involved. Additionally, themodel can predict any desired output values, for example thevalues for concrete properties such as water permeability,based on the instructions it receives in the training stage.
Therefore, the application of the model can save tremendousamount of trial time and energy used for library trials.On the other hand, since the model was tested against the
actual data obtained from experimental results and wasfound that there is a good agreement between the predictedand actual findings, the applicability of the developed ANNmodel can be suggested to prediction of similar conditions inthe field of engineering.
Open Access
This article is distributed under the terms of the CreativeCommons Attribution License which permits any use,distribution, and reproduction in any medium, provided theoriginal author(s) and the source are credited.
References
Adhikary, B. B., & Mutsuyoshi, H. (2006). Prediction of shear
strength of steel fiber RC beams using neural networks.
Construction and Building Materials, 20(9), 801–811.
Akkurt, S., Ozdemir, S., Tayfur, G., & Akyol, B. (2003). The
use of GA-ANNs in the modeling of compressive strength
of cement mortar. Cement and Concrete Research, 33,
973–979.
Alves, M. F., Cremonini, R. A., & Dal Molin, D. C. C. (2004).
A comparison of mix proportioning methods for high-
strength concrete. Cement and Concrete Composites, 26(6),
613–621.
Bahia, H. U., Benson, C. H., & Kanitpong. K. (2001).
Hydraulic conductivity (permeability) of laboratory-com-
pacted asphalt mixtures (pp. 25–32). Transportation
Research Record 1767. Washington, D.C.: Transportation
Research Board.
Caijun, S. (2004). Effect of mixing proportions of concrete on
its electrical conductivity and the rapid chloride perme-
ability test (ASTM C1202 or AASHTO 227) results.
Cement and Concrete Research, 34, 537–545.
Chindaprasirt, P., Chotithanorm, C., Cao, H. T., & Sirivivatn-
anon, V. (2007). Influence of fly ash fineness on chloride
penetration of concrete. Construction and Building Mate-
rials, 21(2), 356–361.
Ganesan, K., Rajagopal, K., & Thangavel, K. (2008). Rice husk
ash blended cement: Assessment of optimal level of
replacement for strength and permeability properties of
concrete. Construction and Building Materials, 22(8),
1675–1683.
Hagan, M., Demuth, H., & Beale, M. (1996). Neural network
design. Boston, MA: PWS Publishing.
Hornik, K., Stinchcombe, M., White, H., & Auer, P. (1994).
Degree of approximation results for feedforward networks
approximating unknown mappings and their derivatives.
Neural Computation, 6, 1262–1275.
International Journal of Concrete Structures and Materials (Vol.7, No.3, September 2013) | 237
Ince, R. (2004). Prediction of fracture parameters of concrete by
artificial neural networks. Engineering Fracture Mechan-
ics, 71(15), 2143–2159.
Jamil, M., Zain, M. F. M., & Basri, H. B. (2009). Neural net-
work simulator model for optimization in high performance
concrete mix design. European Journal of Scientific
Research, 34(1), 61–68.
Kasperkiewicz, J., Racz, J., & Dubrawski, A. (1995). HPC
strength prediction using artificial neural networks. Journal
of Computing in Civil Engineering, 9(4), 279–284.
Martys, N. S., & Ferraris, C. F. (1997). Capillary transport in
mortars and concrete. Cement and Concrete Research,
27(5), 747–760.
Metha, P. K., & Artcin, P. C. (1990). Principles underlying the
production of high-performance concrete. Cement, Con-
crete and Aggregates, 12(2), 70–78.
Monteiro, P. J. M., & Mehta, P. K. (1986). Improvement of the
aggregate cement paste transition zone by grain refinement
of hydration product. In Proceedings of the VIIIth inter-
national congress on the chemistry of cement, Vol. 2, Rio-
de-Jeneiro, Brazil, pp. 433–437.
Naji Givi, A., Abdul Rashid, S., Aziz, F. N. A., & Salleh, M.
A. M. (2010a). Assessment of the effects of rice husk ash
particle size on strength, water permeability and work-
ability of binary blended concrete. Construction and
Building Materials, 24(11), 2145–2150.
Naji Givi, A., Abdul Rashid, S., Aziz, F. N. A., & Salleh, M.
A. M. (2010b). Experimental investigation of the size
effects of SiO2 nano-particles on the mechanical properties
of binary blended concrete. Composites: Part B. doi:
10.1016/j.compositesb.2010.08.003
Neville, A. M. (1995). Properties of concrete (4th ed.). Essex,
U.K.: Longman Group Limited.
Oztas, A., Pala, M., Ozbay, E., Kanca, E., Cagar, N., & Bhatti,
M. A. (2006). Predicting the compressive strength and
slump of high strength concrete using neural networks.
Construction and Building Materials, 21(2), 384–394.
Pala, M., Ozbay, E., Oztas, A., & Yuce, M. I. (2007a). Appraisal
of long term effects of fly ash and silica fume on com-
pressive strength of concrete by neural networks. Con-
struction and Building Materials, 20(9), 769–775.
Pala, M., Ozbay, E., Oztas, A., & Yuce, M. I. (2007b).
Appraisal of long-term effects of fly ash and silica fume on
compressive strength of concrete by neural networks.
Construction and Building Materials, 21(2), 384–394.
Parichatprecha, R., & Nimityongskul, P. (2009). Analysis of
durability of high performance concrete using artificial
neural networks. Construction and Building Materials, 23,
910–917.
Philleo, R. E. (1986). Freezing and thawing resistance of high-
strength concrete. CNHRP Synthesis of Highway Practice,
129. Washington, D.C.: Transportation Research Boards.
Powers, T. C. (1968). Properties of fresh concrete. New York,
NY: Wiley.
Powers, T. C., Copeland, L. E., & Mann, H. M. (1959). Cap-
illary continuity or discontinuity in cement paste. Journal
of the PCA Research and Development Laboratories, 1(2),
38–48.
Prabir, B. C. (2001). High performance concrete: mechanism
and application. ICI Journal, 2(1), 15–38.
Ransinchung, G. D., Kumar, B., & Kumar, V. (2009). Assess-
ment of water absorption and chloride ion penetration of
pavement quality concrete admixed with wollastonite and
microsilica. Construction and Building Materials, 23(2),
1168–1177.
Rumellhert, D., Hinto, G., & Williams, R. (1986). Learning
internal representations by error propagation. Cambridge,
MA: MIT Press.
Sirivivatnanon, V., & Cao, H. T. (1998). Binder dependency of
durability properties of HPC. In Canadian international
symposium of HPC and reactive powder concrete, Canada,
pp. 227–240.
Sobhani, J., et al. (2010). Prediction of the compressive strength
of no-slump concrete: A comparative study of regression,
neural network and ANFIS models. Construction and
Building Materials, 24(5), 709–718.
Tasdemir, C. (2003). Combined effects of mineral admixtures
and curing conditions on the sorptivity coefficients of
concrete. Cement and Concrete Research, 33, 1637–1642.
Topcu, I. B., & Sarıdemir, M. (2007). Prediction of properties of
waste AAC aggregate concrete using artificial neural net-
work. Computational Materials Science, 41(1), 117–125.
Topcu, I. B., & Sarıdemir, M. (2008a). Prediction of rubberized
concrete properties using artificial neural network and
fuzzy logic. Construction and Building Materials, 22(4),
532–540.
Topcu, I. B., & Sarıdemir, M. (2008b). Prediction of compres-
sive strength of concrete containing fly ash using artificial
neural network and fuzzy logic. Computational Materials
Science, 41(3), 305–311.
Wee, T. H., Suryavanshi, J. A., & Tin, S. S. (2000). Evaluation
of rapid chloride permeability test (RCPT) results for
concrete containing mineral admixtures. ACI Materials
Journal, 97(2), 221–232.
Yeh, I. C. (1999). Design of high-performance concrete mixture
using neural networks and nonlinear programming. Journal
of Computing in Civil Engineering, 13(1), 36–42.
Yeh, Y. C., Kuo, Y. H., & Hsu, D. H. (1993). Building KBES
for diagnostic PC Pile with ANN. Journal of Computing in
Civil Engineering, 7, 71–93.
Zain, M. F. M., Islam, M. N., & Basri, I. H. (2005). An expert
system for mix design of high performance concrete.
Advances in Engineering Software, 36, 325–377.
Zhao, T. J., Zhou, Z. H., Zhu, J. Q., & Feng, N. Q. (1998). An
alternating test method for concrete permeability. Cement
and Concrete Research, 28, 7–12.
238 | International Journal of Concrete Structures and Materials (Vol.7, No.3, September 2013)