
VoIP Competitive Intelligence Survey -Understanding Voice Quality from an end users perspective...
36
-
Upload
marilyn-lawson -
Category
Documents
-
view
215 -
download
1
Transcript of VoIP Competitive Intelligence Survey -Understanding Voice Quality from an end users perspective...
VoIP Competitive Intelligence Survey-Understanding Voice
Quality from an end users perspective
Rajeev Kutty
Product Manager –Web performance
Keynote Systems Inc
3
September 10-12, 2007 • Los Angeles Convention Center • Los Angeles, California
www.ITEXPO.com
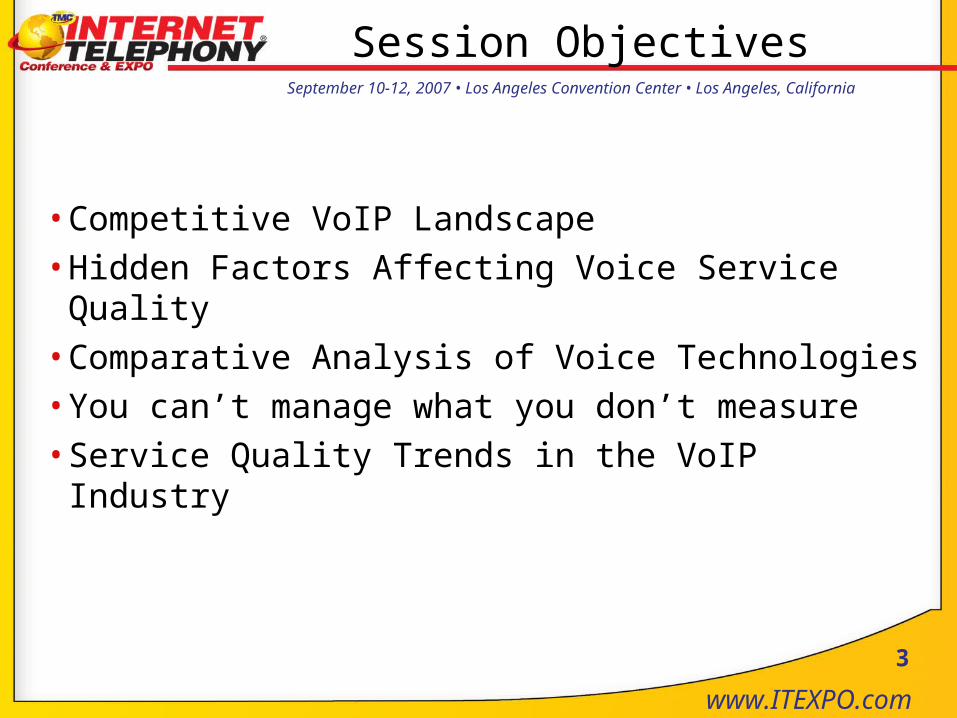
Session Objectives
• Competitive VoIP Landscape • Hidden Factors Affecting Voice Service Quality • Comparative Analysis of Voice Technologies• You can’t manage what you don’t measure • Service Quality Trends in the VoIP Industry

Unique Nature of VoIP
5
September 10-12, 2007 • Los Angeles Convention Center • Los Angeles, California
www.ITEXPO.com
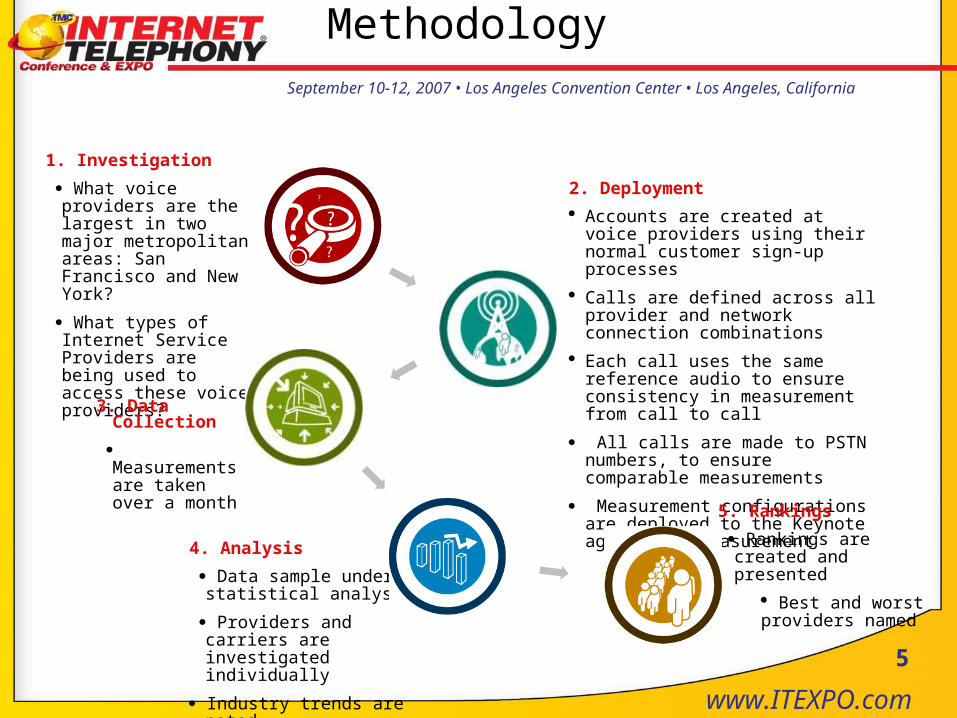
Methodology
1. Investigation
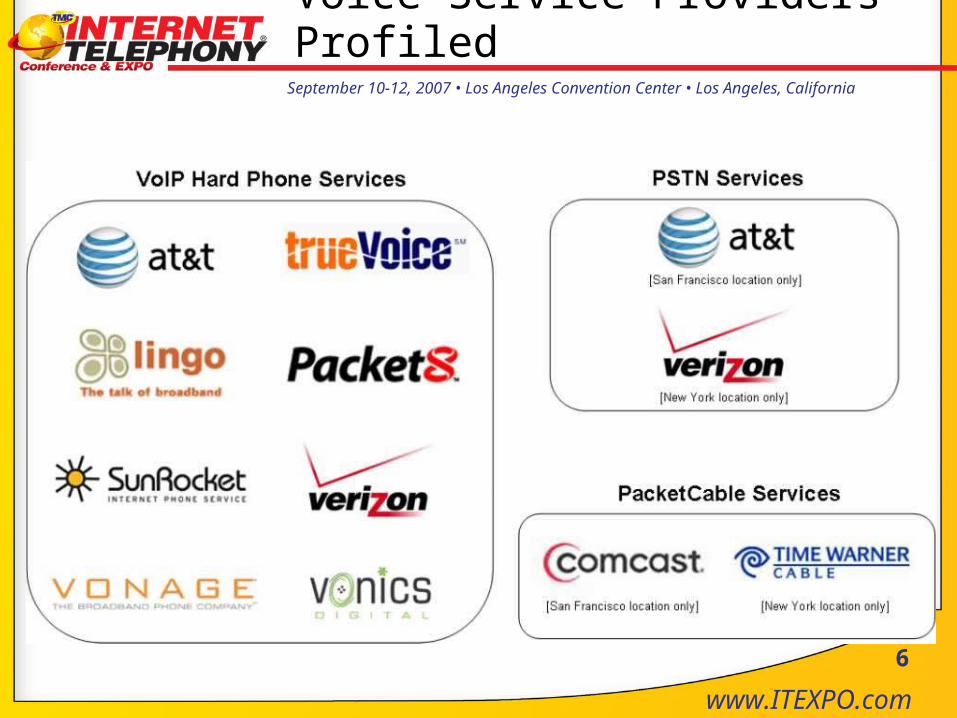
What voice providers are the largest in two major metropolitan areas: San Francisco and New York?
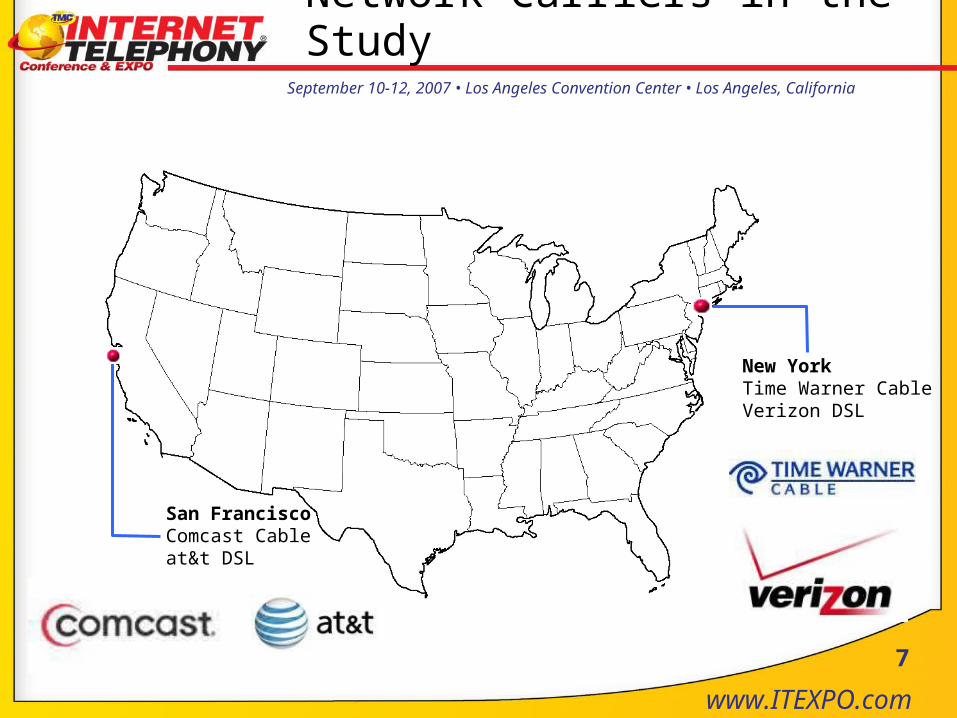
What types of Internet Service Providers are being used to access these voice providers?
2. Deployment
Accounts are created at voice providers using their normal customer sign-up processes
Calls are defined across all provider and network connection combinations
Each call uses the same reference audio to ensure consistency in measurement from call to call
All calls are made to PSTN numbers, to ensure comparable measurements
Measurement configurations are deployed to the Keynote agents for measurement
3. Data Collection
Measurements are taken over a month
4. Analysis
Data sample undergoes statistical analysis
Providers and carriers are investigated individually
Industry trends are noted
5. Rankings
Rankings are created and presented
Best and worst providers named
6
September 10-12, 2007 • Los Angeles Convention Center • Los Angeles, California
www.ITEXPO.com
Voice Service Providers Profiled
7
September 10-12, 2007 • Los Angeles Convention Center • Los Angeles, California
www.ITEXPO.com
New YorkTime Warner CableVerizon DSL
San FranciscoComcast Cableat&t DSL
Network Carriers in the Study

8
September 10-12, 2007 • Los Angeles Convention Center • Los Angeles, California
www.ITEXPO.com
Agent Topology
9
September 10-12, 2007 • Los Angeles Convention Center • Los Angeles, California
www.ITEXPO.com
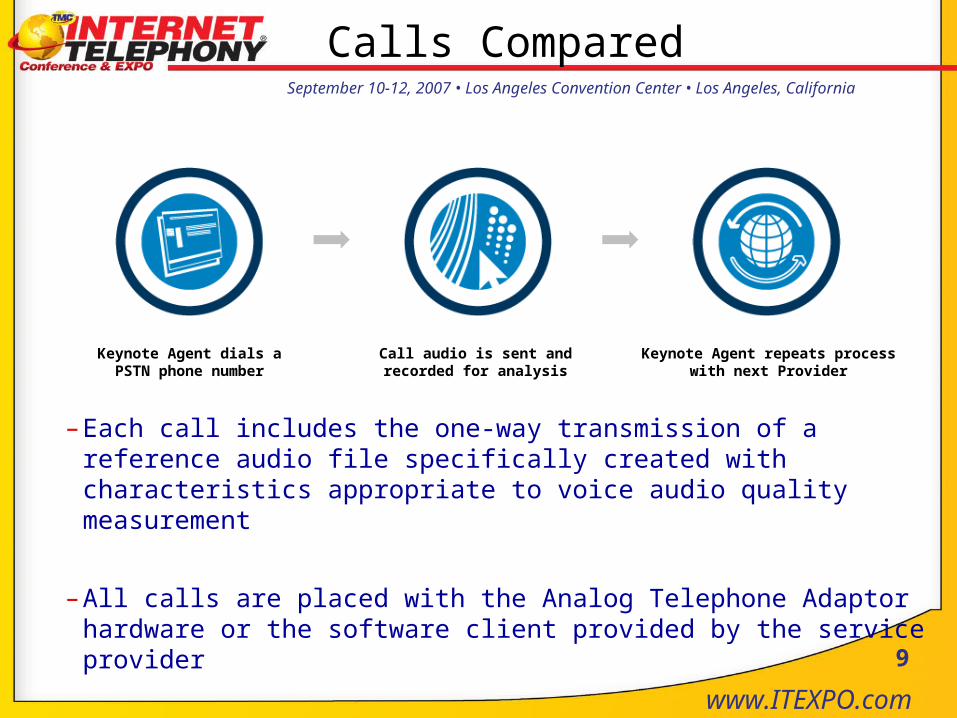
Calls Compared
– Each call includes the one-way transmission of a reference audio file specifically created with characteristics appropriate to voice audio quality measurement
– All calls are placed with the Analog Telephone Adaptor hardware or the software client provided by the service provider
Keynote Agent dials a PSTN phone number
Call audio is sent and recorded for analysis
Keynote Agent repeats process with next Provider

10
September 10-12, 2007 • Los Angeles Convention Center • Los Angeles, California
www.ITEXPO.com
Data Collection Period and Size
• Data collected from August 1st – August 31st, 2007
• Long distance and local PSTN and VoIP to PSTN calls were placed in both directions between New York and San Francisco on every VoIP provider and network combination once every 30 minutes
• Time Warner Digital Phone calls were placed every 30 minutes from New York to destinations in New York and San Francisco
• Comcast Optimum Voice calls were placed every 30 minutes from San Francisco to destinations in New York and San Francisco
• Total of over 102,000 phone calls were placed: over 10,000 calls per VoIP service provider, and over 2,800 calls on each PSTN and PacketCable service provider
11
September 10-12, 2007 • Los Angeles Convention Center • Los Angeles, California
www.ITEXPO.com
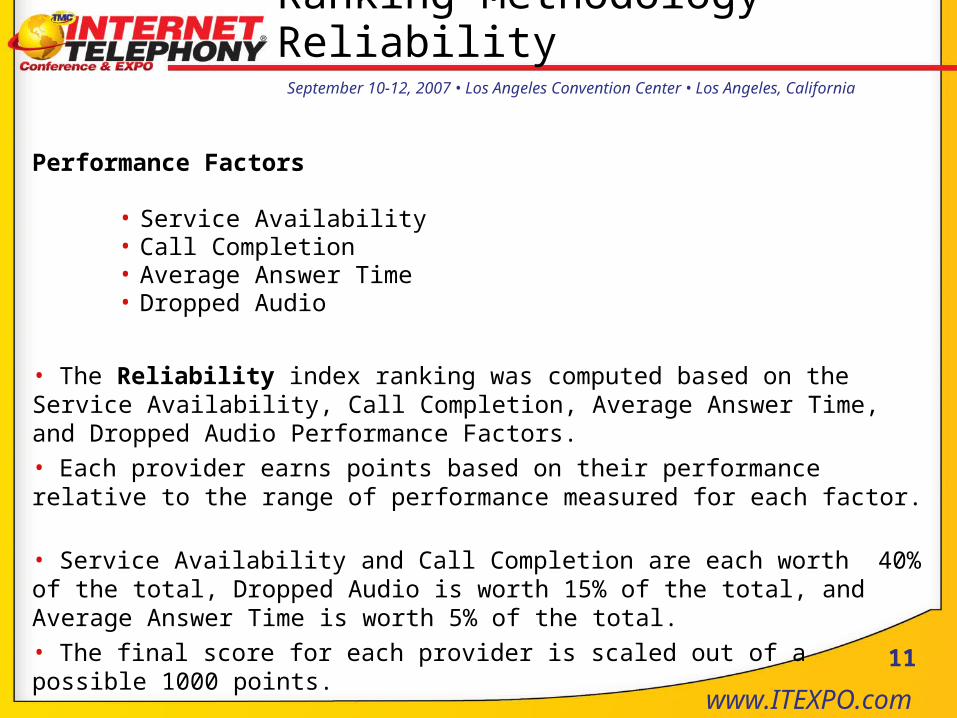
Ranking Methodology – Reliability
Performance Factors
• Service Availability• Call Completion• Average Answer Time• Dropped Audio
• The Reliability index ranking was computed based on the Service Availability, Call Completion, Average Answer Time, and Dropped Audio Performance Factors. • Each provider earns points based on their performance relative to the range of performance measured for each factor. • Service Availability and Call Completion are each worth 40% of the total, Dropped Audio is worth 15% of the total, and Average Answer Time is worth 5% of the total. • The final score for each provider is scaled out of a possible 1000 points.
12
September 10-12, 2007 • Los Angeles Convention Center • Los Angeles, California
www.ITEXPO.com
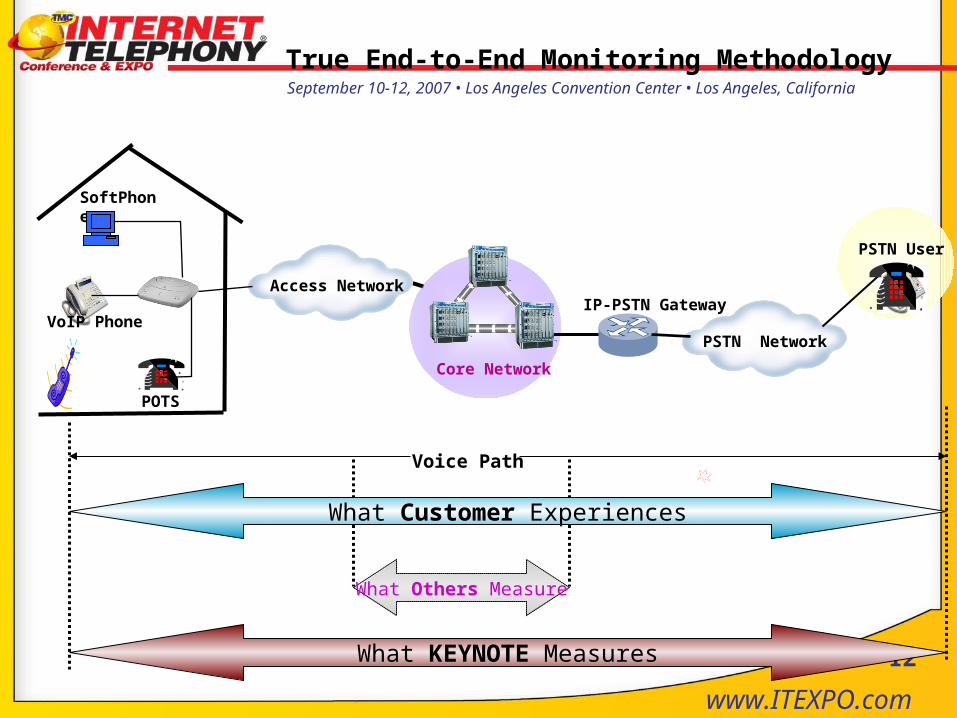
True End-to-End Monitoring Methodology
What Others Measure
What KEYNOTE Measures
What Customer Experiences
Core Network
PSTN User
SoftPhone
VoIP PhonePSTN Network
Access NetworkIP-PSTN Gateway
Voice Path
POTS
13
September 10-12, 2007 • Los Angeles Convention Center • Los Angeles, California
www.ITEXPO.com
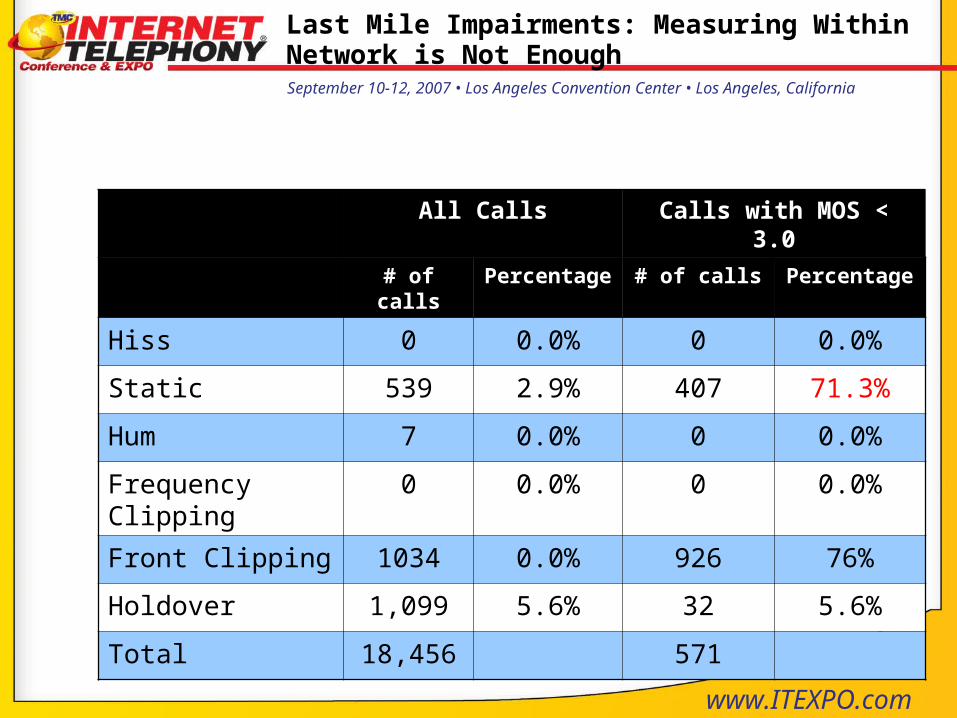
All Calls Calls with MOS < 3.0
# of calls Percentage # of calls Percentage
Hiss 0 0.0% 0 0.0%
Static 539 2.9% 407 71.3%
Hum 7 0.0% 0 0.0%
Frequency Clipping
0 0.0% 0 0.0%
Front Clipping 1034 0.0% 926 76%
Holdover 1,099 5.6% 32 5.6%
Total 18,456 571
Last Mile Impairments: Measuring Within Network is Not Enough
rkutty
This is our 3 years of experience of monitoring calls. We analyzed calls with MOS of less than 3.0 score and found they had high levels of --High Static – annoying clicking sound76% of calls had Front Clipping (first part of call is clipped as voice activated codex delays in converting analog to digital signal when you start speaking) and HoldoverIf you did only network monitoring – and this is happening beyond the ATA towards the customer -- you would not catch this. You cannot measure the impairment since that has already gone into the packet when ATA converts analog signal into packets. So the network sees the packet moving without a problem but does not uncover the issue within the packet.

14
September 10-12, 2007 • Los Angeles Convention Center • Los Angeles, California
www.ITEXPO.com
Voice Service Quality
Voice Service Quality
Reliability
Audio Clarity
Responsiveness
Holistic Customer Experience !!!
- Average Mean Opinion Score (MOS)- %Calls > Acceptable MOS- MOS Geographic Variability
- Average Audio Delay- %Calls > Acceptable Delay- Audio Delay Geo Variability
- Service Availability- #Dropped Calls- Average Answer Time

15
September 10-12, 2007 • Los Angeles Convention Center • Los Angeles, California
www.ITEXPO.com
Keynote Voice Perspective Agent Technology
Carrollton - DallasCable/DSL(Caller)
Plano(FiOS)
TampaCable/DS(Caller)
New YorkCable/DSL/SprintCaller & Responder
San FranciscoCable/DSL/SprintCaller & Responder
Hackensack - New JerseyCable/DSL(Caller)
Alexandria - VirginiaCable/DSL(Caller)
Responder Agent
Accepts calls; sends audio sample
Caller Agent
Initiates calls; requests audio sample
Caller agent compares
received and reference audio
samples
16
September 10-12, 2007 • Los Angeles Convention Center • Los Angeles, California
www.ITEXPO.com
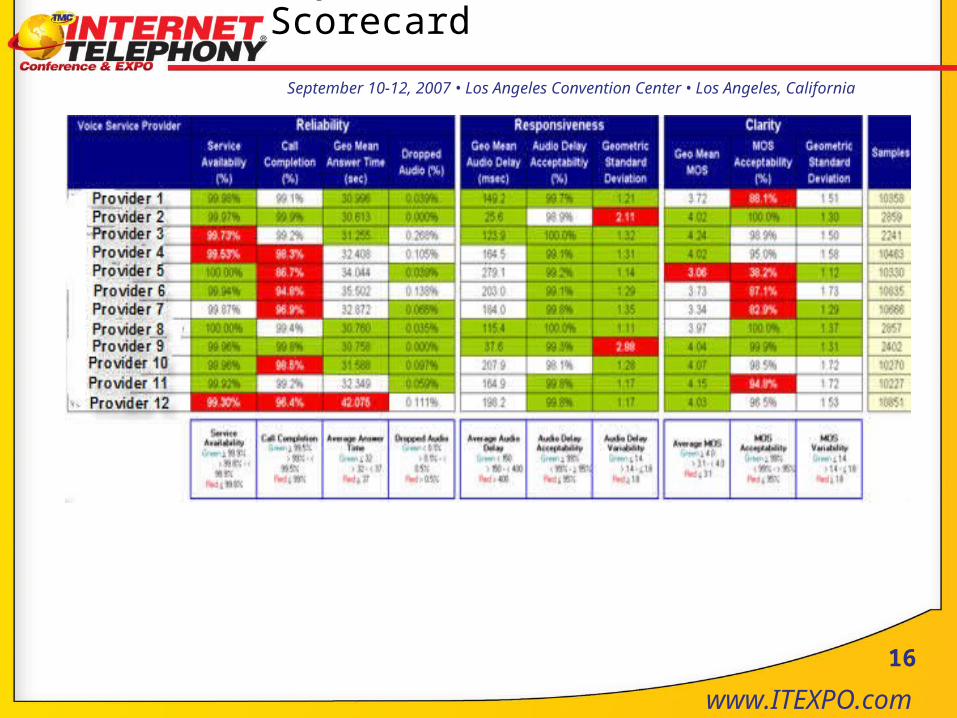
Key Performance Indicator Scorecard
17
September 10-12, 2007 • Los Angeles Convention Center • Los Angeles, California
www.ITEXPO.com
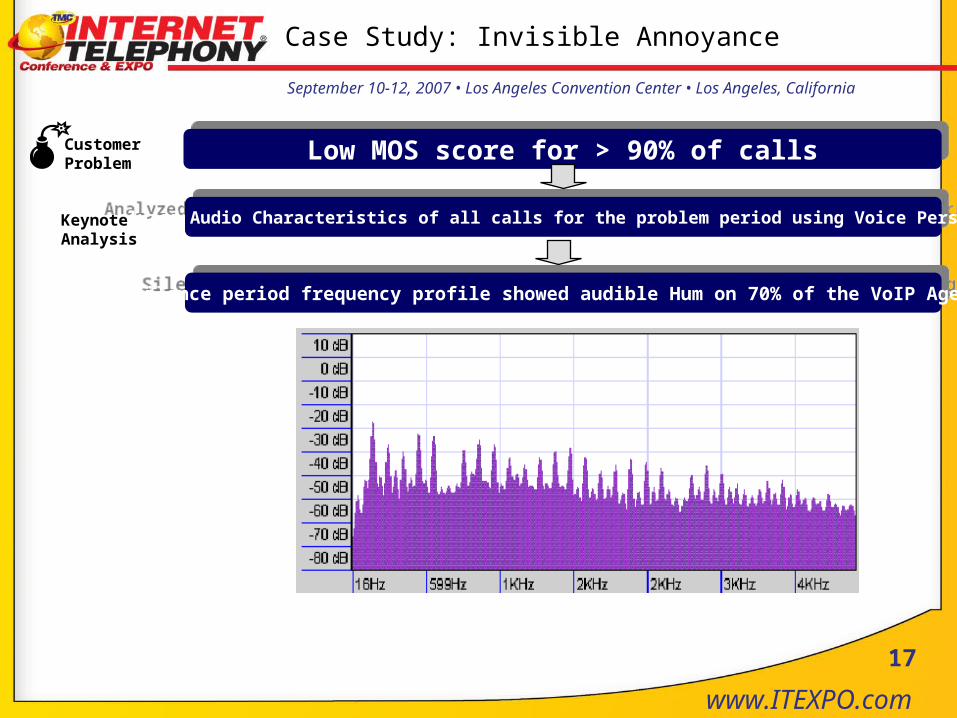
Case Study: Invisible Annoyance
Low MOS score for > 90% of callsLow MOS score for > 90% of calls
Analyzed Audio Characteristics of all calls for the problem period using Voice PerspectiveAnalyzed Audio Characteristics of all calls for the problem period using Voice PerspectiveKeynote Analysis
Silence period frequency profile showed audible Hum on 70% of the VoIP AgentsSilence period frequency profile showed audible Hum on 70% of the VoIP Agents
CustomerProblem

18
September 10-12, 2007 • Los Angeles Convention Center • Los Angeles, California
www.ITEXPO.com
Diagnosis
Hum problem and hardware ATA model type showed strong correlationHum problem and hardware ATA model type showed strong correlationVoIP Perspective Agent ATA Model % of Calls with Hum
New York AT&T Model B 96.9%
New York Sprint Model B 87.6%
New York Time Warner Cable Model B 97.6%
New York UUNet Model B 97.7%
New York Verizon DSL Model B 92.3%
San Francisco AT&T Model A 0.0%
San Francisco Comcast Cable Model B 97.1%
San Francisco SBC DSL Model B 97.4%
San Francisco Sprint Model A 0.0%
San Francisco UUNet Model A 0.1%
Low MOS score for > 90% of callsLow MOS score for > 90% of calls
Analyzed Audio Characteristics of all calls for the problem period using Voice PerspectiveAnalyzed Audio Characteristics of all calls for the problem period using Voice PerspectiveKeynote Analysis
Silence period frequency profile showed audible Hum on 70% of the VoIP AgentsSilence period frequency profile showed audible Hum on 70% of the VoIP Agents
CustomerProblem
Case Study: Invisible Annoyance

19
September 10-12, 2007 • Los Angeles Convention Center • Los Angeles, California
www.ITEXPO.com
The problem was in a specific telephone adapter model typeThe problem was in a specific telephone adapter model type
Audio Clarity Ranking improved by TWO places after replacing adaptersIncreased customer satisfaction (Mean Opinion Score increased by 0.3)
Audio Clarity Ranking improved by TWO places after replacing adaptersIncreased customer satisfaction (Mean Opinion Score increased by 0.3)
Improvement
Diagnosis
Hum problem and hardware ATA model type showed strong correlationHum problem and hardware ATA model type showed strong correlation
Low MOS score for > 90% of callsLow MOS score for > 90% of calls
Analyzed Audio Characteristics of all calls for the problem period using Voice PerspectiveAnalyzed Audio Characteristics of all calls for the problem period using Voice PerspectiveKeynote Analysis
Silence period frequency profile showed audible Hum on 70% of the VoIP AgentsSilence period frequency profile showed audible Hum on 70% of the VoIP Agents
CustomerProblem
Case Study: Invisible Annoyance
Study Results Overview
21
September 10-12, 2007 • Los Angeles Convention Center • Los Angeles, California
www.ITEXPO.com
Summary of Results
• The two PSTN service providers outperformed the other service providers in both Reliability and Audio Quality
• PacketCable providers suffered from weaker performance in this study than in the previous study
• All VoIP providers had a lower rate of calls with dropped audio on the DSL network connection than on the cable modem network connection

22
September 10-12, 2007 • Los Angeles Convention Center • Los Angeles, California
www.ITEXPO.com
Summary of Results – Audio Delay
• PSTN and PacketCable service providers measured a geometric mean one-way audio delay below the 150 ms threshold for end user satisfaction
• Most VoIP service providers measured a geometric mean one-way audio delay between 150 and 250 ms
• The best geometric mean audio delay for VoIP providers was 149 ms, and the worst was 279 ms
• Performance issues with the San Francisco cable modem connection on the 14th adversely affected some VoIP providers
23
September 10-12, 2007 • Los Angeles Convention Center • Los Angeles, California
www.ITEXPO.com
Summary of Results – MOS
• Only two providers in this study, had a geometric mean MOS below 3.7
• Five service providers had a geometric mean MOS over 4.0; the best geometric mean MOS was a 4.20, and the worst was a 3.05
• Problems on the San Francisco cable modem connection affected Comcast Digital Voice and all VoIP providers on the 25th, but affected those with the highest geometric mean MOS values the most
• Most service providers do not have problems with hiss, static, or high frequency clipping, but can have many calls with temporal clipping or audio holdover
24
September 10-12, 2007 • Los Angeles Convention Center • Los Angeles, California
www.ITEXPO.com
Summary of Results – Variations
• In general, voice service providers had a higher worst-case hourly variation between the prime and non-prime hours of the day in audio delay than in Mean Opinion Score
• Cable modem connections delivered more consistent prime vs. non-prime worst-case hourly audio delay performance
• All VoIP providers had a lower rate of calls with dropped audio on the DSL network connection than on the cable modem network connection
25
September 10-12, 2007 • Los Angeles Convention Center • Los Angeles, California
www.ITEXPO.com
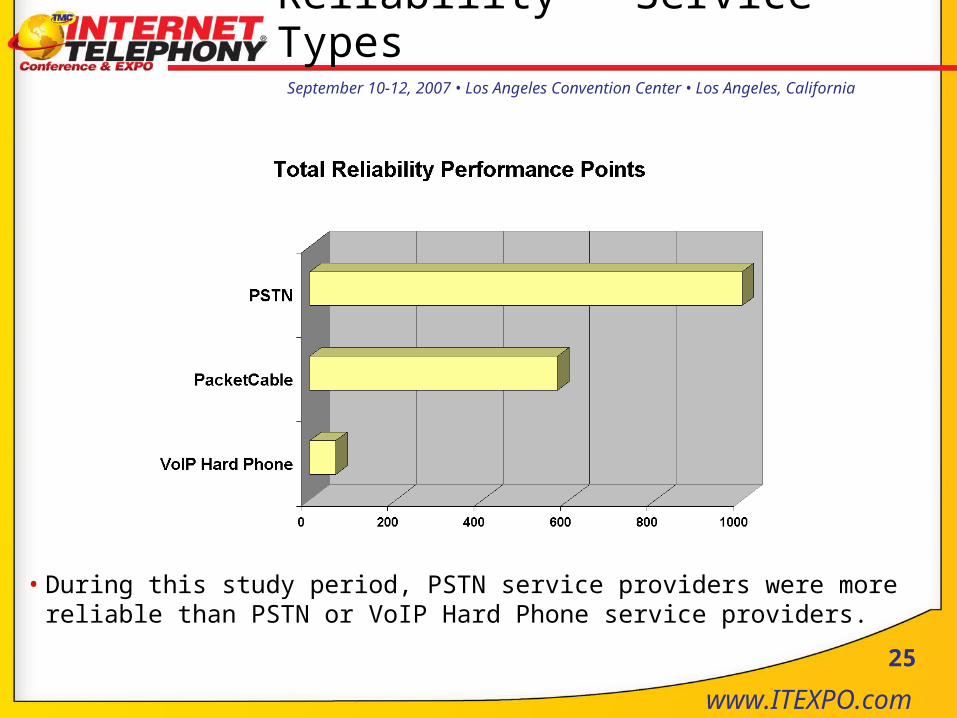
Reliability – Service Types
• During this study period, PSTN service providers were more reliable than PSTN or VoIP Hard Phone service providers.
26
September 10-12, 2007 • Los Angeles Convention Center • Los Angeles, California
www.ITEXPO.com
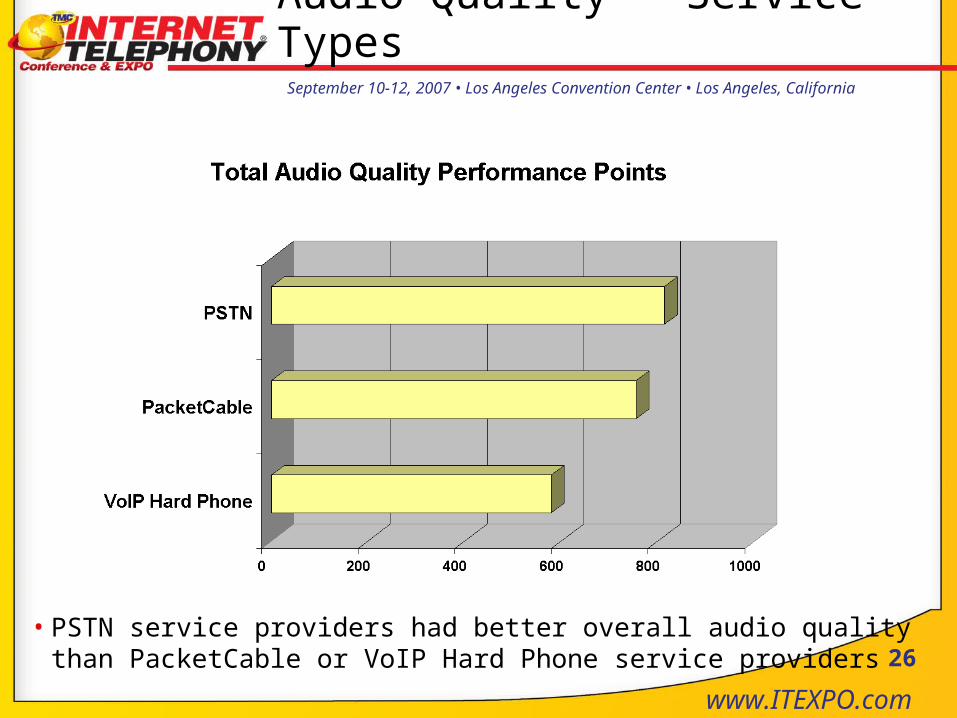
Audio Quality – Service Types
• PSTN service providers had better overall audio quality than PacketCable or VoIP Hard Phone service providers

27
September 10-12, 2007 • Los Angeles Convention Center • Los Angeles, California
www.ITEXPO.com
Audio Characteristics of PSTN
• The most common poor audio characteristics encountered on PSTN are audio holdover, other clipping, front clipping, and hum
• Back clipping, front clipping, hiss, audio holdover, hum, and other clipping occurs with a much higher frequency in calls that measured a MOS below 3.1
• Back clipping, high frequency clipping, hiss, and static occur only rarely
[Note: Combined totals and percentages for at&t PSTN and Verizon PSTN service providers]
28
September 10-12, 2007 • Los Angeles Convention Center • Los Angeles, California
www.ITEXPO.com
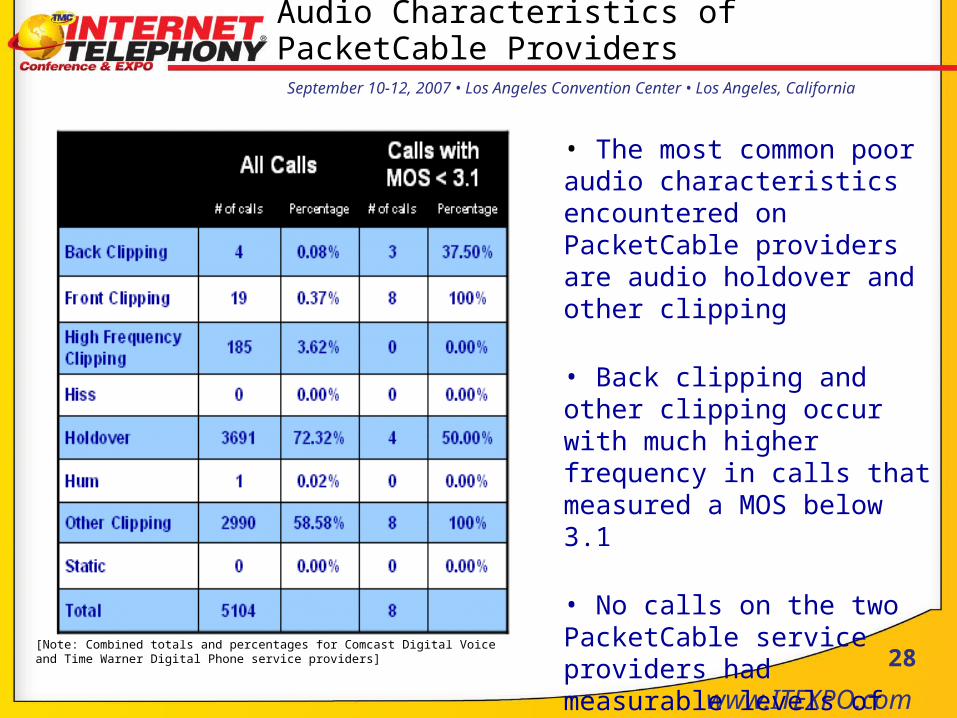
Audio Characteristics of PacketCable Providers
[Note: Combined totals and percentages for Comcast Digital Voice and Time Warner Digital Phone service providers]
• The most common poor audio characteristics encountered on PacketCable providers are audio holdover and other clipping
• Back clipping and other clipping occur with much higher frequency in calls that measured a MOS below 3.1
• No calls on the two PacketCable service providers had measurable levels of hiss or static

29
September 10-12, 2007 • Los Angeles Convention Center • Los Angeles, California
www.ITEXPO.com
Audio Characteristics of Hard Phone Providers
[Note: Combined totals and percentages for AT&T CallVantage, EarthLink trueVoice, Packet8, Primus Lingo, SunRocket, Verizon VoiceWing, Vonage, and Vonics Digital service providers]
• The most common poor audio characteristics encountered on Hard Phone providers are audio holdover, front clipping, other clipping, and hum
• Each of these poor audio characteristics occurs with a much higher frequency in calls that measured a MOS below 3.1
• Back clipping, high frequency clipping, hiss, and static occur only rarely

Summary

31
September 10-12, 2007 • Los Angeles Convention Center • Los Angeles, California
www.ITEXPO.com
Industry Trends
• Continuous improvement in reliability
• PSTN and PacketCable service quality gap narrowing
• VoIP Service Availability still needs improvements
• VoIP service as a whole improving and PacketCable leading the other voice technologies
32
September 10-12, 2007 • Los Angeles Convention Center • Los Angeles, California
www.ITEXPO.com
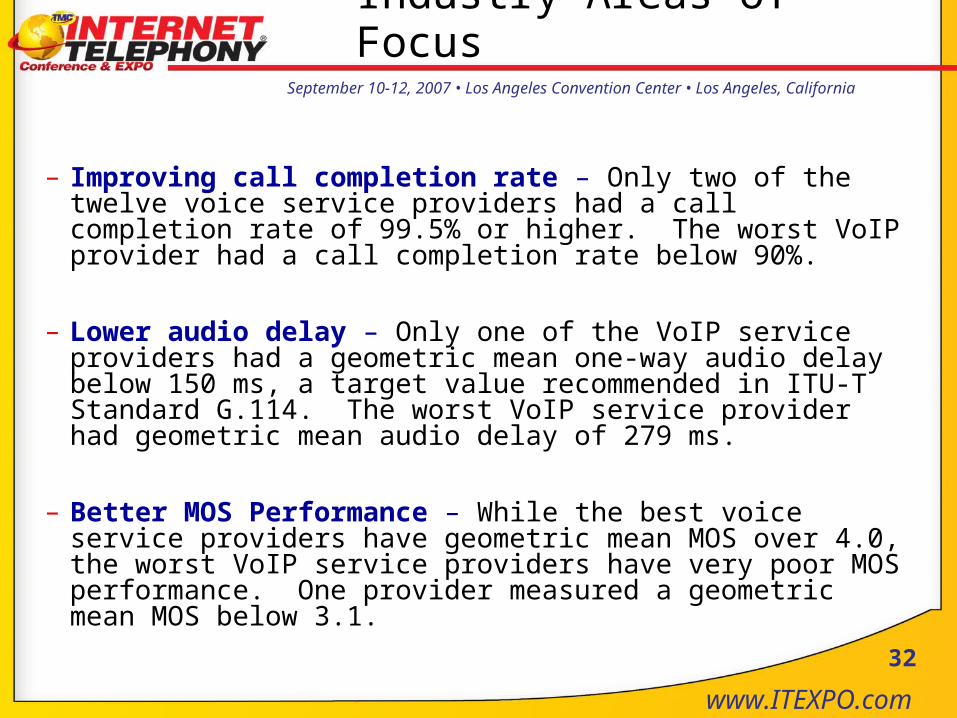
Industry Areas of Focus
– Improving call completion rate – Only two of the twelve voice service providers had a call completion rate of 99.5% or higher. The worst VoIP provider had a call completion rate below 90%.
– Lower audio delay – Only one of the VoIP service providers had a geometric mean one-way audio delay below 150 ms, a target value recommended in ITU-T Standard G.114. The worst VoIP service provider had geometric mean audio delay of 279 ms.
– Better MOS Performance – While the best voice service providers have geometric mean MOS over 4.0, the worst VoIP service providers have very poor MOS performance. One provider measured a geometric mean MOS below 3.1.
33
September 10-12, 2007 • Los Angeles Convention Center • Los Angeles, California
www.ITEXPO.com
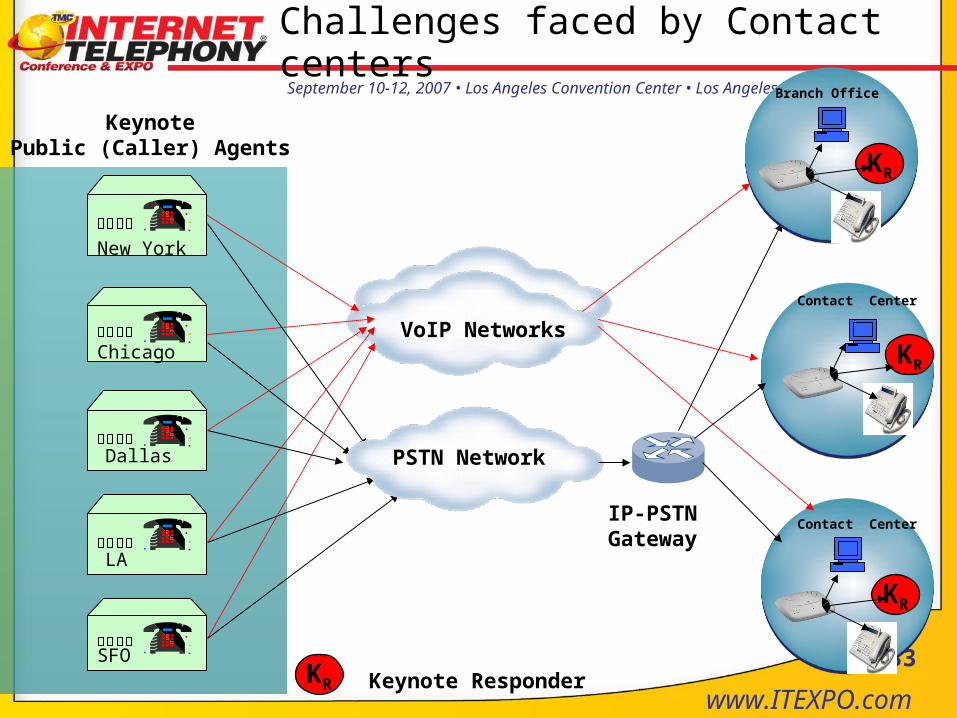
Challenges faced by Contact centers
Keynote Public (Caller) Agents
KR
New York
Chicago
Dallas
LA
SFO
VoIP Networks
KR
Contact Center
KR
Branch Office
Contact Center
PSTN Network
IP-PSTN Gateway
KR Keynote Responder
34
September 10-12, 2007 • Los Angeles Convention Center • Los Angeles, California
www.ITEXPO.com
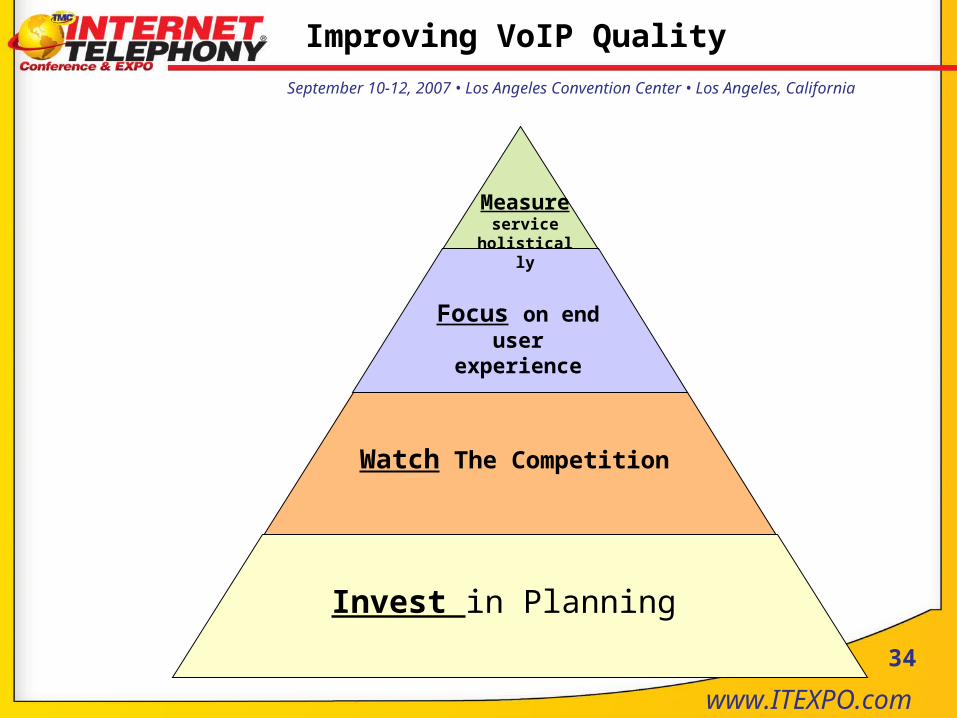
Improving VoIP Quality
Invest in Planning
Focus on end user experience
Measure service
holistically
Watch The Competition
Q&A
Thanks
36
September 10-12, 2007 • Los Angeles Convention Center • Los Angeles, California
www.ITEXPO.com
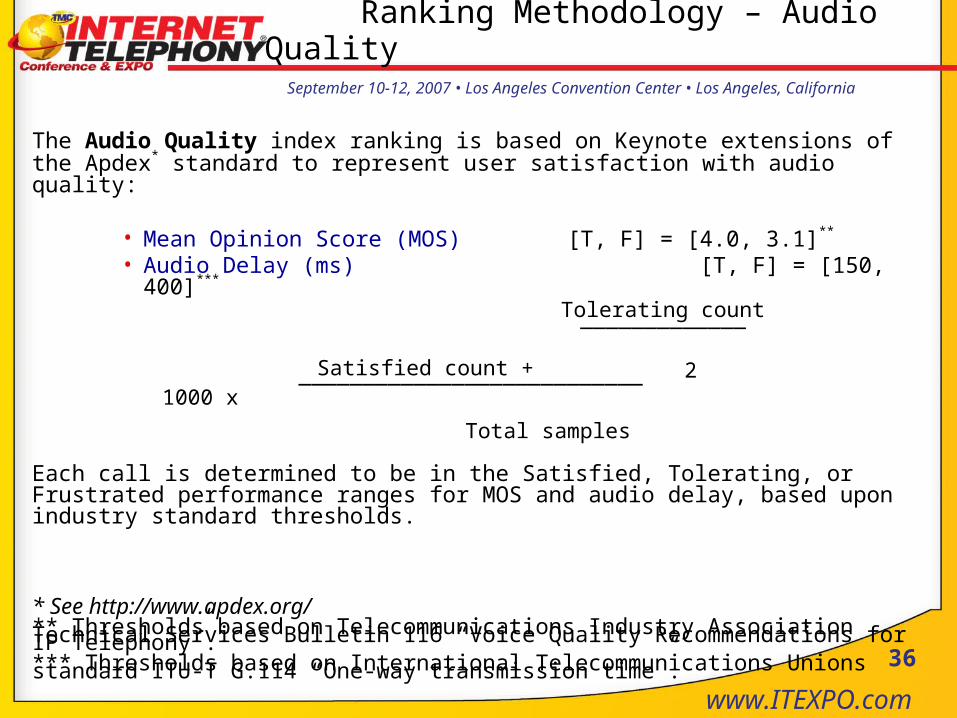
The Audio Quality index ranking is based on Keynote extensions of the Apdex* standard to represent user satisfaction with audio quality:
• Mean Opinion Score (MOS) [T, F] = [4.0, 3.1]**
• Audio Delay (ms) [T, F] = [150, 400]***
Each call is determined to be in the Satisfied, Tolerating, or Frustrated performance ranges for MOS and audio delay, based upon industry standard thresholds.
* See http://www.apdex.org/** Thresholds based on Telecommunications Industry Association Technical Services Bulletin 116 “Voice Quality Recommendations for IP Telephony”. *** Thresholds based on International Telecommunications Unions standard ITU-T G.114 “One-way transmission time”.
Ranking Methodology – Audio Quality
Total samples
_____________
___________________________
Tolerating count
Satisfied count + 21000 x