Voice assistants and how they affect consumer behavior€¦ · Cover: Image from Chatbots Magazine...
83
DEPARTMENT OF TECHNOLOGY MANAGEMENT AND ECONOMICS DIVISION OF INNOVATION AND R&D MANAGEMENT CHALMERS UNIVERSITY OF TECHNOLOGY Gothenburg, Sweden 2020 www.chalmers.se Report No. E2019:126 Voice assistants and how they affect consumer behavior A research study conducted in the US Master’s thesis in MPQOM ARTIN ESMAILZADEH MAGNUS ROLANDSSON
Transcript of Voice assistants and how they affect consumer behavior€¦ · Cover: Image from Chatbots Magazine...

DEPARTMENT OF TECHNOLOGY MANAGEMENT AND ECONOMICS
DIVISION OF INNOVATION AND R&D MANAGEMENT
CHALMERS UNIVERSITY OF TECHNOLOGY
Gothenburg, Sweden 2020
www.chalmers.se Report No. E2019:126
Voice assistants and how they affect consumer behavior A research study conducted in the US Master’s thesis in MPQOM
ARTIN ESMAILZADEH
MAGNUS ROLANDSSON

REPORT NO. E 2019:126
Voice assistants and how they affect
consumer behavior
A research study conducted in the US
ARTIN ESMAILZADEH
MAGNUS ROLANDSSON
Department of Technology Management and Economics
Division of Innovation and R&D Management
CHALMERS UNIVERSITY OF TECHNOLOGY
Gothenburg, Sweden 2020

Voice assistants and how they affect consumer behavior
A research study conducted in the US
ARTIN ESMAILZADEH
MAGNUS ROLANDSSON
© ARTIN ESMAILZADEH, 2020.
© MAGNUS ROLANDSSON, 2020.
Report no. E2019:126
Department of Technology Management and Economics
Division of Innovation and R&D Management
Chalmers University of Technology
SE-412 96 Gothenburg
Sweden
Telephone + 46 (0)31-772 1000
Cover: Image from Chatbots Magazine (2019). See bibliography for URL.
Gothenburg, Sweden 2020

Voice assistants and how they affect consumer behavior
A research study conducted in the US
ARTIN ESMAILZADEH
MAGNUS ROLANDSSON
Department of Technology Management and Economics
Division of Innovation and R&D Management
Chalmers University of Technology
Abstract The launch of Siri, the first commercially successful voice integrated virtual assistant
in 2010 is by many seen as the start of a new technology paradigm. In 2019, voice
assistants are widely integrated in a number of different devices and contexts. With
the penetration and dispersion of voice assistants, it is important for key stakeholders
to understand if and if so, how consumer behavior vary in different environments.
Through a survey implementing the kano model coupled with a tech adoption model,
this thesis aims to explain differences in consumer behavior with voice assistants,
across environments, demographics and psychographics.
The analysis showed that there were no significant differences in importance of
attributes across environments, but instead differences were identified across the
attributes themselves. Additionally, early tech adopters valued shopping on voice
assistants more than the average voice assistant user. User frequency for specific
activities proved to be based mainly on context and convenience. When it comes to
voice commerce, voice assistants are mainly used for early stages of the consumer
purchasing process, being information search and evaluating alternatives.
These findings are ultimately translated into managerial implications for key
stakeholders in business.
Keywords: voice assistants, voice technology, voice commerce, consumer behavior,
consumer research


Acknowledgments Firstly, we would like to thank Carl Sjöberger for his support and continuous
feedback throughout the entire thesis. He made sure that the thesis met the
standards of academia, despite being a very empirical-focused thesis.
Secondly, we would like to thank SKIM for providing expertise, guidance and
resources needed to conduct all the empirical research needed for this thesis.
Lastly, we would like to thank DISQO for covering the cost pro-bono for half of the
sample needed for this thesis’s survey.

1 Introduction 1
1.1 Background 1
1.2 Company profile 3
1.3 Problem description 4
1.4 Aim 5
1.5 Research questions 5
1.6 Limitations 5
2 Method 7
2.1 Research strategy 7
2.2 Research design 8
2.3 Research method 9
2.3.1 Literature review 9
2.3.2 Interviews 10
2.3.3 Survey 11
2.3.4 Ethical considerations 13
2.4 Research quality 14
2.4.1 Reliability 14
2.4.2 Replicability 14
2.4.3 Validity 15
3 Theory 17
3.1 Natural language processing (NLP) 17
3.1.1 Knowledge of speech and language 17
3.1.2 Automatic speech recognition (ASR) 18
3.1.3 Natural language understanding (NLU) 20
3.1.4 Natural language generation (NLG) 21
3.1.5 Speech synthesis 22
3.2 Consumer behavior 23
3.2.1 Consumer adoption of high-tech products 23
3.2.2 Demographic factors 25
3.2.3 Psychographic factors 26
3.2.4 Consumer purchasing process 27
3.3 Kano model 29
4 Results & Analysis 33
4.1 Sample 33
4.2 Demographics 33
4.3 Psychographics & tech adoption 34

4.3.1 Demographics of tech adopters 37
4.4 Kano results & analysis 38
4.4.1 Kano results for early tech adopters 40
4.5 Voice assistant usage 41
4.5.1 Early tech adopters usage 43
4.6 Managerial implications 44
5 Discussion 46
5.1 Research method discussion 46
5.2 Results & analysis discussion 46
6 Conclusion 48
6.1 Research question conclusion 48
6.2 Relevance to the field of research 49
6.3 Future research 49
A Appendix 50
A.1 Questionnaire 50
A.2 Full demographics breakdown 62
A.3 Full kano results 65
A.3 Full activity list 67
Bibliography 69

1
1 Introduction
The following chapter will give a background to the thesis topic, present the company
that the thesis is written in collaboration with as well as the aim, problem description,
aim, research questions, and limitations.
1.1 Background
Artificial Intelligence (AI) and machine learning are disrupting every industry,
affecting business models, driving digital transformation and changing human
behavior (Simms, 2019). Smart speakers are the fastest growing consumer
technology since the smartphone, and they are possibly revolutionizing commerce
and consumer behavior, creating a need for companies to drive change (Simms,
2019; Bentahar, 2018).
Smart speakers share many of the characteristics of chatterbots, which saw a
growing popularity in the early 2000’s (Mauldin, 1994). The term chatterbot was
originally coined by Michael Mauldin in 1994. The concept of chatterbots is said to
have originated from Alan Turning’s article “Computing Machinery and Intelligence”,
published in the 1950’s (Turning, 2009). Chatbots are described as “robots designed
to simulate how a human would behave as a conversational partner”, and the
technology has evolved much since Turning’s publication. Mauldin was the first
person to create a verbot (named Julia), a chatterbot which could communicate
through sound, instead of text (Mauldin, 1994). Though, at that time there was no
real commercial application for the technology and no real business built around it.
In the early 2000’s, it looked though, as if chatterbots were finally about to take off on
some commercial success when tech start-up ActiveBuddy released the chatterbot
SmarterChild (Lawton, 2003; Vlahos, 2019). This chatterbot, by adding natural
language comprehension functionality, resembles the intelligent assistants that we
know today. Its applications ranged from access to news, weather, stock information,
and yellow pages listings to a set of tools, such as personal assistant, calculators,
translator, etcetera.
SmarterChild was introduced on AOL (formerly America Online) Instant Message in
June 2001 and stood out from previous renditions of chatterbots, with the ability to
have an actual conversation with its users (Vlahos, 2019). Early success led to
SmarterChild drawing attention from Radiohead, Austin Powers, Intel, Keebler, The
Sporting News, who wanted to utilize the bot for marketing purposes. ActiveBuddy
changed their name to Colloquis and in 2007, was acquired by Microsoft for $46
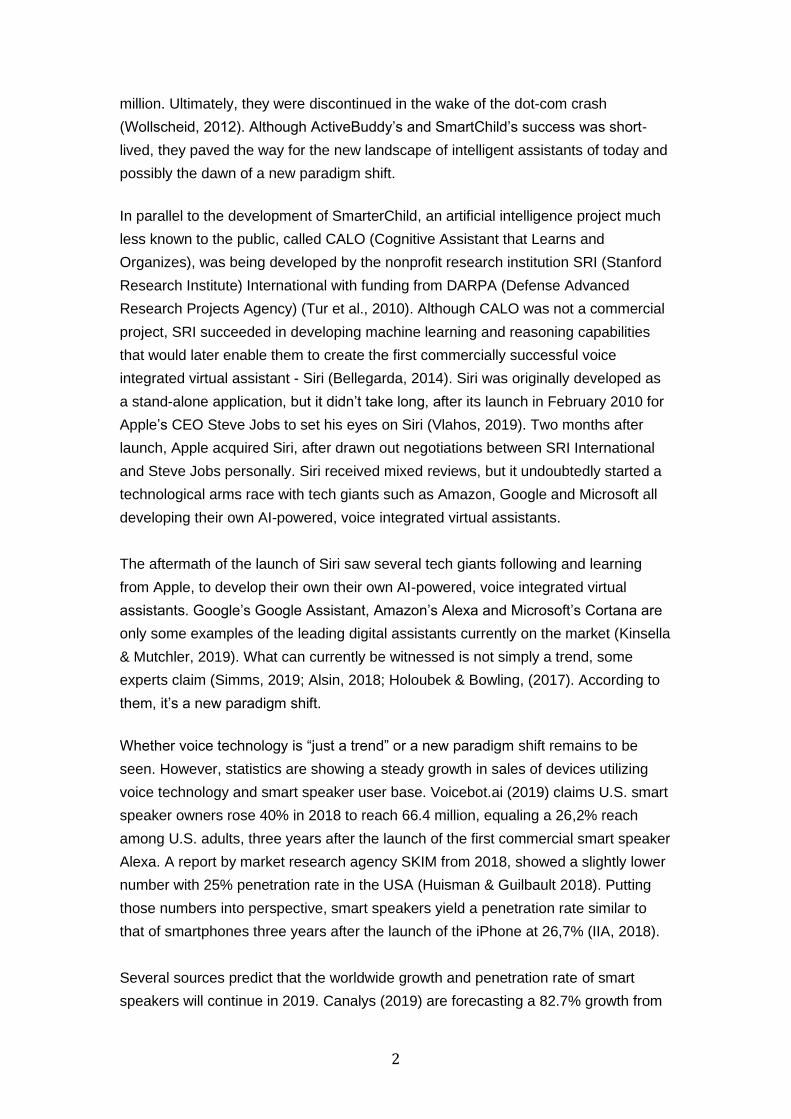
2
million. Ultimately, they were discontinued in the wake of the dot-com crash
(Wollscheid, 2012). Although ActiveBuddy’s and SmartChild’s success was short-
lived, they paved the way for the new landscape of intelligent assistants of today and
possibly the dawn of a new paradigm shift.
In parallel to the development of SmarterChild, an artificial intelligence project much
less known to the public, called CALO (Cognitive Assistant that Learns and
Organizes), was being developed by the nonprofit research institution SRI (Stanford
Research Institute) International with funding from DARPA (Defense Advanced
Research Projects Agency) (Tur et al., 2010). Although CALO was not a commercial
project, SRI succeeded in developing machine learning and reasoning capabilities
that would later enable them to create the first commercially successful voice
integrated virtual assistant - Siri (Bellegarda, 2014). Siri was originally developed as
a stand-alone application, but it didn’t take long, after its launch in February 2010 for
Apple’s CEO Steve Jobs to set his eyes on Siri (Vlahos, 2019). Two months after
launch, Apple acquired Siri, after drawn out negotiations between SRI International
and Steve Jobs personally. Siri received mixed reviews, but it undoubtedly started a
technological arms race with tech giants such as Amazon, Google and Microsoft all
developing their own AI-powered, voice integrated virtual assistants.
The aftermath of the launch of Siri saw several tech giants following and learning
from Apple, to develop their own their own AI-powered, voice integrated virtual
assistants. Google’s Google Assistant, Amazon’s Alexa and Microsoft’s Cortana are
only some examples of the leading digital assistants currently on the market (Kinsella
& Mutchler, 2019). What can currently be witnessed is not simply a trend, some
experts claim (Simms, 2019; Alsin, 2018; Holoubek & Bowling, (2017). According to
them, it’s a new paradigm shift.
Whether voice technology is “just a trend” or a new paradigm shift remains to be
seen. However, statistics are showing a steady growth in sales of devices utilizing
voice technology and smart speaker user base. Voicebot.ai (2019) claims U.S. smart
speaker owners rose 40% in 2018 to reach 66.4 million, equaling a 26,2% reach
among U.S. adults, three years after the launch of the first commercial smart speaker
Alexa. A report by market research agency SKIM from 2018, showed a slightly lower
number with 25% penetration rate in the USA (Huisman & Guilbault 2018). Putting
those numbers into perspective, smart speakers yield a penetration rate similar to
that of smartphones three years after the launch of the iPhone at 26,7% (IIA, 2018).
Several sources predict that the worldwide growth and penetration rate of smart
speakers will continue in 2019. Canalys (2019) are forecasting a 82.7% growth from

3
114 million towards 200+ million units in 2019, with a surge in Southeast Asia acting
as a catalyst.
A report by market research agency eMarketer (2018) is predicting a similar pattern
with the installed base of smart speakers in China to rise to 85.5 million, surpassing
USA at 74.2 million in 2019.
However, in the big picture of voice technology, smart speakers only constitute a
limited portion of the global voice assistant landscape. Juniper Research predict a
staggering 8 billion digital voice assistants by 2023, compared to 2.5 billion today,
with smartphones representing the bulk of the growth. They continue by stating that
there will be a demand for multi-platform assistants looking into 2023.
With the installed base of voice assistants growing across devices, marketing
professionals need learn more about the differences in usage between voice
assistants on different devices and in different environments. Do consumer behavior
and expectations match or differ across environments and what will the managerial
implications of the development be?
These are some of the most important insights that market research agencies will
need to figure out, in order to meet their clients’ marketing needs in the future of
voice technology.
1.2 Company profile
SKIM is a global insights agency helping leading companies thrive by understanding
decision-making. SKIM have been conducting market research since their start in
Rotterdam, the Netherlands in 1979. Today they are an international team of over
100 professionals, with offices in The Netherlands, US, UK, Germany, Brazil,
Singapore and Costa Rica (SKIM, 2019a).
To stay ahead in today’s environment, it’s crucial to know how decisions are made
and how the changing environment influences decisions for consumers and B2B
professionals. By understanding how decision-making has changed (and how it has
not), they adapt sophisticated research techniques and develop new innovations to
address this new reality. The result? Practical brand communications, revenue
management, product innovation, e-commerce, and advanced analytics
recommendations that can be used to propel business forward, online and offline.

4
What sets SKIM apart is their decision behavior expertise, deep analytical and
choice-modeling roots, a thorough understanding of the marketing challenges brands
face. This unique combination, along with their creative thinking, is the reason why
strategy consultants and leading companies, from Fortune 500 to digital disruptors,
continue to partner with SKIM for decades.
Through their expertise, they drive research and development within decision
behavior research and quantitative market research. The tools which SKIM apply
consists of both established market research methodologies such as Conjoint
analysis and MaxDiff analysis as well as their own digital innovations and
simulations.
The tools and their application have changed a lot during under the e-commerce
paradigm, which constantly constitutes new challenges for SKIM per new customer
demands. With voice assistants growing as a sales channel, SKIM needs to increase
their knowledge of how voice assistants are being used for shopping and the
implication on the products and services SKIM offer their clients in the future.
Shopping though voice technology is predicted to grow rapidly in the future according
to several market research experts, consulting firms and industry experts alike. They
all state that voice will affect consumer shopping behavior in the future, but they are
not sure how and which part of the consumer’s buying journey. Furthermore, voice
technology must go through a couple of transformations before it will reach
significant penetration.
Therefore, it is even more important how general consumer behavior with voice
technology in different contexts will develop, to be prepared to eventually tackle voice
commerce problems in the future.
1.3 Problem description
As voice assistants are becoming part of more and more people’s everyday life, and
consumers showing quick adoption, it is ultimately changing consumer behavior
(Capgemini, 2018).
There are many studies that try to understand how and what certain voice assistant
devices are used for, conducted by companies such as SKIM, Voicebot.ai and
Capgemini (Huisman & Guilbault, 2018, Voicebot.ai, 2019 and Capgemini, 2018).
Though, there has not been any comparative research conducted on how consumers
use voice assistants differently in different environments, and what the implications of
that might be. Further, the companies mentioned above, all state that voice will affect

5
consumer shopping behavior, but not how and which part of the consumer
purchasing process.
1.4 Aim
This thesis aims to give an understanding of how voice assistants are used
differently in different environments, as well as in what part of a consumer
purchasing process voice assistants plays a role. Further, the thesis aims to identify
what businesses voice commerce will be relevant for and what the managerial
implications of that would be.
1.5 Research questions
To be able to meet and address the aim of the thesis, this thesis will serve to answer
the following three research questions:
1. What attributes of voice assistants are more/less important, and does the
importance differ in different environments?
2. How does people’s usage of voice assistants differ in different environments?
3. What phase of the consumer purchasing process does voice assistants have
the biggest impact?
1.6 Limitations
As the subject of voice technology is very broad and still rapidly growing, the
master’s thesis will mainly adopt the characteristics of an exploratory study. Previous
research on voice assistant consumer adoption conducted by Voicebot.ai (2018),
show that the top three devices that consumers have used voice assistants through
are smart speakers, smartphones and integrated voice assistants in their car. Based
on this, the thesis will focus on three environments that will be researched and
compared, namely:
1. Smart speaker in your home
2. Smartphone on-the-go
3. Integrated voice assistants in your car
Any empirical consumer research for this thesis will be subject to the US market,
since it is the market that shows the highest adoption of voice assistants, and will
therefore generate better insights compared to countries with low adoption (Huisman
& Guilbault 2018).

6
The attention to the technical background of voice will be limited to a level where it
offers the reader a basic understanding of the concept of voice technology and why it
is so advanced.

7
2 Method
The following chapter presents the method used to be able to answer the research
questions of the thesis. It consists of four sub-chapters: research strategy, research
design, research method and research quality. Each sub-chapter begins with theory
to give the reader context, followed by how it has been applied for this specific thesis.
2.1 Research strategy
The research strategy is described as the broad orientation when conducting
business research and can be divided into two overarching types, quantitative
research and qualitative research (Bryman and Bell, 2011). Krishnaswami (2010)
explains quantitative research as a strategy that focuses on numbers, percentages
and monetary terms when collecting and analyzing data. Further, quantitative
research allows for usage of statistical tools in order to draw conclusions both on an
individual level as well as collectively, which allows for identifying trends and
generalizations. By contrast, qualitative research is a strategy that focuses on
subjective assessment of behavior, attitude, opinions, impressions and so on
(Krishnaswami, 2010). A combination of quantitative and qualitative research, where
the researcher collects and analyzes data, integrates the findings and draw
conclusions based on both approaches, is called mixed methods research (Creswell
& Clark, 2017).
The two orientations that the research may take in relation to theory is deductive
approach and inductive approach (Bryman & Bell, 2011). A deductive approach is
used when the researcher builds a hypothesis based on existing theory and then
tests it with data. An inductive approach consists of the same components, but
reversed, meaning that the researcher starts with collecting data, followed by
generating new theory that helps explain the patterns concluded from the data
(Bryman & Bell, 2011).
This thesis’s strategy is to utilize a mixed methods research, while using an iterative
inductive approach. An iterative inductive approach can be explained as an approach
that allows for simultaneously analyzing empirical data while reviewing existing
theory, which enables the researcher to better make sense of the data (Bryman &
Bell, 2011). Since voice technology is a relatively unexplored area with limited
academic papers and experts, this strategy is the most suitable in fulfilling the aim
and purpose of the thesis.

8
2.2 Research design
Choosing a research design, which takes the form of a framework for collecting and
analyzing data, helps the researcher prioritize different components of the research
process (Bryman & Bell, 2011).
Bryman & Bell (2011) presents five common research designs, described below:
− Experimental designs are carried out by changing an independent variable
in order to see how it affects the dependent variable, which is typically done
in two different groups, an experimental group where the independent
variable actually changes and a control group where nothing changes. The
dependent variable is measured before and after, allowing for a before-and-
after analysis.
− Cross-sectional designs use the collection of quantifiable data from multiple
cases/sources, at a specific point in time, in order to detect patterns of
association.
− Longitudinal designs are similar to cross-sectional designs with the
difference of being done over time, allowing to identify patterns of variables
that change over time.
− Case study designs is one of the most popular designs in business research
and entails a detailed and extensive analysis of a single case, e.g. a
workplace or organization.
− Comparative designs apply the logic of comparison and are carried out by
collecting quantitative and/or qualitative data from two or more cases.
Further, Saunders, Lewis & Thornhil (2016) state that the research can be designed
to fulfill different types of purposes: exploratory, explanatory, evaluative purpose or a
combination of the three. The way in which the research questions are asked will
help determine what type of study is most suitable. The three types of studies are
described below:
− Exploratory studies are useful when the researcher aims to gain insights
about a topic of interest and increase the general understanding of an issue,
problem or phenomenon.
− Explanatory studies are suitable when the researcher aims to understand
the relationship between variables in a certain situation, e.g. the relationship
between revenue and profit.
− Descriptive studies focus on gaining an accurate profile of events, persons
or situations, which in advance requires a clear picture of the topic of interest.

9
This study uses a cross-sectional design and the purpose is exploratory. Given the
nature of the project, where the researchers seek to create new insights and new
theory within an uncharted topic, the specific design was favorable, since it allowed
for usage of multiple sources. Additionally, Saunders et al. (2016) state that an
exploratory purpose has the convenience of being flexible and adapt to changes that
may occur throughout the study.
2.3 Research method
The research method covers the different techniques used for collecting data
(Bryman & Bell, 2011). Examples of techniques that can be used are interviews,
experiments, surveys and observations.
2.3.1 Literature review
One of the most important tasks in delivering a successful research project is
reviewing the existing literature on the chosen topic (Bryman & Bell, 2011). The
literature review is carried out in order to understand what is already known and
researched in the specific area, what concepts and theories are relevant, what
previous type of research methods that have been used, among others. Further, it
may help the researcher to refine the research questions and how upcoming data
collections should be executed.
Bryman & Bell (2011) introduce two ways to carry out a literature review, systematic
review and narrative review. A systematic review can be defined as replicable,
scientific and transparent process with the aim to minimize bias by doing a
comprehensive literature search, both online and offline. It is done in certain steps
which are clearly presented in the report, so that the reader easily can understand
the procedure, decisions and conclusions. On the other hand, a narrative review,
also known as the traditional review method, is used by researchers who want to
gain an initial impression of the topic area that they plan to understand through their
research. Therefore, narrative review is typically less focused and has a wider scope
than systematic review (Bryman & Bell, 2011).
Given the nature of the thesis and the time constraints, a traditional narrative review
method has been chosen. The goal of the literature review is to get a fundamental
understanding of the technical aspects as well as the business aspects of the topic,
which in turn can be used to refine research questions and guide the collection and
analysis of empirical data. Bryman & Bell (2011) backs the chosen method in this
case by stating that a systematic review can be extremely problematic when using an
inductive approach, since theory is the outcome of the study, rather than the basis.

10
2.3.2 Interviews
Saunders et al. (2016) and Robson & McCartan (2016) categorize interviews into
three types, structured interviews, semi-structured interviews and unstructured
interviews. As the names of the different types of interviews indicate, interviews can
range from being highly formal and structured with predetermined and standardized
questions to being informal and unstructured with loosely defined questions, or even
open conversations (Saunders et al., 2016). Further, semi-structured interviews and
unstructured interviews are referred to as qualitative research interviews, while
structured interviews are referred to as a quantitative research interviews since
answers typically are pre-coded, making the collected data quantifiable.
Saunders et al. (2016) and Robson & McCartan (2016) continue by explaining how
interviews either can be conducted one-to-one or one-to-many. Examples of one-to-
one interviews are face-to-face interviews, telephone interviews and internet-based
interviews, and one-to-many interviews typically take the form of focus groups
(Robson & McCartan, 2016). Advantages of one-to-many interviews over one-to-one
interviews are e.g. time and cost efficiency, since data is being collected from
multiple respondents at the same time and the fact that it is easier to assess when
there is a consistent and shared view. Disadvantages on the other hand are e.g. that
the number of questions covered is limited due to discussions that may occur, the
expertise needed to facilitate a group interview process as well as the possibility of
conflicts that can arise between participants.
In this thesis, semi-structured one-to-one interviews were used to collect material
and data from industry experts. Saunders et al. (2016) argue that semi-structured
interviews can be very helpful in exploratory studies since they may provide
important background or contextual data in the specific topic that would not be
possible with structured interviews. Further, Phillips & Stawarski (2016) state that
interviews can be used to discover success stories, which can help giving context
when analyzing and concluding data.
A drawback when it comes to interviews is the amount of preparation needed to
ensure a consistent process and comparable data (Phillips and Stawarski, 2016). To
address this, five guidelines were followed.
11
− Questions were developed that suits a semi-structured interview, meaning
that the questions are framed but still allows for flexible and a wide range of
answers.
− The interview template was reviewed by four people apart from the thesis
team. Feedback on inconsistencies, unclear phrasing and overlapping
questions were received and corrected accordingly.
− The interviewers - the two thesis members - made sure to be enough
prepared prior the interview by educating themselves on the voice topic, as
well as preparing what follow-up questions that could be asked to collect
additional relevant details.
− Emails were sent out to the interviewees prior to the interviews, describing
the purpose of the interview, how it will be structured and some example
questions, allowing them to prepare to the best degree possible.
− Interviews were scheduled early on to assure commitment, specifying date,
time and place.
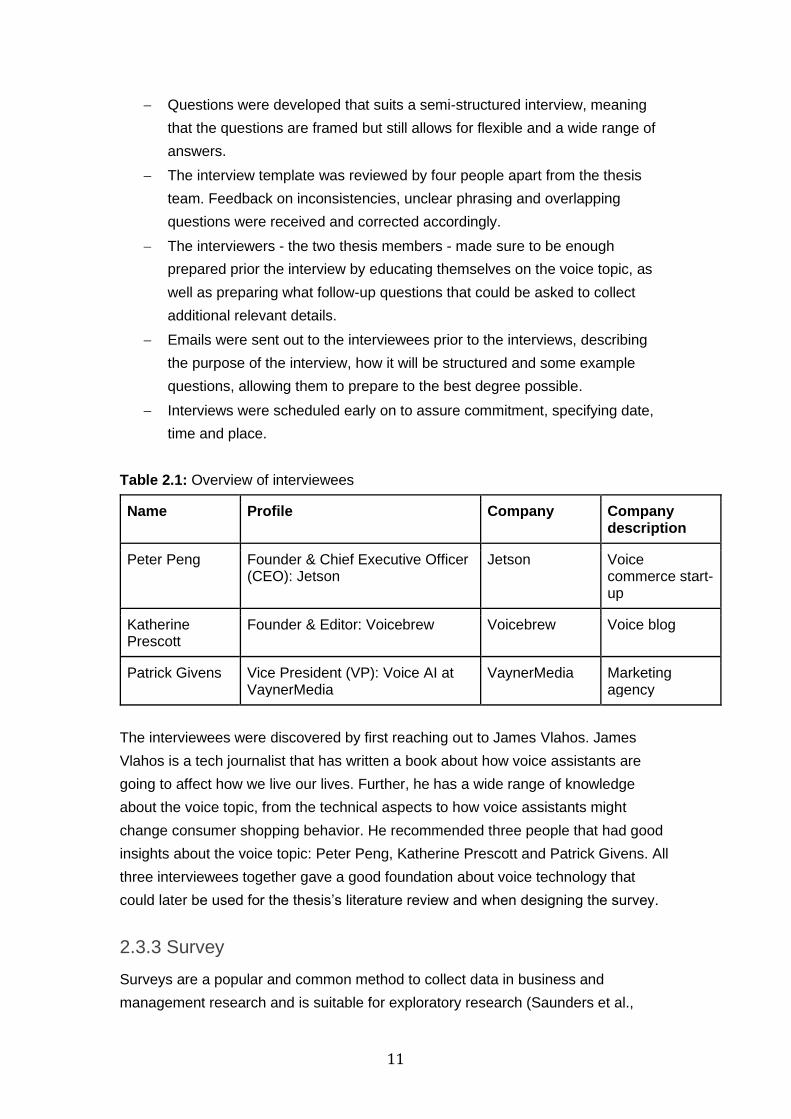
Table 2.1: Overview of interviewees
Name Profile Company Company description
Peter Peng Founder & Chief Executive Officer (CEO): Jetson
Jetson Voice commerce start-up
Katherine Prescott
Founder & Editor: Voicebrew Voicebrew Voice blog
Patrick Givens Vice President (VP): Voice AI at VaynerMedia
VaynerMedia Marketing agency
The interviewees were discovered by first reaching out to James Vlahos. James
Vlahos is a tech journalist that has written a book about how voice assistants are
going to affect how we live our lives. Further, he has a wide range of knowledge
about the voice topic, from the technical aspects to how voice assistants might
change consumer shopping behavior. He recommended three people that had good
insights about the voice topic: Peter Peng, Katherine Prescott and Patrick Givens. All
three interviewees together gave a good foundation about voice technology that
could later be used for the thesis’s literature review and when designing the survey.
2.3.3 Survey
Surveys are a popular and common method to collect data in business and
management research and is suitable for exploratory research (Saunders et al.,
12
2016). The main purpose of collecting data through a survey is to produce statistics,
in other words, quantitative descriptions about certain aspects of the study population
(Fowler, 2013; Saunders et al., 2016). Though, a survey may also include qualitative
elements, such as open-ended questions to complement the quantitative data.
Fowler (2013) presents three common survey techniques: measurement of public
opinions for newspaper and magazines, measurement of political perceptions, and
market research designed to understand consumer preferences and interests. This
thesis obviously used the latter technique of the three.
Fowler (2013) further introduces three relevant overarching components of surveys
which will be covered to ensure high quality, namely sampling, question design and
data preparation for analysis.
The sampling was done with the help of a professional fieldwork agency, DISQO,
allowing for a fair representation of the study population. This was done by DISQO
selecting respondents that corresponded to the natural demographic distribution in
the US. DISQO is a survey fieldwork partner to SKIM that helps recruit respondents
for innovative research projects with a low budget. In this case, DISQO provided half
of the respondents pro-bono and the other half was paid for by SKIM.
Survey design is key to collecting reliable and valid data from respondents (Fowler,
2013). Designing a question for a survey is indirectly about designing a measure.
The way the question is formulated will have a lot of impact on how it is answered.
After all, the critical issue of why a survey is conducted, is to receive answers that
reflect reality. To help the researcher collect reliable and valid data, Fowler (2013)
give multiple recommendations:
− Avoid inadequate or incomplete wording (e.g. asking “How old are you?”
is better than “Age?”.)
− Avoid poorly defined terms (e.g. “Do you favor or oppose gun control
legislation?” can be interpreted in many ways, given that gun control
legislation can mean anything from banning the sale of guns to asking people
to register their guns.)
− Avoid multiple questions (e.g. “Do you want to be rich and famous?”, which
is obviously problematic since the respondent might want to be one but not
the other.)
All of the above, among other recommendations from the author was taken into
consideration when designing the questions of the survey. In addition, the survey
was proofread by six people independent of the research group. Once that had been

13
done, the survey was tested on 50 respondents where feedback was collected and
used to make final adjustments.
The survey consisted of five sections: (1) screener, (2) voice assistant usage and
attitudes, (3) psychographics, (4) kano questions on chosen attributes and (5)
demographics. The screener is the section of the survey where certain answers on a
question may lead to skipping a number of other questions (Dillman, 2007). In this
case, it could happen that respondents skipped all the subsequent sections of the
survey, in other words, the respondents would be terminated and were not allowed to
finish the survey. This was based on questions that made sure that the respondents
were frequent users of voice assistants, which was a prerequisite to understand the
subsequent questions and to ensure high quality and insightful data. A full overview
of the survey and the questions can be found in the appendix.
The sample aim was 400 respondents for each of the three environments:
smartphone, smart speaker and car. The questions for (2) voice assistant usage and
attitudes and (4) kano questions on chosen attributes were specific to a certain
environment, meaning e.g. what the respondent would use a voice assistant on a
smartphone for. Each respondent got assigned to a certain environment based on
the one with least number of respondents. Meaning that, if there were already 8
respondents assigned to smartphone, 4 to smart speaker and 3 to car, the next
respondent would be assigned to see questions about car, given that the respondent
was a user of car voice assistants.
Once the answers had been collected from the respondents, it needed to be codified
to simplify the analysis. Though, this is done automatically by the software used
when programming the survey. Lastly, the data needed to be cleaned. This was done
by using a common method introduced by Fowler (2013), by running a set of overall
distributions for the questions and eliminating the respondents that are outliers.
2.3.4 Ethical considerations
The ethical considerations for this thesis regard the interviews and survey. According
to Bryman and Bell (2011) there are four main ethical areas that should be
considered when conducting business research:
− whether there is harm to participants
− whether there is a lack of informed consent
− whether there is an invasion of privacy
− whether deception is involved
Regarding the interviewees, all of the them were informed about the purpose prior to
the interviews. Further, any recordings and data collected were approved by the
interviewees prior to the publishing of this thesis. When it comes to the respondents
14
of the survey, every respondent agreed to terms and conditions of survey
participation, agreeing that the data collected is to be used for market research
purposes. Lastly, the researchers guaranteed the respondents that the information
and opinions they share are completely anonymous and confidential. Thus, no
respondent specific data will be presented in this thesis, only data on an aggregated
level.
2.4 Research quality
Bryman & Bell (2011) present three criteria that should be used when assessing the
quality of a business and management research. The three criteria are reliability,
replicability and validity.
2.4.1 Reliability
Reliability is about consistency when measuring concepts and can be broken down
into three components (Bryman & Bell, 2011). First sub-component is the stability of
measure over time, e.g. sending out a survey to a group at two different times
generates more or less the same answers. Second, the internal reliability of the
researcher, meaning the indicators that make up the scale or index should be
consistent. Robson & McCartan (2015) argues in line with Bryman & Bell, but group
the first two components above as intra-observer consistency instead of treating
them individually. Lastly, inter-observer consistency, which occurs when there is
more than one researcher, and when the researchers subjectively translate data into
categories, e.g. answers to open-ended questions that need to be categorized
(Bryman & Bell, 2011).
The results from the main data collection component of this thesis, which is the
survey, will certainly change over time. Although not being relevant for this thesis,
there will likely be difficulties in assuring the stability of measure over time. The
second and third sub-component was not a problem by the researchers as the
analysis was done jointly.
2.4.2 Replicability
Replicability is a criterion that is similar to reliability in many aspects (Bryman & Bell,
2011). In some cases, researchers decide to replicate the findings of others. This can
be due to various reasons, such as the findings not being in line with other similar
research or the researcher not being authoritative enough. Bryman & Bell (2011)
continue by saying that in order for a replication to take place, the study itself must
be capable of being replicated. By this, the authors mean that the researchers need
to lay out their procedure in detail on how the study has been conducted, in order for
other researchers being able to replicate it. Moreover, Robson & McCartan (2016)

15
take it one step further and argue that a finding is not considered secure until it has
been independently replicated on multiple occasions.
Despite the importance of replicability, both Bryman & Bell (2011) and Robson &
McCartan (2016) state that replicability in business and management research,
which typically is of the qualitative nature, is unusual or even impossible. Specifically
due to the difficulty in repeating a study with the exact same people in the exact
same situation.
The researchers of this thesis aimed to as clearly as possible lay out the steps used
throughout the thesis, both for the interviews and the survey, to allow for the highest
degree of replicability as possible. Though, as Bryman & Bell (2011) and Robson &
McCartan (2016) state, the replicability of the interviews may be close to impossible.
Further, it will also be difficult to achieve the exact same results of the survey, as
people’s behavior and perception change over time.
2.4.3 Validity
The last and most important criterion is validity. It is about the integrity of the
conclusions drawn from the conducted study (Bryman & Bell, 2011). Bryman & Bell
(2011), and to some degree Robson & McCartan (2016), introduce four common
types of validity, namely measurement validity, internal validity, external validity and
ecological validity.
− Measurement validity is about whether the measurement of a concept
actually reflects what it is supposed to, e.g. if the results of an IQ test actually
reflects a person’s intelligence.
− Internal validity concerns causality, meaning whether a conclusion based on
an independent variable causing a dependent variable is correct or not, in
other words, if the chosen independent variable really is causing the
dependent variable to change or if it is another variable that was not
considered.
− External validity can simply be described as whether the results of a study
can be generalized further than the specific research context, which in order
to be that, requires a thoughtful and representable sampling process.
− Ecological validity considers the fact that a considerable amount of
research is done in unnatural settings, such as in a laboratory or a special
room where interviews take place. This leads to concerns on whether the
findings are applicable to people’s ordinary everyday life.

16
All of the above except internal validity are regarded as relevant for this thesis. When
it comes to the measurement validity, the researchers cannot guarantee that the
analysis based on the survey data truly reflects how people behave or think, but
guidelines on all methodologies and questions used have been carefully followed to
assure this to the highest degree possible. Further, this thesis has used a
professional fieldwork agency, called DISQO, to ensure the external validity by
having a representable sample for the survey. Lastly, ecological validity is highly
relevant, whether people actually behave or think the same way in reality compared
to what they answer on a survey. It is out of this thesis scope to be able to ensure
ecological validity as this could likely be a thesis topic in itself.

17
3 Theory
The theory chapter will introduce the reader to voice assistants and how they work,
and then move onto covering consumer behavior, including relevant components that
are used when conducting a research survey. Lastly, the kano model is introduced,
which is a method used in this thesis to understand consumer preferences. The
subchapter regarding voice assistant technology is included to give the reader some
context and interesting background information, while the consumer behavior and
kano model is needed to understand the results & analysis section.
3.1 Natural language processing (NLP)
The technology behind voice assistants has many different components, but a
common overarching name of the language technology is natural language
processing (Jurafsky & Martin, 2009). NLP utilizes artificial intelligence (AI), meaning
intelligence demonstrated by machines instead of humans, and large data sets to a
large extent to achieve its purpose of communicating with a human. The following
subchapter begins by giving a brief introduction to the laws of human language and
then introduces the four main components of NLP: automatic speech recognition
(ASR), natural language understanding (NLU), natural language generation (NLG)
and text-to-speech (TTS).
Figure 3.1: Illustration of how a voice assistant communicates with a human based
on Jurafsky & Martin (2009)
3.1.1 Knowledge of speech and language
The main difference between language processing systems, such as Alexa, and
other data processing systems is the need to understand how human language
18
works and is structured (Jurafsky & Martin, 2009). Some of the laws of speech and
language that will be briefly introduced below include phonetics and phonology,
morphology, syntax, semantics and pragmatics.
In order to allow speech recognition to take place, which will be further introduced
below, the voice assistant requires knowledge about phonetics and phonology,
meaning how words are produced in terms of sequences of sound and how the
sounds vary based on grammatical differences (Kügler, Féry, & Vijver, 2009).
Further, voice assistants need to have the knowledge of the many variants a word
can be present in, such as singular or plural (door versus doors), abbreviations
(cannot versus can’t) and so on, which is also known as morphology (Jensen,
1990). Taking it one step further of individual words, voice assistants must be able to
understand how to structure and string words together to build a sentence that
makes sense. Jurafsky & Martin (2009) give an example of a sentence that will not
make sense although it contains the exact same words as the correct intended
sentence: “I’m I do, sorry that afraid Dave I’m can’t”. The knowledge required to
return the correct sentence, “I’m sorry Dave, I’m afraid I can’t do that”, is called
syntax.
Now, consider the question “How much silk was imported to Western Europe in
1950?”. Voice assistants need to know what exactly “silk” and “import” means and
what exactly is intended by “Western Europe”. The knowledge of what individual
words mean is called lexical semantics and the knowledge to understand the
combination of “Western” and “Europe”, and what it exactly refers to is called
compositional semantics (Jurafsky & Martin, 2009).
Lastly, the reason many humans are comfortable talking with voice assistants
through their everyday life, is their ability to be polite. Take the example above, “I’m
sorry Dave, I’m afraid I can’t do that”, could have simply been expressed as “No”.
The knowledge required to answer questions with polite phrases, such as “I’m afraid”
or “I’m sorry” is called pragmatics (Jurafsky & Martin, 2009).
3.1.2 Automatic speech recognition (ASR)
The first thing that needs to happen when a human speaks to a voice assistant, is for
the voice assistant to recognize words from a speech signal, also known as
automatic speech recognition (Jurafsky & Martin, 2009). In other words, the goal of
ASR is to computationally translate a speech signal to a string of words, illustrated
below.

19
Figure 3.2: Illustration of automatic speech recognition based on Jurafsky & Martin
(2009)
There are a number of dimensions that affect the word error rate, meaning how well
an ASR system can recognize words, e.g. vocabulary size, type of speech, noise,
and accent of the speaker (Jurafsky & Martin, 2009).
The first dimension, vocabulary size, is something that have become larger and
larger over time (Sen, Dutta & Dey, 2019). Intuitively, speech recognition becomes
more difficult when number of possible words increase. A system that is only set out
to identify a “yes” or “no” answer or the digits from zero to nine, will have a much
smaller error rate than a system trying to create a string of words based on a
conversation between two humans, which cover up to 60 000 words.
The type of speech can vary between isolated words and continuous speech (Sen
et al., 2019). Isolated word recognition can simply be explained by when the speaker
takes relatively long pauses between each word. In contrast to continuous speech,
where words more or less overlap and have to be segmented. Jurafsky & Martin
(2009) further break down continuous speech into two types, read speech and
conversational speech. Read speech is when a human speaks to a machine while
conversational speech is when two humans talk to each other. Recognizing the
words from a human-to-human conversation is more difficult than a human-to-
machine. Apparently, humans speak more slowly and clearly when talking to a
machine.
Noise of any kind that does not come from the intended speaker, such as noises
from the environment, is also something that the ASR system must be able to
remove and distinguish words from in order to be successful (Yu & Deng, 2015).
Lastly, the accent of the person speaking is something that affects the error rate
(Jurafsky & Martin, 2009). For example, foreign-accent speech or speech of children
is harder to distinguish words from. Tomokiyo (2001) states that strongly Japanese-
accented or Spanish-accented English has about 3 to 4 times higher word error rate
than a native English speaker.

20
Voice assistants, such as Siri, Google and Cortana, all utilize a crucial technology
called Large-Vocabulary Continuous Speech Recognition (LVCSR) (Yu & Deng,
2015). LVCSR is, as one can understand from the name based on above, a system
with a vocabulary of 20 000 to 60 000 words, being able to recognize continuous
speech, independent of who the speaker is (Jurafsky & Martin, 2009).
3.1.3 Natural language understanding (NLU)
Once human speech has been transcribed into text with the help of ASR, the next
step is to understand the actual meaning of the words. In other words, NLU is about
interpreting a given text, as close as possible to how the average human would
(Khashabi, 2019).
NLU typically performs two types of tasks to achieve this, (1) classifying the dialog
act type or (2) named entity recognition (Liu, Eshghi, Swietojanski & Rieser, 2019).
Examples of dialog act types include a request for action, a question, or a statement.
Named entity recognition is about organizing unstructured text into predefined
categories, such as person, organization, location or time. An example of how this
works can be seen below.
− “Order me a 6-pack of Heineken beer to 315 West 77th Street”
Dialog act: Request for action
Named entities: “6-pack of Heineken beer” (product) and “315 West 77th Street”
(location)
Two of the most well-known challenges with NLU are ambiguity and variability
(Khashabi, 2019). Ambiguity occurs when trying to make sense of a specific word,
which can be obvious for humans in certain contexts, but not necessarily for
computers. A single word, such as car, can have multiple meanings. Variability is
basically the opposite, when multiple words in a conversation or text refer to the
same meaning, such as “John J. Hug”, “the salesman”, and “he” or “him”. The above
challenges are illustrated below.

21
Figure 3.3: Ambiguity (left) and variability (right) (Khashabi, 2019)
3.1.4 Natural language generation (NLG)
After the voice assistant has understood what the human has said, it needs to
construct an answer, which is done with NLG. NLG can be regarded as the opposite
of NLU. An NLG system needs to understand how put to concepts into words. It is
about generating language that makes sense and is coherent to humans
(Santhanam & Shaikh, 2019).
In the early days of NLG, a system generated language based on a number of fixed
rules. Though, the problem with using such a system, is that it is very constrained
and cannot produce various unique responses. The more common traditional system
is the domain-based system, which can generate responses based on knowledge
bases and large structured data sets. Examples of application areas for domain-
based systems are weather reports, sports reports, restaurant bookings, which are
typical for voice assistants (Santhanam & Shaikh, 2019; Cervone et al., 2019).
The NLG process can be broken down into two phases, (1) content planning (what to
say) and (2) sentence realization (how to say it) (Jurafsky & Martin, 2018). Content
planning is done by assigning pieces of information from structured data sets into so
called slots (Jurafsky & Martin, 2018 and Cervone et al., 2019). This can for example
be collected from Google’s or Amazon’s extensive data sets, websites, and email or
social media accounts. Sentence realization is done by first utilizing large data sets
of human-to-human conversations to build a sentence with open slots to be filled in,
followed by filling these slots with the pieces of information from the content planning
(Jurafsky and Martin, 2018). An example of how this works can be seen below.

22
− “From where and what time does my flight depart tomorrow?”
Content planning: “PGH” (depart_airport) and “10 am” (depart_time)
Sentence realization (1): Your flight departs from (depart_airport) airport at
(depart_time)
Sentence realization (2): “Your flight departs from PGH airport at 10 amt”
3.1.5 Speech synthesis
Speech synthesis, also known as text-to-speech (TTS), is the last step for a voice
assistant in order to complete one conversational exchange. Speech synthesis is the
opposite of ASR, simply producing speech (acoustic waveforms) from the text
constructed through NLG (Taylor, 2009).
Figure 3.4: Illustration of speech synthesis / text-to-speech (TTS) based on Jurafsky
& Martin (2009)
The above process is performed in two steps called (1) text analysis and (2)
waveform synthesis. In the text analysis, the system will expand acronyms and
convert words into phones (speech sounds). This is followed by the waveform
synthesis, which is typically based on previous samples of speech that are chopped
up, and that can be combined and reconfigured to create the desired sentence
(Jurafsky & Martin, 2009).
Take the acronym “PG&E” as an example. The first step is to expand the acronym
into the words “P G AND E”. This is followed by converting “P G AND E” into phones.
Table 3.1: Words broken down into phones (Jurafsky & Martin, 2009)
Word P G AND E
Phone p iy jh iy ae n d iy
The system then finds and combines the chopped samples of speech for each
phone, which will equal the desired acoustic waveform. The acoustic waveforms are
then played by the voice assistant, and suddenly, a human-to-machine conversation
has taken place.
23
3.2 Consumer behavior
Consumer behavior is the study of understanding how consumers select, purchase,
and use products and services (Solomon, Dahl, White, Zaichkowsky & Polegato,
2014). Consumers can take many forms, including eight-year-old children begging
for Pokémon cards to a young-adult deciding whether to buy a voice assistant
speaker or not. A consumer’s purchase decisions and adoption of products are
widely influenced by the person’s interests, the person’s friends’ opinions, age and
gender, and so on (Solomon et al., 2014). This section will give an introduction to
consumer behavior and characteristics that are important in many marketing
applications.
3.2.1 Consumer adoption of high-tech products
When consumers are introduced to a new product or service, it can either require
them to change their current mode of behavior or not change it (Moore, 2014). Moore
(2014) calls products and services that change consumer behavior for discontinuous
innovations. For example, when the smartphone was introduced and completely
changed the way consumers interacted with a phone, allowing them to take actions
by touching the screen instead of pressing limited number of buttons. The contrasting
term, continuous innovations can be seen when a company introduces a “new
innovative toothpaste”, which uses micro-crystals and will make your teeth whiter in
two days, but in the end, the consumer still uses the toothpaste in the same way on
their toothbrush, and brushes their teeth the same way as before.
Conventional industries introduce discontinuous innovations every now and then,
while high-tech industries frequently introduce them (Moore, 2014). As a result, high-
tech industries needed a marketing model that could handle these kind of product
introductions - the technology adoption life cycle. The technology adoption life cycle
is a model illustrated as a bell curve, aiming to describe the adoption of high-tech
products, and how demographic and psychological characteristics have an impact.

24
Figure 3.5: The technology adoption life cycle (Rogers, 2010; Moore, 2014)
The model, which originates from Rogers (2010), divides consumers into five
categories, namely innovators, early adopters, early majority, late majority and
laggards.
− Innovators are usually part of a small social network, have substantial
financial resources, can understand and apply technical knowledge, and the
ability to take risks and cope with a high degree of uncertainty.
− Early adopters are similar to innovators, but part of the bigger social system
and has the highest degree of opinion leadership. They are respected by their
peers, and potential adopters typically look to early adopters to see if they
approve the new product or not.
− The early majority often interact with their peers but do not have a particular
opinion, they adopt just before the average person, and is an important link
between very early and relatively late adopters.
− The late majority are skeptical and typically adopt because of a combination
of economic necessity and peer pressure. They wait until the majority of
people have adopted when most of the risks with the new idea are gone.
− Laggards are typically conservative, isolated from the social system and are
the last to adopt to new ideas. The laggard’s insecure financial situation might
force the individual to be very careful in adopting innovations.
As can be seen in the figure above, there is a gap between early adopters and early
majority, called the chasm. The chasm illustrates the great difference between the
early market, consisting of innovators and early adopters, and the mainstream

25
market, consisting of early majority, late majority and laggards (Meade & Rabelo,
2004; Moore, 2014). The chasm is where most new innovations typically fail (Meade
& Rabelo, 2004).
3.2.2 Demographic factors
Demographics is the study of segmenting a market based on quantitative factors
such as age, gender, income, occupation, life stage, education, nationality and social
class (Kotler & Keller, 2011; Makgosa & Sangodoyin, 2017; Solomon et al., 2014).
One reason demographic segmentation is widely popular is that consumer wants,
needs and preferences can in many cases be associated with demographic factors
(Kotler & Keller, 2006).
Age is a variable that show how consumers’ change what goods and services they
buy over a lifetime (Armstrong, Adam, Denize & Kotler, 2014). The preferences for
type of food, clothes and furniture are often related to age. Kotler & Keller (2011) give
an example of this with toothpaste companies like Colgate who typically have three
main product lines, including kids, adults and older consumers.
Despite being the same age, people’s life stage might be different. Life stage
describe major events in a person’s life (Kotler & Keller, 2011). For example, this can
be a person going through a divorce, getting married, getting enrolled at a university
or buying a new home. Marketers can use these events to come up with products
and solutions that help people during those times.
Women and men tend to have different preferences, which can be influenced both by
genetics and the social settings (Kotler & Keller, 2011). Gender segmentation has
been used for a long time in industries such as clothing, hairstyling and magazines.
Gillette’s Venus line for women is a successful example of how a certain gender is
targeted. Venus mastered product design, packaging and advertising that appeal to
women.
A person’s occupation is another factor that affects what goods and services are
being purchased (Armstrong et al., 2014). One simple example of this is how blue-
collar workers typically buy rough and durable clothes, while business people and
office workers are more into shirts and suits.
There are many other demographic factors, but the general idea of what
demographics is about should be clear after the given examples.

26
3.2.3 Psychographic factors
Psychographics is the study of using psychology to segment and understand
consumer behavior (Kotler & Keller, 2011). In contrast to demographics,
psychographics can be seen as a qualitative method where consumers are
segmented based on e.g. personality traits, lifestyle, and beliefs and attitudes.
Psychographics completes demographic segmentation, since people within a certain
demographic group might have various psychographic profiles (Kotler & Keller,
2011).
A consumer’s personality is something that distinguishes the person from others
Armstrong et al., 2014). Examples of how personality traits are described include
self-confidence, dominance, sociability, autonomy, defensiveness, adaptability,
aggressiveness, and so on. Just like consumers, brands also have personalities, or
at least marketers try to give them personalities. The reason why personalities are
useful when studying consumer behavior, is the fact that people tend to like brands
with personalities that are similar to their own (Armstrong et al., 2014). Many well-
known brands get associated with certain traits, for example Gucci with “class” and
Washington Post with “competence”.
Lifestyle on the other hand, is more than a person’s personality or social class, it
outlines a person’s entire way of interacting with the world, including products and
services (Armstrong et al., 2014). It can be expressed as a person’s interests,
activities and opinions. Solomon et al. (2004) state that a person’s lifestyle
represents what the person is spending money on, whether it is high proportions
allocated to buying fancy food or to buying the latest technology. Armstrong et al.
(2014) give an example on how REI (Recreational Equipment, Inc.), an outdoor
outfitter company like Naturkompaniet in Sweden, sells more than outdoor gear and
clothing. The entire brand breaths an outdoor lifestyle, including the personnel that
work there, the advertising and even the REI-sponsored outdoor travel adventures.
Solomon et al. (2014) reinforces this thought by saying that consumers chooses and
buys products that help them express their social identities, such as being an active
outdoor person in this case.
Beliefs and attitudes are two other important factors in psychographics that
marketers care about. Consumers’ beliefs in certain brands or products will affect
whether or not they will purchase it, and this is something that marketers want to
understand (Armstrong et al., 2014). Say that a consumer has a belief that is
incorrect about a brand, then the brand would want to communicate with that certain
consumer, e.g. through an ad, in a way that corrects her or him. Attitudes affects
buying decisions in a similar way. Armstrong et al. (2014) describe attitude as a

27
person’s relatively consistent evaluations, feelings and tendencies toward a certain
product or service. A good example presented is how people generally think that “the
Japanese make the best electronics products in the world”. Since attitudes are hard
to change, companies should aim at fitting their products into already existing
attitudes rather than try to change them (Armstrong et al., 2014). Though, it is worth
keeping in mind that this does not always have to be the case.
3.2.4 Consumer purchasing process
Purchasing a product is not a single activity, it follows a sequence of steps, called the
consumer purchasing process, by Bennett (2010). The consumer purchasing
process involves the purchase itself, as well as the initial need/want recognition,
information search leading up to the purchase, and usage and evaluation after
purchase. According to Bennett (2010), the process may look very different from one
consumer to another, and each of the steps may only take an instant or it may
require a lengthy process in itself.
What each individual’s process and what the steps look like depend on the situation,
such as attitudes, financial status, the level of involvement in the purchase and other
influences (e.g. marketing). As such, it is important for marketing professionals to
know the consumer behavior in each of the phases in order to optimize use of the
marketing mix (product development, pricing, distribution and marketing
communications). Successfully adapting to the consumers’ purchasing process will
narrow down the consumers’ choice of options.
Figure 3.6: Consumer purchasing process (Bennett, 2010)
28
1. Need / want recognition
The consumer purchasing process start with the recognition of a need or want
(Bennett, 2010). Distinguishing a need from a want could be done with a basic
example. For example, a consumer needs to drink, for health reasons. The
consumer may, however, want to drink Coca Cola or another type of drink or brand,
for different reasons. These two modes of recognition could work in combination,
called the Simultaneous Model of Needs and Wants according Mowen (2000). It is
therefore important for marketing professionals to leverage the need / want
recognition phase to speak both to a consumer’s needs as well as wants.
2. Information search
Information search is the first reaction to the need / want recognition, and serves the
purpose of gathering information on which an evaluation can then be based in the
next phase (Bennett, 2010). The amount of information and effort needed to evaluate
alternatives depends on a number of different factors, to name a few:
− Level of involvement with the products (importance, usage frequency, image,
etc.)
− Price
− Complexity of the product/service
− Number of times the product has been purchased before
− Consequences of making a poor choice
Information search can be divided into two types, internal search and external search
(Bennett, 2010). Internal search where you gather what you already know and
external search where you seek additional information from external sources.
Subsequently, it is important for marketing professional to not only offer sufficient
information upon request or through external search, but also create recognition and
positive reception for the brand.
3. Evaluate alternatives
Feasible alternatives emerge from the information search and an evaluation and
comparison of alternatives rest on the information search (Bennett, 2010). The goal
for marketing experts in this phase is to understand the evaluation criteria and adapt
their marketing accordingly. An important notion here is that different segments may
have different evaluation criteria and therefore value the same product or service
differently (Makgosa & Sangodoyin, 2018).
4. Purchase decision
Probability for purchasing a product increases if a consumer has gathered positive
research and influences in the previous stage (Bennett, 2010). Purchase intent is a
metric commonly deployed among marketers. Tools such as promotions, meaning
offering a discounted price, are leveraged to increase purchase intent and ideally
lead to a positive purchase decision.

29
5. Purchase act
After deciding to purchase a certain product or service, the actual purchase act takes
place (Solomon et al., 2014). According to Bennett (2010), consumers are looking to
save as much time and energy on a purchase as possible. The focus for marketing
professionals in this phase is therefore to develop innovative ways of simplifying the
purchase of a product or service, such as making it possible to purchase online.
6. Product usage / evaluation
The actual usage of a product is important both to the consumer and to marketing
professionals (Bennett, 2010). It is in this phase that consumers evaluate whether
the product fulfills their needs and expectations, which affects their beliefs about a
particular brand.
A consumer will either feel satisfaction or dissatisfaction with a product, related to
their expectations. As a product or service consists of many different attributes,
certain attributes may cause satisfaction, other may cause dissatisfaction and some
will go completely unnoticed. As consumer satisfaction or dissatisfaction with a
product and its attributes will affect their brand perception, it will in turn affect future
purchases. Further, the consumers’ perception of a brand can influence how other
consumers perceive a brand through word of mouth.
3.3 Kano model
The kano model is a theory and method to assess attributes of products and
services, and how they affect customer satisfaction (Kano, 1984). Kano introduce
five types of qualities, also known as requirements, that affect customer satisfaction
in different ways when achieved, described below (Kano, 1984 and Matzler,
Hinterhuber, Bailom & Sauerwein, 1996).
30
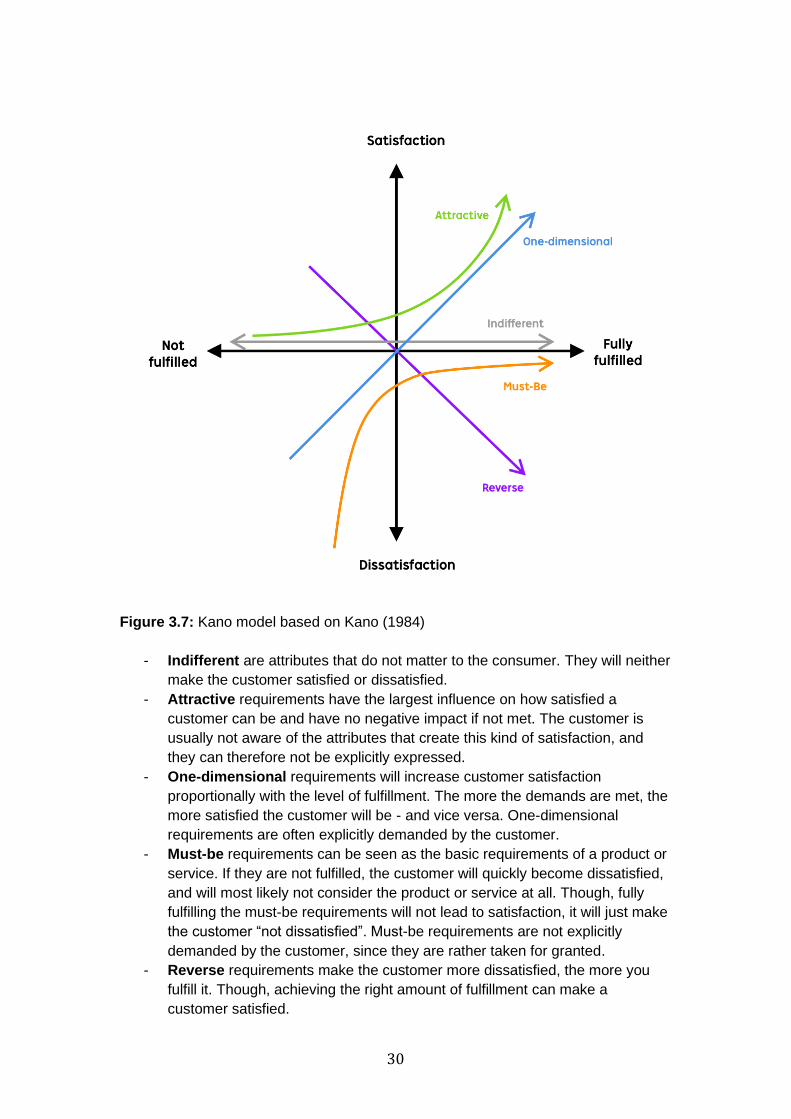
Figure 3.7: Kano model based on Kano (1984)
- Indifferent are attributes that do not matter to the consumer. They will neither
make the customer satisfied or dissatisfied.
- Attractive requirements have the largest influence on how satisfied a
customer can be and have no negative impact if not met. The customer is
usually not aware of the attributes that create this kind of satisfaction, and
they can therefore not be explicitly expressed.
- One-dimensional requirements will increase customer satisfaction
proportionally with the level of fulfillment. The more the demands are met, the
more satisfied the customer will be - and vice versa. One-dimensional
requirements are often explicitly demanded by the customer.
- Must-be requirements can be seen as the basic requirements of a product or
service. If they are not fulfilled, the customer will quickly become dissatisfied,
and will most likely not consider the product or service at all. Though, fully
fulfilling the must-be requirements will not lead to satisfaction, it will just make
the customer “not dissatisfied”. Must-be requirements are not explicitly
demanded by the customer, since they are rather taken for granted.
- Reverse requirements make the customer more dissatisfied, the more you
fulfill it. Though, achieving the right amount of fulfillment can make a
customer satisfied.

31
Over time, a product/service attribute generally moves from being indifferent to
attractive to one-dimensional to must-be. In other words, over time an attribute will
create less satisfaction when it is present and more dissatisfaction when it is not
present (Matzler et al., 1996).
A certain product/service attribute can be classified as one of the five above qualities
by using a structured questionnaire consisting of a pair of questions for each attribute
(Mikulić and Prebežac, 2011 and Matzler et al., 1996). The pair of questions consists
of a functional and dysfunctional question. The functional question asks how the
consumer would feel when the attribute is present, while the dysfunctional question
asks how the consumer would feel when the attribute is not present. Collected
answers for each pair of questions are then used in an evaluation table and the
quality with the highest frequency can be seen as the final quality of an attribute
(Mikulić and Prebežac, 2011 and Matzler et al., 1996).
Table 3.2: Kano evaluation table (Matzler et al., 1996)
In addition to the qualities indifferent, attractive, one-dimensional and must-be, there
is one called questionable in the figure above. This stands for questionable result, it
is not a quality itself, instead it means that the question was phrased incorrectly or
that the respondent did not pay good enough attention (Matzler et al., 1996).

32
Figure 3.8: Kano evaluation process (Matzler et al., 1996)
Above figure shows the process of how an attribute is categorized into a certain kano
category. In this case, the attribute was categorized as one-dimensional.

33
4 Results & Analysis
This chapter begins by giving a brief background to how the survey has been
conducted, followed by presenting the analyzed empirical data with comments. The
reason that the results and analysis have been combined into one chapter is to
facilitate for the reader, so that the reader does not have to jump between sections to
understand the insights found from the empirical data.
4.1 Sample
Total number of respondents for the conducted survey was 5222. Out of these 5222
respondents, 1731 finished the survey. The other 3491 respondents were either
screened out or disqualified because enough respondents had already been
assigned to a certain environment. For example, smartphone voice assistant users
were more common and thus that quota was filled quicker, compared to the less
common car voice assistant users. Therefore, many respondents that were
smartphone voice assistant users but not car voice assistant users, were disqualified
because enough respondents had already been assigned to answer questions about
smartphone voice assistants.
The 1731 respondents that finished the survey went through a data cleaning process
where 531 respondents were cleaned out based on two criteria: (1) time to finish the
survey, (2) contradictory answers during the kano questions. After cleaning, data
from 400 respondents in each environment remained, totaling a final sample size of
1200 respondents.
4.2 Demographics
As mentioned in the method section, demographic questions were asked to get an
overview of the final sample set, as well as to being able to conduct further analysis.
The demographic factors that were considered are gender, age, parent/non-parent,
living status, education, occupation and income. Only gender, age and income are
presented below for the 1200 respondents, the complete list of demographic factors
can be found in appendix.
Figure 4.1: Gender breakdown
The gender breakdown is distributed similarly to the natural gender ratio in the US
(Census, 2019), indicating that voice assistants are used regardless of gender.

34
Figure 4.2: Age breakdown
The majority of respondents (51%) are aged between 25 to 44, meaning that young
adults are more likely to use voice assistants.
Figure 4.3: Total income for household breakdown
The income breakdown is also distributed similarly to the natural income ratio in the
US (Census, 2019), meaning that voice assistants are used regardless of income.
4.3 Psychographics & tech adoption
Respondents were categorized into tech adoption categories to allow further
segmentation analysis, meaning identifying differences in how e.g. early tech
adopters behave compared to late tech adopters. The categorization was done with
the help of the following psychographic multi-question.
“How much do you agree or disagree that each of the following statements about
technology describe you?”

35
The distribution of how the respondents answered on the question can be seen
below.
Figure 4.6: % of respondents that selected each alternative
The tech adoption categories are not identical to the ones presented by Rogers
(2010). The reason for this is because there were no methods found throughout the
literature review on how to categorize consumers into innovators, early adopters,
early majority, late majority and laggards. Instead, the above question was
constructed based on SKIM’s internal expertise on how to categorize respondents
into three different tech adoption categories: early tech adopters, mid tech adopters
and late tech adopters. The method has previously been used by SKIM on other
projects with a successful outcome.
Respondents were categorized by first summarizing their total score for the above
question. Points were assigned for each response, from Disagree (1 points) to Agree
(5 points), meaning that the total possible score is 15 points. Respondents were then
categorized based on the following intervals.
- Early tech adopters (13-15 points)
- Mid tech adopters (10-12 points)
- Late tech adopters (3-9 points)
36
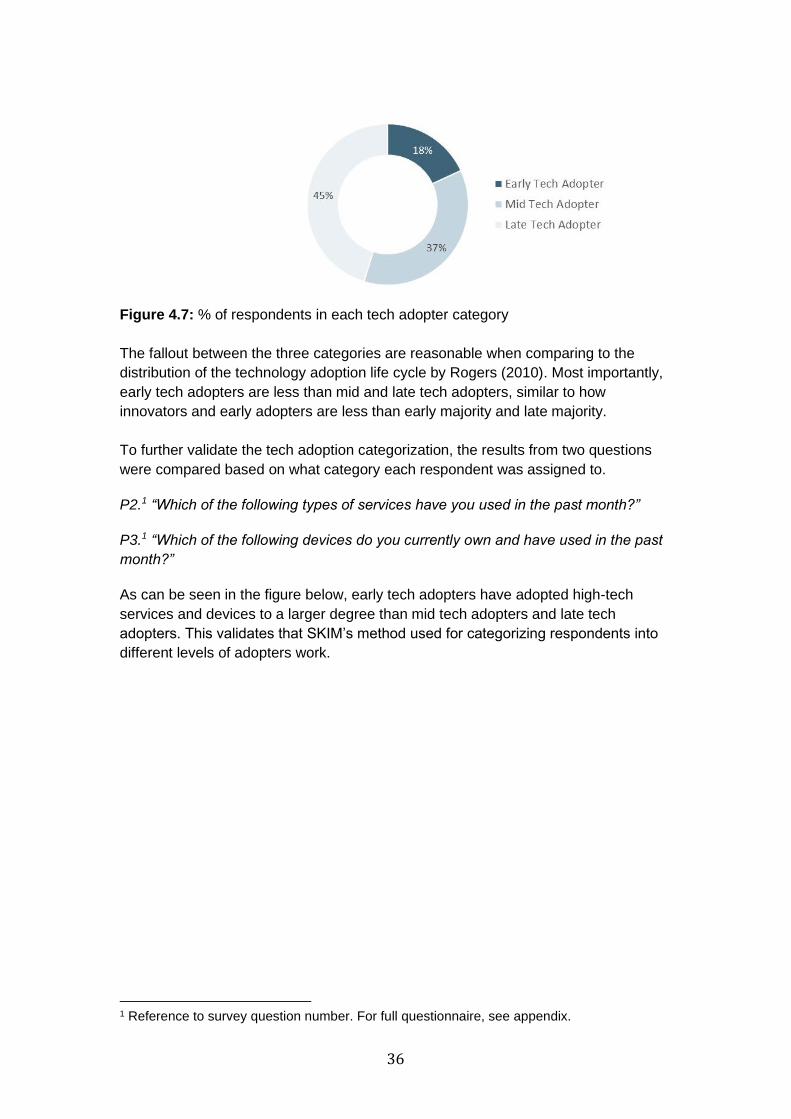
Figure 4.7: % of respondents in each tech adopter category
The fallout between the three categories are reasonable when comparing to the
distribution of the technology adoption life cycle by Rogers (2010). Most importantly,
early tech adopters are less than mid and late tech adopters, similar to how
innovators and early adopters are less than early majority and late majority.
To further validate the tech adoption categorization, the results from two questions
were compared based on what category each respondent was assigned to.
P2.1 “Which of the following types of services have you used in the past month?”
P3.1 “Which of the following devices do you currently own and have used in the past
month?”
As can be seen in the figure below, early tech adopters have adopted high-tech
services and devices to a larger degree than mid tech adopters and late tech
adopters. This validates that SKIM’s method used for categorizing respondents into
different levels of adopters work.
1 Reference to survey question number. For full questionnaire, see appendix.

37
Figure 4.8: Selection of services and devices by tech adoption category
4.3.1 Demographics of tech adopters
The tables below show the tech adopter distribution by demographic factors gender,
age and income. For example, 51% of females tend to be late tech adopters while
the corresponding number for males is 39%.
Figure 4.9: Tech adopter distribution by gender
Figure 4.10: Tech adopter distribution by age

38
Figure 4.11: Tech adopter distribution by total household income
The above numbers tell the story that early and mid tech adopters are more likely to
be men and late tech adopters are more likely to be women. Moreover, early tech
adopters are generally younger while late tech adopters are older. This aligns well
with what Snook (2018) states in his research: particularly young men are more likely
to purchase high-tech products, such as smart speakers. Lastly, looking at the
income distribution for tech adopters, there are no significant trends except for the
income range $150,000 - $249,999, where there are noticeably more early tech
adopters and less late tech adopters. Though, the overall insight is that a person’s
income level does not necessarily affect how early they adopt new tech products.
4.4 Kano results & analysis
Six attributes of voice assistants were evaluated with the kano method: accuracy,
confidentiality, ads-free, recommendations-free, shopping and ordering food. These
attributes were chosen based on information collected through the interviews. Each
attribute can be understood more in detail by reviewing the kano questions below.
Accuracy
Functional
“How would you feel if you had a successful conversation with your voice
assistant, meaning that the voice assistant understands you and returns an
answer/action you would expect?”
Dysfunctional
“How would you feel if you did not have a successful conversation with your voice
assistant, meaning the voice assistant does not understand you or does not return an
answer/action you would expect?”
Confidentiality
Functional
“How would you feel if the voice assistant was 100% trustworthy and never
recorded any part of your conversation?”
Dysfunctional
“How would you feel if the voice assistant sometimes recorded parts of the
conversation between the two of you?”
39
Ads-free
Functional
“How would you feel if your voice assistant never played ads randomly?”
Dysfunctional
“How would you feel if your voice assistant occasionally played ads randomly?”
Recommendations-free
Functional
“How would you feel if your voice assistant did not give you unprompted
recommendations when you are having a conversation?”
Dysfunctional
“How would you feel if your voice assistant did give you unprompted
recommendations when you are having a conversation?”
Shopping
Functional
“How would you feel if you were able to shop products with your voice assistant?”
Dysfunctional
“How would you feel if you were not able to shop products with your voice
assistant?”
Ordering food
Functional
“How would you feel if you were able to order food with your voice assistant?”
Dysfunctional
“How would you feel if you were not able to order food with your voice assistant?”
Once the answers had been collected from all respondents, each attribute got
categorized as indifferent, attractive, one-dimensional, must-be or reverse on a
respondent-level by using the kano evaluation table presented in the theory section.
The distribution of kano qualities for an attribute were then divided by respondents
that were considered as voice assistant users of a smartphone, smart speaker or car.
The kano classification for each attribute is the one with the highest percent of
respondents. Each attribute and its kano classification are shown below. For an
overview of the distribution across all the kano qualities, see appendix.

40
Table 4.1: Kano quality category by smartphone, smart speaker and car users
Type of user
Kano quality Smartphone Smart speaker Car
Accuracy Attractive Attractive Attractive
Confidentiality One-dimensional One-dimensional One-dimensional
Ads-free Attractive Attractive Attractive
Recommendations- free
Indifferent Indifferent Indifferent
Shopping Indifferent Indifferent Indifferent
Ordering food Attractive Attractive Attractive
An overarching analysis of the kano results is that there are slight differences in how
consumers value different attributes on their smartphone versus on their smart
speaker versus in their car, which can be seen by looking at the kano distribution
tables in appendix. In the end though, the final kano classification for each attribute is
the same across all type of users.
Despite the fact that there are no differences between different types of voice
assistant users, there are differences when comparing kano qualities between the
different attributes. Attributes that are indifferent are less important while attributes
that cause dissatisfaction, e.g. one-dimensional attributes, can be treated as more
important than others (Matzler et al., 1996). For example, when using voice
assistants, the average consumer does not care whether the voice assistant gives
them recommendations or not, or if they are able to shop or not on their voice
assistant. When it comes to accuracy, ads-free and ordering food, these attributes
actually cause satisfaction to the consumers when present, but still no dissatisfaction
when not being present. Therefore they can be seen as more important than the
attributes recommendations-free and shopping. Lastly, confidentiality is the attribute
that matters most for consumers. Its kano quality is one-dimensional, meaning the
higher degree of confidentiality voice assistants achieved, the higher satisfaction
among consumers, and vice versa - less confidentiality, higher dissatisfaction.
4.4.1 Kano results for early tech adopters
In addition to the above analysis, the researchers looked into differences between
different market segments, e.g. by segmenting on certain demographic or
psychographic data. Matzler et al. (1996) suggest that this can be helpful when
wanting to identify differences that cannot be seen on an aggregated level.
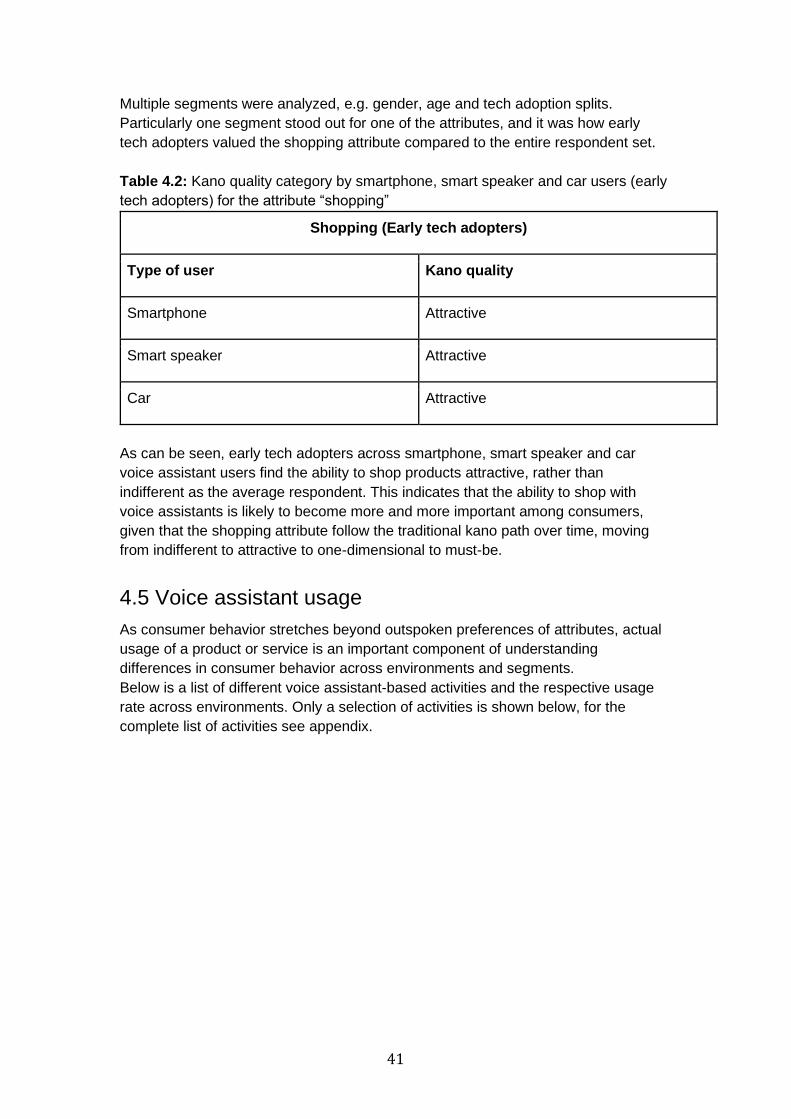
41
Multiple segments were analyzed, e.g. gender, age and tech adoption splits.
Particularly one segment stood out for one of the attributes, and it was how early
tech adopters valued the shopping attribute compared to the entire respondent set.
Table 4.2: Kano quality category by smartphone, smart speaker and car users (early
tech adopters) for the attribute “shopping”
Shopping (Early tech adopters)
Type of user Kano quality
Smartphone Attractive
Smart speaker Attractive
Car Attractive
As can be seen, early tech adopters across smartphone, smart speaker and car
voice assistant users find the ability to shop products attractive, rather than
indifferent as the average respondent. This indicates that the ability to shop with
voice assistants is likely to become more and more important among consumers,
given that the shopping attribute follow the traditional kano path over time, moving
from indifferent to attractive to one-dimensional to must-be.
4.5 Voice assistant usage
As consumer behavior stretches beyond outspoken preferences of attributes, actual
usage of a product or service is an important component of understanding
differences in consumer behavior across environments and segments.
Below is a list of different voice assistant-based activities and the respective usage
rate across environments. Only a selection of activities is shown below, for the
complete list of activities see appendix.

42
Table 4.3: % of respondents that have done a certain activity in the past 6 months,
divided by smartphone, smart speaker and car voice assistant users
# Group Activity Smartphone Smart speaker
Car
1 A Make calls 79% 44% 97%
2 A Text someone 77% 22% 59%
3 A Get directions 78% 33% 81%
4 A Play music 57% 92% 78%
5 B Get the latest news 27% 33% 16%
6 B Find a recipe 20% 26% 4%
7 B Search for information (equivalent of e.g. googling)
76% 79% 39%
8 C Find shops and restaurants nearby
48% 31% 45%
9 C Research a product 29% 18% 7%
10 C Add a product to a shopping list for later purchase
12% 14% 6%
11 C Buy / order a product 20% 14% 5%
12 C Order food 19% 10% 13%
Although there is no clear-cut categorization of the different activities, they can be
roughly sorted into buckets. As different voice assistant activities have different
drivers for usage frequency, differences and similarities between environments can
better be explained and understood through bucketing.
● Group A: Activities 1 through 4 are used to prompt a certain action through
voice instead of touch.
● Group B: Activities 5 through 7 are related to information search of some
kind.
● Group C: Activities 8 through 12 could be directly related to the consumer
purchasing process and its different phases (Bennett, 2010).
Group A
For Group A, there is generally higher usage frequency for smartphone and car
across a majority of activities. The usage rate in Group A is most likely related to
convenience. Although most smart speakers may offer the capabilities to “make
calls” and “text someone”, it may simply be easier to use your smartphone for these
actions. The same reasoning could explain the high usage rate for “make calls” and
“text someone” in the car, where the hands-free capabilities make the actions
possible while having your hands on the wheel and eyes on the road.
43
Hands-free capabilities most likely explain the higher portion of “play music” through
voice on smart speaker and car. “Play music” on your smartphone simply isn’t
convenient enough compared to using your hands.
“Get directions” can be explained by context. On the road in your car or in the streets
with your smartphone you are more likely to need directions than at home with your
smart speaker.
Group B
Groups B shows a higher usage frequency for smartphone and smart speaker across
all activities. Although there may be contextual reasons and reasons of convenience
behind the numbers, especially for “find a recipe”, this is where the technology
adoption life cycle (Rogers, 2010; Moore, 2014) comes into play. Voice assistants in
smartphones and smart speakers have been around longer and their penetration rate
are significantly higher than voice assistants in cars. These actions have in turn
reached a higher adoption rate and become more natural.
Group C
As previously mentioned, activities in Group C are related to purchasing
products/services or food. An important notion is that though only “buy/order a
product” and “order food” are directly related to the purchase act, all activities are
part of the consumer purchasing process. Though more common on smartphone,
direct purchases through voice assistants are still fairly uncommon.
Researching a product and finding shops or restaurants nearby are both related to
the second and third step of the consumer purchasing process, (2) information
search and (3) evaluate alternatives (Bennett, 2000). This study shows that
consumers are more likely to use their voice assistants for information search than
using their voice assistants for actual purchases. This trend is brought up by a report
from Salesforce (2018), emphasizing that a widespread adoption of information
search online is an import pre-requisite for the adoption of e-commerce. The report
says that 46% of shoppers still prefer to make the purchase itself in a physical store,
despite 87% of consumers beginning their purchases on digital channels in 2018 (up
from 71% in 2017).
Similarly, the use of smartphones as a means of information search is up to 71% in
2018, from 62% in 2017 (Salesforce, 2018). This can be part of the explanation
behind higher share of smartphone users utilizing voice assistant as part of their
consumer shopping process. Put into the context of technology adoption lifecycle,
mobile commerce has entered the mainstream market phase of the curve. Voice
technology simply offers a new way of operating existing devices, lowering the bar
for voice commerce on smartphones compared to smart speakers and cars.
4.5.1 Early tech adopters usage
Looking closer at early tech adopters, there is a clear pattern where early tech
adopters show a higher usage rate across activities and environments. Zooming in
on Group C, early tech adopters show a higher usage rate across all activites for

44
smartphone and smart speaker. In the case of car 3 out of 5 (60%) of activies show a
higher usage rate, while the difference for the remaining two are insignificant.
Table 4.4: Group C activities split by environment and early tech adopters
Type of user Smartphone Smart Speaker Car
Tech adoption category All Early All Early All Early
Find shops and restaurants nearby
48% 55% 31% 42% 45% 56%
Research a product 29% 37% 18% 30% 7% 13%
Add a product to a shopping list for later purchase
12% 22% 14% 20% 6% 4%
Buy / order a product 20% 22% 14% 26% 5% 4%
Order food 19% 20% 10% 19% 13% 19%
Putting activities in relation to the consumer purchasing process, “Research a
product” is closely related to the information search phase. “Find shops and
restaurants nearby” could both be part of the information search as well as
evaluating alternatives. “Add a product to a shopping list for later purchase” is part of
either evaluating alternatives or the purchase act itself, depending on intention.
Finally, “Buy / order a product” and “Order food” are considered pure purchasing
acts.
With the consumer purchasing process in mind, there is a clear trend showing that
consumers more frequently use voice assistants for the early steps of the purchase
process, across environments. These results reinforce the hypothesis that voice
technology will mainly be used for information search in an early stage of the
adoption curve, to drive adoption of voice commerce gradually. The trend is even
more significant in the group of early tech adopters compared to the general sample.
Buying products and food is significantly more common among early tech adopters
on smart speakers but comparable to general sample on smartphone. This can likely
be explained by voice assistants on smartphones having existed longer and having
reached a much higher penetration rate in the US.
4.6 Managerial implications
A number of managerial implications have been concluded based on the above
results and analysis. The recommendations are mainly directed to management of
manufacturers of voice assistants, consumer goods companies and restaurant
companies.

45
General
- Early tech adopters are skewed toward younger men, and they are more
likely to try new product and service innovations
Manufacturers of voice assistants
- The most important feature of voice assistants is confidentiality, and this is
what managers should prioritize first and foremost to make sure consumers
consider their products for purchase
- Subsequently, manufacturers of voice assistants will need to develop and
maintain strict control of third-party application in order to ensure
confidentiality
- Once that is accomplished, achieving better accuracy, remaining ads-free
and offering the capability to order food are attractive features to focus on that
may offer a high degree of satisfaction
Consumer goods / electronics companies
- The time is not yet right for these type of companies to market and encourage
purchases of their products through voice assistants, since consumers do not
see it as a feasible way to shop at the moment
- Though, early tech adopters are more likely to try shopping with their voice
assistants, and should therefore be targeted to possibly gain a first mover
advantage
- Companies should invest in and optimize their voice search capabilities, as
consumers in general and early tech adopters in particular are more likely to
use their voice assistants for information search, rather than purchase
Restaurant companies
- Independent restaurants and restaurant chains should exploit the fact that
consumers use voice assistants on smartphones or in their car relatively often
to find nearby restaurants
- Managers should put efforts in voice marketing to understand how they can
show up as an option that is evaluated by consumers when they ask for
nearby restaurants

46
5 Discussion
In this chapter, the research method and results & analysis are discussed to
understand if the chosen approaches were the most suitable or not for this thesis.
5.1 Research method discussion
Certain theory was reviewed initially to gain a better understanding of the topic, such
as natural language processing and consumer adoption of high-tech products. As the
thesis proceeded, further theory was reviewed once the researchers got an idea of
how to conduct the empirical research, for example demographics, psychographics
and the kano model. The researchers do not believe that the literature review should
have been done differently.
The interviews were prepared as semi-structured, but in reality, the interviews took
the form of rather unstructured. The researchers understood that it is likely due to
voice technology being such a new field of knowledge that it is easier to discuss it
from an unstructured point of view. Further, that does not necessarily mean that the
quality of the insights was lower. As the interviewees were experts within their own
individual area, forcing the interview into a predefined structure could in fact have
limited the insights gained. Allowing the interviewees had its strengths and
weaknesses – while not being able to collect data for all questions, higher data
quality was collected for the questions which the interviewees focused on. All in all,
the interviews fulfilled their purpose of helping the researchers find areas to review
literature within, as well as to design the survey.
The survey was the main source of empirical data and the foundation for answering
the research questions. It was, and still is in retrospect, regarded as the most time
efficient and statistically reliable way to collect data and answer questions about how
consumers use and think of voice assistants and their attributes. Although it gave a
lot of quantitative insights, it did not give as much qualitative insights and context on
how voice assistants are used. To complement for the fact that limited qualitative
insights and context were collected, the researchers could have added more open-
ended questions to the survey. Further, if time and monetary resources would not
have been limited, the researchers could have conducted observations to achieve a
fuller picture of voice assistant usage, such as difficulties and barriers.
All research methods considered, the researchers believe that the chosen methods
were the best way to achieve the aim of this thesis.
5.2 Results & analysis discussion
When looking at the demographic factors, it can be noticed that 43% of respondents
had an income of less than $50,000 (see figure 4.3). The income factor should have
been broken down more granularly, as it could have offered further insights. At this
point, no insightful conclusions could be drawn on respondents’ income, given how
the question was designed.
47
The method used to categorize respondents into tech adopters, a form of bucketing,
for this thesis is an important matter to discuss. Although the bucketing is not based
on a scientific method, it is frequently applied in the context of market research and
at SKIM, and therefore fulfills the purpose of the thesis. As mentioned in the results &
analysis, the researchers used questions to validate that the fallout of tech adopters
made sense, by looking at usage of certain tech devices and services. Moreover, the
distribution of tech adopters was similar to the technology adoption life cycle
distribution (Rogers, 2010), which further approves it. Given this, the researchers
believe that the method used to categorize respondents into tech adopters is valid
and is worth to be considered for future research projects.
Part of the aim of the thesis was to understand if consumers value different attributes
differently when using a voice assistant on a smartphone, smart speaker or in their
car. The kano question results showed that this was not the case, and one thing to
consider here is whether the questions were asked in the right way. Though, since
the kano categories did differ between each attribute, e.g. confidentiality is one-
dimensional while ads-free is attractive, the questions were likely asked in a correct
way. Instead, what could have been done is to further clarify the fact that the
respondents were supposed to think of themselves using a voice assistant on a
certain device when answering the questions. This could have been done by adding
images to each question to remind them of what environment they were being
assigned to. Altogether, this should not have significantly affected the outcome of the
results, and the researchers believe that the kano results still are valid.
Lastly, for the usage question, respondents had 23 different activities that they were
asked about. In hindsight, all of these activities were not relevant for the aim of the
thesis. Instead, the list of activities could have been condensed, and thus the quality
of the data collected would likely be slightly better. The reason that the quality of the
data would be better is that respondents easily get exhausted, when answering a
survey that is perceived as too long. This phenomenon is called survey fatigue
(Porter, Whitcomb & Weitzer, 2004). Porter et al. (2004) explain that the lesser
number of questions, duration of a survey and repetition of similar questions, the
more likely it is that the respondents will give honest and thoughtful answers.

48
6 Conclusion
In this chapter, the researchers will present concluding and concise answers to the
research questions, argue why this thesis is relevant to the field of research and give
suggestions on future research.
6.1 Research question conclusion
As the research questions have indirectly been answered in the results & analysis
section, the concluding answers below will be concise to give the reader a
summarized overview. For more background information and explanations of each
attribute or environment, see the results & analysis section.
RQ1: What attributes of voice assistants are more/less important, and does the
importance differ in different environments?
The six attributes that were tested are accuracy, confidentiality, ads-free,
recommendations-free, shopping and ordering food. By using the kano method, the
researchers could identify that consumers did not significantly value a certain voice
assistant attribute more or less when using a smartphone, smart speaker or car voice
assistant. On the other hand, there were differences when comparing the attributes
with each other. Confidentiality is considered as the most important attribute. This is
followed by accuracy, ads-free and being able to order food. The least important, or
even attributes that does not matter for the consumers, are recommendations-free
and being able to shop.
RQ2: How does people’s usage of voice assistants differ in different
environments?
When looking at people’s usage instead, the researchers did identify some
differences between the environments. Using the voice assistant to prompt a certain
action, such as making a call or texting someone, is more common on a smartphone
and in a car than on a smart speaker. For information search, such as getting the
latest news or finding a recipe, it is more common on a smartphone and smart
speaker than in a car. Lastly, activities that can be linked to the consumer purchasing
process, such as finding a shop/restaurant or buying/ordering a product, are more
common on a smartphone than on a smart speaker or in a car. The fallout of how
people use voice assistants differently in different environments can be explained by
(1) the fact that certain devices have been around for a longer time and (2) the
matter of convenience.
RQ3: What phase of the consumer purchasing process does voice assistants
have the biggest impact?
At this time, voice assistants mainly play a role in the second and third phase of the
consumer purchasing process. These phases are “information search” and “evaluate
alternatives”. The “purchase decision” and “purchase act” are much more likely to

49
happen digitally or in a physical store. Though, this does not mean that purchasing
products/services through a voice assistant will never become significant. Instead,
similar to how e-commerce became significant after time, there is a chance that the
same thing happens to voice commerce, given that it follows the tech adoption curve.
6.2 Relevance to the field of research
The researchers believe that this thesis is highly relevant to the field of research,
especially in Sweden where voice assistants still have not gained a strong foothold.
As more and more consumers will start using voice assistants, it will become
increasingly interesting both from a technical and business perspective for academia
and corporations. This thesis will serve as a contribution to the field of research,
giving future researchers within this field fundamental knowledge about voice
assistants, as well as spark new ideas for future research.
6.3 Future research
An interesting aspect is to understand how the answers to the conducted survey
changes over time. Future research in a couple of years could be to do a comparison
study to see if voice assistants have become a larger part of people’s everyday life
and if voice commerce has become a more important aspect of the voice assistant.
This would help validating some of the ideas about the future that the researchers
only can speculate about.
In addition to that, a complementary study focusing more on the qualitative aspects
could be of interest. The research could focus on utilizing focus groups and
interviews with actual voice assistant users to get a deeper understanding on why,
how and when voice assistants are used.
Lastly, it would certainly be useful to conduct a similar research in Sweden, once
voice assistants have become a bigger part of Swedes’ everyday life. The results
could be compared to the US market from this thesis, and help understand
differences between American and Swedish consumers.

50
A Appendix
A.1 Questionnaire
Terms and conditions of survey participation This research is carried out by an independent market research agency named SKIM. This research adheres to local laws regarding data protection and is bound by their privacy policy. All information and opinions you give are completely anonymous and confidential, and your privacy is guaranteed. Results are aggregated to provide an overall picture of attitudes to the areas being discussed, will never contain details that could reveal your identity and will not be passed on to any third parties beyond the research company and the commissioning company. The research is not intended to be promotional and any information presented is done solely to explore reactions to this information. You will also not be targeted for any sales or promotional activity because of taking part – it is for market research purposes only. What you will see in this survey is confidential and must not be shared. You have the right to withdraw from the survey at any time during the survey process. Do you agree to proceed based on the terms and conditions, and the privacy policy explained above?
1. Yes, I do agree with the terms and conditions above 2. No, I do not agree with the terms and conditions above → Terminate
Screener
S1. What is your gender?
1. Male
2. Female
3. Prefer not to answer
S2. Please indicate your age?
_____ years old
S3. Are you a parent of a child under 18?
1. Yes
2. No

51
S4. Have you ever heard that any of the following devices can be controlled by
voice? When we speak of "voice", we mean controlling the device by voice instead of
clicking or typing, etc.
1. Smartphone
2. Smart speaker / device designed for speech interaction
3. Car
4. Smartwatch
5. Laptop
6. Tablet
7. TV
8. Household appliance
9. Other, please specify
10. None of the above
[Terminate if smartphone, smart speaker or car is not chosen]
S5. Have you used the following types of voice technology in the last 6 months?
[Rows] [Insert if chosen in S4]
1. Voice assistant on your smartphone (e.g. Siri, Google Assistant etc.)
2. Voice assistant on a smart speaker (e.g. Amazon Echo, Google Home,
Apple HomePod etc.)
3. Voice assistant integrated in your car (e.g. Apple CarPlay or Android Auto)
[Columns]
1. Yes
2. No
[Terminate if Column option “Yes” is not chosen for any row]
S6. How often do you use the following type of voice technology?
[Rows] [Insert if chosen “Yes” in S5]
1. Voice assistant on your smartphone (e.g. Siri, Google Assistant etc.)
2. Voice assistant on a smart speaker (e.g. Amazon Echo, Google Home,
Apple HomePod etc.)
3. Voice assistant integrated in your car (e.g. Apple CarPlay or Android Auto)
[Columns]
1. Several times a day
2. Once a day
3. Several times a week
4. Once a week
5. Several times a month
6. Once a month or less

52
[Terminate if Column option 1-4 is not chosen for any row. Based on this question,
respondents got assigned to see questions about either smartphones, smart
speakers or cars]
___________________________________________________________________
Environment-specific questions: Smartphones
You indicated that you are using a voice assistant on your smartphone. Please
answer the following questions about using voice technology on your smartphone.
A1. What type of voice assistant do you use most often with your smartphone?
1. Apple Siri
2. Google Assistant
3. Microsoft Cortana
4. Other, please specify
A2. What smartphone brand do you use?
1. Apple
2. Samsung
3. Google
4. LG
5. HTC
6. Sony
7. Nokia
8. Blackberry
9. Motorola
10. Huawei
11. Other, please specify
A3. Which, if any, of the following tasks have you performed on your smartphone on-
the-go (e.g. walking the streets), in the past 6 months?
Please select all that apply.
1. Make calls
2. Text someone
3. Get directions
4. Search for information
5. Activate home systems (e.g. switch on the lights, lower the temperature,
switch on household appliances, etc.)
6. Ask an amusing question or hear a joke
7. Find shops and restaurants nearby
8. Play music
9. Get weather forecast
10. Set timer or alarm
11. Set a reminder
12. Get the latest news

53
13. Schedule a meeting / event
14. Ask for the time
15. Retrieve a sports score
16. Navigate device (find apps or settings)
17. Find a recipe
18. Write a note
19. Identify a played song
20. Research a product
21. Buy / order a product
22. Order food
23. Add a product to a shopping list for later purchase
24. Other, please specify
25. None of the above
A4. How often do you do the following by using the voice assistant on your
smartphone when you are on-the-go (e.g. walking the streets)?
[Rows]
[Insert items chosen A3]
[Columns]
1. Several times a day
2. Once a day
3. Several times a week
4. Once a week
5. Several times a month
6. Once a month or less
___________________________________________________________________
Environment-specific: Smart speakers
You have indicated that you are using a smart speaker. Please answer the following
questions about using the smart speaker.
B1. What type of smart speaker do you use most often?
1. Amazon Echo
2. Google Home
3. Apple HomePod
4. Other, please specify
B2. How many smart speakers do you own in your household?
I own __ smart speakers in my household.

54
B3. Which, if any, of the following tasks have you performed on your smart speaker
in your home, in the past 6 months?
Please select all that apply.
1. Make calls
2. Text someone
3. Get directions
4. Search for information
5. Activate home systems (e.g. switch on the lights, lower the temperature,
switch on household appliances, etc.)
6. Ask an amusing question or hear a joke
7. Find shops and restaurants nearby
8. Play music
9. Get weather forecast
10. Set timer or alarm
11. Set a reminder
12. Get the latest news
13. Schedule a meeting / event
14. Ask for the time
15. Retrieve a sports score
16. Navigate device (find apps or settings)
17. Find a recipe
18. Write a note
19. Identify a played song
20. Research a product
21. Buy / order a product
22. Order food
23. Add a product to a shopping list for later purchase
24. Other, please specify
25. None of the above
B4. How often do you do the following by using the voice assistant on your smart
speaker when you are in your home?
[Rows]
[Insert items chosen B3]
[Columns]
1. Several times a day
2. Once a day
3. Several times a week
4. Once a week
5. Several times a month
6. Once a month or less

55
___________________________________________________________________
Environment-specific: In-car voice assistant
You mentioned that you are using an integrated voice assistant in your car. Please
answer the following questions about using voice technology in your car.
C1. What type of in-car voice assistant do you use most often?
1. Apple CarPlay
2. Android Auto
3. From a smartphone through Bluetooth
4. Other, please specify
C2. Which, if any, of the following tasks have you performed on your in-car voice
assistant, in the past 6 months?
Please select all that apply.
1. Make calls
2. Text someone
3. Get directions
4. Search for information
5. Activate home systems (e.g. switch on the lights, lower the temperature,
switch on household appliances, etc.)
6. Ask an amusing question or hear a joke
7. Find shops and restaurants nearby
8. Play music
9. Get weather forecast
10. Set timer or alarm
11. Set a reminder
12. Get the latest news
13. Schedule a meeting / event
14. Ask for the time
15. Retrieve a sports score
16. Navigate device (find apps or settings)
17. Find a recipe
18. Write a note
19. Identify a played song
20. Research a product
21. Buy / order a product
22. Order food
23. Add a product to a shopping list for later purchase
24. Other, please specify
25. None of the above

56
C3. How often do you do the following by using in-car voice assistant?
[Rows]
[Insert items chosen C2]
[Columns]
1. Several times a day
2. Once a day
3. Several times a week
4. Once a week
5. Several times a month
6. Once a month or less
___________________________________________________________________
Psychographics
Thank you for answering our questions so far. In the following questions, we'd like to
know more about how you relate to technology.
P1. How much do you agree or disagree that each of the following statements about
technology describe you?
[Rows]
1. I believe the rapid technological advances we see today do more good than
harm.
2. I’m always one of the first of my friends to try new technology products or
services.
3. I’m willing to tolerate some bugs if I get to use the latest technology products
and services.
4. I take active steps to keep my personal information and activities private
online.
[Columns]
1. Disagree
2. Somewhat disagree
3. Neither disagree nor agree
4. Somewhat agree
5. Agree

57
P2. Which of the following types of services have you used in the past month?
1. Music streaming (e.g. Pandora, Spotify)
2. TV / movie streaming, not through a cable TV subscription (e.g. Netflix, Hulu,
YouTube TV, Sling)
3. Cable TV subscription
4. Podcast streaming (e.g. Audible, Podcast Player)
5. Grocery delivery (e.g. Amazon Fresh, Instacart)
6. Food delivery (e.g. Seamless, Grubhub, Uber Eats)
7. Digital wallet / payment (e.g. Apple Pay, Venmo)
8. Subscription boxes (e.g. Blue Apron, Birchbox)
9. Subscription to a major newspaper / online news site (e.g. The New York
Times, Wall Street Journal)
10. None of the above
P3. Which of the following devices do you currently own and have used in the past
month?
1. Smartphone
2. Tablet
3. Laptop computer
4. Desktop computer
5. TV
6. Smart TV
7. Device that streams content to your TV (e.g. Apple TV, Roku)
8. Digital watch that syncs to your phone (e.g. Apple Watch, Samsung Gear)
9. Fitness tracker (e.g. Fitbit, Pulse)
10. Digital reader (e.g. Kindle, Nook)
11. Smart home device (e.g. Amazon Echo, Google Home)
12. Gaming console (e.g. Playstation, XBOX, Wii)
13. Virtual reality headset (e.g. Oculus Rift)
14. None of the above
___________________________________________________________________
Kano
Accuracy
K1a. How would you feel if you had a successful conversation with your voice
assistant, meaning that the voice assistant understands you and returns an
answer/action you would expect?
1. I like it that way
2. I expect it that way
3. I am neutral
4. I can live with it that way
5. I dislike it that way

58
K1b. How would you feel if you did not have a successful conversation with your
voice assistant, meaning the voice assistant does not understand you or does not
return an answer/action you would expect.
1. I enjoy it that way
2. I expect it that way
3. I am neutral
4. I dislike it, but I can live with it that way
5. I dislike it, and I can’t accept it
Confidentiality
K2a. How would you feel if the voice assistant was 100% trustworthy and never
recorded any part of your conversation?
1. I enjoy it that way
2. I expect it that way
3. I am neutral
4. I dislike it, but I can live with it that way
5. I dislike it, and I can’t accept it
K2b. How would you feel if the voice assistant sometimes recorded parts of the
conversation between the two of you?
1. I enjoy it that way
2. I expect it that way
3. I am neutral
4. I dislike it, but I can live with it that way
5. I dislike it, and I can’t accept it
Ads
K3a. How would you feel if your voice assistant never played ads randomly?
1. I enjoy it that way
2. I expect it that way
3. I am neutral
4. I dislike it, but I can live with it that way
5. I dislike it, and I can’t accept it

59
K3b. How would you feel if your voice assistant occasionally played ads
randomly?
1. I enjoy it that way
2. I expect it that way
3. I am neutral
4. I dislike it, but I can live with it that way
5. I dislike it, and I can’t accept it
Recommendations
K4a. How would you feel if your voice assistant did not give you unprompted
recommendations when you are having a conversation?
1. I enjoy it that way
2. I expect it that way
3. I am neutral
4. I dislike it, but I can live with it that way
5. I dislike it, and I can’t accept it
K4b. How would you feel if your voice assistant did give you unprompted
recommendations when you are having a conversation?
1. I enjoy it that way
2. I expect it that way
3. I am neutral
4. I dislike it, but I can live with it that way
5. I dislike it, and I can’t accept it
Shopping
K5a. How would you feel if you were able to shop products with your voice
assistant?
1. I enjoy it that way
2. I expect it that way
3. I am neutral
4. I dislike it, but I can live with it that way
5. I dislike it, and I can’t accept it
60
K5b. How would you feel if you were not able to shop products with your voice
assistant?
1. I enjoy it that way
2. I expect it that way
3. I am neutral
4. I dislike it, but I can live with it that way
5. I dislike it, and I can’t accept it
Ordering food
K6a. How would you feel if you were able to order food with your voice assistant?
1. I enjoy it that way
2. I expect it that way
3. I am neutral
4. I dislike it, but I can live with it that way
5. I dislike it, and I can’t accept it
K6b. How would you feel if you were not able to order food with your voice
assistant?
1. I enjoy it that way
2. I expect it that way
3. I am neutral
4. I dislike it, but I can live with it that way
5. I dislike it, and I can’t accept it
K7. In the set of questions you just answered, was there anything that was confusing
or unclear? If so, please specify.
[Open-ended]
___________________________________________________________________
Demographics
D1. Please indicate your marital and living status.
1. Single, living independently
2. Single, living with friends
3. Single, living with parents
4. Married / living together with partner
5. Widowed
6. Divorced
7. Other, please specify
8. Prefer not to answer

61
D2. Which best describes your educational background?
1. Some high school
2. High school diploma
3. Some college
4. Bachelor’s degree
5. Some graduate school
6. Graduate degree or higher
7. Prefer not to answer
D3. How would you describe your ethnic origin?
1. African-American / Black
2. American Indian or Alaska Native
3. Asian
4. Caucasian / White
5. Hispanic or Latino
6. Native Hawaiian / Pacific Islander
7. Other, please specify
8. Prefer not to answer
D4. What is your professional situation?
1. Part or full-time student currently or during the school year
2. Full-time homemaker
3. Employed part-time
4. Employed full-time
5. Unemployed
6. Retired
7. Disabled
8. Other, please specify
9. Prefer not to answer
D5. In total, how many people live in your household, including yourself?
______ people in my household
D6. What was your total yearly household income in 2018, before taxes?
1. Less than $50,000
2. $50,000 - $74,999
3. $75,000 - $99,999
4. $100,000 - $149,999
5. $150,000 - $249,999
6. $250,000 or more
7. Prefer not to say

62
A.2 Full demographics breakdown
Table A.1: Gender breakdown
Gender
Male 48.1%
Female 51.7%
Non-binary 0.2%
Table A.2: Age breakdown
Age
18 to 24 11.7%
25 to 34 25.1%
35 to 44 25.8%
45 to 54 20.6%
55 to 64 16.8%
Table A.3: Parent/non-parent breakdown
Parent/non-parent
Parent 44.7%
Non-parent 55.3%
Table A.4: Living status breakdown
Living status
Single, living independently 18.9%
Single, living with friends 5.8%
Single, living with parents 9.4%
Married / living together with partner 52.8%
Widowed 1.7%
Divorced 9.4%
Other, please specify 1.8%
Prefer not to answer 0.3%

63
Table A.5: Education breakdown
Education
Some high school 2.0%
High school diploma 20.1%
Some college 40.1%
Bachelor’s degree 23.2%
Some graduate school 2.6%
Graduate degree or higher 11.8%
Prefer not to answer 0.3%
Table A.6: Occupation breakdown
Occupation
Part or full-time student 4.8%
Full-time homemaker 8.8%
Employed part-time 12.9%
Employed full-time 52.3%
Unemployed 7.6%
Retired 6.2%
Disabled 5.6%
Other, please specify 1.3%
Prefer not to answer 0.6%

64
Table A.7: Income breakdown
Income
Less than $50,000 42.8%
$50,000 - $74,999 21.8%
$75,000 - $99,999 15.1%
$100,000 - $149,999 11.4%
$150,000 - $249,999 5.3%
$250,000 or more 1.1%
Prefer not to answer 2.5%

65
A.3 Full kano results
Table A.8: Kano quality distribution by smartphone, smart speaker and car users for
the attribute “accuracy”
Accuracy Indifferent Attractive One- dimensional
Must-be Reverse
Smartphone 26.3% 36.3% 20.0% 16.3% 1.3%
Smart speaker 27.5% 38.0% 16.8% 16.5% 1.3%
Car 23.0% 32.5% 24.5% 19.5% 0.5%
Table A.9: Kano quality distribution by smartphone, smart speaker and car users for
the attribute “confidentiality”
Confidentiality Indifferent Attractive One- dimensional
Must-be Reverse
Smartphone 14.3% 14.5% 40.3% 30.0% 1.0%
Smart speaker 13.3% 20.5% 35.3% 30.5% 0.5%
Car 12.5% 12.5% 44.8% 29.5% 0.8%
Table A.10: Kano quality distribution by smartphone, smart speaker and car users
for the attribute “ads-free”
Ads-free Indifferent Attractive One- dimensional
Must-be Reverse
Smartphone 21.0% 30.5% 28.3% 18.5% 1.8%
Smart speaker 17.5% 33.5% 28.8% 18.5% 1.8%
Car 16.5% 39.5% 27.8% 15.0% 1.3%
Table A.11: Kano quality distribution by smartphone, smart speaker and car users
for the attribute “recommendations-free”
Recommendations free
Indifferent Attractive One- dimensional
Must-be Reverse
Smartphone 36.3% 13.8% 20.8% 20.0% 9.3%
Smart speaker 35.5% 13.8% 19.3% 22.0% 9.5%
Car 33.0% 9.0% 28.3% 17.8% 12.0%

66
Table A.12: Kano quality distribution by smartphone, smart speaker and car users
for the attribute “shopping”
Shopping Indifferent Attractive One- dimensional
Must-be Reverse
Smartphone 41.0% 30.0% 14.3% 8.8% 6.0%
Smart speaker 40.0% 32.0% 16.3% 8.0% 3.8%
Car 42.5% 32.8% 13.3% 4.5% 7.0%
Table A.13: Kano quality distribution by smartphone, smart speaker and car users
for the attribute “ordering food”
Ordering food Indifferent Attractive One- dimensional
Must-be Reverse
Smartphone 32.3% 42.0% 17.0% 6.0% 2.8%
Smart speaker 31.5% 42.5% 16.0% 8.0% 2.0%
Car 31.3% 43.3% 17.5% 6.0% 2.0%
Table A.14: Kano quality distribution by smartphone, smart speaker and car users
(early tech adopters) for the attribute “ordering food”
Shopping (Early tech adopters)
Indifferent Attractive One- dimensional
Must-be Reverse
Smartphone 35.3% 35.3% 15.7% 5.9% 7.8%
Smart speaker 27.5% 36.2% 23.2% 11.6% 1.4%
Car 33.7% 40.0% 17.9% 4.2% 4.2%
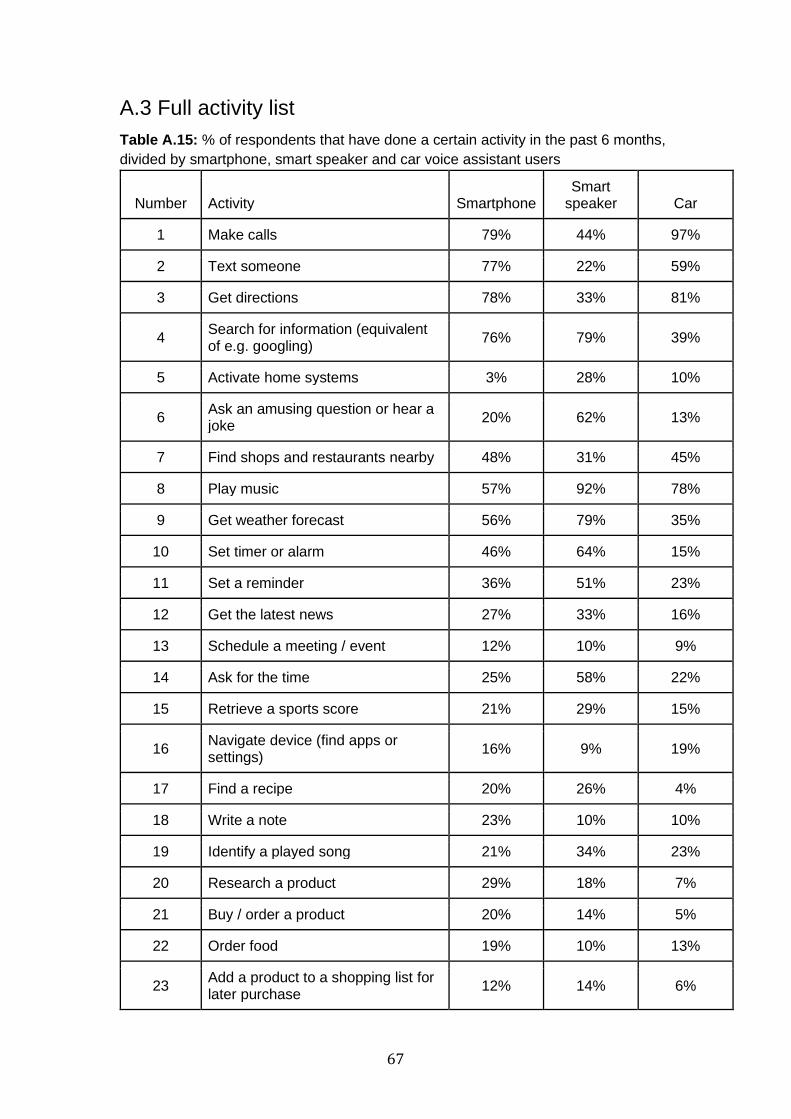
67
A.3 Full activity list
Table A.15: % of respondents that have done a certain activity in the past 6 months,
divided by smartphone, smart speaker and car voice assistant users
Number Activity Smartphone Smart
speaker Car
1 Make calls 79% 44% 97%
2 Text someone 77% 22% 59%
3 Get directions 78% 33% 81%
4 Search for information (equivalent of e.g. googling)
76% 79% 39%
5 Activate home systems 3% 28% 10%
6 Ask an amusing question or hear a joke
20% 62% 13%
7 Find shops and restaurants nearby 48% 31% 45%
8 Play music 57% 92% 78%
9 Get weather forecast 56% 79% 35%
10 Set timer or alarm 46% 64% 15%
11 Set a reminder 36% 51% 23%
12 Get the latest news 27% 33% 16%
13 Schedule a meeting / event 12% 10% 9%
14 Ask for the time 25% 58% 22%
15 Retrieve a sports score 21% 29% 15%
16 Navigate device (find apps or settings)
16% 9% 19%
17 Find a recipe 20% 26% 4%
18 Write a note 23% 10% 10%
19 Identify a played song 21% 34% 23%
20 Research a product 29% 18% 7%
21 Buy / order a product 20% 14% 5%
22 Order food 19% 10% 13%
23 Add a product to a shopping list for later purchase
12% 14% 6%

68

69
Bibliography
Alsin, A. (2018). How Voice Technology Is Disrupting Modern Computing: And Why
Investors Should Be Listening. Retrieved from:
https://www.forbes.com/sites/aalsin/2018/02/21/how-voice-technology-is-disrupting-
modern-computing-and-why-investors-should-be-listening/#3ee6da4b6f50
Armstrong, G., Adam, S., Denize, S., & Kotler, P. (2014). Principles of marketing
(15th ed.). Pearson Australia.
Bellegarda, J. R. (2014). Spoken language understanding for natural interaction: The
siri experience. In Natural Interaction with Robots, Knowbots and Smartphones (pp.
3-14). Springer, New York, NY.
Bentahar, A. (2018). How Voice Search Is Changing Shopping. Retrieved from:
https://www.forbes.com/sites/forbesagencycouncil/2018/12/03/how-voice-search-is-
changing-shopping/#4a871cf02615
Brandtzaeg, P. B., & Følstad, A. (2017). Why people use chatbots. In International
Conference on Internet Science (pp. 377-392). Springer, Cham.
Bunyan, D & Sarkis, K. (2019). Making Connections With the New Digital Consumer
Retrived from: https://www.strategy-business.com/feature/Making-connections-with-
the-new-digital-consumer?gko=ccc89
Buvat, J., Taylor, M., Jacobs, K., Khadikar, A., & Sengupta, A. (2018).
Conversational commerce: why consumers are embracing voice assistants in their
lives. Capgemini Research Institute.
Canalys. (2019). Global smart speaker installed base to top 200 million by end of
2019. Retrived from: https://www.canalys.com/newsroom/canalys-global-smart-
speaker-installed-base-to-top-200-million-by-end-of-2019
Cervone, A., Khatri, C., Goel, R., Hedayatnia, B., Venkatesh, A., Hakkani-Tur, D., &
Gabriel, R. (2019). Natural Language Generation at Scale: A Case Study for Open
Domain Question Answering. arXiv preprint arXiv:1903.08097.
Creswell, J. W., & Clark, V. L. P. (2017). Designing and conducting mixed methods
research. Sage publications.
Daniel Jurafsky and James H. Martin - Speech and language processing, 3rd edition
draft, 2018.
Danielescu, A. (2019). Eschewing Gender Stereotypes in Voice Assistants.
Retrieved from: https://chatbotsmagazine.com/eschewing-gender-stereotypes-in-
voice-assistants-95920d45c291

70
Don A. Dillman (2007) Mail and internet surveys: The tailored design method. 2nd
edition.
Episerver. (2019). Reimagining Commerce: Principles of Standout Digital Shopping
Experiences. Retrieved from: https://www.episerver.com/learn/guides/2019-online-
shopping-habits-and-retailer-strategies/
Fowler Jr, F. J. (2013). Survey research methods. Sage publications.
Holoubek, S & Bowling, E (2017). Voice technology isn’t just a trend; it’s a paradigm
shift. Retrieved from: https://www.luminary-labs.com/insight/voice-technology-
paradigm-shift/
Huisman, J & Guilbault, C. (2018). Voice Tech Trends 2018 - Consumer Behavior &
Brand Implications in the US, UK and Germany. Retrieved from:
https://info.skimgroup.com/voice-tech-trends-us-eu-report
Internet Innovation Alliance (IIA). (2018). Research Peek of the Week: Smartphone
Users in the US Expected to Reach Over 270 Million by 2022. Retrieved from:
https://internetinnovation.org/general/research-peek-of-the-week-smartphone-users-
in-the-us-expected-to-reach-over-270-million-by-2020/
James Moar. (2019). Digital Voice Assistants. Retrieved from:
https://www.juniperresearch.com/researchstore/innovation-disruption/digital-voice-
assistants
Jason Snook. (2018). CapTech Research: A Profile of Smart Speaker Users.
Jensen, J. T. (1990). Morphology: Word structure in generative grammar (Vol. 70).
John Benjamins Publishing.
Josip Mikulić and Darko Prebežac. (2011). A critical review of techniques for
classifying quality attributes in the Kano model.
Jurafsky, D., & Martin, J. H. (2009). Chapter 13: Syntactic Parsing. Speech and
Language Processing: An Introduction to Natural Language Processing.
Computational Linguistics, and Speech Recognition (2nd ed.). Pearson–Prentice
Hall.
Kano, Noriaki; Nobuhiku Seraku; Fumio Takahashi; Shinichi Tsuji. (1984) Attractive
quality and must-be quality. Journal of the Japanese Society for Quality Control.
Khashabi, D. (2019). Reasoning-Driven Question-Answering for Natural Language
Understanding. arXiv preprint arXiv:1908.04926.
Kinsella, B., & Mutchler, A. (2019). Smart speaker consumer adoption report 2019.
Retrieved from: https://voicebot.ai/smart-speaker-consumer-adoption-report-2019/
Kotler, P., & Keller, K. (2011). Marketing management (14th ed.). Prentice Hall.

71
Krishnaswamy, O. & Satyaprasad, B. (2010). Business research methods. Mumbai
India: Himalaya Pub. House.
Kügler, F., Féry, C., & Vijver, R. (Eds.). (2009). Variation and gradience in phonetics
and phonology (Vol. 14).
Kurt Matzler, Hans H. Hinterhuber, Franz Bailom and Elmar Sauerwein (1996). How
to delight your customer.
Lawton, G. (2003). Instant messaging puts on a business suit. Computer, 36(3), 14-
16.
Liu, X., Eshghi, A., Swietojanski, P., & Rieser, V. (2019). Benchmarking Natural
Language Understanding Services for building Conversational Agents. arXiv preprint
arXiv:1903.05566.
Makgosa, R., & Sangodoyin, O. (2018). Retail market segmentation: the use of
consumer decision-making styles, overall satisfaction and demographics. The
International Review of Retail, Distribution and Consumer Research, 28(1), 64-91.
Mauldin, M. L. (1994). Chatterbots, tinymuds, and the turing test: Entering the
loebner prize competition. In AAAI (Vol. 94, pp. 16-21).
McNair, C. (2019). Global Smart Speaker Users 2019: Trends for Canada, China,
France, Germany, the UK and the US. Retrieved from:
https://www.emarketer.com/content/global-smart-speaker-users-2019
Meade, P. T., & Rabelo, L. (2004). The technology adoption life cycle attractor:
Understanding the dynamics of high-tech markets. Technological Forecasting and
Social Change, 71(7), 667-684.
Moore, G. A. (2014). Crossing the chasm: marketing and selling disruptive products
to mainstream customers. HarperBusiness, an imprint of Harpe rCollins Publishers.
OC&C Strategy Consultants. (2019). Voice Shopping Set to Jump to $40 Billion By
2022, Rising From $2 Billion Today. Retrieved from:
https://www.prnewswire.com/news-releases/voice-shopping-set-to-jump-to-40-billion-
by-2022-rising-from-2-billion-today-300605596.html
Patricia Pulliam Phillips and Cathy A. Stawarski. (2008). Data collection: Planning for
and collecting all types of data.
Porter, S. R., Whitcomb, M. E., & Weitzer, W. H. (2004). Multiple surveys of students
and survey fatigue. New Directions for Institutional Research, 2004(121), 63-73.
Retrieved from: https://www.captechconsulting.com/blogs/captech-research-a-profile-
of-smart-speaker-users
Robson, C., & McCartan, K. (2016). Real world research. John Wiley & Sons.
Rogers, E. M. (2010). Diffusion of innovations. Simon and Schuster.

72
Santhanam, S., & Shaikh, S. (2019). A Survey of Natural Language Generation
Techniques with a Focus on Dialogue Systems-Past, Present and Future Directions.
arXiv preprint arXiv:1906.00500.
Saunders, M., Lewis, P. & Thornhill, A. (2016). Research methods for business
students. Harlow, Essex, England: Pearson Education Limited.
Mowen, J. C. (2000). The 3M model of motivation and personality: Theory and
empirical applications to consumer behavior. Springer Science & Business Media.
Sen, S., Dutta, A., & Dey, N. (2019). Speech Processing and Recognition System. In
Audio Processing and Speech Recognition (pp. 13-43). Springer, Singapore.
Simms, K. (2019). How Voice Assistants Could Change the Way we Shop. Retrieved
from: https://hbr.org/2019/05/how-voice-assistants-could-change-the-way-we-shop
SKIM. (2019a). About SKIM. Retrieved from: https://skimgroup.com/about/
Solomon, M. R., Dahl, D. W., White, K., Zaichkowsky, J. L., & Polegato, R. (2014).
Consumer behavior: Buying, having, and being (Vol. 10). Toronto, Canada: Pearson.
Taylor, P. (2009). Text-to-speech synthesis. Cambridge university press.
Tomokiyo, L. M. (2001). Recognizing non-native speech: characterizing and adapting
to non-native usage in LVCSR. Unpublished doctoral dissertation, Carnegie Mellon
University, Pittsburgh, PA.
Tur, G et al. (2010). The CALO meeting assistant system. IEEE Transactions on
Audio, Speech, and Language Processing, 18(6), 1601-1611.
Turing, A. M. (2009). Computing machinery and intelligence. In Parsing the Turing
Test (pp. 23-65). Springer, Dordrecht.
United States Census Bureau. (2019). Retrieved from:
https://www.census.gov/en.html
Vlahos, J. (2019). Talk to me: how voice computing will transform the way we live,
work, and think. Boston: Houghton Mifflin Harcourt.
Voicebot.ai. (2018). Voice assistant consumer adoption report
Voicebot.ai. (2019). In-car voice assistant consumer adoption report
Wollscheid, C. (2012). Rise and burst of the dotcom bubble: causes, characteristics,
examples. GRIN Verlag.
Yu, D., & Deng, L. (2016). AUTOMATIC SPEECH RECOGNITION. Springer london
limited.

DEPARTMENT OF TECHNOLOGY MANAGEMENT AND ECONOMICS
DIVISION OF INNOVATION AND R&D MANAGEMENT CHALMERS UNIVERSITY OF TECHNOLOGY
Gothenburg, Sweden
www.chalmers.se