voaarea - Kkn.net
90
Another Way to View Propagation Predictions for DXing and Contesting By R. Dean Straw, N6BV Senior Assistant Technical Editor, ARRL Friday, May 19, 2006 Dayton Hamvention Dayton, OH
Transcript of voaarea - Kkn.net

Another Way to ViewPropagation Predictions for
DXing and Contesting
By R. Dean Straw, N6BVSenior Assistant Technical Editor, ARRL
Friday, May 19, 2006Dayton Hamvention
Dayton, OH

I will talk about the following:
• Area-coverage predictions using VOAAREA.• I will compare VOAAREA predictions to
actual results for the 2005 Sweepstakes Phonecontest.
• I will discuss how to make customizedantennas for VOAAREA.

The VOAAREA Program
• VOAAREA is one of the programs in thesoftware suite that come with VOACAP.
• VOAAREA creates customizable contourson several selectable map projections.
• One of the key parameters is setting theantenna properly, for both receiver andtransmitter.

Table of Sigs/Elevs -- Chicago04 = Zone, Nov., CA (San Francisco) to IL (Chicago), SSN = Very Low, S-Units 3.8 3.8 7.1 7.1 14.1 14.1 21.2 21.2 28.6 28.6GMT Sig Elev Sig Elev Sig Elev Sig Elev Sig Elev 0 9+ 29.3 9+ 22.6 9+ 2.6 4 5.9 - - 1 9+ 22.1 9+ 13.9 9+ 6.1 - - - - 2 9+ 22.9 9+ 15.7 9 6.3 - - - - 3 9+ 24.3 9 10.3 4 6.7 - - - - 4 9+ 25.7 9+ 11.4 2 5.3 - - - - 5 9+ 26.2 9+ 11.5 2 7.6 - - - - 6 9+ 25.9 9+ 11.1 4 7.5 - - - - 7 9+ 25.2 9+ 10.6 6 7.2 - - - - 8 9+ 24.7 9+ 17.6 8 7.0 - - - - 9 9+ 24.8 9+ 17.6 7 7.1 - - - -10 9+ 25.7 9+ 19.4 5 7.5 - - - -11 9+ 26.8 9 4.1 - - - - - -12 9+ 27.0 9 4.2 - - - - - -13 9+ 25.6 9+ 18.3 7 7.7 - - - -14 9+ 31.5 9+ 14.9 9+ 4.9 - - - -15 9 27.5 9+ 22.3 9+ 2.4 9 6.3 - -16 5 34.7 9 15.6 9+ 15.1 9+ 6.4 1 6.017 - - 9 22.4 9+ 13.8 9+ 3.1 5 6.018 - - 7 22.5 9+ 13.1 9 2.3 7 5.819 - - 7 23.5 9+ 13.0 9 2.2 8 5.920 - - 7 23.7 9+ 13.8 9+ 2.6 8 5.821 - - 9 17.9 9+ 14.3 9+ 3.1 6 6.122 7 34.9 9+ 15.4 9+ 14.8 9+ 3.6 1 6.023 9 30.9 9+ 21.9 9+ 2.1 9+ 5.9 - -
Some 10meter signalspredicted
Decent 15meter openingpredicted
I’ve presented this tabular format in various forums in the past.

Table of Sigs/Elevs – Washington, DC05 = Zone, Nov., CA (San Francisco) to Washington (D.C.), SSN = Very Low, S-Units 3.8 3.8 7.1 7.1 14.1 14.1 21.2 21.2 28.6 28.6GMT Sig Elev Sig Elev Sig Elev Sig Elev Sig Elev 0 9 21.9 9+ 15.7 9 13.3 - - - - 1 9+ 22.1 9+ 17.0 1 13.7 - - - - 2 9+ 23.2 9+ 9.5 4 1.2 - - - - 3 9+ 24.7 9+ 10.8 1 1.6 - - - - 4 9+ 25.9 9+ 11.9 1 2.0 - - - - 5 9+ 26.3 9+ 12.0 2 2.1 - - - - 6 9+ 25.8 9+ 11.3 3 2.0 - - - - 7 9+ 25.0 9+ 10.7 5 1.8 - - - - 8 9+ 24.5 9+ 10.3 6 1.6 - - - - 9 9+ 24.8 9+ 10.5 6 1.7 - - - -10 9+ 25.8 9+ 11.3 2 2.1 - - - -11 9+ 26.7 9+ 12.4 - - - - - -12 9+ 26.0 9+ 11.7 1 2.3 - - - -13 9 24.2 9+ 19.2 8 1.9 - - - -14 8 23.9 9+ 16.1 8 14.4 1 1.3 - -15 4 26.9 9 15.4 9+ 8.5 - - - -16 - - 8 16.7 9+ 7.7 4 13.1 - -17 - - 5 21.7 9+ 7.4 8 12.6 - -18 - - 3 22.7 9 15.7 8 13.0 - -19 - - 3 24.1 9+ 9.0 9 13.1 - -20 - - 6 19.2 9+ 8.5 9 13.0 - -21 1 34.8 8 17.6 9+ 8.4 7 13.3 - -22 4 27.5 9 15.9 9+ 8.4 2 13.2 - -23 8 23.3 9+ 21.7 9+ 9.1 2 13.2 - -
No 10 meters
15 metersdoesn’t lastlong

“Traditional” Summary, All Bands
Complicated, isn’t it??
San Francisco to Rest of USA, November 2005 SS
0
1
2
3
4
5
6
7
8
9
10
0 1 2 3 4 5 6 7 8 9 10 11 12 13 14 15 16 17 18 19 20 21 22 23
Time, UTC
Sign
al, S
-Uni
ts
7 MHz W314 MHz W321 MHz W37 MHz W914 MHz W921 MHz W9
DaylightNighttime

Coverage – Most Populous Areas
US Census 2000 Data

Coverage – Most Populous Areas
Midwest EastCoast

Sweepstakes 2005 ModelingAssumptions for VOAAREA
• Antennas: 3-element Yagi at 55 feet over flatground for 20, 15 and 10 meters.
• Antennas for 40 and 80 meters: Dipoles at 75feet over flat ground.
• Antenna are a little smaller than my usualassumptions but represent realistic stations.
• 1500 W of RF power.• Very Low SSN = 10.
80-Meter Coverage• Unless you have really big antennas on 80
meters, this band can be very challenging inSweepstakes from California.
• Particularly to the East Coast.• The area coverage plots that follow are
centered on Chicago, Washington (DC) andSan Francisco.

W9 is verystrong in thepopulousareas of USAon 80

W3 is verystrong in thepopulousareas of USAon 80

W6 is notstrong inthe mostpopulousareas on 80

40-Meter Coverage• Bigger antennas help on 40 meters
(although dipoles don’t do badly).• Big antennas are needed on phone,
especially to run the East Coast.• QRO is important for rate on 40.• There are times when the East Coast and
Midwest go “long skip” and thenCalifornians can have some advantages.

W9 has skipzone inMidwest on40 in theevening

W3 has skipzone in midEast Coaston 40 in theevening

W6 can coverW3 and W9skip zones on40 meters

40-Meter Slideshow
• From 23 UTC to 12 UTC (late afternoon toEast Coast sunrise).
• Assumes 75-foot high 40-meter dipoles.• Assumes 1500 W.


N6BV 2005: 0 Qs
Los Angelescoverage isgood at thistime

Los Angelescoveragebeginning togo long
2005: 59 Qs
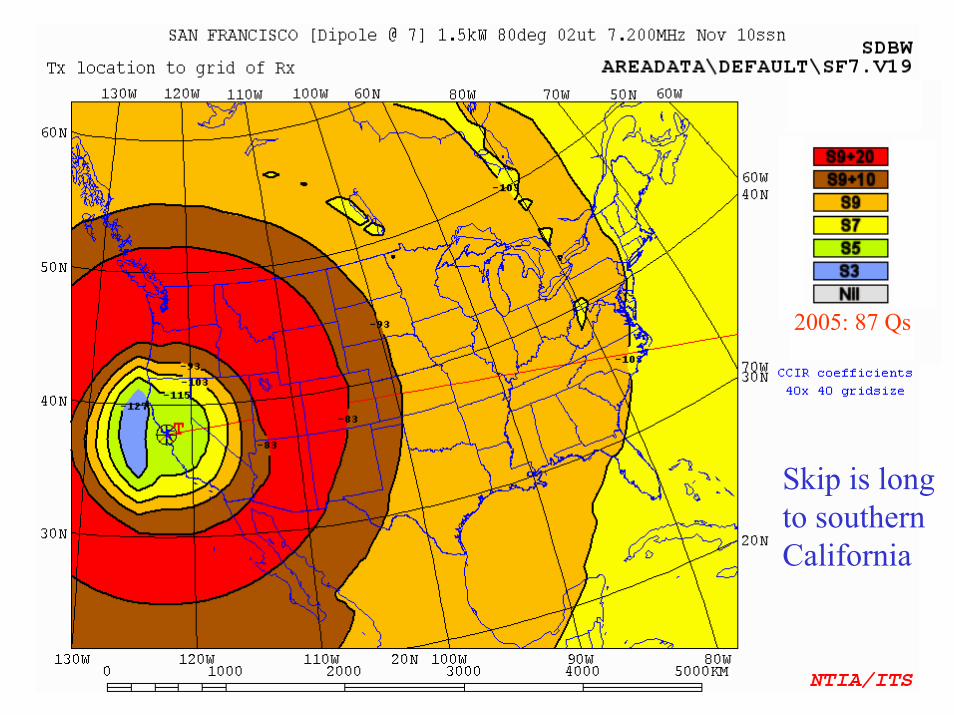
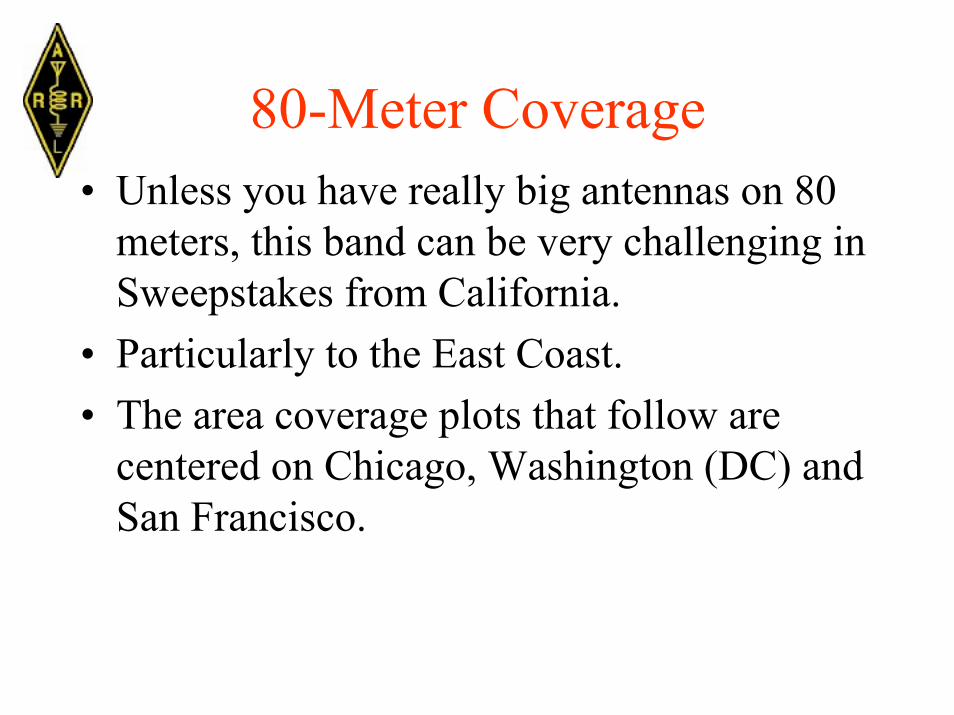
Skip is longto southernCalifornia
2005: 87 Qs

This hole insingle F2 hopcoverage iscaused by thevery lowangles needed
2005: 68 Qs

Midwesthole widens
2005: 47 Qs

Holebegins toshrink
2005: 53 Qs

2005: 72 Qs
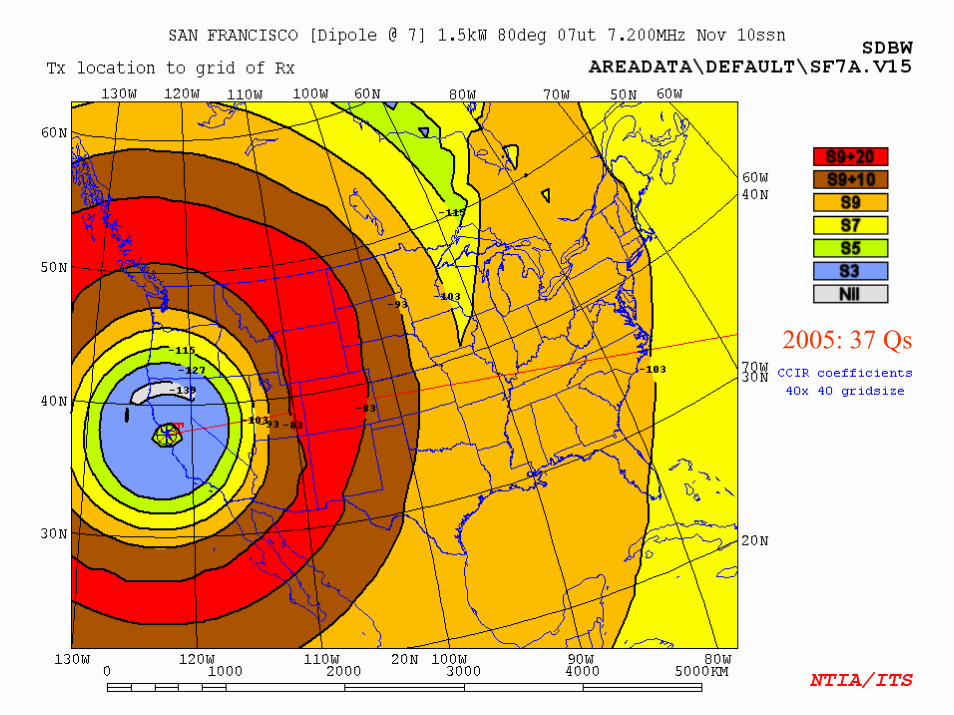
2005: 37 Qs


Midwestcoveragebegins tobreak up

East Coastsunrise –CA is stillstrong here

20-Meter Coverage• 20 is usually a zoo on phone, particularly
during low part of Solar Cycle, when 15 and10 meters are marginal or non-existent.
• Big stacks rule, although 1500 W and a 3-element Yagi can easily run rate.
• Moral of this story: Run QRO if youpossibly can, with big antennas!

W9 has bigskip zone inMidwest &East Coast on20 meters inthe afternoon

W3 has bigskip zone onEast Coast &Midwest on20 meters inthe afternoon

W6 coversMidwest andEast Coast on20 in theafternoon

20-Meter Slideshow
• From 13 UTC to 02 UTC (W6 sunrise toevening)
• Assumes 3-element Yagis at 55 feet.• Assumes 1500 W.


N6BV 2005: 84 Qs
Get thosePR andVI mults

2005: 86 Qs

2005: 76 Qs

2005: 22 Qs

2005: 5 Qs
I went to15 meters

2005: 6 Qs
East Coastgoes weak

2005: 34 Qs

2005: 1/60 Qs
1st/2nd Day
East Coastis back

2005: 16/56 Qs

20-metercoveragestartsshrinking
2005: 150/35 Qs

2005: 124/0 Qs
East Coastgoes dark
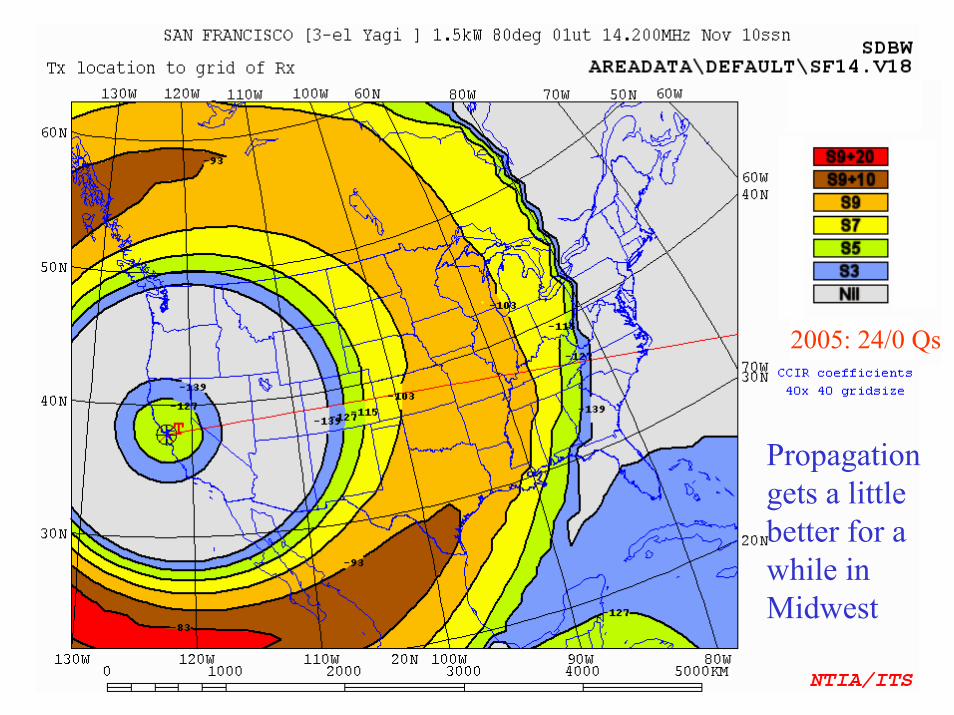
Propagationgets a littlebetter for awhile inMidwest
2005: 24/0 Qs
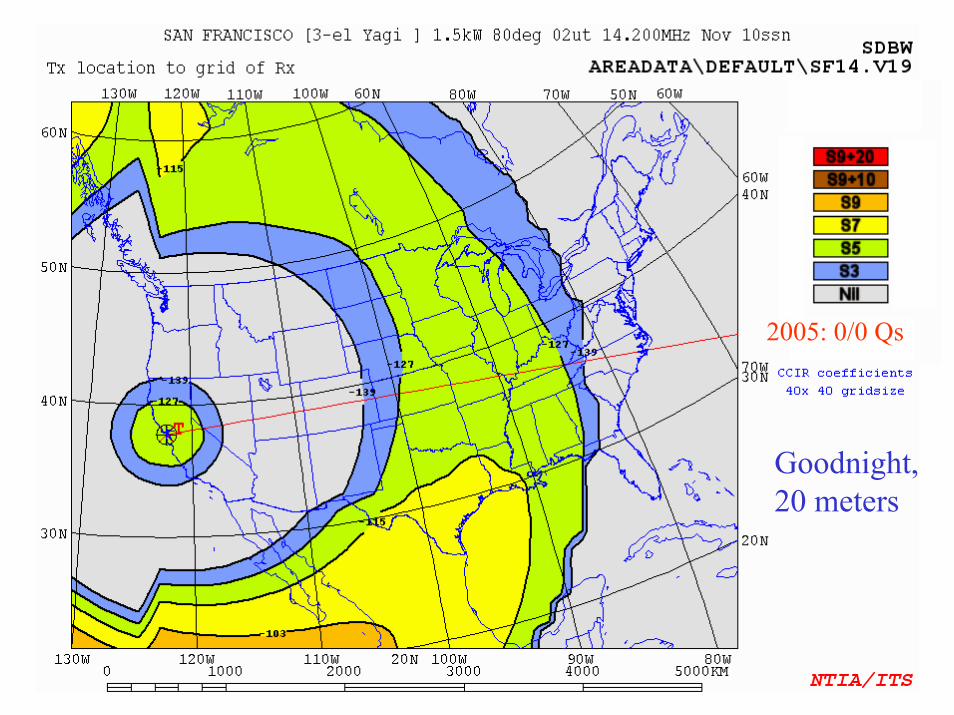
Goodnight,20 meters
2005: 0/0 Qs
15-Meter Coverage• During low portion of Solar Cycle, 15
meters will be reasonably good to Midwest,but marginal to East Coast.
• Big stacks help, of course, but relativelymodest 15-meter beams can do well on 15.

W9 has hugeskip zone on15 meterscoveringMidwest andEast Coast

W3 also hashuge skipzone on 15meters for theMidwest andEast Coast

W6 coversMidwest wellbut not wellto East Coast– no sunspots

15-Meter Slideshow
• 14 to 01 UTC (W6 sunrise at at 1443 UTCto sunset at 0103 UTC).
• Assumes 3-element 15-meter Yagis at eachend at 55 feet.
• Assumes 1500 W.
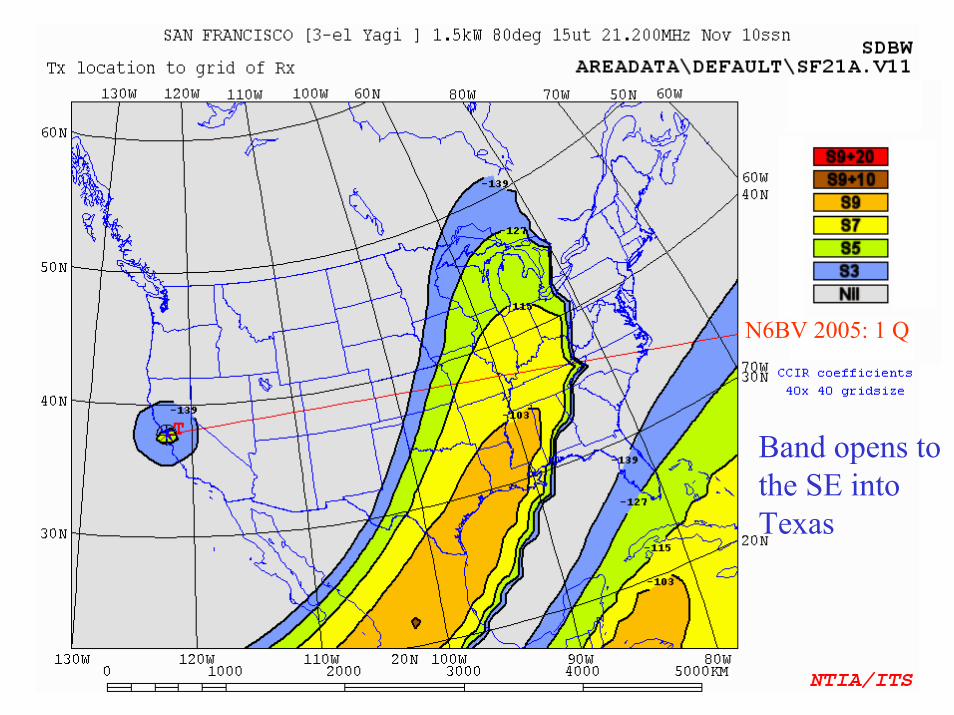
Band opens tothe SE intoTexas
N6BV 2005: 1 Q

Opening toMidwest
2005: 4 Qs

2005: 46 Qs

S5 to EastCoast
2005: 53 Qs

S7 in NewEngland andFlorida
2005: 65 Qs

2005: 25 Qs

Midwest isbest placewherethere’s someaction
2005: 97/1 Qs

2005: 90/0 Qs

Fading evenin Midwest
2005: 0/0 Qs
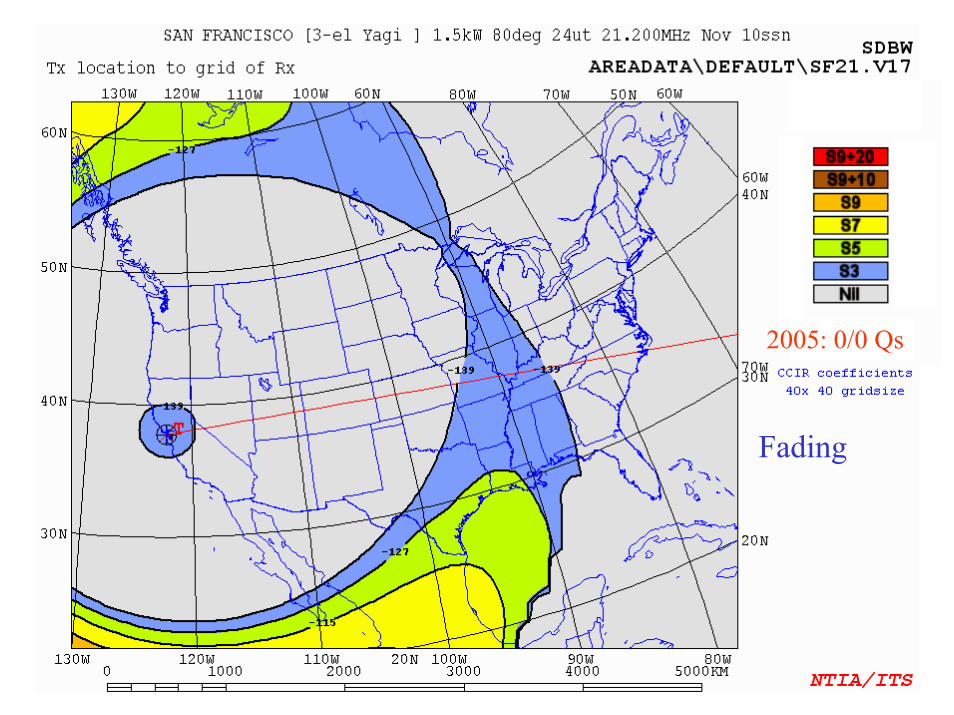
Fading
2005: 0/0 Qs

Gone…
2005: 0/0 Qs

• Compare area-coverage plots for 20 metersat 18 UTC for 100 W and for 1500 W.
• And what about QRP ?
What About Power?

1500 Wgives S9out to midOhio

For 100 W,S9 out toalmostKansas

For QRP,S7 outalmost toKansas…

“Omnidirectional” Antennas• The plots here have assumed “omnidirectional”antennas, a misnomer. This assumes that adirectional antenna can actually be turned towardsazimuth angles of interest.
• For flat terrain, I model antennas with EZNECand then convert to 2D VOAAREA type *.11 filesusing MultiNEC by AC6LA.
• For complex terrains, I use HFTA and convert toa 2D VOAAREA *.11 file using MAKEVOA.

Antenna pattern is “omnidirectional” (propagation is not…)

Customizing for Your Antennas• What kind of area coverage do you get foryour own antennas?
• I am very fortunate to use the superstation at N6RO for Sweepstakes Phone.
• N6RO has Yagi stacks on 10, 15, 20 and40 meters. These have significantly moregain than the 3-element Yagis in theprevious plots.

Customizing for Your Antennas
• Directional patterns only work for flat-ground terrain presently.
• Again, I model type *.13 3D patterns usingMultiNEC by AC6LA using with EZNEC core.

Customizing for Your AntennasThis shows pattern of 40-meter stack at N6RO pointed at 70°

This is the only way totake down two oldKLM 4L40 Yagis andreplace them with twonew M2 ones in oneday!
35 ton crane with 145’reach –
N6RO, Oct 3, 2005
40-Meter Stack at N6RO

Planning for a Contest
• The following shows a few slides from aslideshow I made for myself to guide myband-changing decisions for the 2005ARRL Sweepstakes phone contest.
• The number of QSOs made in the 2005SS Phone contest are listed on each.

20 m = 150 Qs 15 m
40 m23 UTC

20 m = 124 Qs 15 m
00 UTC 40 m

20 m = 24 Qs 15 m
01 UTC40 m = 59 Qs

How Did Predictions Compare With Reality?21 UTC on 15 Meters, N6RO Antennas
November 2005 Sweepstakes

Actual QSOs by N6BV in 2005SS Phone, 21 UTC on 15 Meters
This format was generated using DX Atlas; courtesy K6TA/K6KO.Note skip zone and the blank swath from Western NY down to NC.

Prediction
Actual
15 m21 UTC

20 m22 UTC
Low-Freq. Problems in VOACAP• Since 6/2/1999 VOACAP has produced signalpredictions lower than its predecessor IONCAPon bands lower than 40 meters.
• The problem lies in a change in calculationsmade for the loss through the E layer.
• VOA has no validation data below 5 MHzbecause they had no stations there.
• CAPMan does produce more believable low-frequency computations, but source code is gone.

Comparing Versions of VOACAP
Version
About 18 dB difference on 80 meters for “I” version(standing for IONCAP).
I useCAPMANfor mypropagationtables

80 meters,after 6/2/99
Pre 6/2/99
Stronger signalsinto Europe aremore believablefrom experience,(“I” version).

Low-Freq. Problems in VOACAP• Even after retiring from government service,Greg Hand and George Lane, the people whohelped develop VOACAP, have continued itsdevelopment. Bless them!
• Greg has posted a version of a newVOACAP/VOAAREA that includes the “I” optionon the “System” page. Thanks, Greg!

In Conclusion
• I’ve demonstrated some intuitive area-coverage predictions using VOAAREA.
• I have also touched on how to makecustomized antennas for VOAAREA.
• And by the way, the plots shown hereinvolve a great deal of graphical manipulationby hand!