
VMP Plc Half-YearReport JanuaryꟷJune 2019
22
VMP Plc Half-Year Report January ꟷJune 2019 August 21, 2019 Juha Pesola, CEO Hannu Nyman, CFO
Transcript of VMP Plc Half-YearReport JanuaryꟷJune 2019
VMP Plc Half-Year Report JanuaryꟷJune 2019August 21, 2019Juha Pesola, CEOHannu Nyman, CFO
Content1. VMP and operational environment
2. Financial development 1-6/2019
3. Outlook and financial objectives
Juha PesolaCEO
Hannu NymanCFO
August 21, 2019 VMP Oyj Q2/20192
VMP’s vision is to help both employers and employees succeed in the changing world of work.
VMP Oyj Q2/20194
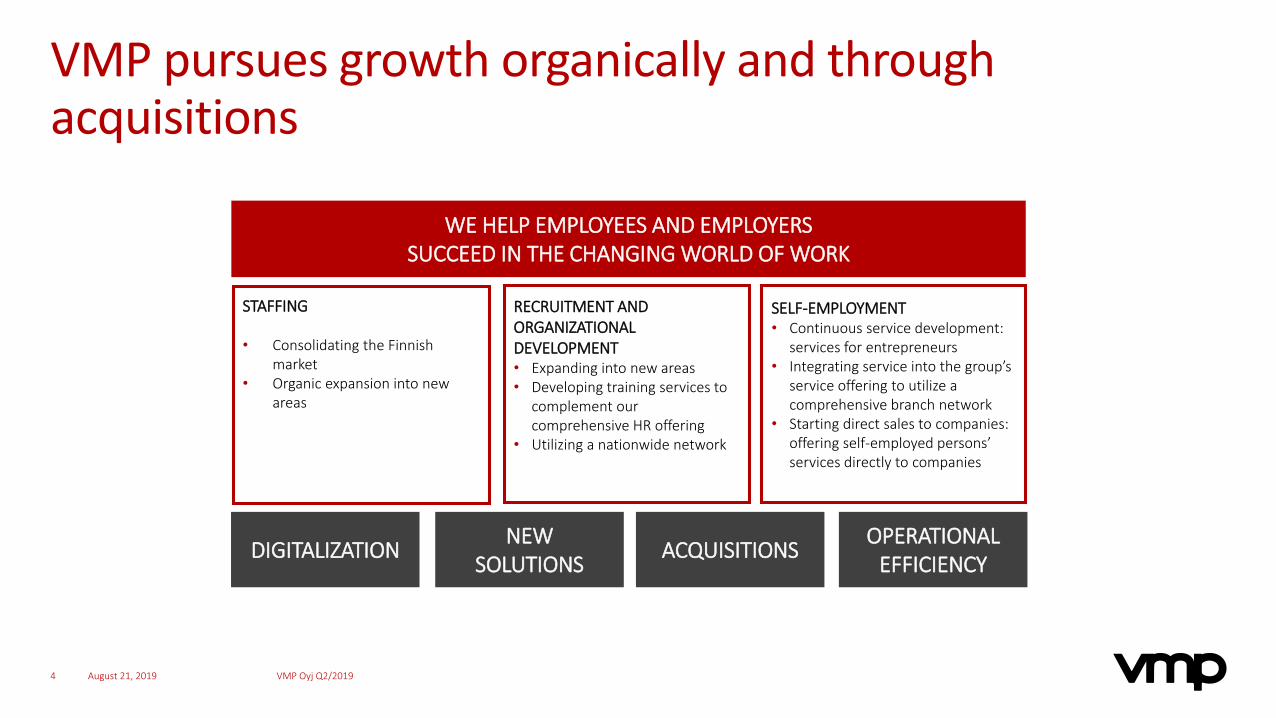
VMP pursues growth organically and throughacquisitions
August 21, 2019
WE HELP EMPLOYEES AND EMPLOYERSSUCCEED IN THE CHANGING WORLD OF WORK
STAFFING
• Consolidating the Finnish market
• Organic expansion into new areas
SELF-EMPLOYMENT• Continuous service development:
services for entrepreneurs• Integrating service into the group’s
service offering to utilize a comprehensive branch network
• Starting direct sales to companies: offering self-employed persons’ services directly to companies
RECRUITMENT AND ORGANIZATIONAL DEVELOPMENT• Expanding into new areas• Developing training services to
complement our comprehensive HR offering
• Utilizing a nationwide network
DIGITALIZATION NEW SOLUTIONS ACQUISITIONS OPERATIONAL
EFFICIENCY
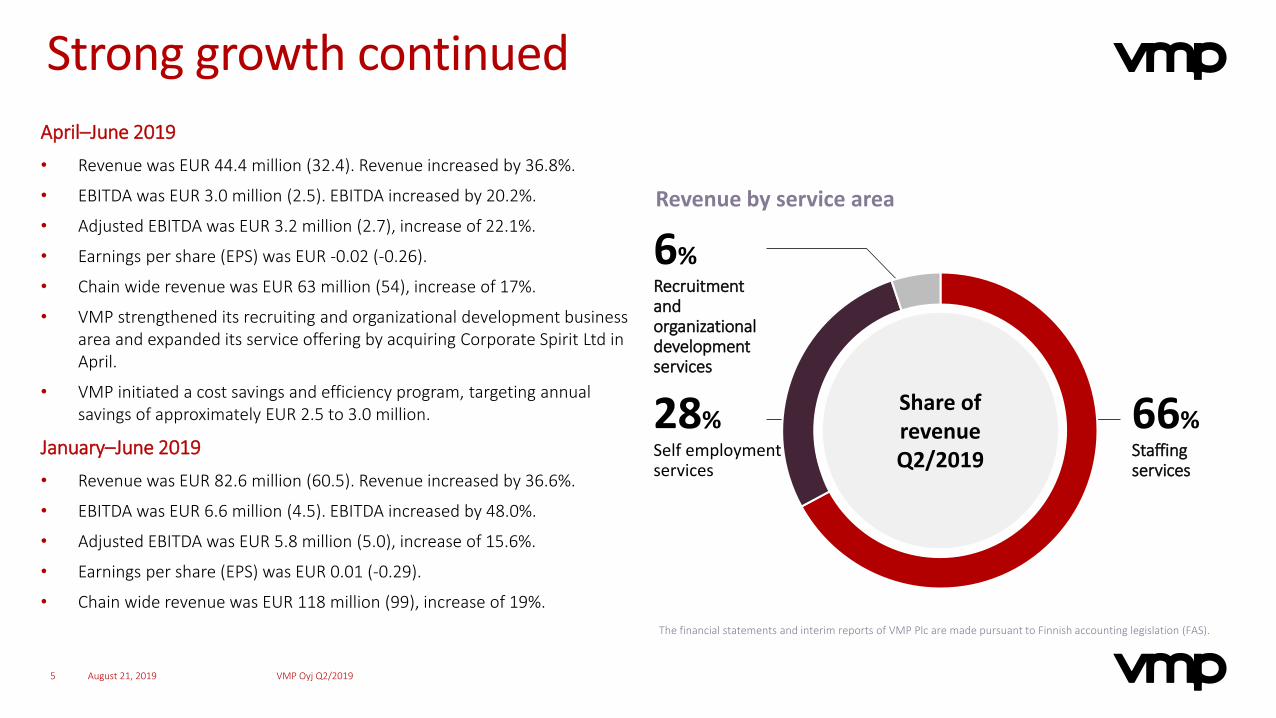
Strong growth continuedApril–June 2019• Revenue was EUR 44.4 million (32.4). Revenue increased by 36.8%.
• EBITDA was EUR 3.0 million (2.5). EBITDA increased by 20.2%.
• Adjusted EBITDA was EUR 3.2 million (2.7), increase of 22.1%.
• Earnings per share (EPS) was EUR -0.02 (-0.26).
• Chain wide revenue was EUR 63 million (54), increase of 17%.
• VMP strengthened its recruiting and organizational development business area and expanded its service offering by acquiring Corporate Spirit Ltd in April.
• VMP initiated a cost savings and efficiency program, targeting annual savings of approximately EUR 2.5 to 3.0 million.
January–June 2019• Revenue was EUR 82.6 million (60.5). Revenue increased by 36.6%.
• EBITDA was EUR 6.6 million (4.5). EBITDA increased by 48.0%.
• Adjusted EBITDA was EUR 5.8 million (5.0), increase of 15.6%.
• Earnings per share (EPS) was EUR 0.01 (-0.29).
• Chain wide revenue was EUR 118 million (99), increase of 19%.
August 21, 2019 VMP Oyj Q2/20195
Revenue by service area
Share ofrevenueQ2/2019
66%Staffing services
28%Self employment services
6%Recruitment and organizational development services
The financial statements and interim reports of VMP Plc are made pursuant to Finnish accounting legislation (FAS).
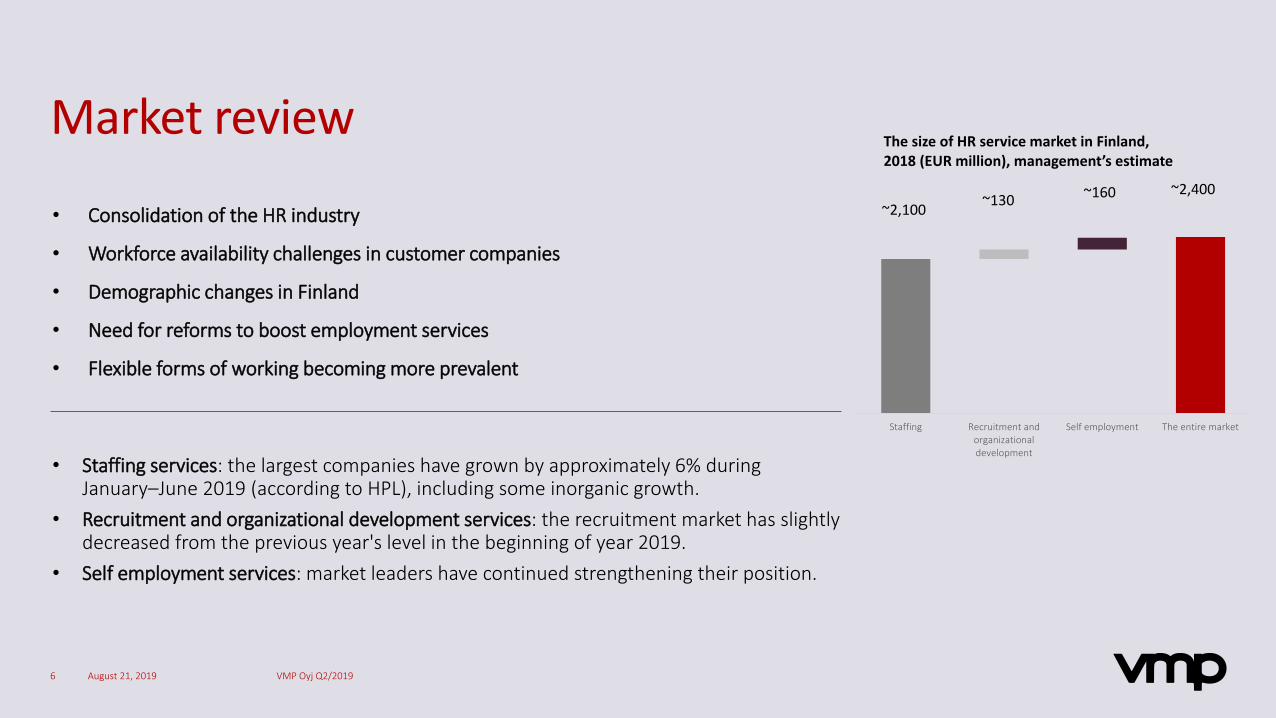
• Consolidation of the HR industry
• Workforce availability challenges in customer companies
• Demographic changes in Finland
• Need for reforms to boost employment services
• Flexible forms of working becoming more prevalent
• Staffing services: the largest companies have grown by approximately 6% during January–June 2019 (according to HPL), including some inorganic growth.
• Recruitment and organizational development services: the recruitment market has slightly decreased from the previous year's level in the beginning of year 2019.
• Self employment services: market leaders have continued strengthening their position.
Market review
August 21, 20196 VMP Oyj Q2/2019
Staffing Recruitment andorganizationaldevelopment
Self employment The entire market
The size of HR service market in Finland, 2018 (EUR million), management’s estimate
~2,100 ~130 ~160 ~2,400

Financial development 1-6/2019Hannu Nyman, CFO
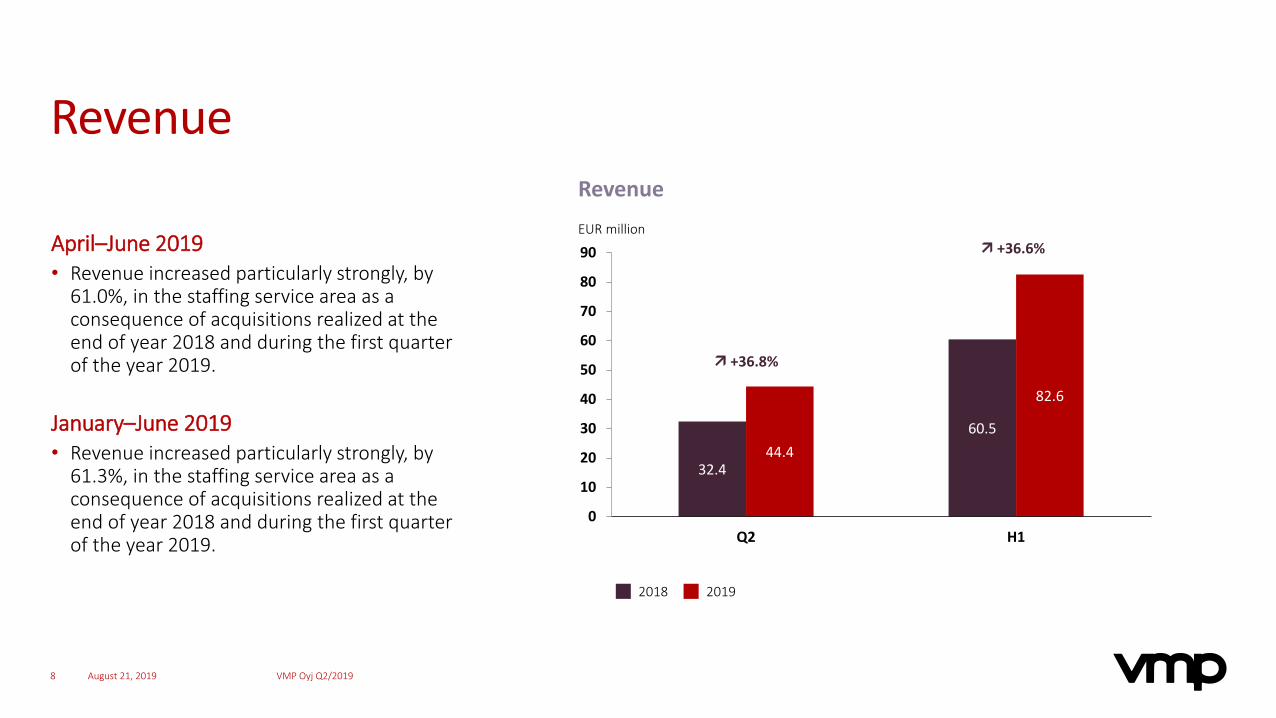
April–June 2019• Revenue increased particularly strongly, by
61.0%, in the staffing service area as a consequence of acquisitions realized at the end of year 2018 and during the first quarter of the year 2019.
January–June 2019• Revenue increased particularly strongly, by
61.3%, in the staffing service area as a consequence of acquisitions realized at the end of year 2018 and during the first quarter of the year 2019.
Revenue
32.4
60.544.4
82.6
0
10
20
30
40
50
60
70
80
90
Q2 H1
EUR million
8
+36.6%
VMP Oyj Q2/2019August 21, 2019
Revenue
2018 2019
+36.8%

August 21, 2019 VMP Oyj Q2/20199
Development of revenue by service area
45.4 48.359.7 70.0
2.2 3.7
8.58.7
22.138.0
41.446.1
69.6
90.1
109.5
124.9
0
20
40
60
80
100
120
140
2015 2016 2017 2018
EUR million
Staffing
Recruitment and organizational development
Self-employment
18.028.9
2.7
2.811.8
12.632.4
44.4
0
10
20
30
40
50
60
Q2/2018 Q2/2019
April–June 2019• Particular strong growth in staffing
service area. Revenue increased particularly strongly in service sector.
• In self-employment service area, increase in revenue stemmed mainly from the increase in the service’s user volume.
• In the recruitment and organizational development service area, increase in revenue stemmed from the acquisition of Corporate Spirit realized in the service area.
Financial years 2015–2018• Strong growth in all service areas.
22%
28%
59%
16%
36.8%
7.0%
5.2%
61.0%
Average yearlygrowth
2015-2018
Growth
EUR million
Staffing
Recruitment and organizational development
Self-employment

Adjusted EBITDA
EUR million
10 VMP Oyj Q2/2019August 21, 2019
April–June 2019
• EBITDA was EUR 3.0 million (2.5).• Adjusted EBITDA was EUR 3.2 million. EUR 0.3 million of
personnel expenses relating to severance payments wereentered as items affecting comparability.
• The change in the adjusted EBITDA margin from 8.2% to 7.3% was due to changed sales mix after acquisitions.
January–June 2019
• EBITDA was EUR 6.6 million (4.5).• Adjusted EBITDA of EUR 5.8 million is lesser than EBITDA by EUR
0.8 million mainly because of the capital gain of EUR 1.2 millionfrom Alina divestment, entered in other operating income, and personnel expenses of EUR 0.4 million relating to severancepayments.
• The change in the adjusted EBITDA margin from 8.3% to 7.0% was due to sales mix changes after acquisitions.
Adjusted EBITDA
2.7
5.0
3.2
5.8
0
1
2
3
4
5
6
Q2 H1
+15.6%
2018 2019
+22.1%
Key figures
August 21, 201911 VMP Oyj Q2/2019
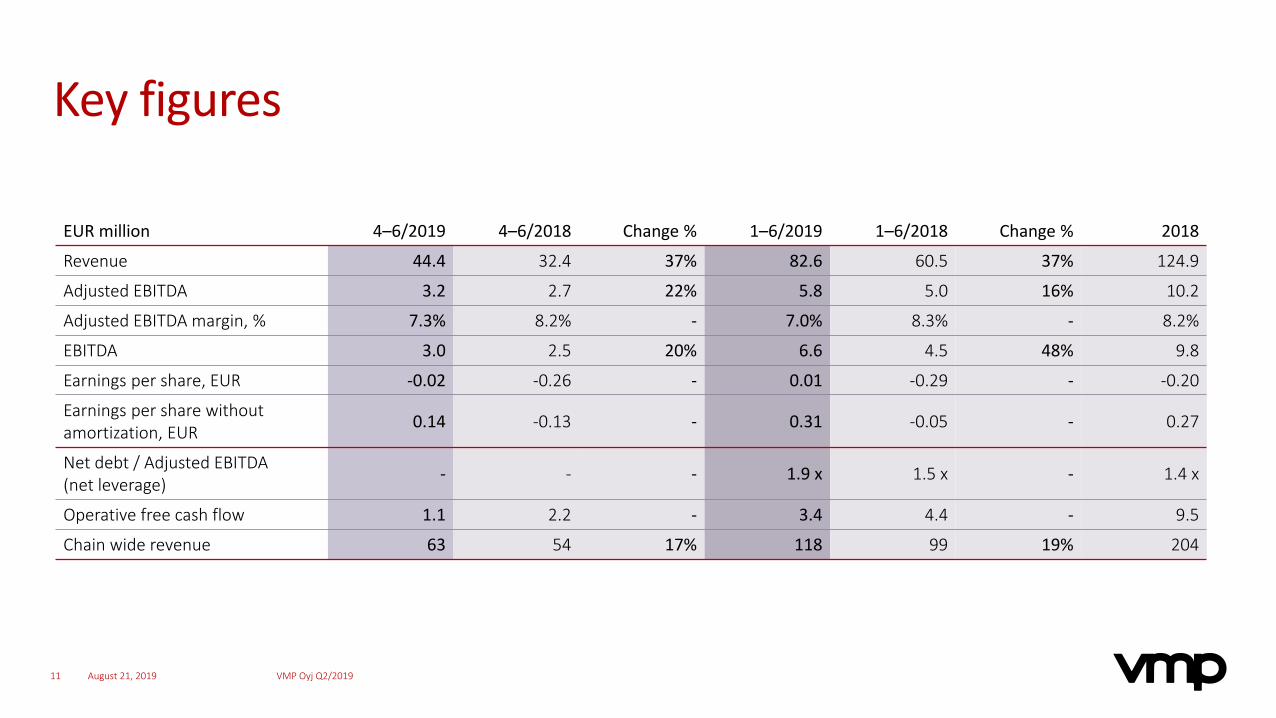
EUR million 4–6/2019 4–6/2018 Change % 1–6/2019 1–6/2018 Change % 2018
Revenue 44.4 32.4 37% 82.6 60.5 37% 124.9
Adjusted EBITDA 3.2 2.7 22% 5.8 5.0 16% 10.2
Adjusted EBITDA margin, % 7.3% 8.2% - 7.0% 8.3% - 8.2%
EBITDA 3.0 2.5 20% 6.6 4.5 48% 9.8
Earnings per share, EUR -0.02 -0.26 - 0.01 -0.29 - -0.20
Earnings per share withoutamortization, EUR 0.14 -0.13 - 0.31 -0.05 - 0.27
Net debt / Adjusted EBITDA(net leverage) - - - 1.9 x 1.5 x - 1.4 x
Operative free cash flow 1.1 2.2 - 3.4 4.4 - 9.5
Chain wide revenue 63 54 17% 118 99 19% 204
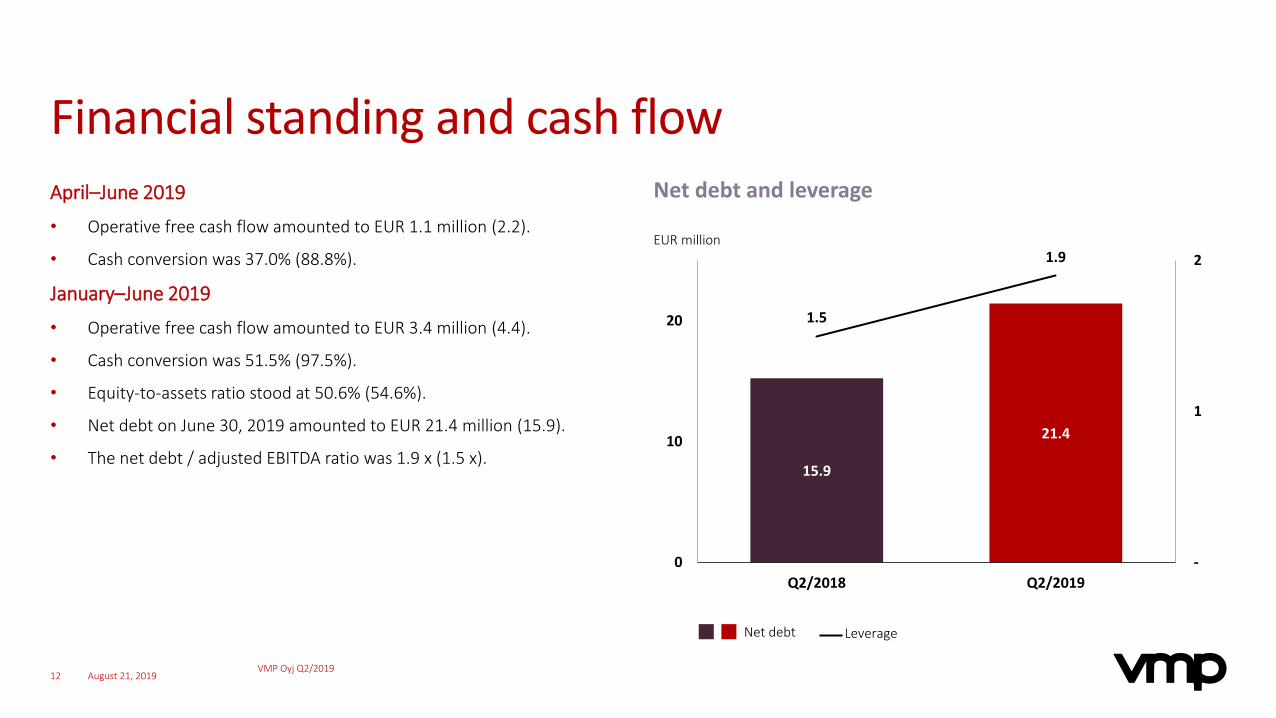
April–June 2019
• Operative free cash flow amounted to EUR 1.1 million (2.2).
• Cash conversion was 37.0% (88.8%).
January–June 2019
• Operative free cash flow amounted to EUR 3.4 million (4.4).
• Cash conversion was 51.5% (97.5%).
• Equity-to-assets ratio stood at 50.6% (54.6%).
• Net debt on June 30, 2019 amounted to EUR 21.4 million (15.9).
• The net debt / adjusted EBITDA ratio was 1.9 x (1.5 x).
Net debt and leverage
August 21, 201912
Financial standing and cash flow
15.9
21.4
1.5
1.9
-
1
2
0
10
20
Q2/2018 Q2/2019
EUR million
VMP Oyj Q2/2019
Net debt Leverage
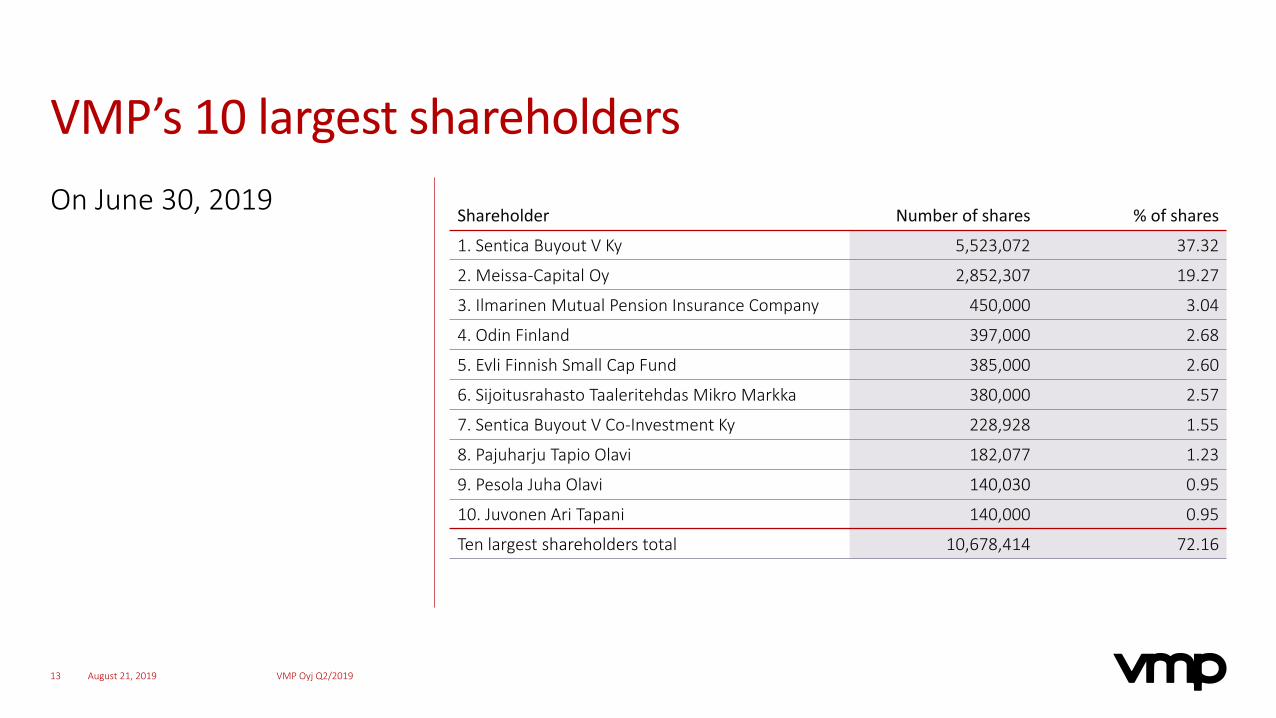
VMP’s 10 largest shareholdersOn June 30, 2019
August 21, 201913
Shareholder Number of shares % of shares
1. Sentica Buyout V Ky 5,523,072 37.32
2. Meissa-Capital Oy 2,852,307 19.27
3. Ilmarinen Mutual Pension Insurance Company 450,000 3.04
4. Odin Finland 397,000 2.68
5. Evli Finnish Small Cap Fund 385,000 2.60
6. Sijoitusrahasto Taaleritehdas Mikro Markka 380,000 2.57
7. Sentica Buyout V Co-Investment Ky 228,928 1.55
8. Pajuharju Tapio Olavi 182,077 1.23
9. Pesola Juha Olavi 140,030 0.95
10. Juvonen Ari Tapani 140,000 0.95
Ten largest shareholders total 10,678,414 72.16
VMP Oyj Q2/2019

Outlook for 2019VMP expects adjusted EBITDA to grow significantly during the financial period ending December 31, 2019 compared to the financial period ended December 31, 2018.
Current at VMPVMP and Smile unite to become the front-runner of the HR services industry

VMP and Smile to unite
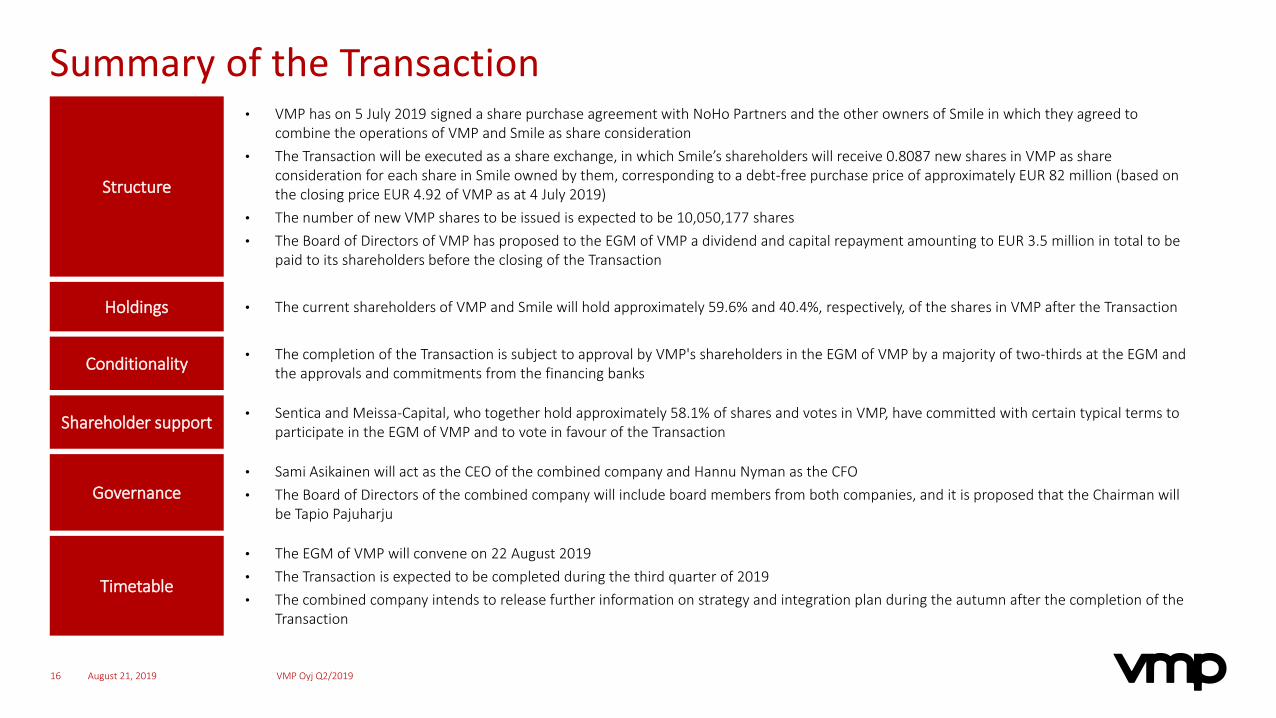
Summary of the Transaction
Structure
• VMP has on 5 July 2019 signed a share purchase agreement with NoHo Partners and the other owners of Smile in which they agreed to combine the operations of VMP and Smile as share consideration
• The Transaction will be executed as a share exchange, in which Smile’s shareholders will receive 0.8087 new shares in VMP as share consideration for each share in Smile owned by them, corresponding to a debt-free purchase price of approximately EUR 82 million (based on the closing price EUR 4.92 of VMP as at 4 July 2019)
• The number of new VMP shares to be issued is expected to be 10,050,177 shares• The Board of Directors of VMP has proposed to the EGM of VMP a dividend and capital repayment amounting to EUR 3.5 million in total to be
paid to its shareholders before the closing of the Transaction
Holdings • The current shareholders of VMP and Smile will hold approximately 59.6% and 40.4%, respectively, of the shares in VMP after the Transaction
Conditionality • The completion of the Transaction is subject to approval by VMP's shareholders in the EGM of VMP by a majority of two-thirds at the EGM and the approvals and commitments from the financing banks
Shareholder support • Sentica and Meissa-Capital, who together hold approximately 58.1% of shares and votes in VMP, have committed with certain typical terms to participate in the EGM of VMP and to vote in favour of the Transaction
Governance• Sami Asikainen will act as the CEO of the combined company and Hannu Nyman as the CFO• The Board of Directors of the combined company will include board members from both companies, and it is proposed that the Chairman will
be Tapio Pajuharju
Timetable
• The EGM of VMP will convene on 22 August 2019• The Transaction is expected to be completed during the third quarter of 2019• The combined company intends to release further information on strategy and integration plan during the autumn after the completion of the
Transaction
August 21, 2019 VMP Oyj Q2/201916
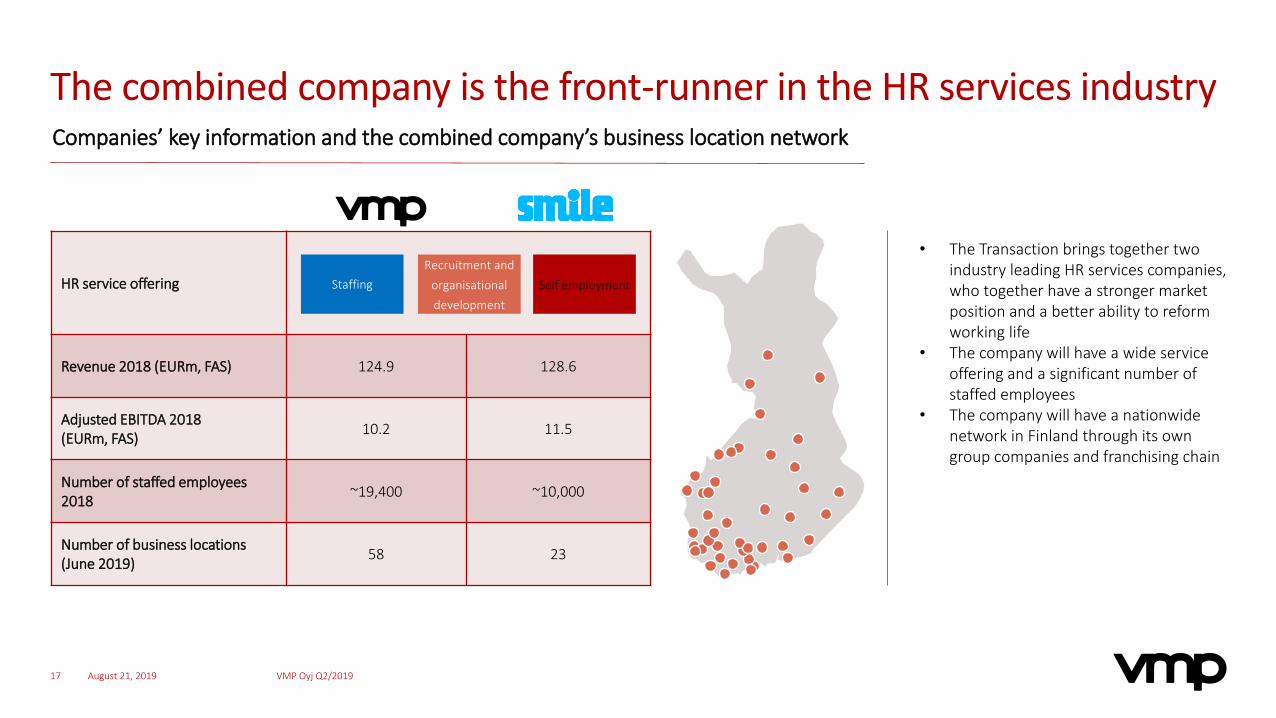
The combined company is the front-runner in the HR services industry
HR service offering
Revenue 2018 (EURm, FAS) 124.9 128.6
Adjusted EBITDA 2018(EURm, FAS) 10.2 11.5
Number of staffed employees 2018 ~19,400 ~10,000
Number of business locations (June 2019) 58 23
• The Transaction brings together two industry leading HR services companies, who together have a stronger market position and a better ability to reform working life
• The company will have a wide service offering and a significant number of staffed employees
• The company will have a nationwide network in Finland through its own group companies and franchising chain
StaffingRecruitment and
organisational development
Self employment
Companies’ key information and the combined company’s business location network
August 21, 2019 VMP Oyj Q2/201917
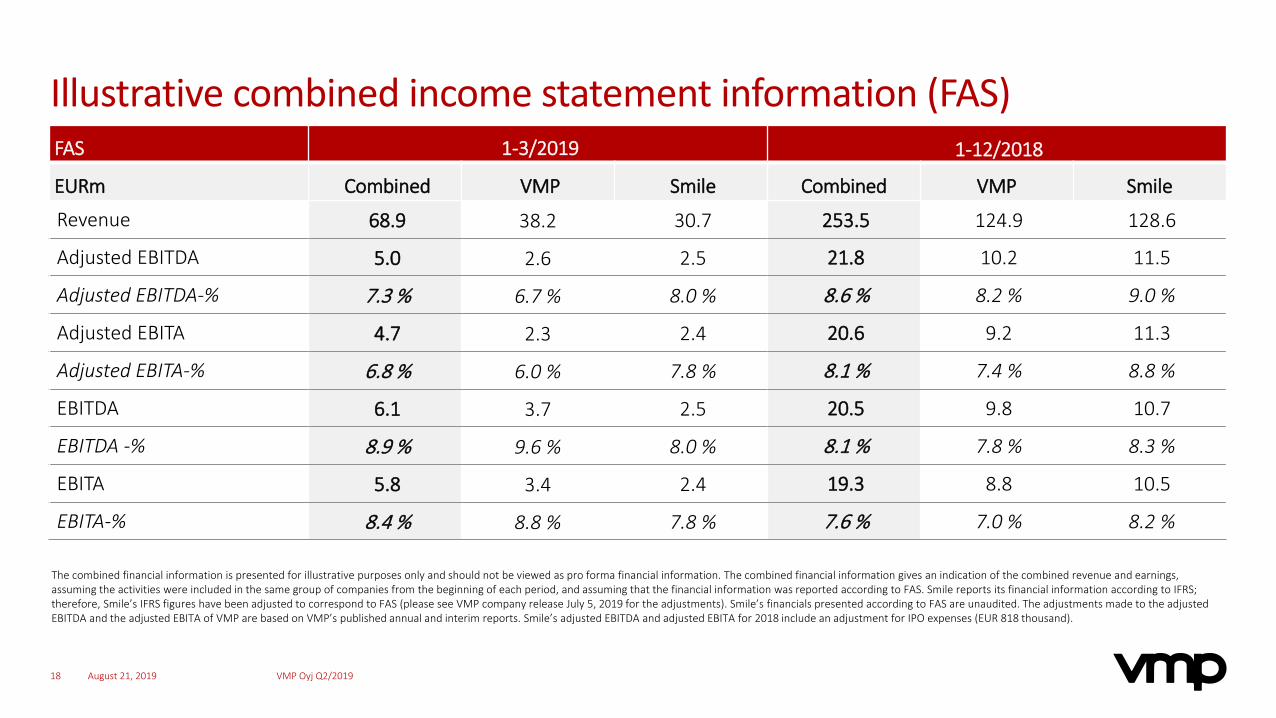
FAS 1-3/2019 1-12/2018
EURm Combined VMP Smile Combined VMP Smile
Revenue 68.9 38.2 30.7 253.5 124.9 128.6
Adjusted EBITDA 5.0 2.6 2.5 21.8 10.2 11.5
Adjusted EBITDA-% 7.3 % 6.7 % 8.0 % 8.6 % 8.2 % 9.0 %
Adjusted EBITA 4.7 2.3 2.4 20.6 9.2 11.3
Adjusted EBITA-% 6.8 % 6.0 % 7.8 % 8.1 % 7.4 % 8.8 %
EBITDA 6.1 3.7 2.5 20.5 9.8 10.7
EBITDA -% 8.9 % 9.6 % 8.0 % 8.1 % 7.8 % 8.3 %
EBITA 5.8 3.4 2.4 19.3 8.8 10.5
EBITA-% 8.4 % 8.8 % 7.8 % 7.6 % 7.0 % 8.2 %
Illustrative combined income statement information (FAS)
The combined financial information is presented for illustrative purposes only and should not be viewed as pro forma financial information. The combined financial information gives an indication of the combined revenue and earnings, assuming the activities were included in the same group of companies from the beginning of each period, and assuming that the financial information was reported according to FAS. Smile reports its financial information according to IFRS; therefore, Smile’s IFRS figures have been adjusted to correspond to FAS (please see VMP company release July 5, 2019 for the adjustments). Smile’s financials presented according to FAS are unaudited. The adjustments made to the adjusted EBITDA and the adjusted EBITA of VMP are based on VMP’s published annual and interim reports. Smile’s adjusted EBITDA and adjusted EBITA for 2018 include an adjustment for IPO expenses (EUR 818 thousand).
August 21, 2019 VMP Oyj Q2/201918
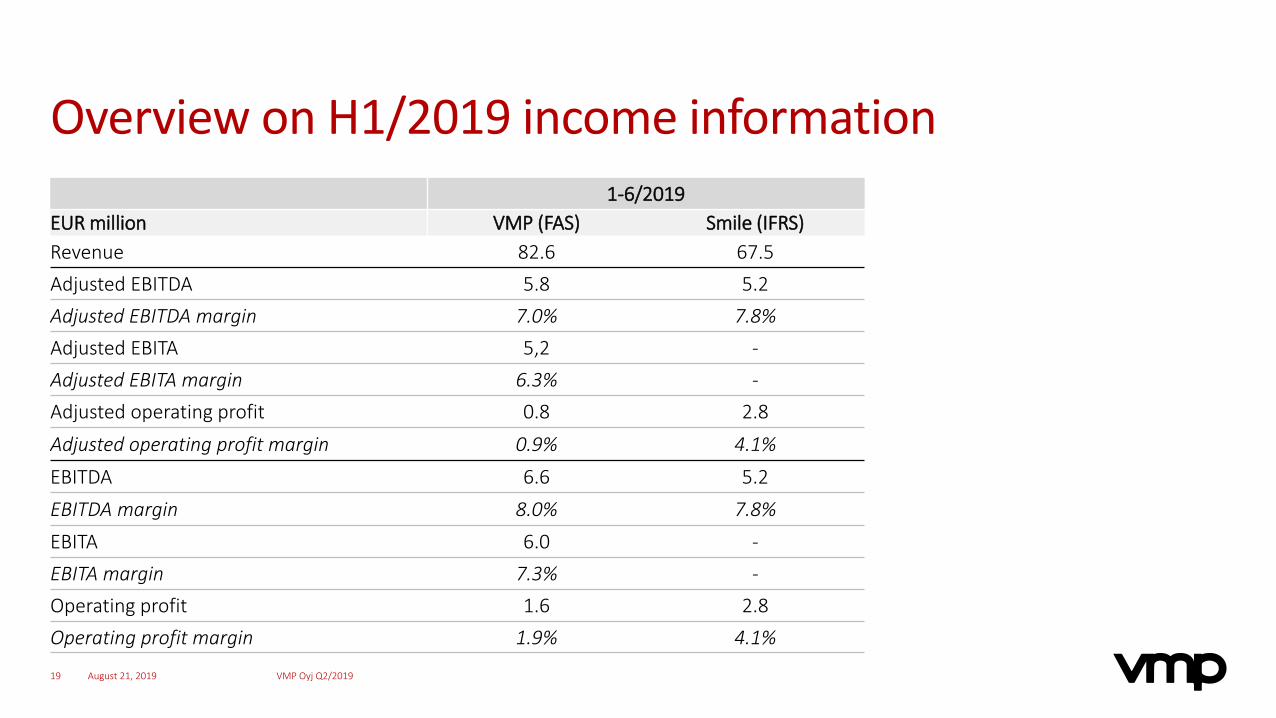
Overview on H1/2019 income information1-6/2019
EUR million VMP (FAS) Smile (IFRS)Revenue 82.6 67.5Adjusted EBITDA 5.8 5.2Adjusted EBITDA margin 7.0% 7.8%Adjusted EBITA 5,2 -Adjusted EBITA margin 6.3% -Adjusted operating profit 0.8 2.8
Adjusted operating profit margin 0.9% 4.1%
EBITDA 6.6 5.2EBITDA margin 8.0% 7.8%EBITA 6.0 -EBITA margin 7.3% -Operating profit 1.6 2.8Operating profit margin 1.9% 4.1%
August 21, 2019 VMP Oyj Q2/201919

Timetable (estimated)
August 2019
Q3/2019
In the autumn 2019, after the completion of the Transaction
The Transaction is expected to be completed
The Extraordinary General Meeting of VMP on 22 August 2019
The combined company releases more information on its strategy and integration plan
August 21, 2019 VMP Oyj Q2/201920

Questions?