VISUO-MOTOR PERFORMANCE IN CHILDREN VISUALLY …
44
From the Department of Clinical Neuroscience, Karolinska Institutet St. Erik Eye Hospital, Stockholm, Sweden VISUO-MOTOR PERFORMANCE IN CHILDREN VISUALLY IMPAIRED DUE TO FETAL ALCOHOL SYNDROME (FAS) Kristina Gummel Stockholm 2013
Transcript of VISUO-MOTOR PERFORMANCE IN CHILDREN VISUALLY …

From the Department of Clinical Neuroscience, Karolinska Institutet St. Erik Eye Hospital, Stockholm, Sweden
VISUO-MOTOR PERFORMANCE IN CHILDREN VISUALLY IMPAIRED DUE TO FETAL ALCOHOL SYNDROME (FAS)
Kristina Gummel
Stockholm 2013


From the Department of Clinical Neuroscience, Karolinska Institutet St. Erik Eye Hospital, Stockholm, Sweden
VISUO-MOTOR PERFORMANCE IN CHILDREN VISUALLY IMPAIRED DUE TO FETAL ALCOHOL SYNDROME (FAS)
Kristina Gummel
Stockholm 2013

All previously published papers were reproduced with permission from the publisher. Published by Karolinska Institutet. Printed by local printer of Bernadottelaboratoriet. © Kristina Gummel, 2013 ISBN 978-91-7549-143-11

ABSTRACT
Purpose: To investigate the ophthalmological characteristics and to evaluate the magnocellular function in Russian orphanage children with fetal alcohol syndrome (FAS).
Methods: In the study 100 children aged 10-16 from Russian (St Petersburg) orphanages were examined: 50 with FAS and 50 control children. In the first study all 100 children were tested with distant visual acuity with subjective optimal correction (VA; Sivtsev chart), skiascopy, visual inspection for FAS external ocular features, biomicroscopy, eye alignment using cover test and indirect ophthalmoscopy.In the second study 89 children from above groups (49 with FAS and 40 controls) were included in the study. A coherent motion perception test was used. The test consisted of 150 white moving dots on a black background presented in different signal-to-noise ratio conditions. The task was direction detection of the coherently moving dots whose percentage decreased at each step of the test.
Results: All analyzed parameters were worse in children with FAS compared with controls. FAS children showed a higher incidence of amblyopia, hyperopia, astigmatism and anisometropia. In FAS children the incidence of blepharophimosis was 34% (8% in controls), epicantus 14% (2% in controls), telecantus 32% (compared to 4% in controls), eye-lid ptosis 9% (none in controls) and strabismus 26% (10% in controls). Ophthalmoscopy revealed a tilted optic disc in five FAS-children (7%) compared with none in controls. In the Motion perception test a significant difference between the two groups was found (p = 0.018). Children with FAS had lower coherent motion perception ability in all the signal-to-noise ratio conditions. A significant difference between difficulty levels (p < 0.001) was found for all subjects in both groups – decreasing the stimulus signal-to-noise level decreased the motion perception score. In both groups, the motion perception score differed for vertical and horizontal stimuli (p = 0.003) with better performance for vertical stimuli.
Conclusion: Russian FAS children show a higher incidence of structural and functional visual problems that needs to be taken into account and demands participation of the ophthalmologist in monitoring of those patients. Impaired motion perception in FAS children could be indicative of a magnocellular pathway developmental dysfunction resulting from alcohol brain damage.

LIST OF PUBLICATIONS
I. Gummel, K. Ygge, J. (2013): Ophthalmological findings in Russian children with fetal alcohol syndrome. Accepted in European Journal of Ophthalmology 2013-03-30.
II. Gummel, K. Ygge, J. Benassi, M. Bolzani, R (2012): Motion perception in children with foetal alcohol syndrome. Acta Paediatrica 101(8), e327-e332.

TABLE OF CONTENTS
1 Thesis ........................................................................................................................ 1
1.1 Introduction ......................................................................................................... 1
1.1.1 Background .............................................................................................. 1
1.1.2 The epidemiology of FAS ....................................................................... 2
1.1.3 Ethanol toxicity ........................................................................................ 2
1.1.4 Cognitive functions in FAS children ....................................................... 3
1.1.5 Magnocellular pathways and motion perception test ............................. 3
1.2 Materials and methods ....................................................................................... 4
1.2.1 Materials ................................................................................................... 4
1.2.2 Methods .................................................................................................... 7
1.2.3 Statistical analysis .................................................................................... 9
1.3 Results ................................................................................................................. 9
1.3.1 Visual acuity and refractive errors .......................................................... 9
1.3.2 Ophthalmological findings .................................................................... 10
1.3.3 Ocular alinment ..................................................................................... 11
1.3.4 Motion perception .................................................................................. 11
1.4 Discussion ........................................................................................................ 14
1.4.1 Methodological considerations .............................................................. 14
1.4.2 Visual functions ..................................................................................... 15
1.4.3 Ocular anomalies in FAS children ........................................................ 16
1.4.4 Strabismus .............................................................................................. 16
1.4.5 Cognition ................................................................................................ 16
1.5 Conclusion......................................................................................................... 18
1.6 Summary in Russian ......................................................................................... 19
2 Acknowledgements ................................................................................................. 30 3 References ............................................................................................................... 31

LIST OF ABBREVIATIONS
FAS Fetal alcohol syndrome
FASD Fetal acohol spectrum disorders
ARND Alcohol related neurodevelopmental disorders
DNA Deoxyribonucleic acid
RNA Ribonucleic acid
WISC-III Wechsler Intelligence Scale for Children, 3-rd edition
MT Middle temporal area
RDK Random dot kinematogram
KG Kristina Gummel
VA Visual acuity
SPSS Statistical Package for the Social Sciences

1
1 THESIS
1.1 Introduction
1.1.1 Background
In 1973 Jones & Smith described fetal alcohol syndrome (FAS) that can develop in children who’s mothers abused alcohol during pregnancy. Alcohol consumption during pregnancy and its effect on the developing human is a serious problem all over the world. The syndrome is characterized by pre- and/or postnatal growth retardation, central nervous system disturbances, together with major and minor congenital malformations, the most typical being the craniofacial anomalies (Clarren & Smith, 1978; Jones & Smith, 1973). Children with FAS usually present with short palpebral fissures, flat broad nosebridge, hypoplastic midface and long thin upper lip without a distinct philtrum and with sparse lip-red (Jones & Smith, 1973; see also Fig.1). The typical facial features and growth retardation in patients with FAS decrease with increasing age, but they still might have serious central nervous system disturbances that are due to the alcohol abuse by pregnant mothers (Streissguth, 1993).
Figure 1 – Photo of a boy (16 years of age) with the fetal alcohol syndrome. Please note typical facial features – telecanthus, short palpebral fissures, flat nosebridge, hypoplastic midface and long thin upper lip without a distinct philtrum.
Nowadays the term fetal alcohol spectrum disorders (FASD) is common as an umbrella term describing the range of effects that can occur in an individual whose mother consumed alcohol during pregnancy. These effects may include physical, mental, behavioral, and/or learning disabilities with possible lifelong implications. The term FASD is not intended for use as a clinical diagnosis as an individual would not receive a diagnosis of FASD. Diagnoses like FAS, partial FAS and alcohol related neurodevelopmental disorders (ARND) fall under the umbrella of FASD (Riley & McGee, 2005). FAS produces the most serious consequences including persistent typical malformations, cognitive deficits, extensive developmental delays, major defects in central nervous system structure and function (Jones & Smith, 1973).

2
1.1.2 The epidemiology of FAS
Worldwide incidence of FAS was shown to be 0.97 per 1000 live births (Abel, 1995) but the incidence of FAS is very different all over the world. In USA the reported incidences was 0.6 up to 4.6 FAS fetuses per 1000 live birth (as reviewed in Sampson et al., 1997). The highest verified incidence of FAS has been shown in the Western Cape Province of South Africa with 46.4 per 1000 school children aged 5 to 9 years (May et al., 2000).
There are no FAS incidence data available from Russia, but at some internet portals concerning this problem it is indicated that approximately 11% of pregnant women use alcohol. In a study from Moscow orphanages the FAS incidence reported was 7.9 % (Riley et al., 2003). Miller and coworkers studied children in orphanages in Murmansk, Russia, and found that 58% of the children had some phenotypic features suggesting prenatal alcohol exposure (Miller et al., 2006).
1.1.3 Ethanol toxicity
Ethanol penetrates the placenta into the fetus blood during the whole duration of the gestation and after alcohol consumption the alcohol concentration in the fetus blood equals the mother’s concentration in a few minutes. The fetus liver does not produce alcohol dehydrogenase to eliminate ethanol from the body and therefore the ethanol circulates in the fetus blood and tissues. Alcohol dehydrogenase production in the fetus liver only begins in the second half of the pregnancy (Smith et al., 1971; Card et al., 1989). Not only the liver but other embryo tissues do not have mature enzyme system to metabolize alcohol which results in damage to the fetus (Whitmire et al., 1995).
Ethanol and acetaldehyde easily penetrates through membranes as it is very lipotropic. Penetrating into the embryonic cells ethanol and acetaldehyde leads to the suppression of DNA and RNA synthesis resulting in protein synthesis suppression, alcoholic hypoglycemia, transplacental transportation of essential acids and trace elements develops in the embryo (as reviewed in Brien & Smith, 1991).
The mechanism of alcohol teratogenicity depends on the stage of embryo development. During the first four weeks of pregnancy alcohol leads to cytotoxic and mutagenic effects that very often results in embryo death. At 4th-7th weeks of gestation slow cell migration (mainly in neural tissues of the embryo layers), disturbances of neuron proliferation and structural anomalies of nervous system can be the result of alcohol exposure (Lindsley et al., 2002). It was rewied in Chen and coworkers (2003) that the first and the third trimesters of pregnancy are the most dangerous for the embryo if they face alcohol abuse by mothers. Olney and coworkers (2001) showed in an experimental model of developing rats brain that prenatal alcohol abuse leads to the massive death of brain neural cells even during the last weeks of pregnancy (Olney, 2001).
The nervous and cardio-vascular systems are most sensitive to alcohol in the embryo (Liu et al., 2009). Anomalies of the eyes and their adnexa, were found in 90% of children with FAS (reviewied by Strömland & Pinazo-Duran, 2002). The eye abnormalities ranged from extensive malformations, such as microphthalmos,
buphthalmus, coloboma of the iris and uvea to minor anomalies such as anomalies of refraction and blepharophimosis (Strömland, 1987; Strömland & Pinazo-Duran, 2002).

3
1.1.4 Cognitive functions in FAS children
Multiple neurological sequelae are also associated with FAS. It has been shown that brain injury resulting from prenatal alcohol exposure can lead to significant deficits in cognitive abilities like deficits in planning, strategy and working memory together with attention disorders revealing that the cognitive problems associated with FAS/FASD are widespread and generalized (Green et al., 2009).
Janzen and coworkers (1995) revealed that FAS-children displayed impaired visuo-motor integration in the presence of average visual-perceptual matching and those children were also reported to exhibit a higher frequency of behavior problems compared to controls. In a Swedish study performed by Landgren and coworkers (2010) it was shown that from a cohort of children adopted from Eastern Europe FASD was found in 52% of children (from those 52% 30% had FAS), 90% of all adopted children were identified as having a neurodevelopmental/ behavioral, cognitive, or neurologic diagnosis. Attention-deficit/hyperactivity disorder was found in 51%, mental retardation or significant cognitive impairment in 23%, autism in 9%, and developmental coordination disorder in 34%. According to the cognitive tests (the Leiter-Revised test and WISC-III), 54% children had cognitive deficits (Landgren et al., 2010).
Despite several published studies on FAS there is still not enough knowledge about the cognitive characteristics of children with FAS. As heavy alcohol consumption during pregnancy can result in FAS, the effects of drinking at low-to-moderate levels are much less clear that the question as to whether prenatal alcohol consumption is responsible for a large and potentially preventable burden of neurodisability remains unanswered at this time (Gray et al., 2009).
1.1.5 Magnocellular pathways and motion perception test
Investigation of the visual functions by traditional methods does not seem to fully outline the problems children with FAS may have. For example, the magnocellular visual function corresponding to low spatial frequency, movement, achromatic and low contrast visual stimuli (Talcott et al., 2000; Bednarek & Grabowska, 2002) is traditionally not tested by standard methods. One way to study magnocellular visual function is testing the coherent motion perception. We have not found any studies on motion perception in FAS children but this function has been studied in i.e. autism (Pellicano & Gibson, 2008; White et al., 2006), schizophrenia (Chen, 1999; Li, 2002), Williams syndrome (Atkinson et al., 1997) and dyslexia (Benassi et al., 2010; Talcott et al., 1998; Witton et al., 1998). Coherent motion detection relies on neural activation of the dorsal visual stream, including cortical area MT/V5 (Braddick et al., 2001) and projects to the parietal cortex and to the cerebellum (Nicolson et al., 2001). Motion perception has been considered a magnocellular function because the magnocellular pathway heavily innervates dorsal extra striatal visual areas (Merigan, Nealey, & Maunsell, 1993). As well Boden and Giaschi (2007) proposed a model for interpreting the connection between the magnocellular system and reading at different levels of analysis: at the behavioral level, the authors hypothesized that low spatial frequency information carried by the magnocellular system could be an important determinant in learning to read and that position encoding, incorporating parafoveal, and foveal interactions might constrain reading.
The magnocellular function such as motion perception/detection can be tested by random dot kinematograms (RDK). Sensitivity to coherent motion is determined by the

4
spatial integration of motion information in the presence of visual noise. Usually, coherent motion or global motion is presented as a paradigm in which a number of white dots move coherently in a specific direction on a dark background in the presence of visual noise. The subject is asked to discriminate the direction of coherent motion. In the majority of the tasks, noise is introduced as a proportion of dots moving independently in a Brownian manner (Benassi et al., 2010).
The present study (I) tries to give some new information about the cognitive characteristics of FAS patients by the motion perception analysis and could be helpful to understand some processes in FAS-patients as this may have implications for other visual functions such as reading, motion and depth perception.
Disappointingly there is still relatively little knowledge about FAS in Russia both among medical personnel and in the general population (Riley et al., 2003; Balachova et al., 2007). A relatively high incidence can be assumed since alcohol consumption is high in Russia and high consumption parallels a high incidence of FAS (Kristjanson et al., 2007). The incidence of different types of ocular abnormalities in FAS children has been reported to differ between different studies (Stromland, 1985; Chan et al., 1991, Ribeiro et al., 2007). Therefore, the aim of the study II was to describe the ophthalmological findings in a sample of FAS children in St Petersburg, Russia. This is also important, as there is an increasing interest in adoption of children from Russia.
1.2 Materials and methods
1.2.1 Materials
Fifty Russian children with FAS were compared with an age- and gender matched control group of 50 children without FAS (for demographic data see Table 1), from families in the same geographic area. These two groups were selected from 240 children, living in three orphanages in St Petersburg.
The inclusion criteria in the FAS group were a screening score of more than 20 in the FAS screening form (Burd et al., 1999) (Figure 2). This screening is based on mental development, child growth (at or below the 10th percentile for either height or weight), specific malformations typical for the syndrome (e.g. short palpebral fissures, long philtrum and short epicanthal folds). The information in the FAS screening form was coupled with information about maternal alcohol consumption during pregnancy, signs of growth retardation, mental disorders and the characteristic facial and other features in FAS children. Information about neurological development from examinations, performed by medical specialists in these fields, was retrieved from the children’s medical records. The FAS score examiner was not informed about the children’s previous history to exclude any ‘human factor’ in the grouping. All other features and parameters were investigated by one of the authors (KG) to minimize examiner-dependent variation in the results. In all cases, where maternal alcohol abuse was reported in the children’s medical record, the FAS score in the screening test was higher than 20.
The control children had explicit information in their health cards about absence of mother’s abuse of alcohol during pregnancy and all children in the control group had to be negative for FAS in the FAS screening form (score is less than 20). During the selection procedure, three children without information about maternal alcohol use during pregnancy were found who had FAS scores of more than 20. They were excluded from the study. Another seven children with a maternal history of drug abuse

5
together with alcohol abuse in their medical records were also excluded from the study. No other information about maternal health during pregnancy was taken into consideration during the grouping of children in the study.
Figure 2 – FAS screening form.
The mean FAS screening score for children in the FAS group was 46 (range, 20–104), compared with 6 (range, 0–18) in the control group (see Table 1), medians were 41 and 0, respectively (see Fig.3 for details).

6
Group Gender
Age FAS-score
10-12 13-14 15-16 Mean Mean
N / % N / % N / % Years
FAS Мale 5/10 18/36 9/18 13,7 51
Female 3/6 6/12 9/18 14,0 40
Controls Мale 4/8 19/38 7/14 13,7 6
Female 2/4 9/18 9/18 14,1 6
Table 1 - Demographic data of the children in the present study.
Almost all patients in both groups had some neurological problems according to the medical records, that is, hyperactivity (n = 16 in the FAS group and n = 18 among controls), and mild-to-moderate mental retardation was present in 31 children in the FAS group and 15 children in the control group. Similarly, attention and concentration problems were present in 26 FAS children and 23 controls.
Figure 3 – Distribution of FAS-screening score in children in the present study.
The study was performed according to the tenets of the Helsinki declaration and was approved by the local ethical committee. Written informed consent was obtained from all children and their legal representatives.
During the motion perception testing there were fewer children in both groups, i.e. 49 FAS children and 40 control children; the latter matched the FAS children group in terms of gender, age and orphanage.

7
1.2.2 Methods
The first step was to assess the general ophthalmological characteristics of the FAS children and controls.
Distant visual acuity (VA) was measured in a well lit room monocularly at 5 meters distance using Sivtsev chart with Cyrillic alphabet optotypes in line (Fig. 4) without and with subjective optimal correction. The measurement was performed according to standard Russian procedures (Somov, 2005). The VA was defined according to clinical practice as at least 80% correctly read letters on a single line. No VA above 1.0 was measured since this level is the common criterion for normal vision in Russia. Subnormal VA (amblyopia) was defined as <1.0 in one or both eyes, when monocular at least two lines of interocular difference and no apparent organic cause (Ohlsson, 2003).
Figure 4 – Sivtsev chart for visual acuity measurements (Cyrillic alphabet linear chart widely used in Russia).
Refraction was measured using skiascopy by ghost ophthalmoscopy with a plane mirror from 1 m distance. The child fixated an optotype at 5 meters distance to avoid accommodative pseudomyopia. No cycloplegia was used.
The spherical equivalent refraction (SE) was calculated for each eye. Emmetropia was defined as refraction > -0,5 diopters (D) or <+0.5 D. Myopia was defined as < -0.5 D. Low myopia was defined as a sphere of -0.50 to -3.00 D, medium myopia as a refractive error between -3.25 and -6.00 D, and high myopia as myopia of more than -

8
6.00 D (Grosvenor, 1987). Hyperopia was defined as refraction >+0.5D. Low hyperopia was defined as a sphere of +0.50 to +2.00 D, moderate hyperopia as a refractive error between +2.25 and +5.00 D, and high hyperopia as a refractive error of more than +5.00 D (Augsburger, 1987). Astigmatism was recorded as positive cylinder and only if >0.75D.
Anisometropia was defined as inequality in either refractive axis (spherical or cylindrical) more than 0,5D. The severity of anisometropia was defined as the absolute difference of the spherical equivalent between the right and left eyes in diopters (Weakley, 2001).
All children were visually inspected for FAS external ocular features such as the presence of epicantus, telecantus, blepharophimosis and ptosis.
When estimated the position of upper eye-lid we used classification (Iliff, 1992; Atamanov, 2000) for ptosis. The normal position of an upper eye-lid is to cover the upper margin of the iris. Mild ptosis is defined as when the upper eye-lid is at level with the upper margin of the pupil (2 mm below the upper iris margin). Moderate is defined as when the eyelid covert the center of the pupil (3-4 mm lower than the iris margin). Severe ptosis is when the upper lid is covering the pupil totally (>4 mm below iris magin).
Biomicroscopy was performed to observe internal ocular features using slit-lamp (LOMO, Russia) in a dark room. Anterior segment, lens and vitreous body were evaluated.
The ocular alignment was evaluated using the monolateral and alternating cover test for detection of heterotropia and heterophoria. The tests were performed at distance (3m). Heterotropia was defined as any sign of re-fixation movement of one eye when the other eye was covered while fixating the target. All children were examined with best optical correction. When no heterotropia was detected, an alternating cover test was made in order to detect heterophoria.
Ocular fundus investigation was performed using indirect ophthalmoscopy in dark room by ghost ophthalmoscopy and 20 D lens (Somov, 2005).
A coherent motion perception test, a modified version of the Random dot kinematogram (RDK; Braddick et al. 2001), was used to measure motion perception abilities. The stimulus was displayed on a computer screen at a distance of 50 cm from the participants, subtending a visual angle of 5°. On a black background (0.2 cd/m2), 150 high luminance dots (luminance, 51.0 cd/m2) move coherently in one of the eight directions (four cardinal and four oblique) at a constant velocity of 6.1°/sec. To elicit a selective magnocellular pathway response, each dot was presented at low luminance level (mean luminance, 5 cd/m2), and to avoid the possibility of tracking, each dot had a limited lifetime of four frames (duration = 200 msec). The task consisted of seven levels of signal-to-noise ratio, each repeated six times in different directions. Coherent motion was defined as the total number of dots moving coherently in a specific direction. The non-coherent dots moved randomly between frames in a Brownian movement. The signal-to-noise ratio decreased exponentially: starting from a condition of 100% coherence (all the 150 dots moving coherently in one direction), at each step the coherence percentage decreased by 63% compared to the previous step. At the final and most difficult level, the stimulus comprised only nine coherently moving dots. Therefore, participants performed at an increasing level of difficulty, while the global

9
coherence of the moving stimuli decreased. Participants were asked to stop the stimulus by pressing the spacebar when the motion was perceived and then to indicate the direction of the detected motion by pressing an appropriate key. If the spacebar was not pressed in 5 sec, the stimulus stopped anyway and participants were told to indicate the detected direction or press the no-detection key. The actual direction of the stimulus, the direction indicated by the subject and the detection time were recorded for each participant. Detection time was regarded as a measure of the time needed to detect the motion.
The motion perception score was evaluated as the rate of the correct answers in the total number of trials.
1.2.3 Statistical analysis
The statistical analysis was undertaken using the SPSS package, ver.15.0 (SPSS Inc., Chicago, IL, USA). For statistical analysis the unpaired t-test (paired t-test and non-parametric Mann-Whitney test) was used to compare results. Differences were considered to be statistically significant when the P value was less than 0.05. In motion perception testing the FAS and the control groups were compared by means of the analysis of variance for repeated measures using the difficulty levels and directions as within subject effects, while the motion score and time of perception were the dependent variables.
1.3 Results
1.3.1 Visual acuity and refractive errors
A significantly larger number of eyes in FAS-children (56/100) had a subnormal (VA<1.0) uncorrected VA compared to eyes in control children (35/100; p = 0.004). However, this difference was no longer significant, when best correction was used (12/100 in FAS group and 6/100 in control group). Best corrected VA of less than 1.0 in both eyes occurred in three FAS children and in two controls. Table 2 shows the distance monocular uncorrected VA in best and worst eyes, respectively in both groups. There was a significant difference (p=0.02) between the worst eyes between the groups, but not regarding the best eyes (p=0.09; see also Table 2 for details). Subnormal best corrected VA (amblyopia) in FAS-children was due to heterotropia in eight eyes, and in four eyes the etiology was uncorrected myopic astigmatism (two eyes) and moderate myopia (two eyes) and to posterior capsular cataract in one eye. In the control group two eyes were found to have high myopia (SE=-8D in both eyes) and a retinal dystrophy and another child with amblyopia in one eye had a best corrected visual acuity of <0.7 without any obvious etiology.
Best eyes Worst eyes
FAS 0.9 (0.1-1.0) 0.8 (0.05-1.0)
Control 1.0 (0.2-1.0) 1.0 (0.1-1.0)
P *= 0.09 0.02
* Student t-test was used to evaluate p-value
Table 2 – Uncorrected decimal visual acuity for the best and for the worst eye in the groups studied (median and range).
10
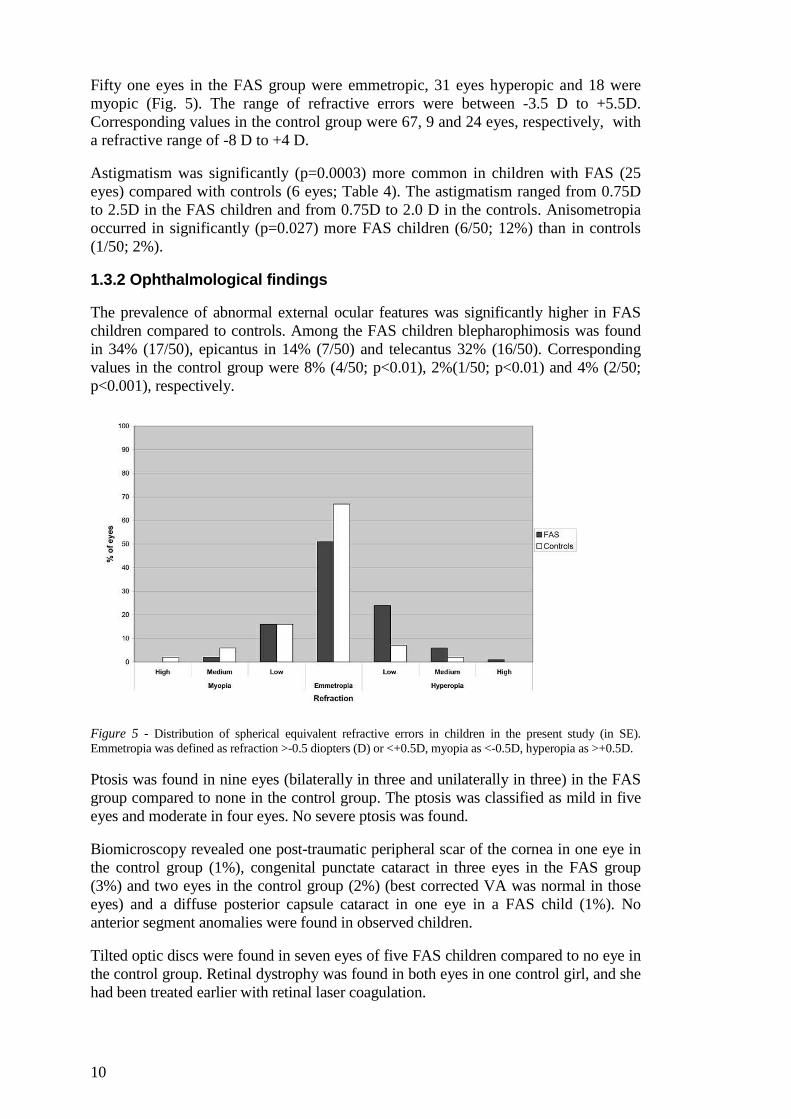
Fifty one eyes in the FAS group were emmetropic, 31 eyes hyperopic and 18 were myopic (Fig. 5). The range of refractive errors were between -3.5 D to +5.5D. Corresponding values in the control group were 67, 9 and 24 eyes, respectively, with a refractive range of -8 D to +4 D.
Astigmatism was significantly (p=0.0003) more common in children with FAS (25 eyes) compared with controls (6 eyes; Table 4). The astigmatism ranged from 0.75D to 2.5D in the FAS children and from 0.75D to 2.0 D in the controls. Anisometropia occurred in significantly (p=0.027) more FAS children (6/50; 12%) than in controls (1/50; 2%).
1.3.2 Ophthalmological findings
The prevalence of abnormal external ocular features was significantly higher in FAS children compared to controls. Among the FAS children blepharophimosis was found in 34% (17/50), epicantus in 14% (7/50) and telecantus 32% (16/50). Corresponding values in the control group were 8% (4/50; p<0.01), 2%(1/50; p<0.01) and 4% (2/50; p<0.001), respectively.
Figure 5 - Distribution of spherical equivalent refractive errors in children in the present study (in SE). Emmetropia was defined as refraction >-0.5 diopters (D) or <+0.5D, myopia as <-0.5D, hyperopia as >+0.5D.
Ptosis was found in nine eyes (bilaterally in three and unilaterally in three) in the FAS group compared to none in the control group. The ptosis was classified as mild in five eyes and moderate in four eyes. No severe ptosis was found.
Biomicroscopy revealed one post-traumatic peripheral scar of the cornea in one eye in the control group (1%), congenital punctate cataract in three eyes in the FAS group (3%) and two eyes in the control group (2%) (best corrected VA was normal in those eyes) and a diffuse posterior capsule cataract in one eye in a FAS child (1%). No anterior segment anomalies were found in observed children.
Tilted optic discs were found in seven eyes of five FAS children compared to no eye in the control group. Retinal dystrophy was found in both eyes in one control girl, and she had been treated earlier with retinal laser coagulation.

11
1.3.3 Ocular alignment
Ocular misalignment was found in 13 children in the FAS group and in five controls. Among these, heterophoria was found in five children in both groups, and heterotropia in eight children in the FAS group compared with none in the controls. The heterotropia was concomitant in seven children and paralytic in one child; divergent in six children and convergent in two. One FAS girl had undergone strabismus surgery earlier. Alternating strabismus was found in five FAS-children, and in three FAS-children the heterotropia was monolateral. One girl in the FAS group had undergone strabismus surgery before the start of the study.
1.3.4 Motion perception
A significant difference of the motion perception score between the two groups was found (F(1, 87) = 5.77, p=0.018) with lower score for the FAS group (Figure 6). In the table 3 the significance and effect size values are reported.
A significant difference between difficulty levels (F(6,82) = 242.71 , p<0.001) was found for all the subjects, increasing the noise level the motion detection score decreases (see Fig. 7).
The decrease of the motion perception score (Fig. 7) was significantly different in the two groups (F(6,82)=3.35, p=0.005).
Figure 6 - Mean values and error bars (mean ± SEM) of the Motion perception score for all motion directions, as percentage of correct answers, in FAS and Control groups.

12
Effect sig. effect size r Cohen's d
group 0.018 0.25 0.51
coherence (overall effect) 0 0.97 8.43
coherence profile by group 0.005 0.44 0.99
horizontal vs vertical 0.003 0.31 0.66
horizontal vs vertical by group
0.731 0.04 0.07
cardinal vs oblique 0.209 0.13 0.27
cardinal vs oblique by group 0.055 0.2 0.42
directions by group 0.08 0.46 1.05
Table 3 - Significance value and effect size for all analyzed effects in the motion perception test.
Figure 7 - The decrease of the motion perception score with the increase of noise level in the Control and FAS groups.
13
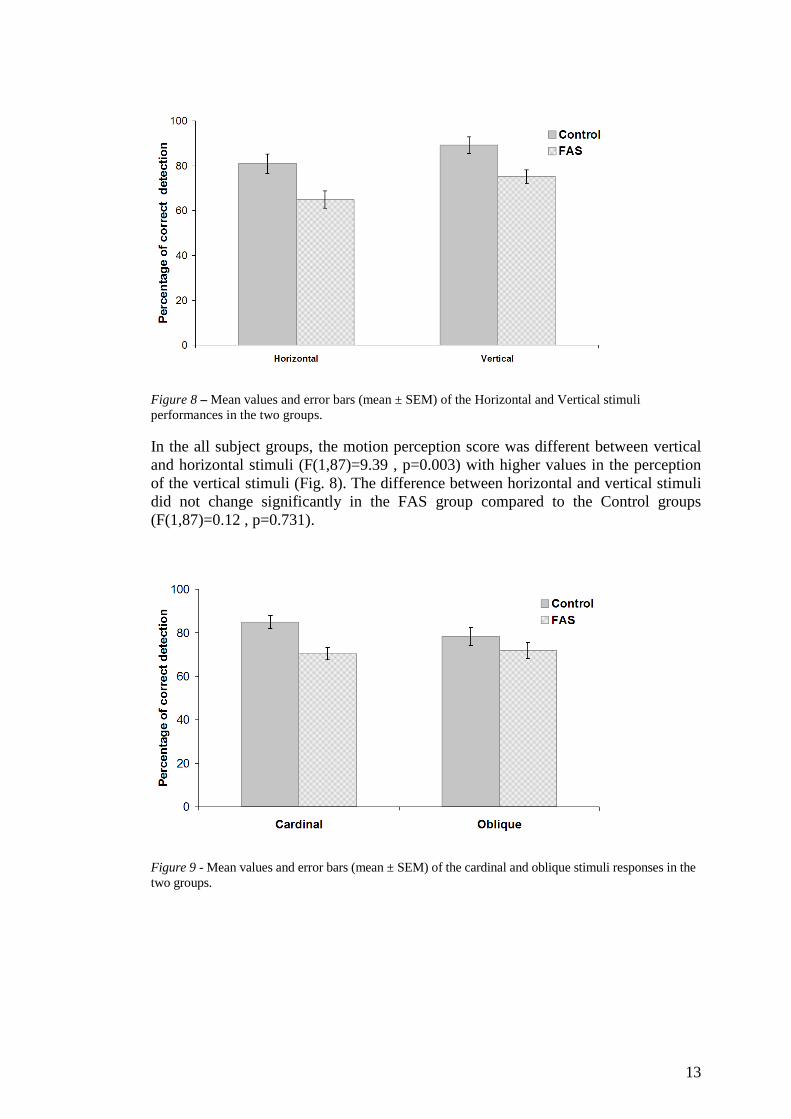
Figure 8 – Mean values and error bars (mean ± SEM) of the Horizontal and Vertical stimuli performances in the two groups.
In the all subject groups, the motion perception score was different between vertical and horizontal stimuli (F(1,87)=9.39 , p=0.003) with higher values in the perception of the vertical stimuli (Fig. 8). The difference between horizontal and vertical stimuli did not change significantly in the FAS group compared to the Control groups (F(1,87)=0.12 , p=0.731).
Figure 9 - Mean values and error bars (mean ± SEM) of the cardinal and oblique stimuli responses in the two groups.

14
Figure 10 - Motion score in percentage for the 8 tested directions for the Control and FAS groups. Up-Down corresponds to vertical movement direction. Left-Right corresponds to horizontal movement direction. Up, Right, Down and Left corresponds to cardinal movement directions. UpLeft, UpRight, DownRight, DownLeft correspond to oblique movement directions.
The comparison between cardinal, i.e. horizontal and vertical together, and oblique stimuli showed no significant difference in the overall group (F(1,87)=1.60, p=0.209). However a difference between the two groups was found in the cardinal respect to the oblique stimulation (Figure 9) even if the comparison of the two differences did not reach a significant value (F(1,87)=3.78, p=0.055). The analysis of all eight directions stimuli (Figure 10) showed different patterns between the FAS and the control groups but the difference was not statistically significant (F(7,50)=1.95, p=0.080). This parameter has had nice effect size (table 3), but the between-subjects variability was high, what resulted in poor significance level.
Detection time did not show any significant difference between Control and FAS groups. As compared to controls, children with FAS did not demonstrate increased detection times in the total test (F(1, 87)=0.123, p=0.727).
1.4 Discussion
Alcohol consumption by pregnant women has been known for a long time to be detrimental to the neurodevelopment of the fetus as well as it could give rise to characteristic somatic features and ophthalmological problems known as fetal alcohol syndrome, FAS. However, this information is not widespread within Russia resulting in a common usage of alcohol by pregnant women and presumably a high incidence of FAS. The aim of the present study has been to describe the syndrome in Russia and to give examples of visual problems that can occur with FAS as well as put awareness of FAS to health personel and hopefylly also to Russian women. We here describe the ophthalmological characteristics in a group of FAS children compared with a group of non-FAS children from orphanages in St-Petersburg and found differences both in visual functions as well as eye characteristics.

15
1.4.1 Methodological considerations
The health cards of the FAS children in the present study revealed information of maternal alcohol use during pregnancy in all cases whereas in the control group maternal alcohol consumption during pregnancy was denied. However, there might have been some alcohol consumption also by the mothers of the control children, since there is a tendency to repress or even deny intake of alcohol (Stromland 2004; Kristjanson et al. 2007). Even though FAS can be diagnosed without confirmation of heavy maternal drinking (Stratton et al. 1996), because of specific external facial and ocular features, a detailed maternal history is desirable to confirm the nature of the maternal drinking, particularly in cases in which dysmorphology is less consistent (Strömland 2004).
Children with the most extreme dysmorphology and dysfunction in St-Petersburg orphanages are usually living in special orphanages from which no children were included in the present study. Hence, the most seriously affected FAS children in St-Petersburg were not included in the present study. This probably explains why the children in the present study seemed healthier than reported in previous FAS studies (Miller et al. 1981; Strömland 1985). In addition, the reason for the discrepancy between different studies (Strömland 1985; Ribeiro et al. 2007) could also be geographical and genetic differences of the studied children.
During the selection of the children we excluded seven children with a history of maternal combined drug and alcohol abusing stated in the medical records. This was done to exclude the influence of other toxic substances on the child development. However, we cannot be sure that all investigated children were not affected by other drugs than alcohol during intrauterine development, as it is known that such abuse is often underestimated and not reported by patients.
Since Russian children are more familiar to the Cyrillic alphabet character than Western optotypes, the Sivtsev chart was used for VA measurement in the present study.
1.4.2 Visual functions
A lower VA was found (both uncorrected and best corrected) in FAS children compared with controls, confirming what has also been shown earlier in FAS children (Strömland 1987, Hinzpeter 1992, Riley 2007). However, in the present study the VA was higher than in the study by Strömland (1985), who reported 12% of FAS-children with VA less than 0.2. In the present study the corresponding number was 9% for uncorrected VA and only 2% for best-corrected VA. This can probably be the result of group selection (the most affected FAS children were excluded from the present study and due to the lower age of the children in the Strömland study.
Refractive errors have been reported as a consistent finding in FAS-children (Miller 1984, Strömland 1985, Chan 1991, Hinzpeter 1992, Strömland & Hellström 1996, Grönlund et al. 2004). In the present study refractive errors were more frequent in FAS children compared to controls (51% and 33% respectively). Hyperopia was the most frequent refractive error in the present study, found in 30% of the FAS children compared to 9 % in controls. This is in contrast with the findings of several other studies (Miller 1981, Strömland 1985, Chan 1999), which reported a high incidence of myopia in FAS children. However, an even higher incidence of hyperopia than in the present study was recently reported by Grönlund and coworkers (2004) in

16
children with attention deficits and hyperactivity syndrome. In that study the proportion of children with suspected alcohol exposure was 33%. In the present study a higher prevalence of astigmatism in FAS children (27% compared with 6% in controls) was found, which is also of importance for the development of amblyopia. This finding agrees with several other studies (Miller, 1981; Strömland 1985; Chan 1999; Riley 2007). The lower VA (uncorrected and best corrected) in FAS children, could thus be the result of a higher prevalence of refractive errors, especially since there only a few children in the FAS group wore their prescribed spectacles. The prevalence of anisometropia in the present study was comparable to several previous studies (Strömland 1985; Grönlund et al. 2004).
1.4.3 Ocular anomalies in FAS children
The prevalence of external ocular anomalies was higher in children with FAS than in control children in the present study. These findings were in accordance with other authors (Jones and Smith 1973; Altman 1976; Miller 1981; Strömland 1985; Moore 2007). In the present study a higher prevalence of ptosis, epicantus, telecantus and blepharophimosis was found in the FAS children (9%, 14%, 32%, 34%, respectively) than in control children (0%, 2%, 8%, 2%, respectively). The prevalence of such abnormalities in the present study was somewhat smaller than in previous ones (Miller 1981; Strömland 1985). This can be explained by higher ages of the subjects in our studiy, as it is recognized that the facial features observed in FAS children usually become more apparent in adolescence (Stratton 1996).
No statistical difference between the groups was found regarding the findings during biomicroscopy. In the present study the prevalence of cataract in both groups was almost the same and no anterior segment anomalies were found. This contrasts with some other studies that have reported the presence of anterior chamber anomalies in FAS-children (Miller et al 1981; Strömland 1985). However, there are other reports that concur with the present study (Hug 2000, Riley 2007).
No ocular fundus abnormalities were found, in contrast to frequent findings of smaller optic discs and increased tortuosity of retinal vessels reported in previous studies (Strömland 1985; Chan et al. 1991; Hinzpeter et al. 1992). In the present study no sign of the specific “FAS ocular fundus” described in the Strömland study (1985) was observed in any of the children, although titled optic discs were seen in 5 FAS children compared with none of the controls. Correspondingly, Riley (2007) reported a low incidence of ocular fundus anomalies in FAS children, although not as low as in the present study. This presumably reflects the selection of children in the current study, as described above.
1.4.4 Strabismus
As in previous studies (Jones & Smith 1973; Altman 1976; Strömland 1985; Chan et al. 1991) the prevalence of ocular misalignment was higher in FAS children compared to controls. The deviation was divergent in 8 and convergent in 5 children (16% and 10% respectively). This finding is in contradiction with the data by Strömland (1985), who found strabismus, most often esotropia, in 43% of FAS children while exotropia was found in just one case. The reason for this difference could be explained by selection bias, as stated above.

17
1.4.5 Cognition
As there were some studies about neurological problems and cognitive deficits in children with FAS/FASD (Green et al. 2009; Janzen et al.1995; Landgren et al. 2010; Rasmussen et al. 2009; Spadoni et al, 2009; Streissguth et al. 1989; Willford 2004) one of the aims of the present study was to explore an hitherto unstudied cognitive function – motion perception – in a sample of children with FAS to assess their magnocellular system functioning (Benassi 2010). Impairment of motion perception was found in most of the FAS children compared with controls. These data added to other reported information about multineurological deficits in children with FAS (Green et al. 2009; Grey et al. 2009; Kaemingk &, Halverson 2000; Landgren et al. 2010; Mattson & Roebuck 2002; Spadoni et al, 2009) widen understanding of mechanisms involved in the pathological processes in FAS-patients. It is known that the magnocellular pathway is responsible for the transfer of motion and low contrast information, so these functions could be impaired in FAS patients.
In the present study impairment in motion perception were confirmed in patients with FAS. This impairment was evident at all task levels of difficulty, not only at the intermediate task levels as in some other diseases such as reported for dyslexia (Menghini 2010), indicating that FAS-children had a more general loss of sensitivity for motion perception. It was shown in the present study that the motion perception score had a directional preponderance in that both groups exhibited a better perception of the vertically moving stimuli (F(1,87)=9.39 , p= .003) but no significant difference was found between FAS and control groups (F(1,87)=.12 , p=.731).The reason for these perceptual asymmetries is not clear.
In contradiction with some other cognitive functions testing (Cambridge Neuropsychological Tests Automated Battery (CANTAB), the Beery test of Visuomotor Integration) that were performed in previous studies (Green et al., 2009; Janzen et al, 1995) it was found that the time needed to perform motion perception test – detection of the movement direction - did not show any significant difference between control and FAS groups (F(1,87)=.123, p=0.727), whereas the percentage of correct answers was significantly lower in FAS-children compared to controls.
The percentage of correct answers in motion detection was higher in cardinal directions compared with oblique in controls although not significant (F(1,87)=3.78 , p=.055) , but at the same time the percentage of correct detection in the cardinal and oblique directions in FAS patients was almost equal.
It is important to take into consideration that Boden and Giaschi (2007) proposed a model for interpreting the connection between the magnocellular system and reading at different levels of analysis. At the behavioral level, the authors hypothesized that low spatial frequency information carried by the magnocellular system could be an important determinant in learning to read and that position encoding, incorporating parafoveal, and foveal interactions might constrain reading. And this hypothesis has been confirmed experimentally. In the California Verbal Learning Test-Children’s version it was found that children (aged 5–16) with FAS recalled fewer words than controls (Mattson et al. 1996).
The lower motion perception in children with FAS can be a result of loss of binocularity due to the higher incidence of heterotropia and heterophoria in those

18
children compared with controls. It is known that a loss of binocularity can influence motion detection (Mitchell, 2009). Magnocellular pathways play the important role in motion perception as it was shown that binocular correlation-processing cortical neurons receive input predominantly from the magnocellular visual pathway (Marko et al., 2012).
19
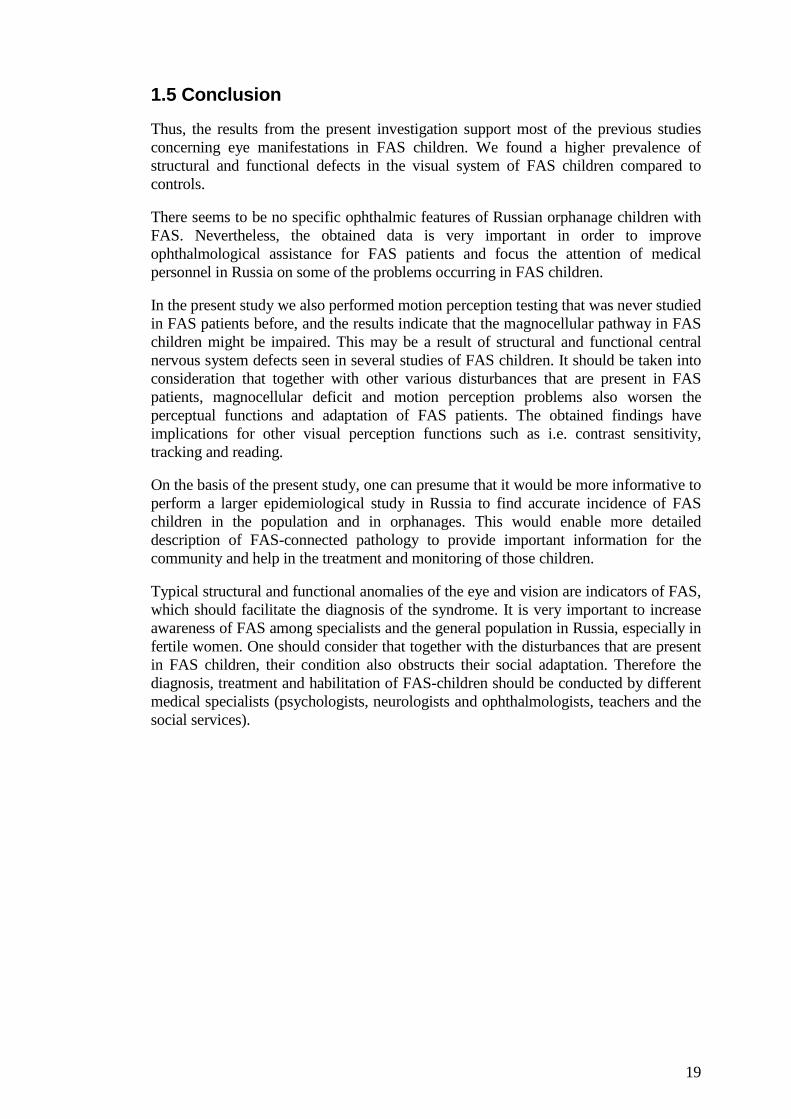
1.5 Conclusion
Thus, the results from the present investigation support most of the previous studies concerning eye manifestations in FAS children. We found a higher prevalence of structural and functional defects in the visual system of FAS children compared to controls.
There seems to be no specific ophthalmic features of Russian orphanage children with FAS. Nevertheless, the obtained data is very important in order to improve ophthalmological assistance for FAS patients and focus the attention of medical personnel in Russia on some of the problems occurring in FAS children.
In the present study we also performed motion perception testing that was never studied in FAS patients before, and the results indicate that the magnocellular pathway in FAS children might be impaired. This may be a result of structural and functional central nervous system defects seen in several studies of FAS children. It should be taken into consideration that together with other various disturbances that are present in FAS patients, magnocellular deficit and motion perception problems also worsen the perceptual functions and adaptation of FAS patients. The obtained findings have implications for other visual perception functions such as i.e. contrast sensitivity, tracking and reading.
On the basis of the present study, one can presume that it would be more informative to perform a larger epidemiological study in Russia to find accurate incidence of FAS children in the population and in orphanages. This would enable more detailed description of FAS-connected pathology to provide important information for the community and help in the treatment and monitoring of those children.
Typical structural and functional anomalies of the eye and vision are indicators of FAS, which should facilitate the diagnosis of the syndrome. It is very important to increase awareness of FAS among specialists and the general population in Russia, especially in fertile women. One should consider that together with the disturbances that are present in FAS children, their condition also obstructs their social adaptation. Therefore the diagnosis, treatment and habilitation of FAS-children should be conducted by different medical specialists (psychologists, neurologists and ophthalmologists, teachers and the social services).

20
1.6 Summary in Russian
For Russian medical staff and community a summary of the present study in Russian is available below.
ФУНКЦИОНАЛЬНОЕ СОСТОЯНИЕ ЗРИТЕЛЬНОГО АНАЛИЗАТОРА У ДЕТЕЙ С ФЕТАЛЬНЫМ АЛКОГОЛЬНЫМ
СИНДРОМОМ
Актуальность проблемы
Потребление алкоголя матерью во время беременности и его воздействие на развивающийся плод являются серьезной проблемой здравоохранения во всем мире.
В 1973 г впервые было дано описание развивающегося у детей от матерей, злоупотреблявших алкоголем во время беременности, фетального алкогольного синдрома (ФАС), основными проявлениями которого являются: задержка психомоторного и физического развития, патологические изменения со стороны центральной нервной системы, различные пороки развития, самыми характерными из которых являются черепно-лицевые аномалии. [Jones K.L., Smith D.W., 1973; Clarren S.K. et al., 1978].
Пациенты с ФАС имеют характерные черты лица: широкую плоскую переносицу, эпикантус, укороченную длину глазной щели, гипопластичную среднюю зону лица, длинную тонкую верхнюю губу, лишенную выраженного фильтрума и др. [Jones K.L., Smith D.W., 1973].
Из относительно немногочисленных публикаций известно, что аномалии глазного яблока и его вспомогательных органов также связаны с фетальным алкогольным синдромом. Их обнаруживают почти у 90% детей с ФАС [Altman B., 1976; Miller M.T. et al., 1981; Strömland K., 1985; Hinzpeter E. et al., 1992; Strömland K., Pinazo-Durán M.D., 2002]. У таких детей обычно встречается широкий спектр нарушений со стороны органа зрения - от серьезных (микрофтальм, колобома радужки и сосудистой оболочки, выраженные аномалии сетчатки), до менее значительных (аметропии, ангиопатия сетчатки и др.) [Miller M. et al., 1984; Strömland K., 1985; Chan T. et al., 1991; Hinzpeter E. et al., 1992; Strömland K., Pinazo-Durán M.D., 2002].
Микрофтальм считается наиболее специфическим изменением глазного яблока у детей с ФАС, что явилось основанием для включения его в критерии диагностики этого синдрома, установленные Группой изучения фетального воздействия алкоголя Американского общества исследования алкоголизма (USRSA). Врожденные анатомические изменения глазного дна также часто выявляют у детей с ФАС. Приблизительно в 50% случаев регистрируют гипоплазию диска зрительного нерва, повышенную извитость сосудов сетчатки и уменьшение их ветвей, по сравнению с

21
контрольной группой детей [Miller M. et al., 1984; Strömland K., 1985; Chan T. et al., 1991]. Выявлены и изменения клинической рефракции у детей с ФАС, которая колеблется в пределах от гиперметропии средней степени до миопии высокой степени [Strömland K., 1985; Strömland K., Hellström A., 1996].
Вместе с тем, несмотря на длительное изучение фетального алкогольного синдрома, до настоящего времени отсутствуют сведения о комплексной оценке зрительного анализатора у таких детей, детально не изучено состояние центрального и периферического зрения, не исследована моторика глазного яблока, в частности, особенности саккадических и плавных прослеживающих движений глаз у детей с ФАС. Нет данных и об особенностях восприятия движения такими детьми. В то же время, они могли бы существенно дополнить сведения о функционировании зрительного анализатора у детей с ФАС, что является необходимым для оценки зрительных возможностей таких больных и, при необходимости, их коррекции.
К тому же фетальный алкогольный синдром сравнительно редко диагностируют в нашей стране, в связи с малой информированностью практикующих врачей об этой форме патологии.
Цель исследования: произвести комплексную оценку анатомических и функциональных изменений органа зрения у детей с фетальным алкогольным синдромом.
Для достижения намеченной цели предстояло решить следующие задачи:
1. Исследовать анатомическое состояние органа зрения детей с ФАС.
2. Исследовать основные функции центрального и периферического зрения детей с ФАС.
3. Изучить состояние клинической рефракции детей с ФАС.
4. Изучить восприятие движения здоровыми детьми и детьми с ФАС с помощью компьютерной программы «Motion perception program» и оценить ее диагностические возможности.
5. Дать комплексную оценку состояния зрительного анализатора у детей с ФАС, по сравнению со здоровыми детьми соответствующего возраста.
6. Определить перечень глазных симптомов, характерных для фетального алкогольного синдрома.
22
СОДЕРЖАНИЕ РАБОТЫ И РЕЗУЛЬТАТЫ ИССЛЕДОВАНИЯ
Материал и методы исследования
Материалом исследования явилось комплексное обследование 100 детей (62 мальчиков и 38 девочек) в возрасте от 10 до 16 лет (в среднем 13,9 лет), которые были разделены на основную и контрольную группы.
Основную группу составили 50 детей с верифицированным (при помощи данных анамнеза и скрининговой формы, разработанной L.Burd (1999) для выявления пациентов с фетальным алкогольным синдромом) диагнозом фетального алкогольного синдрома из трех детских домов Санкт-Петербурга.
Контрольную группу составили 50 детей из детских домов Санкт-Петербурга, не имевших ФАС. У всех детей контрольной группы в анамнезе отсутствовали данные о злоупотреблении алкоголя матерью во время беременности и был отрицательный результат скрининга для выявления фетального алкогольного синдрома.
При обследовании детей были использованы как традиционные методы офтальмологического обследования, так и дополнительные специальные методы.
Рутинные методы офтальмологического обследования включали целенаправленный сбор анамнеза, определение дистантной остроты зрения, внешний осмотр и фоторегистрацию состояния век и глазного яблока, рефрактометрию при помощи скиаскопии, биомикроскопию глазного яблока с помощью щелевой лампы, прямую и обратную офтальмоскопию.
Результаты традиционного офтальмологического обследования были дополнены компьютерным тестом на оценку восприятия движения (Motion Perception Program).
Анатомо-функциональное состояние зрительного анализатора детей с фетальным алкогольным синдромом
1.1. Анатомические изменения век и глазного яблока
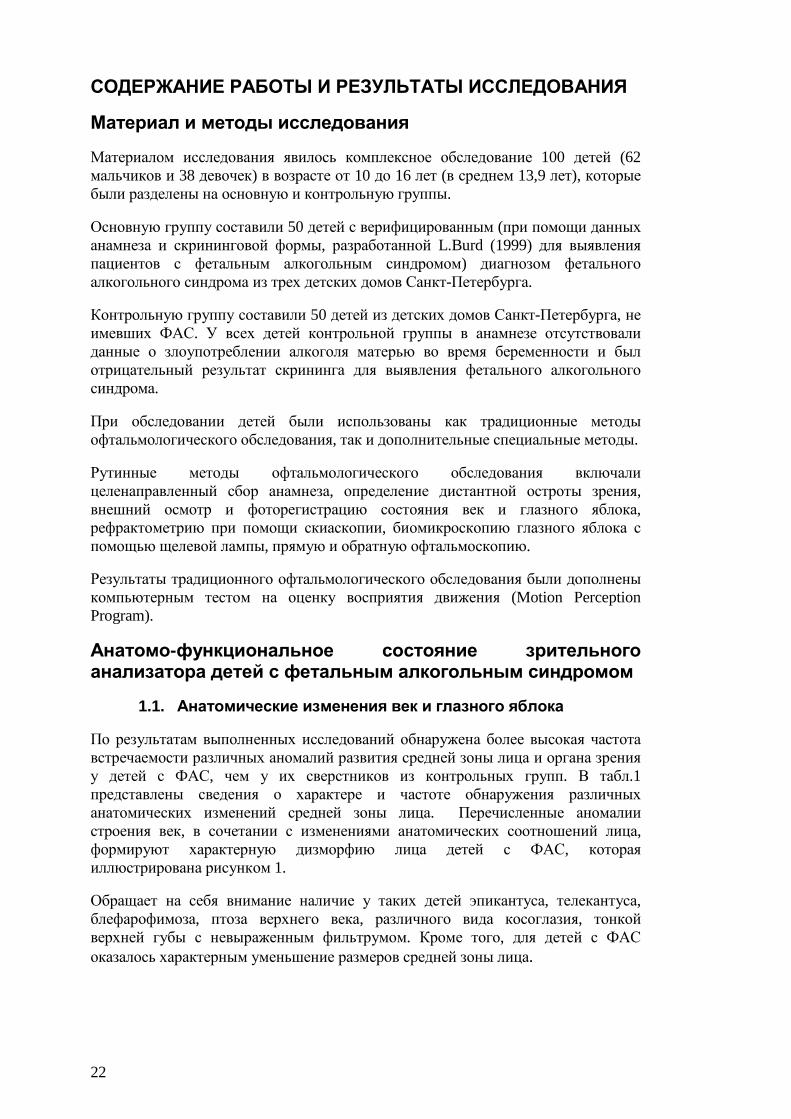
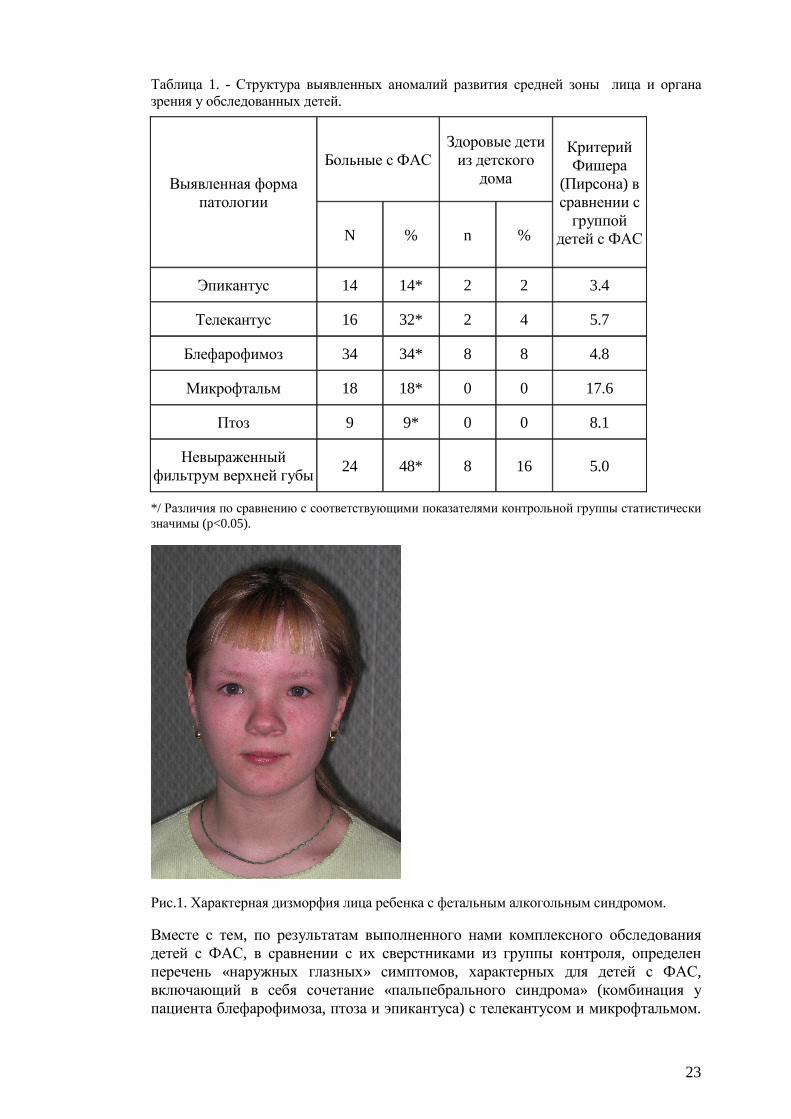
По результатам выполненных исследований обнаружена более высокая частота встречаемости различных аномалий развития средней зоны лица и органа зрения у детей с ФАС, чем у их сверстников из контрольных групп. В табл.1 представлены сведения о характере и частоте обнаружения различных анатомических изменений средней зоны лица. Перечисленные аномалии строения век, в сочетании с изменениями анатомических соотношений лица, формируют характерную дизморфию лица детей с ФАС, которая иллюстрирована рисунком 1.
Обращает на себя внимание наличие у таких детей эпикантуса, телекантуса, блефарофимоза, птоза верхнего века, различного вида косоглазия, тонкой верхней губы с невыраженным фильтрумом. Кроме того, для детей с ФАС оказалось характерным уменьшение размеров средней зоны лица.
23
Таблица 1. - Структура выявленных аномалий развития средней зоны лица и органа зрения у обследованных детей.
Выявленная форма патологии
Больные с ФАС Здоровые дети из детского дома
Критерий Фишера
(Пирсона) в сравнении с группой
детей с ФАС N % n %
Эпикантус 14 14* 2 2 3.4
Телекантус 16 32* 2 4 5.7
Блефарофимоз 34 34* 8 8 4.8
Микрофтальм 18 18* 0 0 17.6
Птоз 9 9* 0 0 8.1
Невыраженный фильтрум верхней губы
24 48* 8 16 5.0
*/ Различия по сравнению с соответствующими показателями контрольной группы статистически значимы (p<0.05).
Рис.1. Характерная дизморфия лица ребенка с фетальным алкогольным синдромом.
Вместе с тем, по результатам выполненного нами комплексного обследования детей с ФАС, в сравнении с их сверстниками из группы контроля, определен перечень «наружных глазных» симптомов, характерных для детей с ФАС, включающий в себя сочетание «пальпебрального синдрома» (комбинация у пациента блефарофимоза, птоза и эпикантуса) с телекантусом и микрофтальмом.

24
Он отмечен нами у 10% больных с ФАС и ни разу не встречался у здоровых детей воспитывающихся в условиях детского дома. Обнаружение такого симптомокомплекса у подростка с подозрением на ФАС позволяет повысить эффективность диагностики фетального алкогольного синдрома.
Из литературных источников известно, что фенотипические проявления ФАС становятся менее заметными, по мере взросления ребенка. Лицо пациентов старшего школьного возраста уже не имеет столь характерного вида, как у детей с ФАС младшего возраста [Streissguth A.P., 1993]. Поэтому фенотипические «находки» у детей еще более младшего возраста, чем среди обследованных нами пациентов 10-16 лет, могли бы быть намного более показательными.
1.2. Глазодвигательные нарушения.
Скрытое и явное косоглазие обнаружены у 13 детей с ФАС (26%), а также у 5 их сверстников (10%) из контрольной группы (Таблица 2).
В структуре гетерофории в основной группе у 3 детей (60%) была выявлена эзофория и у двух (40%) - экзофория. В первой контрольной группе также чаще была отмечена эзофория, притом на фоне миопической рефракции (4 ребенка, 80%), а у одного обследованного (20%) - экзофория. Во второй контрольной группе в структуре гетерофории эзофория выявлена у двух (66,7%), а экзофория – у одного (33,3%) ребенка. В целом, во всех обследованных группах чаще была отмечена эзофория, хотя сравниваемые группы обследованных статистически достоверно не различались по частоте обнаружения скрытого косоглазия и его видам.
Таблица 2. - Частота возникновения косоглазия и амблиопии у обследованных детей.
*/ различия между группой детей с ФАС и обеими контрольными группами статистически значимы.
Явное косоглазие диагностировано у 8 детей с фетальным алкогольным синдромом (16%) и лишь у одного ребенка (2%) – из второй контрольной группы. При этом в группе детей с ФАС явное косоглазие было содружественным в 7 случаях (87,5%), а в одном (12,5%) – паралитическим, сочетаясь при этом с птозом верхнего века. У 5 детей (71%) содружественное косоглазие было альтернирующим, а у 2 (29%) – монолатеральным. Аккомодационным оно оказалось у 5 пациентов (62,5% от всех случаев
Выявленная форма патологии
Больные с ФАС Здоровые дети из детского дома
Критерий Фишера
(Пирсона) в
сравнении с группой детей с ФАС
N % n %
Амблиопия 6 6* 1 1 2.1
Косоглазие Явное 8 16* 0 0 15.3
Скрытое 5 10 5 10 0.0

25
косоглазия), а у одной пациентки с ФАС (12,5%) причиной косоглазия послужила обскурационная амблиопия на почве монолатерального птоза верхнего века.
При этом в рассматриваемой группе детей с ФАС в шести случаях из восьми (75%) явное косоглазие было расходящимся и лишь в двух (25%) – сходящимся. Следует отметить, что расходящееся косоглазие у 4 пациентов (8% от числа детей в группе) наблюдалось на фоне гиперметропии (33.3% от числа всех случаев расходящегося косоглазия). Содружественное расходящееся аккомодационное косоглазие также было обнаружено у одного ребенка из второй контрольной группы с миопией средней степени.
Амблиопия тяжелой степени была диагностирована у одной пациентки с фетальным алкогольным синдромом и явным косоглазием (12,5%). Еще у 4 детей с косоглазием (50%) была выявлена амблиопия средней степени тяжести.
Как было указано выше (см. табл. 2), амблиопия была диагностирована у 5 детей (6 глаз; 6%) с фетальным алкогольным синдромом. У 4 детей (66,7%) она была дисбинокулярной, а у одного ребенка (на обоих глазах; 33,3%) – рефракционной (согласно классификации Э.С.Аветисова, 1968) и была связана с несвоевременно корригированным миопическим астигматизмом. В первой контрольной группе амблиопия (рефракционного генеза) была выявлена только у одной пациентки с некорригированным гиперметропическим астигматизмом.
В целом, частота обнаружения амблиопии оказалась достоверно выше в группе детей с фетальным алкогольным синдромом, по сравнению с обеими контрольными группами.
1.3. Острота зрения детей с фетальным алкогольным синдромом.
По результатам обследования детей из трех сравниваемых групп установлено, что дети с ФАС имеют более низкую остроту зрения с коррекцией и без коррекции (рис. 2 и 3). Как видно из рисунка 2, у значительной части детей с фетальным алкогольным синдромом зафиксирована острота зрения менее 0.9: на 50 из 100 (50%) глазах, в сравнении с 30 из 100 (30%) в контрольной группе. Различия сравниваемых показателей в основной и контрольных группах статистически значимы (p<0.01; F=2.9).
Статистический анализ показал, что различие оказалось значимым между средними величинами остроты зрения с максимальной коррекцией у детей с фетальным алкогольным синдромом и их сверстников, воспитываемых в детских домах (первая контрольная группа; р=0.04).
Снижение остроты зрения с максимальной коррекцией до 0.9 и ниже зафиксировано у 7 детей с ФАС (9 глаз; 9%), а также у 1 ребенка (2; 2%) из первой и 2 (2; 2%) – из второй контрольной группы. При этом на оба глаза острота зрения оказалась сниженной у двух детей (4%) из основной и одного ребенка (2%) – из первой контрольной группы. Снижение остроты зрения с максимальной коррекцией у детей с фетальным алкогольным синдромом было обусловлено амблиопией (5 больных, 6 глаз; 6%) и врожденной заднекапсулярной катарактой (1; 1; 1%). В контрольной группе снижение остроты зрения также было вызвано амблиопией (1 ребенок, 2 глаза; 2%).

26
Рис.2. Частота встречаемости различных величин остроты зрения без оптической коррекции у обследованных детей
Рис.3. Частота встречаемости различных величин остроты зрения с максимальной оптической коррекцией у обследованных детей.
1.4. Клиническая рефракция детей с фетальным алкогольным синдромом
По результатам рефрактометрии выявлена тенденция к преобладанию гиперметропической рефракции в группе детей с ФАС (Рис.4).
В частности, как видно из данных, представленных в табл.3, у детей с ФАС выявлена более высокая частота аномалий рефракции (61%, по сравнению с 47% и 46% в первой и второй контрольных группах), с превалированием гиперметропии и гиперметропического астигматизма (46%, по сравнению с 28% и 23% в соответствующих контрольных группах).
В целом, частота встречаемости астигматизма (гиперметропического и миопического степенью 0.5дптр. и более) у пациентов с ФАС оказалась почти в 4

27
раза выше (23%), чем у здоровых детей соответствующего пола и возраста (6% - у контрольной группы). При этом различие величин рассматриваемого параметра между основной и контрольными группами оказалось статистически достоверным (p<0.01; F=3.57).
Рис.4. Особенности клинической рефракции (без использования циклоплегических средств) пациентов основной и контрольных групп.
Анизометропия свыше 0.5дптр. зарегистрирована у 30% обследованных основной группы и у 20% детей первой и второй контрольных групп. Однако различия между рассматриваемыми показателями в основной и контрольных группах оказались статистически не значимыми (p > 0.05).
1.5. Восприятие движения у детей с фетальным алкогольным синдромом
На следующем этапе исследований был выполнен тест на восприятие движения Motion perception test. При проведении этого теста оценке подлежали два показателя: доля правильного определения направления движения тестовых точек, в зависимости от уровня сложности теста (7 уровней), а также время ответа (время, потребовавшееся исследуемому ребенку для определения направления движения тестовых точек).
По результатам теста «Motion perception test», процент детей с фетальным алкогольным синдромом, правильно определивших направление движения тестовых точек, оказался значительно ниже, чем в контрольной группе (F(1,87)=5.77, p=0.018).
Следует отметить, что дети с ФАС демонстрируют более низкие результаты на всех уровнях теста (F(6,82)=3.35, p=0.005: Рис.5). Причем различия между соответствующими показателями в сравниваемых группах детей нарастают, по мере усложнения тестовых заданий (F(6,82)= 242.71, p<0.001).
При этом в обеих группах отмечена тенденция к уменьшению процента обследованных, правильно определивших направление движения тестовых

28
точек, по мере увеличения уровня сложности теста (уменьшение количества точек, одновременно двигающихся в одном направлении).
Рис.5. Количество правильных ответов по результатам теста на восприятие движения различного уровня сложности у пациентов основной и контрольной групп.
Также установлено, что в обеих исследуемых группах процент правильного определения направления движения тестовых точек различался, в зависимости от заданного программой направления их движения: доля правильного определения направления движения тестовых точек была выше при их перемещении в вертикальном направлении, по сравнению с горизонтальным (F(1,87)=9.39, p=0.003, Рис. 6).
Наибольшей разница в количестве правильных ответов при сравнении различных групп обследованных оказалась в «кардинальных» (горизонтальное и вертикальное направления), а не в «косых» направлениях движения (F(1,87)=3.78, p=0.055) (см. рис.6). Полученные данные могут означать, что в центральных отделах зрительного анализатора есть определенные тенденции восприятия и возможное «превалирование» в определении направления – асимметрия восприятия.
При оценке времени ответа на тест не было выявлено статистически достоверных различий между исследуемыми группами: время, потребовавшееся обследованным для определения направления движения тестовых точек, было практически одинаковым у детей с ФАС и их сверстников, не страдающих этим синдромом (F(1,87)=0.123, p=0.727). Вместе с тем, важно отметить, что при проведении других когнитивных тестов детям с ФАС [Janzen A.L. et al., 1995; Green C.R. et al., 2009], им требовалось большее количество времени на ответ, чем пациентам контрольной группы.

29
Рис.6. Средний процент правильных ответов по результатам теста на восприятие движения, в зависимости от направления движения тест-объекта, у пациентов основной и контрольной групп.
По данным некоторых авторов [Bolzani R. et al., 2006; Benassi M. et al., 2010], тест на восприятие движения Motion perception test косвенно оценивает когнитивное развитие и функционирование крупноклеточных (магноцеллюлярных) проводящих путей головного мозга. Полученные нами данные свидетельствуют о заметном нарушении восприятия движения (которое является одной из важных когнитивных функций) у детей с ФАС, по сравнению с их сверстниками (1-я контрольная группа) без этого синдрома. Имеющиеся результаты могут быть объяснены возможным поражением у детей на фоне фетального алкогольного синдрома магноцеллюлярных проводящих путей корковой части зрительного анализатора, поскольку именно они отвечают за передачу информации, связанной с движением и контрастной чувствительностью. При этом восприятие движения служит одной из важных функций зрительного анализатора, обеспечивая многие аспекты анализа окружающего мира. Нарушение восприятия ребенком с ФАС движущихся объектов, безусловно, оказывает негативное влияние на темпы его психофизиологического развития и на качество его жизни – в дальнейшем.
ЗАКЛЮЧЕНИЕ
Таким образом, по результатам выполненных исследований установлено, что у детей с ФАС анатомические и функциональные изменения органа зрения наблюдаются чаще, чем у их здоровых сверстников. «Глазные» проявления ФАС специфичны и характеризуются наличием блефарофимоза, телекантуса, микрофтальма, косоглазия, эпикантуса, птоза верхнего века, аномалий рефракции, с преобладанием гиперметропии и гиперметропического астигматизма, снижения показателей центральной статической компьютерной периметрии, без сужения периферических границ и скотом, нарушений саккадических движений глаз, а также восприятия движения и электрогенеза зрительного анализатора.

30
Рассмотренные функционально-анатомические нарушения зрительного анализатора, с одной стороны, служат дополнительным свидетельством наличия у ребенка фетального алкогольного синдрома и упрощают диагностику этого заболевания. Вместе с тем, в сочетании с соматическими и психомоторными нарушениями, они утяжеляют общее состояние и нервно-психическое развитие детей с ФАС. В связи с этим, дети с подозрением на фетальный алкогольный синдром должны быть тщательно исследованы офтальмологом.
В целом же, диагностика, лечение и полноценная абилитация детей с фетальным алкогольным синдромом неосуществимы без функционального взаимодействия медицинских специалистов (психоневрологи, офтальмологи и др.), педагогов, а также органов социальной опеки.
ВЫВОДЫ
1. У детей с фетальным алкогольным синдромом блефарофимоз, эпикантус, телекантус, микрофтальм, птоз верхнего века и косоглазие наблюдаются чаще, чем у их здоровых сверстников. У 10% детей с ФАС обнаружено характерное сочетание «пальпебрального синдрома» с телекантусом и микрофтальмом.
2. У детей с ФАС отмечается статистически значимое снижение остроты зрения как без оптической коррекции, так и с максимальной коррекцией, по сравнению со здоровыми детьми контрольных групп.
3. У детей с ФАС аномалии рефракции встречаются чаще, чем у здоровых детей. При этом частота обнаружения гиперметропии почти вдвое, а гиперметропического астигматизма - в 4 раза превышает таковую у здоровых детей соответствующего пола и возраста.
4. У детей с ФАС обнаружено нарушение восприятия движения, по результатам «Motion perception program», по сравнению со здоровыми детьми из контрольной группы.

31
2 ACKNOWLEDGEMENTS
The research was carried out at the Sigvard & Marianne Bernadotte’s Research Laboratories for Pediatric Ophthalmology of Karolinska Institutet, Stockholm, Sweden and at the ophthalmology department of St-Petersburg State Pediatric Medical Academy, St-Petersburg, Russia. I want to express my best gratitude to all friendly, professional and smart people who surrounded me during my work and made it pleasant: To my outstanding main supervisor Professor Jan Ygge, for the beliving in me from the very beginning and kindly support despite the long period of investigations, distance difficulties between countries and two daughters which I deliverd during the timing of my study. Thank you for your patience, for the time that you spent with me, improving my writing style. You show to me and teach me how to write and publish a scientific paper and how to advance even having some children. To my lovely “cosupervisor” from the warm Italy Roberto Bolzani, who is warm not only because of climatic features of his native country but by his heart. Thank you for your easy lectures about statistics, for your support and help during data analyses and writing, for your patience and intelligence. To the Ulla-Britt Shutzler-Peterson and Mia Pettersson who have every paper and document on its place, always being helpful and reliable. To all my friendly collegues from Bernadottelaboratoriet and Pediatric Academy, who inspired me and helped me with their smiles and advices. It was very nice time with you! Thank to all of you very much! To the coordinator of the KIRT sandwich project Tommy Linne for the support and solving all managerial problems that appeared during the study time. To all my subjects for participating in the study, who were tired sometimes because of the long investigation but helped me, making my study completed. To my wonderful friends from Stockholm – Olga, Natalja, Tatiana, Liza, small Olga, Zaynab, Ksenia, Darya, Igor, Sergey, Alexey, Anton, Alexandr, Dmitry, Andrey, Erik and all others – who always was ready to uphold me and my daughters, to settle me, and to arrange our evenings and weekends. The time spent with all of you was really magic! To my lovely parents Svetlana and Konstantin who always believe in me, support me, help me in all my undertakings. Thank you for making possible to accept the challenge with my research by taking care of Viktoria and Polina when they were young. I love you very much and very grateful to you for everything! And of course this work would not happen without love of my marvelous husband Jury and my lovely daughters Viktoria and Polina – you are all my best! Thank you for the tolerance and encouragement during these years! I love you!

32
3 REFERENCES
Abel E. An update on the incidence of FAS: FAS is not an equal opportunity birth defect. Neurotoxicol. Teratol 1995; 17: 437–443.
Altman B. Fetal alcohol syndrome. J. Pediatr. Ophthalmol 1976; 13: 255–258.
Atamanov VV. 2000: http://www.instituе-kosmetology.ru/doks/00000121.html
Atkinson J, King J, Braddick O et al. A specific deficit of dorsal stream function in Williams’ syndrome. Neuroreport 1997; 8: 1919–1922.
Augsburger AR. Hyperopia. In: Amos JF, editor. Diagnosis and management in vision care. Boston: Butterworths 1987:101-19.
Balachova TN, Bonner BL, Isurina GL et al. Use of focus groups in developing FAS/FASD prevention in Russia. Subst. Use Misuse 2007; 42(5): 881-894.
Bednarek DB, Grabowska A. Luminance and chromatic contrast sensitivity in dyslexia: The magnocellular deficit hypothesis revisited. Neuroreport 2002; 13(18): 2521–2525.
Benassi M, Simonelli L, Giovagnoli S. Coherence motion perception in developmental dyslexia: a meta-analysis of behavioral studies. Dyslexia 2010; 16(4): 341-357.
Boden C, Giaschi D. M-stream deficits and reading-related visual processes in developmental dyslexia. Psychol. Bull 2007; 133: 346–366.
Braddick OJ, O’Brien JM, Wattam-Bell J. Brain areas sensitive to coherent visual motion. Perception 2001; 30(1): 61–72.
Brien JF, Smith GN. Effects of alcohol on the fetus. J. Dev. Physiol 1991; 15(1): 21-32.
Burd L, Cox C, Poitra B et al. The FAS Screen: a rapid screening tool for fetal alcohol syndrome. Addict. Biol 1999; 4: 329–336.
Card SE, Tompkins SF, Brien JF. Ontogeny of the activity of ADH and ALDH in the liver and placenta of the guinea pig. Biochem. Pharmacol 1989; 38(15): 2535-2541.
Chan D, Daisy Q. Fetal alcohol syndrome. Optom. and Vis. Science 1999; 76(10): 678-685.
Chan T, Bowell R, O'Keefe M et al. Ocular manifestations in fetal alcohol syndrome. Br. J. Ophthalmol 1991; 7: 524–526.
Chen WJ, Maier SE, Parnell SE et al. Alcohol and the developing brain: neuroanatomic studies. Alcohol. Res. Health 2003; 27(2): 174-180.
Chen Y, Palafox GP. Nakayama K et al. Motion perception in schizophrenia. Arch. Gen. Psychiatry 1999; 56(2): 149-154.
Clarren SK, Smith DW. The fetal alcohol syndrome. N. Engl. J. Med 1978; 298: 1063–1067.

33
Gray R, Mukherjee RA, Rutter M. Alcohol consumption during pregnancy and its effects on neurodevelopment: what is known and what remains uncertain. Addiction 2009; 104(8): 1270-1273.
Green CR, Mihic AM, Nikkel SM et al. Executive function deficits in children with fetal alcohol spectrum disorders (FASD) measured using the Cambridge Neuropsychological Tests Automated Battery (CANTAB). J. Child. Psychol. Psychiatry 2009; 50(6): 688-697.
Gronlund MA, Aring E, Hellstrom A et al. Visual and ocular findings in children adopted from eastern Europe. Br. J. Ophthalmol 2004; 88: 1362-1367.
Grosvenor T. A review and a suggested classification system for myopia on the basis of age-related prevalence and age of onset. Am J Optom Physiol Opt. 1987; 64:545-54.
Iliff WJ, Pacheco EM. Ptosis Surgery. In Tasman W, Jaeger E (eds): Duane's Foundations of Clinical Ophthalmology, vol. 5. Philadelphia: Lippincott-Raven, 1992.
Hinzpeter EN, Renz S, Löser H. Augenveränderungen bei Alkoholembryopathie. Klin. Monbl. Augenheilkd 1992; 200: 33–38.
Hug TE, Fitzgerald KM, Cibis GW. Clinical and electroretinographic findings in fetal alcohol syndrome. J. Pediatr. Opthalmol. Strabismus 2000; 4: 200–204.
Janzen LA, Nanson JL, Block GW. Neuropsychological Evaluation of Preschoolers With Fetal Alcohol Syndrome. Neurotoxicol. Teratol 1995; 17(3): 273-279.
Jones KL, Smith DW. Recognition of the fetal alcohol syndrome in early infancy. Lancet 1973; 302(7836): 999–1001.
Kaemingk KL, Halverson PT. Spatial memory following prenatal alcohol exposure: More than a material specific memory deficit. Child Neuropsychol 2000; 6: 115–128.
Kristjanson AF, Wilsnack SC, Zvartau E et al. Alcohol use in pregnant and nonpregnant Russian women. Alcohol. Clin. Exp. Res 2007; 31(2): 299-307.
Landgren M, Svensson L, Strömland K et al. Prenatal alcohol exposure and neurodevelopmental disorders in children adopted from eastern Europe. Pediatrics 2010; 125(5): 1178-1185.
Li CS. Impaired detection of visual motion in schizophrenia patients. Prog. Neuropsychopharmacol. Biol. Psychiatry 2002; 26(5): 929–934.
Lindsley TA, Comstock LL, Rising LJ. Morphologic and neurotoxic effects of ethanol vary with timing of exposure in vitro. Alcohol 2002; 28(3): 197-203.
Liu Y, Balaraman Y, Wang G, Nephew KP, Zhou FC. Alcohol exposure alters DNA methylation profiles in mouse embryos at early neurulation. Epigenetics. 2009 1;4(7):500-11
Markó K, Mikó-Baráth E, Kiss HJ, Török B, Jandó G.Effects of luminance on dynamic random-dot correlogram evoked visual potentials. Perception 2012; 41(6):648-60.
Mattson SN, Riley EP, Delis DC et al. Verbal learning and memory in children with Fetal Alcohol Syndrome. Alcohol. Clin. Exp. Res 1996; 20: 810–816.

34
Mattson SN, Roebuck TM. Acquisition and retention of verbal and nonverbal information in children with heavy prenatal alcohol exposure. Alcohol. Clin. Exp. Res 2002; 26:875–882.
May P, Brooke L, Gossage J et al. Epidemiology of fetal alcohol syndrome in a South African community in the Western Cape province. Am. J. Public. Health 2000; 90: 1905–1912.
Menghini D, Finzi A, Benassi M et al. Different underlying neurocognitive deficits in developmental dyslexia: A comparative study. Neuropsychol 2010; 48:863–872.
Merigan WH, Nealey TA, Maunsell JHR. Visual effects of lesions of cortical area V2 in macaques. J. Neurosci 1993; 13: 3180–3191.
Miller LC, Chan W, Litvinova A et al. Boston-Murmansk Orphanage Research Team. Fetal alcohol spectrum disorders in children residing in Russian orphanages: a phenotypic survey. Alcohol. Clin. Exp. Res 2006; 30(3): 531-538.
Miller MT, Israel J, Cuttone J. Fetal alcohol syndrome. J. Pediatr. Ophthalmol. Strabismus 1981; 18: 6–15.
Miller MT, Epstein RJ, Sugar J et al. Anterior segment anomalies associated with the fetal alcohol syndrome. J. Pediatr. Ophthalmol. Strabismus 1984; 21: 8–18.
Mitchell, D.E., Kennie, J., and Kung, D. Development of global motion perception requires early postnatal exposure to patterned light. Curr. Biol 2009;19: 645–649.
Moore ES, Ward RE, Wetherill LF et al. Unique facial features distinguish fetal alcohol syndrome patients and controls in diverse ethnic populations. Alcohol. Clin. Exp. Res 2007; 31(10): 1707-1713.
Nicolson RI, Fawcett AJ, Dean P. Developmental dyslexia: The cerebellar deficit hypothesis. Trends. Neurosci 2001; 24: 508–511.
Ohlsson J, Villarreal G, Sjöström A et al. Visual acuity, residual amblyopia and ocular pathology in a screened population of 12–13-year-old children in Sweden. Acta Ophthalmol. Scand 2001; 79(6): 589-595.
Olney JW, Wozniak DF, Jevtovic-Todorovic V et al. Glutamate signaling and the fetal alcohol syndrome. Ment. Retard. Dev. Disabil. Res. Rev 2001; 7: 267–275.
Pellicano E, Gibson LY. Investigating the functional integrity of the dorsal visual pathway in autism and dyslexia. Neuropsychol 2008; 46: 2593–2596.
Rasmussen C, Pei J, Manji S et al. Memory strategy development in children with foetal alcohol spectrum disorders. Dev. Neurorehabil 2009; 12(4): 207-214.
Ribeiro IM, Vale PJ, Tenedorio PA et al. Ocular manifestations in fetal alcohol syndrome. Eur. J. Ophthalmol 2007; 17(1): 104-109.
Riley EP, Guerri C, Calhoun F et al. Prenatal alcohol exposure: advancing knowledge through international collaborations. Alcohol. Clin. Exp. Res 2003;27(1): 118-135.
Riley EP, McGee CL. Fetal alcohol spectrum disorders: An overview with emphasis on changes in brain and behavior.Exp Biol Med (Maywood) 2005; 230:357–365.

35
Sampson PD, Streissguth AP, Bookstein FL et al. Incidence of fetal alcohol syndrome and prevalence of alcohol-related neurodevelopmental disorder. Teratol 1997; 56(5): 317-326.
Smith M, Hopkinson DA, Harris H. Developmental changes and polymorphism in human alcohol dehydrogenase. Ann. Hum. Genet 1971; 34(3): 251-271.
Somov E.E. Клиническая офтальмология. – М.: МЕДпресс-информ, 2005: 392 p.
Spadoni AD, Bazinet AD, Fryer SL et al. BOLD Response During Spatial Working Memory in Youth With Heavy Prenatal Alcohol Exposure. Alcohol. Clin. Exp. Res 2009; 33(12): 2067–2076.
Stratton K, Howe C, Battaglia FC. Fetal Alcohol Syndrome: Diagnosis, Epidemiology, Prevention, and Treatment. National Academy Press, Washington, DC;1996.
Streissguth AP, Bookstein FL, Sampson PD et al. Neurobehavioral effects of prenatal alcohol: Part III. PLS analyses of neuropsychologic tests. Neurotoxicol. Teratol 1989; 11: 493–507.
Streissguth AP. Fetal alcohol syndrome in older patients. Alcohol. Alcohol. Suppl 1993; 2: 209-212.
Strömland K. Ocular abnormalities in the fetal alcohol syndrome. Acta Ophthalmol. Scand 1985; 63, Suppl. 171: 1–50.
Strömland K. Ocular involvement in the fetal alcohol syndrome. Surv. Ophthalmol 1987; 31: 277.
Strömland K, Hellström A. Fetal alcohol syndrome. An ophthalmological and socioeducational prospective study. Pediatrics 1996; 97: 845–850.
Stromland K, Pinazo-Duran MD. Ophthalmic involvement in the fetal alcohol syndrome: clinical and animal model studies. Alcohol. Alcohol 2002; 37(1):2 – 8.
Stromland K. Visual impairment and ocular abnormalities in children with fetal alcohol syndrome. Addict. Biol 2004; 9(2): 153-157; discussion 159-160.
Talcott JB, Hansen PC, Willis-Owen C et al. Visual magnocellular impairment in adult developmental dyslexics. J. Neuroophthalmol 1998; 20: 187–201.
Talcott J, Hansen P, Assoku E et al. Visual motion sensitivity in dyslexia: Evidence for temporal and energy integration deficits. Neuropsychol 2000; 38: 935–943.
Weakley DR. The association between nonstrabismic anisometropia, amblyopia, and subnormal binocularity. Ophthalmol 2001; 108(1): 163-171.
White S, Frith U, Milne E et al. A double dissociation between sensorimotor impairments and reading disability: A comparison of autistic and dyslexic children. Cogn. Neuropsychol 2006; 23(5): 748-761.
Whitmire D, Bowen JP, Shim JY. Computational modeling of a putative FAS mechanism. Alcoh. Clin. Exp. Res 1995; 19(6):-1593.

36
Willford J, Richardson G, Leech S et al. Verbal and visuospatial learning and memory function in children with moderate prenatal alcohol exposure. Alcohol. Clin. Exp. Res 2004; 28: 497–507.
Witton C, Talcott JB, Hansen PC et al. Sensitivity to dynamic auditory and visual stimuli predicts nonword reading ability in both dyslexic and normal readers. Curr. Biol 1998; 8: 791–797.