Visualization Viewpoints - vis.cs.brown.edu
6
T his article describes some of the lessons we have learned from our collaborations with artists on visualization problems at Brown University’s Visualization Research Lab. Over the past several years, we have worked closely with artists to develop, refine, and critique visualizations ranging from archaeologi- cal dig data from the Great Temple of Petra site in Jordan to the fluid dynamics and wing bone shape deformations that begin to explain how bats, the only flying mammals, stay aloft. Perhaps, the most important conclusion we have drawn from this experience is that artists can fill an important role in the visualization design pipeline. In our experience, artists routinely provide a unique source of visual insight and creativity for tackling difficult visu- al problems. They are also expertly trained in critiquing and refining visual works, an essential task in the itera- tive visualization process. The second major conclusion we have drawn from our collaborations with artists is that we need more appro- priate design tools to support them and their role. We discuss here the experiences that led us to this conclu- sion, along with some of the tools we have developed to facilitate working with artists. The lack of appropriate design tools is particularly evident in VR. It’s difficult for artists to get involved in visualization design for VR, since, with rare exceptions, you need to know how to program in order to create within the medium. VR is one of the most promising technologies for visualizing today’s complex data sets. 1 However, it’s also one of the technologies that can most benefit from artistic insight, since guidelines for good visual depiction are far less developed in the unconventional visual space of VR than in more traditional media. We begin by describing one of our recent major collab- orative efforts, a class on designing VR scientific visual- izations that was cotaught with professors and students from Brown University’s computer science department and the Rhode Island School of Design’s (RISD’s) illus- tration department. Many of the experiences and con- clusions relayed here are the results of this class. We then discuss three important themes that we derived from our experiences, which are all motivated by a desire to better facilitate artistic collaborations. Teaching art to computer scientists, computer science to artists, and fluid flow to everyone Our interdisciplinary visualization class brought artists and computer scientists together to solve visual- ization problems driven by science. Students worked in teams on visualization and design assignments, fol- lowing the interdisciplinary Renaissance team model presented by Donna Cox. 2 We began the semester with 2D fluid flow visualization assignments, as shown in Figure 1, and gradually built up to the final projects, which were VR visualizations of pulsatile blood flow through a branching coronary artery. We found more Daniel F. Keefe, David B. Karelitz, Eileen L. Vote, and David H. Laidlaw Brown University Artistic Collaboration in Designing VR Visualizations __ Visualization Viewpoints Editor: Theresa-Marie Rhyne 18 March/April 2005 Published by the IEEE Computer Society 0272-1716/05/$20.00 © 2005 IEEE Icon elements legend Velocity (m/s) Strain (% squish) Squish Rate Speed 0 1 2 3 4 5 0 25 50 75 100 −5 0 5 100 0 100 0 1 2 3 4 5 Rate of strain (%/s) Turbulent current (V/s) Vorticity (r) Direction Speed −π 0 π Vines Ellipses Ground Turbulent charge (V) Direction Direction 1 Art student’s visualization design of 2D steady fluid flow past a cylinder. (Courtesy of Deborah Grossberg.)
Transcript of Visualization Viewpoints - vis.cs.brown.edu

This article describes some of the lessons we havelearned from our collaborations with artists on
visualization problems at Brown University’sVisualization Research Lab. Over the past several years,we have worked closely with artists to develop, refine,and critique visualizations ranging from archaeologi-cal dig data from the Great Temple of Petra site inJordan to the fluid dynamics and wing bone shapedeformations that begin to explain how bats, the onlyflying mammals, stay aloft.
Perhaps, the most important conclusion we havedrawn from this experience is that artists can fill animportant role in the visualization design pipeline. Inour experience, artists routinely provide a unique sourceof visual insight and creativity for tackling difficult visu-al problems. They are also expertly trained in critiquingand refining visual works, an essential task in the itera-tive visualization process.
The second major conclusion we have drawn from ourcollaborations with artists is that we need more appro-priate design tools to support them and their role. Wediscuss here the experiences that led us to this conclu-sion, along with some of the tools we have developed tofacilitate working with artists. The lack of appropriatedesign tools is particularly evident in VR. It’s difficult forartists to get involved in visualization design for VR,since, with rare exceptions, you need to know how toprogram in order to create within the medium. VR is oneof the most promising technologies for visualizing
today’s complex data sets.1 However, it’s also one of thetechnologies that can most benefit from artistic insight,since guidelines for good visual depiction are far lessdeveloped in the unconventional visual space of VR thanin more traditional media.
We begin by describing one of our recent major collab-orative efforts, a class on designing VR scientific visual-izations that was cotaught with professors and studentsfrom Brown University’s computer science departmentand the Rhode Island School of Design’s (RISD’s) illus-tration department. Many of the experiences and con-clusions relayed here are the results of this class. Wethen discuss three important themes that we derivedfrom our experiences, which are all motivated by adesire to better facilitate artistic collaborations.
Teaching art to computer scientists,computer science to artists, and fluidflow to everyone
Our interdisciplinary visualization class broughtartists and computer scientists together to solve visual-ization problems driven by science. Students workedin teams on visualization and design assignments, fol-lowing the interdisciplinary Renaissance team modelpresented by Donna Cox.2 We began the semester with2D fluid flow visualization assignments, as shown inFigure 1, and gradually built up to the final projects,which were VR visualizations of pulsatile blood flowthrough a branching coronary artery. We found more
Daniel F. Keefe,David B.Karelitz, EileenL. Vote, andDavid H.Laidlaw
BrownUniversity
Artistic Collaboration in Designing VR Visualizations __
Visualization Viewpoints
Editor: Theresa-Marie Rhyne
18 March/April 2005 Published by the IEEE Computer Society 0272-1716/05/$20.00 © 2005 IEEE
Icon elements legend
Velocity (m/s)
Strain (% squish)
Squish Rate Speed
0 1 2 3 4 5
0 25 50 75 100 −5 0 5
100 0 100 0 1 2 3 4 5
Rate of strain (%/s)
Turbulentcurrent (V/s)
Vorticity (r)
Direction
Speed
−π 0 π
Vines Ellipses Ground
Turbulentcharge (V)
Direction Direction
1 Art student’svisualizationdesign of 2Dsteady fluidflow past acylinder.(Courtesy ofDeborahGrossberg.)

obstacles to collaboration as wemoved toward VR and more com-plex data. Despite these obstacles,the students learned to collaboratewith each other and to value whateach discipline (computer scienceand art) offered to the project, pro-ducing some interesting visualiza-tions in the process.
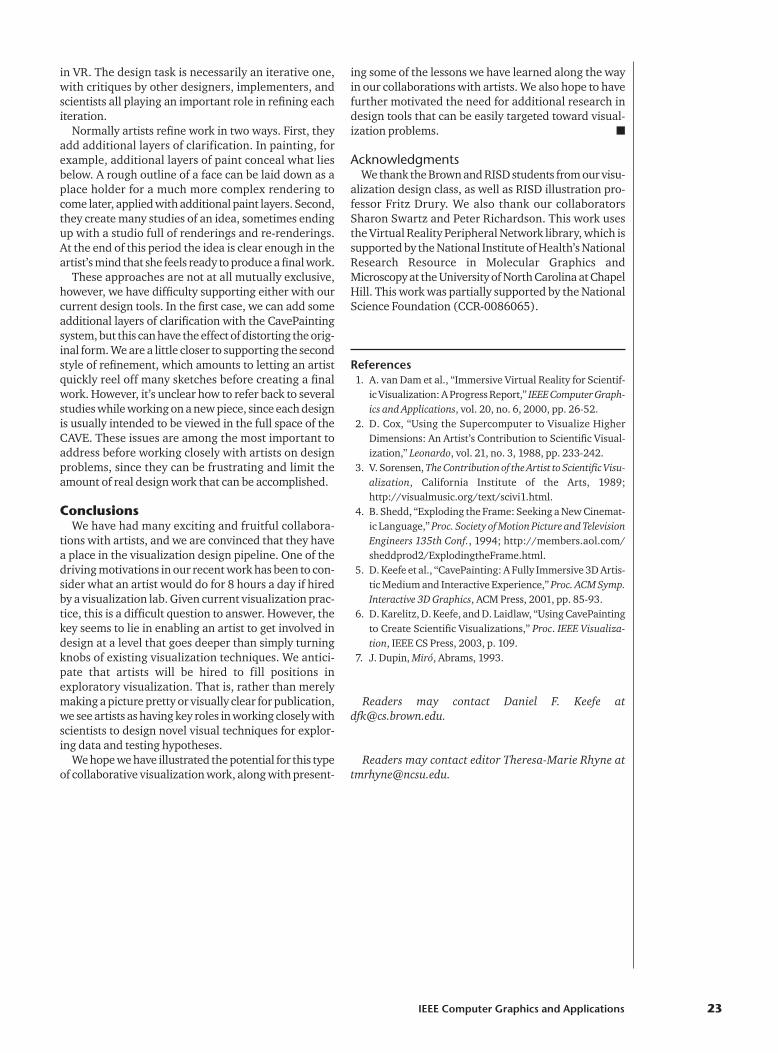
Although artists rarely work withcomplex scientific data, they dotrain to convey information effec-tively through imagery, given theconstraints imposed by their media,employers, or audience. In thisabstract sense, normal artistic prac-tice is not such a far cry from typicalvisualization design tasks. Theimages in Figure 1 show one artstudent’s result from an early visu-alization design assignment. Thestudents created visualizations andlegends that convey eight continu-ous variables describing a steady, 2Dfluid flow in a single picture. This isa difficult visual problem; in fact, the visualization com-munity is still actively researching it. We found thatartists were adept at investigating visual problems likethis one when we could clearly convey the scientificgoals and constraints of the problem.
Artists also excelled in the initial design and concep-tualization stages of the scientific research process,often prompting new insights on the part of the scien-tist team members. Scientists rethought their hypothe-ses, clarified their experimental goals, and even alteredthe way they collect data in response to feedback fromartists. As Vibeke Sorensen explains in her discussionof the artist’s contribution to scientific visualization,this role for artists is a departure from the norm.3 Artistsare typically thought to be useful only in the last stageof the research process, dissemination. However, thisis a limited use of the artist. Our experiences supportSorensen’s claims that artists can be involved in manymore stages of research, with conceptualization beingperhaps the most important with regard to scientificvisualization.
Collaboration was sometimes difficult to manage. Inearly assignments, such as in Figure 1, the right tools forthe job were colored pencil, oil paint, gouache, watercol-ors, and software (Adobe Photoshop). In later assign-ments, the essential tool for the job moved closer toprogramming.
At this point, the art students often had visual insightsto offer, but had difficulty conveying them. It was easyfor the nonprogrammers to feel left out of the loop. AsFritz Drury (the RISD illustration professor whocotaught the class) remarked, the programmers are theones with the ultimate power: They have the final sayabout what ends up on the screen.
One device that helped us keep artists, computer sci-entists, and fluid flow researchers on the same page isthe critique, a common teaching tool in art classes. All
the class work was displayed on a wall, as seen in Figure2, and as a class, we discussed important design lessonsin relation to each work. We critiqued the work bothfrom a visual and a scientific standpoint. Visually, weexplored color, scale, form, metaphor, and narrative.Scientifically, we learned about the data we were tryingto represent and critiqued the work on the basis of howtruthfully and completely the science was represented,given the tasks our scientists wished to perform. Wehave now adopted crits into the visualization develop-ment process for many of our projects.
How can artists approach designproblems in VR?
As we move from 2D visualizations into more complex3D situations such as VR, collaboration with artistsbecomes much more difficult to facilitate. The first themewe derived from our class experiences (along with othercollaborative efforts) is that visualization design shouldoccur within the visualization target medium.
This sounds simple, but it has fairly significant rami-fications for the visualization media we often use. Forexample, it’s difficult for anyone, and nearly impossiblefor an artist who is not a programmer, to create visual-izations or simply experiment with design ideas in VR.
A starting approximation for designing within VR is touse more traditional, often 2D, media and hope thatsome of these design ideas will translate to VR. We wereforced to take this approach during many of the classassignments. The difficulty is the drastic differencebetween what we can convey on paper and what we canconvey in VR. We use a four-wall CAVE VR display envi-ronment for much of our research. So much changeswhen we enter the CAVE: scale, interaction, stereovision, vividness of color, and contrast. Due to the dras-tic differences in the mediums, it’s difficult to trust orevaluate traditional designs of VR ideas.
IEEE Computer Graphics and Applications 19
2 Students prepare for a critique of arterial blood flow visualization designs.

Ben Shedd notes a similar dilemma in a comparisonbetween traditional filmmaking and new Imax-stylefilmmaking.4 In giant screen films, as in VR, the project-ed images extend beyond our peripheral vision. This sig-nificant change has required filmmakers to begin toinvent a new visual language, and prompted Shedd tocall for redefining giant screen filmmaking tools. This isone of the issues Shedd explores in his interdisciplinaryclass at Princeton.
In VR visualization, we are also defining a new visuallanguage, and we deal with a similar lack of appropriatetraditional tools to do the job. When designing tradition-ally with an eye toward VR, we face the problem that agood 2D design does not necessarily translate into a good3D, much less VR, design. Further, it’s difficult to evalu-ate or propose refinements to a design without actuallyseeing it implemented in the CAVE. We lose the powerof the critique, which we have found so useful. We needto be able to design and critique within VR.
With this motivation in mind, we began exploringways to work with artists to design visualizations direct-ly within the CAVE. Figure 3 shows some snapshots ofone of our VR design results. In this project we are col-laborating with Sharon Swartz, of Brown’s evolution-ary biology department, who studies bat flight fromexperimental data collected in wind tunnels. Two impor-tant clues to understanding bat locomotion are the airflow information surrounding the wing and the patternof deformations of the wing bones during flight. Artistsworked directly in VR to create the visualization designshown in Figure 3.
Since the bat data assumes symmetry between thetwo wings, the artists chose to represent differentaspects of the data on each side of the bat. On the left
side of these images, flow close to the wing is describedby color and texture along the wing surface. Vortex coresand vortical structures in the flow behind the bat arealso represented. Changes in bone shape at two distincttimes during a wing beat cycle are shown on the rightside of the images along with a 3D trace of an importantbone joint through the wing beat cycle.
The basis for our VR design tools is the CavePaintingprogram,5 a tool intended for artists to use inside theCAVE environment to create free-form 3D objects.Artists have described it as a form of zero-gravity sculp-ture. Artists interact with the system by moving atracked paintbrush prop through the air to create 3Dpaint strokes. The paintings are actually 3D models,since each brush stroke exists in 3-space. The system’sintuitive interface makes it easy for artists to pick up andquickly begin modeling in the CAVE.
Working directly in the CAVE with a tool likeCavePainting has several benefits. The most importantis that the design can be easily critiqued and refinedwith proper attention to the nuances of the target medi-um. In practice, we have gained valuable insight fromthese critiques.
We have made several alterations to our initial batvisualization designs based on feedback from Swartzand her collaborators after meeting for critiques in theCAVE. During these critiques we have even been able toquickly sketch modifications to designs and discuss themimmediately.
Using CavePainting to design visualizations also letsus investigate, refine, and converge on a successful visu-al design at an early stage in the process. With the usualapproach of implementing before visual refinement, itmight take weeks or months of implementation beforewe discover our design is flawed from a visual stand-point, and once we notice a problem and brainstormanother design, it could take another few weeks beforewe are ready to visually critique that new design.
Thus, particularly in VR, where implementation canbe difficult and time consuming, putting visual designdecisions in series with implementation can extend thetime between iterations on a visual design. Designingdirectly in VR, on the other hand, lets us converge upona visually successful design early in the implementa-tion process. We can quickly work through many more
Visualization Viewpoints
20 March/April 2005
3 CavePainting visualization design of bat flight data shown using snapshots from a 3D VR program. The bat appears to fly into thepage in these snapshots, but viewers walk around the entire model when seen in VR.
No data Tight connectionwith data
CavePainting- full artistic freedom- less representative of data
Our visualizationprototyping system- more artistic constraints- representative of data
4 Design tools can have a stronger or weaker built-inconnection with data. Tools at both ends of the spec-trum are useful.

iterations of the design because we do not have to waitfor them to be implemented before critiquing them inthe CAVE.
Where’s the data?The second theme that has emerged from our collab-
orative work is that we should incorporate varying lev-els of data involvement in the design process. In the batvisualization design shown in Figure 3, there is no pro-grammed link between the visuals and the bat flight data.Designs such as this lie at one end of the spectrum shownin Figure 4. Despite the lack of a low-level link with thedata, this type of design is extremely useful. The design-ers have imagined some representative data andsketched it out. The visualization is not far fetched; thedesigners have seen previous attempts at bat visualiza-tions and talked with the scientist about her goals.Essentially, they know enough about the data structureto paint a typical situation so that they can meet with thescientist and critique the visualization idea in the CAVE.
The danger in going too far in the design process with-out a program-level connection of the visuals to the datais that we might converge upon a design that works wellfor our perception of the data but not as well with theactual data. In an effort to explore this issue, we builtsome design tools to explore the other end of the spec-trum of data involvement. As we see in Figure 4, tools likeCavePainting lie at the far left end of the spectrum, withno program-level connection to the scientific data. The
visualization prototyping system we describe next ismuch closer to the right side of the spectrum, where dataplays a key role in generating the visualization design.
Our visualization prototyping system lets an artist drawicon-based 3D visualizations that are completely drivenby the underlying scientific data.6 Figure 5 is a snapshotof one such visualization design. The squid-like icons rep-resent data values within a fluid-flow data set of pulsatileblood flow through a branching coronary artery.
In this design, the squid’s tentacles morph in responseto data values. At high speeds, they straighten out andthe squid appears quite streamlined. At lower speeds,they flail out to the sides, as the squid assumes a slug-gish posture.
This tool has been useful in evaluating several differ-ent designs for arterial blood flow visualization. Sincewe are working with time varying, pulsatile fluid flow,the ability to see the design animated—with icons flow-ing down the artery and changing shape in response tothe data—is critical in evaluating the design’s success.This would be a difficult display to realize without a pro-gram-level link to the flow data. Despite the success ofthis approach in achieving these animated visualizationdesigns, we have had difficultly moving beyond theserelatively simple cases to the more complex onesrequired for many of our driving scientific problems.
This experience illustrates the tradeoff that exists inmany design systems based on the role they provide fordata. Given plenty of preprogrammed connections to
IEEE Computer Graphics and Applications 21
5 Result from our visualization prototyping system. An artist sketched the 3D icons, then connected them to anarterial blood flow data set so that they morph in direct response to the data.

data, design tools can produce visualization designsthat are so representative of the data that they can betrusted and critiqued as completely accurate visualiza-tions. However, preprogrammed connections to datacan be constraining to the artist. For example, in our cur-rent implementation of the prototyping tool, the iconsmust be drawn in a special way to establish a solid cor-respondence for our morphing algorithm. This meansthat the artist must have this in mind while working onthe design. Creating complex designs—for example,icons that respond to six different variables—canbecome almost impossible to manage cognitively. Again,these difficult design tasks are the ones our driving sci-entific problems require and the ones in which we canmost benefit from artistic insight. We need to continueto develop intuitive design tools that provide this type ofsolid connection to the data, but also allow artists towork naturally.
Tools for VR design work The final theme that has emerged in our collabora-
tions is the need to support continued, evolving workwith VR tools. This has been evident in two areas. First,getting started in VR is difficult. Often our artists makeseveral preparatory sketches or studies before enteringthe CAVE to work. We need to make it easier for themto build on those sketches when they get to the CAVE,rather than shutting out the real world and concentrat-ing only on VR. Second, we need to facilitate returningto a design to rework and refine it. The real-world prob-
lems with which we anticipate artists will work are suf-ficiently complex that they will require many design iter-ations to complete. Tools to facilitate artisticcollaboration in visualization must be accessible toartists in these ways if we want to support artisticinvolvement in difficult visual problems.
Looking at CavePainting again as an example of anartistic design tool, we can see that it can be difficult tostart on a VR design. When the program begins, we walkinto the CAVE—a dark, blank room of projection screenwalls. We carry a tracked paintbrush prop and a pair ofglasses. Once we put on our stereo glasses, it’s too darkto see any paper or other real objects we might havebrought in with us. By default, we start with a complete-ly blank canvas and no external inspiration, somethingdesigners almost never want to do.
One approach that has been helpful to us is to importour design inspiration, often 2D work such as sketchesor paintings, directly into the VR design program. InFigure 6, we see a 3D CavePainting design inspired by aMiró painting.7 One of our designers saw the painting,and it gave her the idea for visualizing the bat data set.We cut out subregions of the Miró and imported theminto CavePainting as brushstroke textures. Then ourdesigner could work directly with elements of the inspi-rational imagery to create the 3D design she imagined.This gave her a jump start on her 3D design and helpedher quickly create a coherent design.
The ability to return to a design and refine it againand again is just as important as starting with something
Visualization Viewpoints
22 March/April 2005
6 3D visualizationdesign for the batflight probleminspired by theMiró painting TheGold of the Azure(see http://www.bcn.fjmiro.es/angles/_coleperm/_salaanys6070/lordelatzur.html).
in VR. The design task is necessarily an iterative one,with critiques by other designers, implementers, andscientists all playing an important role in refining eachiteration.
Normally artists refine work in two ways. First, theyadd additional layers of clarification. In painting, forexample, additional layers of paint conceal what liesbelow. A rough outline of a face can be laid down as aplace holder for a much more complex rendering tocome later, applied with additional paint layers. Second,they create many studies of an idea, sometimes endingup with a studio full of renderings and re-renderings.At the end of this period the idea is clear enough in theartist’s mind that she feels ready to produce a final work.
These approaches are not at all mutually exclusive,however, we have difficulty supporting either with ourcurrent design tools. In the first case, we can add someadditional layers of clarification with the CavePaintingsystem, but this can have the effect of distorting the orig-inal form. We are a little closer to supporting the secondstyle of refinement, which amounts to letting an artistquickly reel off many sketches before creating a finalwork. However, it’s unclear how to refer back to severalstudies while working on a new piece, since each designis usually intended to be viewed in the full space of theCAVE. These issues are among the most important toaddress before working closely with artists on designproblems, since they can be frustrating and limit theamount of real design work that can be accomplished.
ConclusionsWe have had many exciting and fruitful collabora-
tions with artists, and we are convinced that they havea place in the visualization design pipeline. One of thedriving motivations in our recent work has been to con-sider what an artist would do for 8 hours a day if hiredby a visualization lab. Given current visualization prac-tice, this is a difficult question to answer. However, thekey seems to lie in enabling an artist to get involved indesign at a level that goes deeper than simply turningknobs of existing visualization techniques. We antici-pate that artists will be hired to fill positions inexploratory visualization. That is, rather than merelymaking a picture pretty or visually clear for publication,we see artists as having key roles in working closely withscientists to design novel visual techniques for explor-ing data and testing hypotheses.
We hope we have illustrated the potential for this typeof collaborative visualization work, along with present-
ing some of the lessons we have learned along the wayin our collaborations with artists. We also hope to havefurther motivated the need for additional research indesign tools that can be easily targeted toward visual-ization problems. ■
AcknowledgmentsWe thank the Brown and RISD students from our visu-
alization design class, as well as RISD illustration pro-fessor Fritz Drury. We also thank our collaboratorsSharon Swartz and Peter Richardson. This work usesthe Virtual Reality Peripheral Network library, which issupported by the National Institute of Health’s NationalResearch Resource in Molecular Graphics andMicroscopy at the University of North Carolina at ChapelHill. This work was partially supported by the NationalScience Foundation (CCR-0086065).
References1. A. van Dam et al., “Immersive Virtual Reality for Scientif-
ic Visualization: A Progress Report,” IEEE Computer Graph-ics and Applications, vol. 20, no. 6, 2000, pp. 26-52.
2. D. Cox, “Using the Supercomputer to Visualize HigherDimensions: An Artist’s Contribution to Scientific Visual-ization,” Leonardo, vol. 21, no. 3, 1988, pp. 233-242.
3. V. Sorensen, The Contribution of the Artist to Scientific Visu-alization, California Institute of the Arts, 1989;http://visualmusic.org/text/scivi1.html.
4. B. Shedd, “Exploding the Frame: Seeking a New Cinemat-ic Language,” Proc. Society of Motion Picture and TelevisionEngineers 135th Conf., 1994; http://members.aol.com/sheddprod2/ExplodingtheFrame.html.
5. D. Keefe et al., “CavePainting: A Fully Immersive 3D Artis-tic Medium and Interactive Experience,” Proc. ACM Symp.Interactive 3D Graphics, ACM Press, 2001, pp. 85-93.
6. D. Karelitz, D. Keefe, and D. Laidlaw, “Using CavePaintingto Create Scientific Visualizations,” Proc. IEEE Visualiza-tion, IEEE CS Press, 2003, p. 109.
7. J. Dupin, Miró, Abrams, 1993.
Readers may contact Daniel F. Keefe [email protected].
Readers may contact editor Theresa-Marie Rhyne [email protected].
IEEE Computer Graphics and Applications 23


![IEEE TRANSACTIONS ON VISUALIZATION AND ...vis.cs.brown.edu/docs/pdf/Keefe-2008-SSF.pdfOne way that artists and designers often work when designing visuals is by sketching [2]. Designs](https://static.fdocuments.us/doc/165x107/5e8e65846b1ef22c8d083a3d/ieee-transactions-on-visualization-and-viscsbrownedudocspdfkeefe-2008-ssfpdf.jpg)