Visual Programming in Three Dimensions: visual representations of ...
97
Visual Programming in Three Dimensions: visual representations of computational mental models by Michael J. Kirschner Master of Architecture State University of New York at Buffalo, 2013 SUBMITTED TO THE DEPARTMENT OF ARCHITECTURE IN PARTIAL FULFILLMENT OF THE REQUIREMENTS FOR THE DEGREE OF MASTER OF SCIENCE IN ARCHITECTURE STUDIES AT THE MASSACHUSETTS INSTITUTE OF TECHNOLOGY JUNE 2015 © 2015 Michael Kirschner All rights reserved The author hereby grants to MIT permission to reproduce and to distribute publicly paper and electronic copies of this thesis document in whole or in part in any medium now known or hereafter created. Signature of Author : ______________________________________________________ Department Of Architecture May 21,2015 Certified by: ____________________________________________________________ George Stiny Professor Of Architecture and Design Computation Thesis Supervisor Accepted by: ____________________________________________________________ Takehiko Nagakura Associate Professor Of Architecture and Design Computation Chair, Department of Architecture Committee on Graduate Students 1
Transcript of Visual Programming in Three Dimensions: visual representations of ...

Visual Programming in Three Dimensions: visual representations of computational mental models
byMichael J. Kirschner
Master of Architecture State University of New York at Buffalo, 2013
SUBMITTED TO THE DEPARTMENT OF ARCHITECTURE IN PARTIAL FULFILLMENT OF THE
REQUIREMENTS FOR THE DEGREE OF
MASTER OF SCIENCE IN ARCHITECTURE STUDIES AT THE MASSACHUSETTS INSTITUTE
OF TECHNOLOGY
JUNE 2015
© 2015 Michael Kirschner All rights reserved
The author hereby grants to MIT permission to reproduce and to
distribute publicly paper and electronic copies of this thesis document in whole or in part in any
medium now known or hereafter created.
Signature of Author : ______________________________________________________Department Of Architecture
May 21,2015
Certified by: ____________________________________________________________George Stiny
Professor Of Architecture and Design ComputationThesis Supervisor
Accepted by: ____________________________________________________________Takehiko Nagakura
Associate Professor Of Architecture and Design ComputationChair, Department of Architecture Committee on Graduate Students
�1

THESIS COMMITTEE :
THESIS ADVISOR: GEORGE STINYTHESIS READER: TERRY KNIGHT
�2

Visual Programming in Three Dimensions: visual representations of computational mental models
BY MICHAEL KIRSCHNER
SUBMITTED TO THE DEPARTMENT OF ARCHITECTURE ON MAY 21. 2015 IN PARTIAL FULFILLMENT OF THE REQUIREMENTS FOR THE DEGREE OF
MASTER OF SCIENCE IN ARCHITECTURE STUDIES
ADVISOR: GEORGE STINYPROFESSOR OF ARCHITECTURE AND DESIGN COMPUTATION
Abstract:
Code is a tool to express logic, method, and function. It has form and is intended to be read by humans. One of the goals of this work is to improve the readability and expression of complex interactions in code. The current visual programming environments that see the most use inside, and outside of Architecture present computation in specific terms. I believe these limits hinder the computational designer or novice programmer from learning other mental models of computation, which will come up as they explore further. This thesis proposes that by relating code to landscape or a building in space, code will both create and inhabit space. To enhance the designer’s memory of their program the visual opportunities that visual programming afford will be used to relate uniquely visualized moments in the visual program at a loci in the programming environment. A 3-D visual programming language that can represent code in space, will be able to express the complex abstractions that define computational thinking more intuitively than existing tools, by making them memorable in space.
�3

Acknowledgements
I would like to thank George Stiny for giving me the opportunity to undertake this work, and the initial inspiration for it. Terry Knight, for her support, time, and her dedication to the Design Computation group at MIT. She made MIT and our group a home to us all.Diego Pinochet for his support, and his stubbornness, which helped me to push this work further, and in the end, for letting me name the project.Zach Kron for giving me the opportunity to work with the talented Dynamo team and learn a great many things about visual programming, software development and making things that matter.To my Mother, for her guidance and for art.To my Father for his excitement and for science.To Oriane, for her spirit, patience, and companionship.
Contents
�4
Abstract: 3 Acknowledgements 4 Contents 4 List Of Figures 7
1. Introduction and Goals 11
1.1.Overview 11 1.2.What is Visual Programming 12 1.3.WHY 13 1.4.Fundamental Issues 20 1.5.Goals 24
2. Visual Programming: A Brief Survey 26
2.1.Visual Programming Components 26 2.2. Classification of Visual Languages 29 2.3.Academic 30 2.4.Popular 40
3. Introduction To XYZ (software prototype) 44
3.1.Design Principles 44 3.2.Software Overview 44 3.3.Basic Visualization Features 50 3.4.The User Interface 51 3.5.Sample Graphs 59
4. Object Recognition and Symbol Selection 65
4.1.Exploration Of Node(Function) Visualization 65 4.2.Object Recognition in Humans 66
�5
Table Of Contents
5. Spatio-Temporal Reasoning Necessary For Programming 69
5.1.Fundamental Mental Models 69 5.2. 3D Data Visualization Applications 70 5.3. Organizing and Reorganizing Programs in 3 Dimensions (Control Flow v. Data Flow) 78
6. Data Visualization And Program Visualization 80
6.1.Program Description and Program Output In a 3 dimensional space 80 6.2.Shape Grammar For Visualizing Data Structures 82
7. Software Prototypes 84
7.1.Goals Implemented 84 7.2.Goals Unimplemented 84 7.3.Chronology and Technical Implementation details 85 7.4.Limitations 87
8. Conclusions 88
8.1.Contributions 88 8.2.Limitations Of Approach 92 8.3.Future Work 93
9. References 93
9.1.Works Cited 93 9.2.Works Consulted 96
�6

List Of Figures
�7

1. A DATA FLOW GRAPH IN DYNAMO, THE PARAMETERS THAT DEFINE THE CONE, HAVE FINAL CONTROL OVER THE UNFOLDED RESULT
14
2. ILLUSTRATING UNNAMED VARIABLES IN DATAFLOW GRAPH MAKING REPEATED REFERENCES TRIVIAL TO TRACE
19
3. DATA TREE ENABLED SELECTIONS (RUTTEN,2015) 23
4. NODE 27
5. ARK TOOLKIT SIMULATION REALITY 31
6. VIPR EXECUTION OVER TIME 33
7. VIPR FUNCTION CALL 34
8. FORM 3 ‘VECTORS IN TIME’ SHOWING EXECUTION VALUES OF FUNCTION 35
9. CUBE RECURSIVE FACTORIAL OF N PROGRAM 37
10. CUBE TYPE VISUALIZATIONS 38
11. EVENT AND LOOP BLOCK IN SCRATCH 39
1. APPLE MAC OS X FILE SYSTEM 41
2. XYZ EXECUTION AND DATA CONNECTORS CREATING A NUMBER AND A CUBE 45
3. XYZ 3 NESTED LOOPS PROGRAM TO CREATE CUBES IN SPACE 46
4. XYZ AFTER EVALUATION 47
5. XYZ EXECUTION RESULTS FOR THE CUBE NODE 48
6. A NODE WITH 3 DATA INPUTS AND 1 DATA OUTPUT, 1 EXECUTION INPUT AND 1 EXECUTION OUTPUT
52
�8
List Of Figures

7. A LOOP NODE WITH MULTIPLE EXECUTION OUTPUTS - THE TOP BRANCH WILL RUN EVERY TIME THROUGH THE LOOP AND THE BOTTOM BRANCH CONTINUES
WHEN THE LOOP IS COMPLETE 53
8. CONTROL FLOW NODES DISPLAY DOWNSTREAM NODES INSIDE OF COLORED ZONES
54
9. AN IF ELSE NODE 55
10. CONTROL FLOW NODES DISPLAY DOWNSTREAM NODES INSIDE OF COLORED ZONES BASED ON WHAT BRANCH THEY BELONG TO. THIS ORANGE NODE IS INSIDE A LOOP BRANCH, THE BLUE ZONE IS A VISUAL CUE THAT THIS NODE
WILL BE LOOPED 55
11. NODES, ONCE CONNECTED ATTEMPT TO ORGANIZE THEIR DOWNSTREAM CHILDREN BASED ON BOTH EXECUTION PARENTS AND DATA PARENT NODES.
THEY ARE MOVED IN SPACE AUTOMATICALLY INTO POSITION TO HELP THE USER MAINTAIN SPATIAL STRUCTURE OF THE PROGRAM.
56
12. NODE LAYOUT OPTIONS CONTEXT MENU, LETS A USER REPOSITION ALL NODES BASED ON DIFFERENT ALGORITHMS TO VIEW THE SAME PROGRAM IN
DIFFERENT LAYOUTS. 57
13. THE SIMPLE LIBRARY AND CONTROL UI 58
14. NESTED FOR LOOPS AND OPENED EVALUATION RESULTS INSPECTORS 59
15. NESTED FOR LOOPS AND A SIMPLE IF STATEMENT CONTROLLING CUBE PLACEMENT TO CREATE A SPHEROID
60
16. VISUALIZING INSPECTING NUMBER OF TIMES THAT CUBE WAS CREATED VS NUMBER OF TIMES IF STATEMENT FIRED
61
17. INSPECTING LIST NODES MODIFYING LIST STORED IN A VARIABLE 62
18. A GRAPH THAT STORES POINTS IN A LIST TO CREATE A RANDOM LINE 63
19. INSPECTING THE LIST OF POINTS AND CORRELATING THEM WITH THE GENERATED PINK LINE
64
20. CLUSTERS OF COMMON FUNCTIONS AND SIMPLE ICONS DESIGNED AS SPECIAL PROJECT FOR 6.034 AI WITH P.WINSTON BY AUTHOR
66
21. EXECUTION OVER TIME WITH RE-ROOTING
�9

72
22. VARIOUS VISUALIZATIONS FROM PLUM (TAGS,FILE OBJECTS,AND TIME OBJECTS)
74
23. XYZ’S TREE OBJECT INSPECTOR SHOWING VISUALIZATIONS, TEXT DESCRIPTIONS AND NESTED PROPERTIES
76
24. PERSPECTIVE WALL, CONE TREES, FISHEYE VIEW, (BURNETT ET AL.1995) 77
25. CHANGING LAYOUT MODES, TYPE BASED, ORIGINAL POSITIONS, EXECUTION BASED
79
26. EXECUTION RESULTS GROUPED INTO 3D GRIDS 80
27. INSPECTING EVALUATION RESULTS 81
28. SHAPE GRAMMAR CONVERTED FROM STRING GRAMMAR FOR NESTED LISTS 83
�10

1. Introduction and Goals
1.1.Overview
In Chapter 1. I will outline the reasons within the contexts of both computational design and computer science, why I have undertaken this thesis on the topic of visual programming starting with the fundamental issues I perceive with the tools of the day used in the architectural computational design discipline. I will then outline the goals for both research and implementation that I had when I began the work. There are specific goals I had for functionality in a visual programming language as a base, and more open ended exploration and research into perception and visualization. I will briefly describe some technical goals, some of which remain unsolved.
In Chapter 2. I will cover a brief history of visual programming languages, both commercial and academic languages will be included. I will pay special attention to their methods of visualization, their treatment or exclusion of control flow, and their intended user’s goals and background. Last I will look into languages specifically for computational design or computational geometry geometrical and how these languages shape design thinking and education.
In Chapter 3. I briefly introduce the software prototype and explain the relationship of its basic functionality to precedent studies. I will come back to the features and design decisions of the software prototype in chapter 7.
Chapter 4. I then present a related project that explores simple class based visualization for some of these mental models. Finally I briefly look to cognitive
�11

neuroscience literature from the last two decades as a basis for selection of symbols and visualization techniques.
Chapter 5. examines foundational mental models necessary to understand computation. These are logical frameworks that come up repeatedly when building or reading code. I examine various mental models as computational patterns and explore visualizations for each. I then survey some seminal work on 3d visualization of text, information, and code. Building on the previous work and precedents I describe proposed methods for re-organization and semi-automatic layout of code graphs in 3D space.
Chapter 6. describes the historical and conceptual background between program and data and then examines how this distinction is treated in the software prototype, particularly in visualizing program code and output / input data.
Chapter 7. moves back to a discussion of the implementation of the software prototype, currently named XYZ. First I analyze which of the initial goals have been implemented and dive into their solutions and design decisions. I then describe various visualization experiments that were performed during its development and report briefly on these findings. Also discussed are the current issues with the software that stand in the way of complete satisfactory interaction and use.
Chapter 8. concludes the thesis with a prioritized list of future work and next steps for this software prototype and research in general. There I reiterate the contributions of the thesis work and the conclusions drawn from its undertaking.
1.2.What is Visual Programming
Visual programming or visual programming languages are languages composed of tangible objects, that represent discrete logical or computational constructs. These are usually in the form of shapes or blocks, related with some textual description and a set of input and output ports. The most obvious relation is for each component to be some kind of function, which translates input data to output data. These discrete visual containers for computation are then strung together in a specific order to build logical programs. This is one visual metaphor that is common among visual programming languages. There are
�12
others as well. This thesis discusses the development of a new visual programming language called XYZ. It follows this described visual metaphor and builds on it.
One aim of visual programming is to make programming and computation more accessible to visual thinkers, reducing some of the friction in getting started. They are programming environments. In my mind, the other goal of visual programming is to push on the collective perception of what constitutes computation and the methods with which humans undertake it.
1.3.WHY
Visual programming tools are contentious, they aim to expose a difficult and complex, even esoteric activity, that requires rigorous study and immeasurable time to master, to a new audience. Many of these tools, to professional programmers, seem to be a limited shortcut, that are not capable of the full range of expression that textual programming provides and are seen only as learning or intermediary tools on the way to learning how to ‘actually program’. I find this limited box that visual programming languages are categorically placed in, to hold back new ways of approaching the act of computation. Visual programming is inherently attractive to people who think visually, but it should be attractive to anyone who programs and can see. Many of the core concepts in modern programming can be expressed visually. They have immediately accessible visual analogues. When a knowledgeable programmer imagines implementing a loop or an event, they can draw upon a mental visual representation. When they describe these concepts, they move their hands, they gesture, they draw.
The human brain is ideally trained to deal with the three-dimensional character of the outside world, and this on the comprehension level as well as on the level of three-dimensional direct manipulation. The mental image we have of a program and its application domain often has links to the existing 3D world. Representing the program in three dimensions supports this mental image more profoundly. (Reeth,Flerackers,1993)
�13

But, the critique of some visual programming languages is fair. Some are missing concepts that are standard and necessary for computing quickly, and I do not mean runtime, in common logical terms that non-mathematicians understand. Some are self limiting, for good reason, they do not strive to be a general purpose tool for all programming tasks, but to increase the expressiveness and effectiveness of select disciplines. While I think this in itself is a daunting task and impressive achievement, I believe it holds back the users who learn these tools. There are examples of visual programming languages that do not actually use the visual opportunities afforded to them to visualize the most important and confusing aspects of the computations their users perform. (Victor, 2012)
For example, a data flow based visual node diagram is extremely elegant for a non-iterative geometrical relationship. Changing input parameters to functions that return geometry flow downstream and modify the resulting shapes.
�1.3.1.A DATA FLOW GRAPH IN DYNAMO, THE PARAMETERS THAT DEFINE THE CONE,
HAVE FINAL CONTROL OVER THE UNFOLDED RESULT
But, if one desires to expose a looping structure into this model, visual consistency is lost, this fundamental computational concept of iteration cannot readily be expressed in these data-flow languages that have no notion of explicit execution order. Designers are usually
�14

unfamiliar with programming, and if a fundamental concept is difficult to express or read they may never tackle understanding or expressing it.
While designers are proficient with the two-dimensional or three dimensional model itself, most of them are not as comfortable with programming/scripting environments. Like other end-user programmers, they face a challenge when they move away from their domain and enter the computer programming space. Their goal is not to become professional programmers or to create the most efficient, reusable code, but to write code to support themselves in the task in hand (Maleki,Woodbury,2015)
To be fair, there are some data flow languages that include constructs that support iteration or looping with some mental gymnastics, and in other cases, iteration or the fundamental idea of execution order was intentionally left out all together as a conscious decision for the intended audience and the perception of their use case.
A disadvantage of this method is that a programmer is required to keep track of how sequencing of operations modifies the state of the program, which is not always an intended feature of the system (especially if it is designed to accommodate novices).(Boshernitsan,Downes, 2004).
If learning to program improves design indirectly, or improves design education then computation may be more formally, rigorously, and usefully introduced in mainstream design education. This is another aim for this work. In current design education, the visual language, Grasshopper(McNeel,Rutten) has become a common language for designers to share, learn through, and build complex artifacts, but also, for many design students, it is their first exposure to code, and reinforces a specific way of thinking about design and computation. The discipline should be cautious of ubiquitous tools, which can shape design thought and knowledge. Like higher level thought that occurs with spoken language while constructing a sentence, or quite subconscious thinking through a design problem our thoughts are constrained, at least to some degree by the grammar and constraints of the system we are working within. There is an effect on the discipline’s collective fundamental understanding of computation that is viewed through the lens of a handful of tools and their philosophical view, even if it is a well researched and currently effective one.
�15
Only anecdotally, I can relay that the use of visual programming in an architectural education setting when introduced to those students unfamiliar with computational thinking immediately introduces a new set of concepts which they must learn at the same time they are building the most foundational ones. It is for this reason that I believe that visual programming can be used to express ideas present in textual languages in a precise way that builds transferable skill where learning foundational ideas are directly applicable to the visual language and vice versa.
Another point I would like to make specifically about the use of visual programming tools in the architectural education setting is the unfortunate misuse of these tools. There are many incredibly generous users on the grasshopper discussion forums, stackoverflow.com, and github.com, all forums for sharing code and programing knowledge, who are willing to share their hard work and expertise for free. In some instances exact programs are used without any or minimal modification to produce what is effectively a copy of another’s work. The effect of this use is magnified when the output is actually a parametric geometry belonging to a family of topologies or a physical artifact in the end. I hypothesize that this behavior is due to a lack of knowledge and skill on the part of the borrower of code. The intention of sharing and downloading this code was originally to learn. But a lack of foundational knowledge has lead to its use without absorbing the core of its function and mechanics. Of course this issue will still exist within any world where there is sufficient complexity and insufficient time. A new tool will not fix this.
I believe that a rigorous introduction to computation is necessary for designers at this time. It is not beneficial to the design profession, computational designers, or students to present the entirety of computation through the lens of a few languages. If the argument for visual languages within the architectural context is to avoid issues of learning textual syntax, and decrease the learning curve and time needed to start creating programs, then they have been successful. It is very daunting to begin programming, especially when interacting with some other system like a geometry engine. The setup alone is one of the most time consuming, and in this respect, these languages that currently exist are instrumental in introducing programming as a possibility and design world, to rile the imagination and inspire.
�16

Another major success of languages within the architectural context and with some general visual languages is the transformation of writing code into the act of play. The very quick iteration time and the ability to quickly debug various states of the program visually, almost immediately, is a strong opportunity that can be pushed further. Indeed there is a vast amount of work on visual, and intelligent debugging tools. This is important for learning, but remains important for advanced developers, code always needs to be debugged and inspected, when the code is simple, debugging can be a teaching tool, and especially when it becomes complex, debugging is necessary as an analysis and parsing technique.
On the other hand, I believe a fundamental failing of some visual languages, especially those that are used so prevalently as an introduction to computation is the lack of building of transferable skills. It is important that a tool used for teaching like this presents varying ideas for computation and builds transferable skill as there is a large investment in time on the part of the student, and I do not believe that one should be forced to learn a textual language to avoid inefficiencies, and missing concepts in the visual languages. Even if the hypothesis that a hybrid visual language can be more powerful than a purely textual one is true, that does not necessitate that one will work with a specific tool forever, and as can be seen historically, there are few languages that have retained their user base or interoperability, and even less in the visual programming space (tiboe.com,2015). Some arguments that current tools do not build transferable skill or knowledge is laid out next.
Diction and consistency are important so that skills and concepts built in one language are transferable and can be cross referenced in some way. If a language uses very specific terms for operations that actually do exist in other languages, one has no way to learn about this fact without a-priori having knowledge of the other language. There is no immediately accessible rosetta stone for moving from one programming language to another, and this difficultly is increased when in the context of visual languages using different visual metaphors. Naming is an important way to take control and communicate a concept, especially abstract concepts with no easily spoken language mechanism to describe them, it is imperative that the same naming be used.
�17

For example Currying in Haskell and other functional languages. This term is used to denote a transformation of a function whose input is another function which is partially applied, it is named in reference to Haskell Curry. (Curry, 1958; Lipovača, 2011) This term cannot easily be described by its function, and so it takes on a shared name between many languages as an understood complex concept. So there must be a balance between description and accepted naming in programming languages, or at least a reference to the accepted naming in the field. (Victor 2012) It’s unclear if this same logic follows for visualizations or symbol selection for those same operations and concepts. This idea is important on multiple levels, for building transferable knowledge and taking control of concepts, but also for organizing thoughts, code documentation, and memories. As Marvin Minsky elaborates on in Society of the Mind,
the others are merely "middle-level managers." For example, the agent Get doesn't actually "get" anything; it only turns on Find and Grasp at the proper time. …To see how agents can operate without explicit messages, let's compare two ordinary language descriptions of how to put an apple into a pail. Our first script mentions each object explicitly in every line, the way one might speak to a novice.
Look for an apple. Move the arm and hand to the apple's location. Prepare the hand to grasp an apple-shaped object. Grasp the apple. Now look for the pail. Move the arm and hand to the pail's location. Release the hand’s grip on the apple.
Now let's rewrite this description in a style more typical of normal speech.Look for an apple. Move the arm and hand to its location. Prepare the hand to grasp an object of that shape. Grasp it. Now look for the pail. Move the arm and hand to its location. Release the hand’s grip .
This second script uses the words "apple" and "pail" only once. This is how we usually speak; once something has been mentioned, we normally don't use its name again. Instead, whenever possible,we replace a name by a pronoun word. In the next few sections I'll argue that it is not only in language that we replace things with pronoun like tokens;we also do this in many other forms of thought. It could scarcely be otherwise, because in order to make sense to us, our sentences must mirror the structures and methods we use for managing our memories.
�18
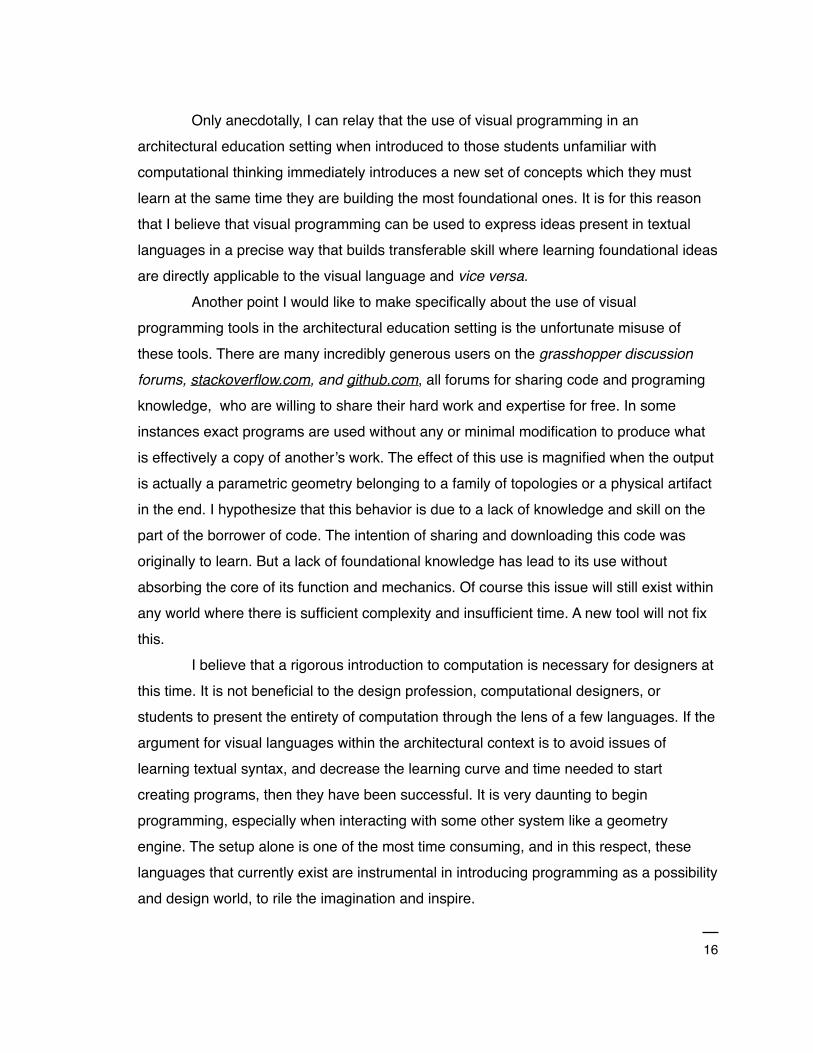
The visual aspect of visual programming immediately lets one make use of the tokenizing that Minksy describes by using our ability to quickly scan images and find repetition and patterns quickly. We can quickly find a repeated image, faster than a repeated text string and the context it appears in. We can also augment the visual experience, instead of referencing a word or image in multiple places which point to the same class or specific object we can draw tangible lines or pointers to that object and leave it unnamed, it becomes more difficult to describe or communicate this object to others, but simpler to keep in our memories and to trace relations visually.(Burnett et al., 1995)
�
1.3.2.ILLUSTRATING UNNAMED VARIABLES IN DATAFLOW GRAPH MAKING REPEATED REFERENCES TRIVIAL TO TRACE
1. number1 = 5 2. 3. number3 = sum(number1,number1) 4. 5. number4 = divide(number1,number3) 6. 7. number5 = multiply(number1,number3)
�19

Outside of the architectural context, we can examine a visual language like Scratch, which presents a greater variety of foundational computational ideas and presents them with specifically shaped, categorized, and colored visuals, and enables third-party extensibility, but the same kind of issue is found, a lack of users actually understanding what they are doing computationally,
From our interviews with and observations of young designers, it was evident that framing computational thinking solely around concepts insufficiently represented other elements of designers’ learning and participation. The next step in articulating our computational thinking framework was to describe the processes of construction, the design practices we saw kids engaging in while creating their projects. Computational practices focus on the process of thinking and learning, moving beyond what you are learning to how you are learning. (Brennan,Resnick,2012)
This is a powerful finding for teaching computation, not only to children. Learning concepts and their definitions is one part of a complete understanding of thinking computationally, but design practices and the ability to describe the actions you are taking to construct code and programs, takes practice. I believe that constructing code with visually unique components to build visually unique spaces will help to reinforce the computational mental models that the programmer is using. Being able to describe a location in a program like one in a building will help users to describe what they have done.
To reiterate, I argue that changing the collective perception of visual programming is of importance to changing the perception of computation in general by the disciplines of computer science and architecture. Presenting a visual language as a competing way to create fully capable code, not as a limited sandbox, while at the same time addressing the missed visual opportunities provided by these environments.
1.4.Fundamental Issues
I will reiterate and list the fundamental issues I believe exist in current visual programming systems that I will address in the course of this thesis and attempt to address with the software prototype.
�20

As a visual program scales up it begins to become cumbersome to interact with. A common interaction method is to zoom in and out to quickly move throughout 2d or 3d space, and to examine information at different detail levels. For example zooming to the minimum zoom level might provide information to the user about the largest structural components or the most commonly used functions, while zooming into the maximum detail level would give a user detail on one node and its inputs in detail. What currently exists in many languages when zooming out is a homogenous display graph which is ineffective for providing a higher level overview.
There are two traditional solutions: make the drawing smaller and look at the whole, or partition the drawing into pieces and look at each piece separately. While a smaller drawing preserves the context, the reduction may make the details unrecognizable. Partying a drawing yields the opposite effect… The challenge is to develop display techniques that provide detail and context. (Burnett et al., 1995)
I argue that using 3D visualizations will help to ameliorate this problem for a few reasons:
• 3d visualizations allow for simple visualizations that are still unique, and can appear unique from different perspectives.
• 3d visualizations can be be viewed from different perspectives to provide a multitude of possible spatial arrangements that will allow for a more efficient use of screen space.
• 3d visualizations based on components can easily have different scaling abilities that respond immediately to the distance and perspective of the camera viewpoint.
• spatial arrangement like a building, landscape, or series of spaces provides a hierarchical overview inherently that can be used for this type of higher level overview.
Visual languages make the library very accessible to new users, this one of their successes and providing a simple search ability or listing of main functionality that can be explored in a well documented way for users is fundamental in broadening the computational mental models they possess. In particular the languages ARK and Dynamo attempt to provide an extremely visual way of exploring the library of available functionality and the relationships between them. (Smith 1986 ;Autodesk 2015). I argue that using a combination of 3d visualizations, text, and type information can provide a rich and interactive library exploration process.
�21

Another issue to address is that in data flow languages time is absent, in many programming environments the state of an object throughout the computation changes, care must be taken to avoid unnecessary complexity in the mutation of state. Especially for those learning to program, but truly for any level programmer working in a stateful programming environment, exposing state over time is a powerful way to teach many computational mental models and illustrate what a computation is actually doing, as opposed to just its output.(Victor,2012)
There is a very strange contradiction that occurs in many visual programming languages when one attempts to visualize code. Functions are abstract and difficult to envision as objects, yet these are precisely the things we instantiate as nodes. My instinct is that this is both one of the main conceptual leaps that visual languages help users to make, and at the same time a fundamental confusion for them. What is more concrete is the visualization and instantiation of objects, in the object-oriented programming sense, as the Alternate Reality Toolkit and Unity3D do.
These objects have properties, so they have representations of some kind, and they have methods that they perform on an object level, which could be made accessible in a programming environment, this is roughly the model of ARK. Of course we want to compute in worlds where object oriented programming does not exist, we do not want to define an object every time we want to compute. This friction is one of the main impediments to learning and iterating quickly. Still, functions are strange, they are not objects, but now they are represented visually.
I think that one of the best metaphors for an object function, is a mechanism or machine with input and output. As a general plan for implementation, these inputs and outputs become the main focus of visualizations on nodes that return or modify data, while control flow nodes, which are not so rooted in functions will have their visualizations concentrated more on the node itself. Last is a balance between precision and magic.
While it is possible to design a system which uses no text whatsoever, and such systems have been created, the resulting programs are often very difficult to read and understand. Most VPLs, even those which are completely visual, use text, at the very least, to label variables and functions in programs. Thus designers must face the same problem as was addressed in ARK. They must attempt to balance consistency of visual representation with usability.
�22
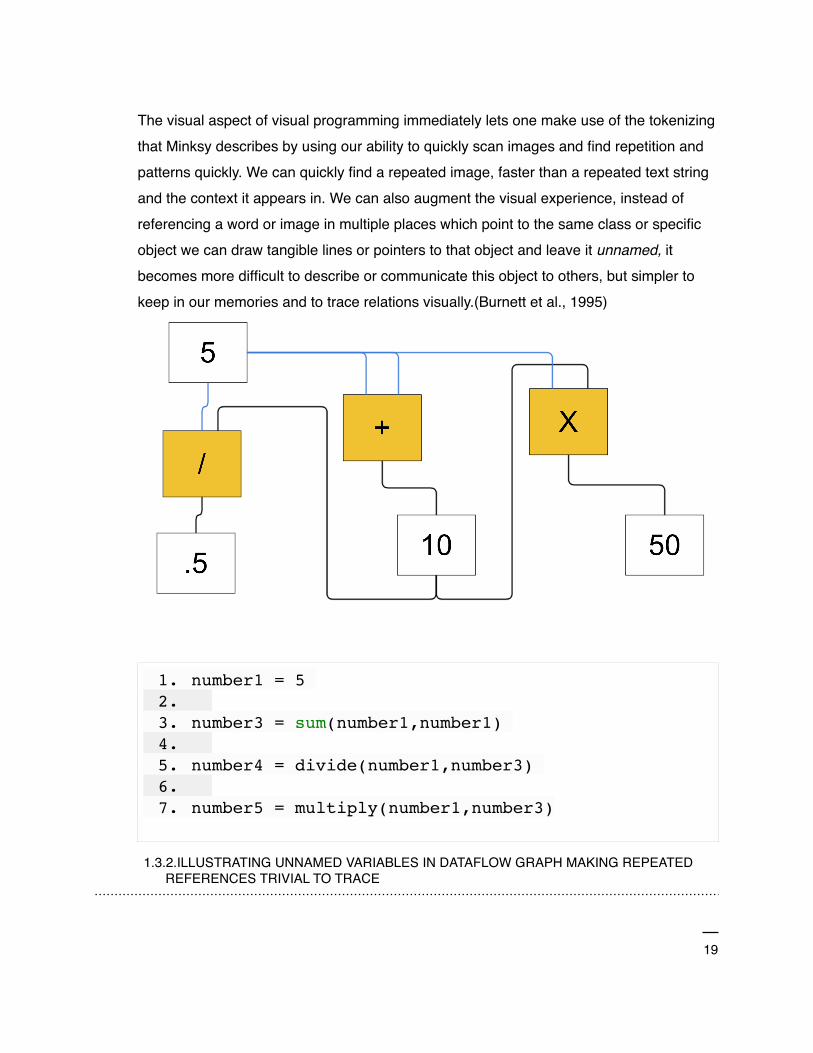
As an example, we can look at the implementation of the data tree type in Grasshopper. (Rutten 2015)
�1.4.1.DATA TREE ENABLED SELECTIONS (RUTTEN,2015)
This data structure is the heart of grasshopper’s ability to always deliver some output to the user, even if they have failed to give grasshopper a data structure that matches the function they are attempting to perform. This collection of ordered lists and grasshopper’s behavior when attempting to map a function over it puts geometry and data in front of the user very quickly. The iteration time is extremely fast, computation becomes playful. Though as a consequence the data tree and the path through the tree becomes very complex very quickly as the graph grows. Lost to the user is some of the precision and clarity of what exactly their code is doing at evert step. There is a hidden set of lacing and computations being performed to map the node’s functionality to the content of the data tree. There is a tradeoff in providing the programmer magic.
�23

1.5.Goals
My goals for this thesis include the production of a flexible visual language, with many entry points, for users of varying skill levels, as well as an editor utilizing that language to create visual programs that can be run and inspected. The language will utilize three dimensional visual programming where code is represented by nodes and geometrical objects in space. These can be freely moved and manipulated in all X,Y,Z dimensions to create memorable places that will reinforce in the memory of the programmer some image of the combination of nodes. The interactions available to the programmer and the node visualizations should be able to create landmarks to help remember and describe the function and flow of a piece of code. As such another goal of the language is to provide a mechanism for producing nodes that are visually unique from each other in some way besides their labels. Using 3 dimensions is helpful in this regard for both the varying combination of nodes in space, and subtle variations in node visualization, for example, by moving components of their individual visualizations in specific dimensions based on some parameter of the code or function they represent.
A large goal for this project is to enable workflows that rely on iteration, this means a capable representation of control flow programming. At the same time, visibility of the execution flow of a program is more important than the visualization of that programs output. Having stated this, it is clear that visualizing the actual flow of execution through a graph in realtime as it runs is important to satisfying the goals of the project and this aspect of the programming language. Achieving this goal required a large amount of implementation time, and it will be discussed in chapter 7 in detail.
A goal, related to that of visualizing execution flow, and in an attempt to make it more transparent and concrete of a concept, is to implement live coding. This is the ability to interact with a piece of code while it is executing. As described by Hils,
Tanimoto has described a four-level scale of liveness [18]. The first, ‘informative’ level uses the visual representation of the program for documentation or education about the program, but not for instructions to the computer. A flowchart for a FORTRAN program is at this level. The second, ‘informative and significant’ level uses the visual representation as the program. The representation resides on the computer and is executable. Once
�24
the user has entered the program into the computer, he or she may tell the computer to execute it. PICT [19] is a system at this level. The third, ‘informative, significant and responsive’ level includes systems that execute automatically whenever the user edits the program or its input data. The user does not have to give an ‘Execute’ command. HI-VISUAL [ZO] is at the third level. The fourth level is ‘informative, significant, responsive and live’. A system at this level continually updates the display to show the results of processing data. VIVA [18] is a system at the fourth level.
The software prototype designed in this thesis combines aspects of level 2 and level 3/4 liveness, code can be executed on command, but can also be interacted with while executing.
To aid the programmer in building and organizing code and space in 3 dimensions I aim to provide a set of semi automatic layout algorithms. These help the user to organize nodes in relation to each other spatially, and remove some of the friction and work in positioning objects in 3D space, which can be a complicated visual task. These layout algorithms will also aim to provide structural cues about the program spatially and visually to the user by altering visual parameters such as, node size, colored branches, relative distance, and nesting. At the same time helping to automatically construct recognizable landmarks.
I aim to provide visualization not only of program code but also of output data and the results of each evaluation on a node based granularity level. A final goal, and one of the main reasons for implementation of visualizations using 3 dimensions is to avoid context switching and to make efficient use of screen space real estate by using 3d space to present more items on screen at once, while maintaining their independence using visualization techniques such as color, perspective, altering translucency, and scale. (Burnett et al., 1995)
�25

2. Visual Programming: A Brief Survey
2.1.Visual Programming Components
As there are many visual programming languages, using varying visual metaphors for many different user domains, the components and diction used between them obfuscates the underlying relation between components in languages. I will attempt to discuss these components in as general computational terms as possible and refer to them when discussing a specific language. Sometimes this is an impossible task as the rich variety of visual languages provides unique opportunities for languages that approach computation and program generation from completely different perspectives.
Throughout this discussion I will refer to this theory of visual programming laid out by Boshernitsan and Downes, which is in turn, built upon the definitions below, put forth by S.-K. Chang on icon theory, and in some places extend these definitions, where I do so, I will state it explicitly.
• icon (generalized icon) : An object with the dual representation of a logical part (the meaning) and a physical part (the image).
• iconic system: A structured set of related icons. • iconic sentence (visual sentence): spatial arrangement of icons from iconic
system. • visual language A set of iconic sentences constructed with given syntax and
semantics. • syntactic analysis (spatial parsing): An analysis of an iconic sentence to
determine the underlying structure. • semantic analysis (spatial interpretation): An analysis of an iconic sentence to
determine the underlying meaning. (Boshernitsan,Downes, 2004)
�26

�2.1.1.NODE
Node / IconAs many visual programming languages are graph based, the node is a logical
unit that represents some block of abstraction. In some languages the node represents a function only. The node may also represent an object, which is a set of functions and data, which are bound together. An icon or node in the visual program may be a process icon or object icon and represent either some computation or some generated object. An object being an abstract binding of possible computations and data.
In formalizing visual programming languages, it is customary to distinguish process icons from object icons. The former express computations; the latter can be further subdivided into elementary object icons and composite object icons. The elementary object icons identify primitive objects in the language, whereas the composite object icons identify objects formed by a spatial arrangement of the elementary object icons.(Boshernitsan,Downes, 2004)
Port / PinA port or pin exists on a node, and can be further classified into types of input or
output ports. Ports define the input variables that a node needs to fully compute its result. Output ports define the output values that a node will produce upon its execution. In
�27
some functional languages not all input ports need be filled to produce an output value, this is called partial function application, and the output of such a procedure is another function with a smaller number of input ports. In the language described in this thesis, there are also input and output ports that simply define execution pointers, or where the control flow of the program leads. They must be filled for the program to continue execution.Edge / Wire /Arc
Again, logically following from the graph analogy, the edges between nodes represent relationships between them. Usually these wires represent a substitution procedure. For example, substituting or assigning a value to some variable in a function. x = 5 , f(5), can be represented in a data flow language by connecting something representing 5 to x on the node representing f. In other languages, such as the one described in this thesis, these wires can represent an explicit topological ordering. For example, the small program:
1. x=5 , 2. 2. f(x) explicitly defines x to be 5, before calling the function f. This can be represented visually by pointing an edge from x=5 to f(x).
In some languages these edges may represent some constraint between values or more complex geometrical or algebraic constraints between objects.Library
The library is the listing of functionality and computational procedures that are either built into the language as primitives, have been constructed by the user and added to this repository, or have been somehow imported from another source to reuse in other programs. The idea of a library is directly related to that of procedural abstraction, a foundational concept in computation and logical thought in general. Some languages make a distinction between functions or nodes stored in the library and core language features that manipulate flow inside the program. Others consider all of these nodes, and store them in the library together. The library and access to it is an important concept in
�28

visual languages as in most visual programming environments a user cannot type directly into the program space.
2.2. Classification of Visual Languages
Building on the visual language classes described by (Boshernitsan,Downes,
2004) I have decided on the following classifications of visual languages. These classifications are not mutually exclusive, and are not a definitive list.
• Data Flow Languages : These languages do not usually expose the concept of execution order or control flow to the user, instead the entire program can be thought of as a single large expression that is evaluated as needed. Nodes execute when their inputs have been executed. They lend themselves to a functional programming style.
• SpreadSheet or Form Based Languages : These languages use the idea of a cell or spreadsheet of 2D tabular data to build up composite objects. Applications like Microsoft Excel or Apple Numbers, might fit partially into this classification. More powerful general programming languages that use this technique allow nesting of different groupings of 2D data into complex abstractions that carry data around with them.
• Purely Visual Languages : These languages attempt to avoid any textual output or input where possible instead relying on visualizations for almost all precision and communication of program function.
• Hybrid Text/Visual Languages : These languages combine both textual input/output and visual representation. Many of these languages also allow input from other textual languages. For instance both Autodesk’s Dynamo and McNeel’s Grasshopper both allow for building of nodes within c# and python textual programming languages. These are arguably the most powerful classification of languages and have greater appeal to larger groups of user types.
• Explicit Execution Languages (Control Flow) : These languages either have some mechanism for explicitly ordering the execution of nodes or expose it as a central visual concept like data flow in data flow languages. This is the analog of constructs like line
�29

numbers, function calls, goto statements, and loops in a text based language. The language described in this thesis is an explicit execution language, it is necessary for the user to understand the concept of sequential execution to use this language.
• Constraint Languages : These languages allow the creation of constraints of various types between objects in the language. Ivan Sutherland’s PhD Sketchpad CAD drawing tool is one of these languages. The user was able to create constraints between various geometrical entities. Constraints in other languages might not relate directly to objects in the world, but the output value of nodes for instance.
• By Example Languages : These languages allow the user to interact with a set of objects and possible interaction methods to ‘teach’ a system about a program that should be generated. Pygmalion, Apple Automator, and Photoshop Actions are all examples of this kind of programming environment.
Further I will examine a set of languages under two classifications, academic languages and popular commercial / open-source tools that have or at one time, had large active user-bases. I will where applicable discuss the particular visual programming language’s features as inspiration or contrast them with the tool, XYZ, developed during this thesis.
2.3.Academic
• SketchPad : Ivan Sutherland’s SketchPad (Sutherland, 1963) is one of first computer aided design environments for drawing and design, but can also can be considered a type of visual programming environment. It allows the user to construct objects from primitives, lines from points, and shapes from sets of lines with user defined geometrical constraints between them. Sets of Shapes are formed by the constraints between individual shapes, all while satisfying the chain of constraints down to the most primitive level. This constraint building and object construction is a form of programming. This type of CAD is still used today in systems like Revit, Inventor, and Solidworks, etc, where geometrical constraints are built between families of self constrained geometrical objects. The ‘family’ is an abstract object which has some
�30
behaviors which are controlled by interacting with a small parameter space on the type or on the instance context of the family. It’s clear that Sketchpad also contributed to the idea of the object.
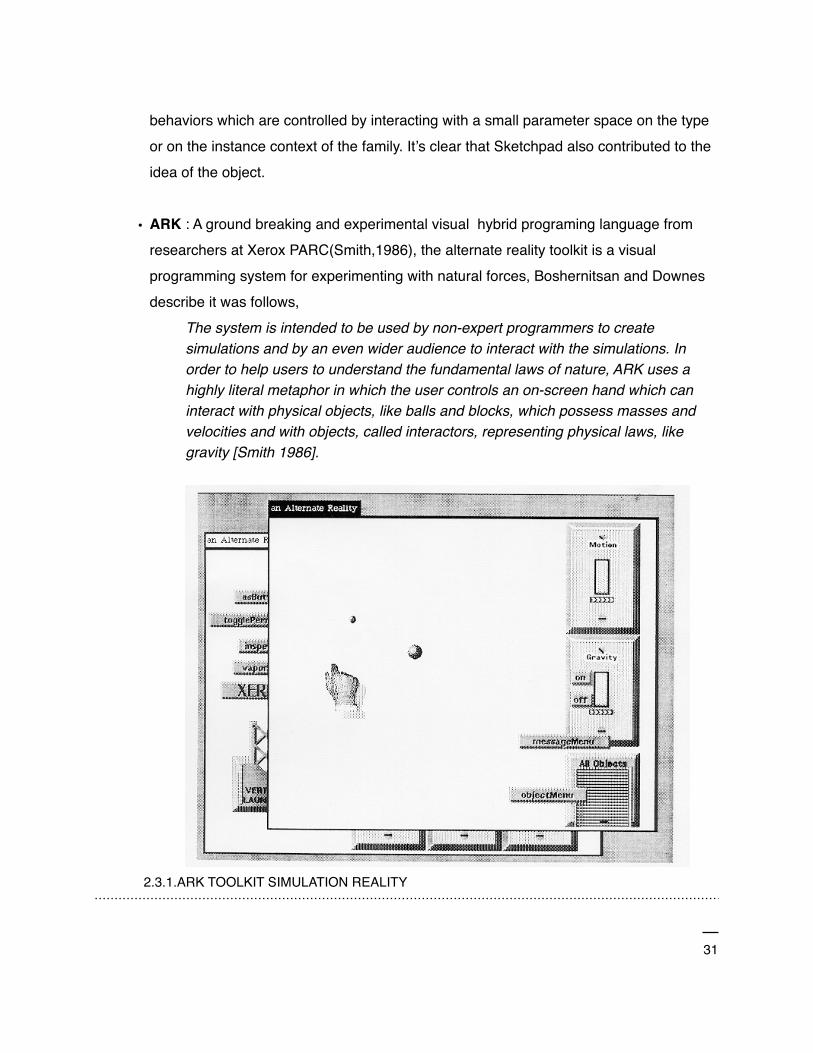
• ARK : A ground breaking and experimental visual hybrid programing language from researchers at Xerox PARC(Smith,1986), the alternate reality toolkit is a visual programming system for experimenting with natural forces, Boshernitsan and Downes describe it was follows,
The system is intended to be used by non-expert programmers to create simulations and by an even wider audience to interact with the simulations. In order to help users to understand the fundamental laws of nature, ARK uses a highly literal metaphor in which the user controls an on-screen hand which can interact with physical objects, like balls and blocks, which possess masses and velocities and with objects, called interactors, representing physical laws, like gravity [Smith 1986].
�2.3.1.ARK TOOLKIT SIMULATION REALITY
�31

ARK is very interesting in a few respects, first it allows building a simulation by non-programmers for non-programmers to explore and learn through. It enables inspection and interaction with any object types, even those not implemented by the authors, this is a common feature that future visual programming languages leverage to enable greater interoperability with textual programming languages. This immediately creates a metaphor between the physical builtin objects that ARK supports visualizations for, and the abstract object type that we talk about when in the context of object-oriented programming.
It is important to note that all of the objects in the underlying Smalltalk environment are available to the ARK programmer. Objects which are not ARK-specific appear as representative objects, like the TwoVector object in Figure 3. As shown in the figure, such Smalltalk objects can be linked with ARK objects in the same way as native objects. The example shown involves using a TwoVector object as the input to a button which sets the velocity of a disk.
This language also uses multiple “reality” windows to draw a distinction of what code is currently being run, and what possible objects exist to use in the program. This illustrates an implementation of a node or code library in a quite elegant way, using a parallel structure between interaction windows and library exploration windows. This idea is interesting for library exploration and experimentation. This might reduce context switching between multiple types of interaction, for instance between a textual representation of a node and its visualization, and make use of visual memory for function types and location.
• VIPR : Visual Imperative Programming is an object oriented language that is almost entirely visual, it visualizes program flow as a series of object states, and substitutions. In figure 2.2 you can see that by a series of substitutions flowing over the directed edges that the object transitions from state 0 to state 3.
�32

��� 2.3.2. VIPR EXECUTION OVER TIME
In the figure below you can see the substitution and state model extended from objects to functions. The small circles tangent to the outer states represent parameters, and the directed edge represents the result of calling the function. While these diagrams of program state are clear and interesting to study, they quickly become quite overwhelming and complex programs require extended effort not only in parsing, but in visually isolating import sections with which the user needs to concentrate on to make a change. The representation of object as a set of states is quite novel though, but remains in the realm of abstraction and while this interpretation might be closer to the theory of objects, tokens, and types, and makes clear the fundamental difficulties present in object-oriented programming, it is necessarily intuitive for a new programmer. Another issue is that the actual visualization types become homogenous in large programs, a common issue for many visual programming languages.
�33

��� 2.3.3. VIPR FUNCTION CALL
• Form3 : Form3 is a language that borrows from the world of spreadsheets and tabular data visualization.
Forms/3 borrows the spreadsheet metaphor of cells and formulas to represent data and computation respectively. A particular features of Forms/3 is that cells may be organized into a group called form, a basic data abstraction mechanism. A form may be given pictorial representation (an icon) and it may be instantiated into an object. In a sense, a form corresponds to a prototype object in prototype-based object oriented languages. (Boshernitsan,Downes, 2004).
This language uses a declarative style where all interactions between objects are in the
form of formulas that produce new objects. These cells and formulas can be nested into forms and executed, this procedural abstraction is similar to a function or custom node in other languages. The most interesting aspect of Form3 is the “vectors in time” visualization of execution.
�34

Form/3 implements a declarative approach to flow control combined with the time dimension in an approach that the authors call “vectors in time”. With this approach, each vector defines a sequence of objects that represent the value of that cell at different points in time (Boshernitsan,Downes, 2004).
��� 2.3.4.FORM 3 ‘VECTORS IN TIME’ SHOWING EXECUTION VALUES OF FUNCTION
This kind of time based visualization has been implemented and partially extended in XYZ, it will be discussed more in chapter 3. I believe this visualization, which makes use of the third dimension, is provocative of the type of rich information that can be illustrated in a visual language. It can be used to communicate the character and structure of a program. There is a wealth of usefulness in being able to inspect the results of a computation over time, as well as immediately seeing where the bulk of computation is
�35

occurring. In addition to these points, the program might take on a specific visual structure because of the program execution, and the output values at points in time. One can imagine that a specific value might be “good” and another “bad”, a user can quickly visually inspect the set of values for this good or bad state, perhaps explicitly making the visualizations very different from each other.
• Cube: A 3D visual programming language that displays functions as a series of nested cubes and planes. This language is functional, higher order, meaning it supports partial function application and the passing of functions as data, it is statically typed. It supports recursion and handles conditionality with the concept of unification.
If the input value i is not 0, and thus does not unify with the value 0 inside the lower left holder, the lower plane fails, otherwise, the unification succeeds, and, as there are no other conditions to satisfy, the value 1 inside the lower right holder cube will "flow" to the output port (be unified with it), and thus will be returned as a result. (Najork,Kaplan,1991)
The factorial function illustrated below has an input port on the left, and output port on the right, the main computation of the function and where the recursion takes place is on the upper plane, the bottom plane as explained in the cited text, is a base case of the recursion.
�36

���2.3.5.CUBE RECURSIVE FACTORIAL OF N PROGRAM
Cube also features a type inference system so it can use static typing of inputs and outputs. This enables Cube to avoid runtime type mismatch errors, Cube uses the Hindley Milner Type Inference Algorithm “Among HM's more notable properties is completeness and its ability to deduce the most general type of a given program without the need of any type annotations or other hints supplied by the programmer.”(Wikipedia,2015) To a user this is important for a few reasons:
• the user does not have to define types explicitly as the algorithm will attempt to recognize compatible types.
• having type information can avoid syntactic errors.
• exposing types into the UI means they can be visualized specifically
• using compatible type information a language can implement a type of autocomplete - which suggests possible computations that a user might want to perform on a specific type, this is extremely helpful for new programmers, or even experienced programmers exploring a library of code.
�37

�2.3.6.CUBE TYPE VISUALIZATIONS
The 3 dimensional aspect of this programming language allows illustrating complex programs and functions as nested wireframe cubes. Viewing more than one function at a time can become visually overwhelming. It’s unclear from the description and images by Najork and Kaplan, but one can imagine that using differing translucency and occlusion techniques could help to reduce the visual complexity to the main interest of the user. I will explore a similar idea in chapter 3. and 7. regarding procedural abstraction, nesting, and limiting visual complexity.
• Scratch(Resnick, MIT Life Long Kindergarten Group), BeetleBlocks(Duks Koschitz and Eric Rosenbaum) Scratch is a visual programming language primarily intended for children and other non-experts. It uses many visual metaphors to communicate programming concepts: color and shape are used to classify program expressions and variables from control flow operators and functions.
�38
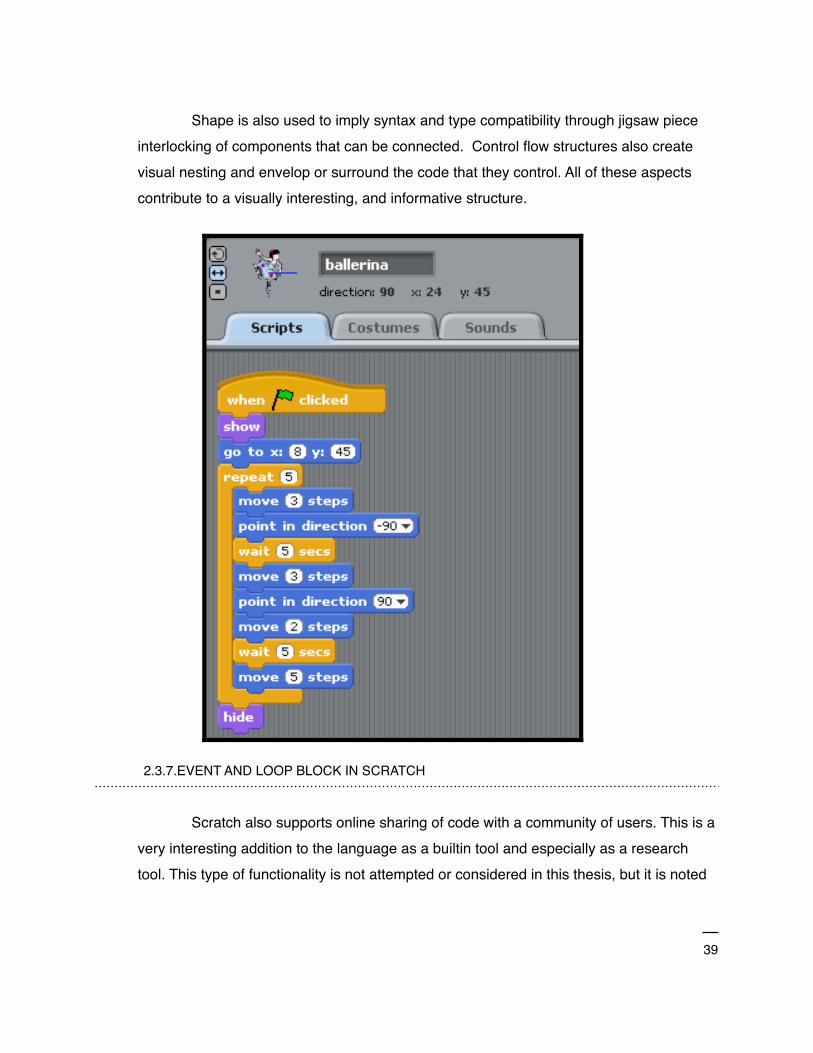
Shape is also used to imply syntax and type compatibility through jigsaw piece interlocking of components that can be connected. Control flow structures also create visual nesting and envelop or surround the code that they control. All of these aspects contribute to a visually interesting, and informative structure.
�2.3.7.EVENT AND LOOP BLOCK IN SCRATCH
Scratch also supports online sharing of code with a community of users. This is a very interesting addition to the language as a builtin tool and especially as a research tool. This type of functionality is not attempted or considered in this thesis, but it is noted
�39

that the Scratch team has leveraged this functionality to provide a learning resource to users while using the service as a data collection / research tool.
As illustrated in the figure above programming in Scratch necessitates understanding control flow and sequential execution as a core concept. It also exposes variables and enables explicitly setting their values. As explained by Koshitz and Rosenbaum, the explicit execution model present in Scratch helps users to understand what their code is actually doing and not just what the final output is. This idea, that about computation is better understood when inspecting function and sequence rather than a single output, is used in XYZ, and is a core principle of the design methodology used when making design decisions during this thesis.
In data flow languages, by contrast, all parts of a program may be executing simultaneously. Data flows from one component to another. Control flow languages are typically represented as lists of instructions; data flow languages are typically represented as nodes connected by lines. Data flow is a popular paradigm for graphical languages because its topological structure is naturally represented as a graph. Beetle Blocks uses a control flow execution model, because our emphasis is on
making programming understandable. The control flow representation allows Beetle Blocks to show the execution of a program explicitly, making it easier for users to see what the program is doing. (Duks Koschitz and Eric Rosenbaum,2012)
2.4.Popular
• Dynamo(Autodesk,Ian Keough) is a functional visual programming language built on the Autodesk design script language running on .net. It’s a hybrid textual visual language that does not visually support control flow, but is data flow based and as such relies on functional constructs to perform iteration in most instances. The language is largely built around interoperability with a geometry kernel and another Autodesk tool, Revit, which is a building information modeling tool. As such, the main focus of the programs built with Dynamo is with to build parametric geometrical artifacts or to inspect and organize Revit building information models. There are many use cases for
�40
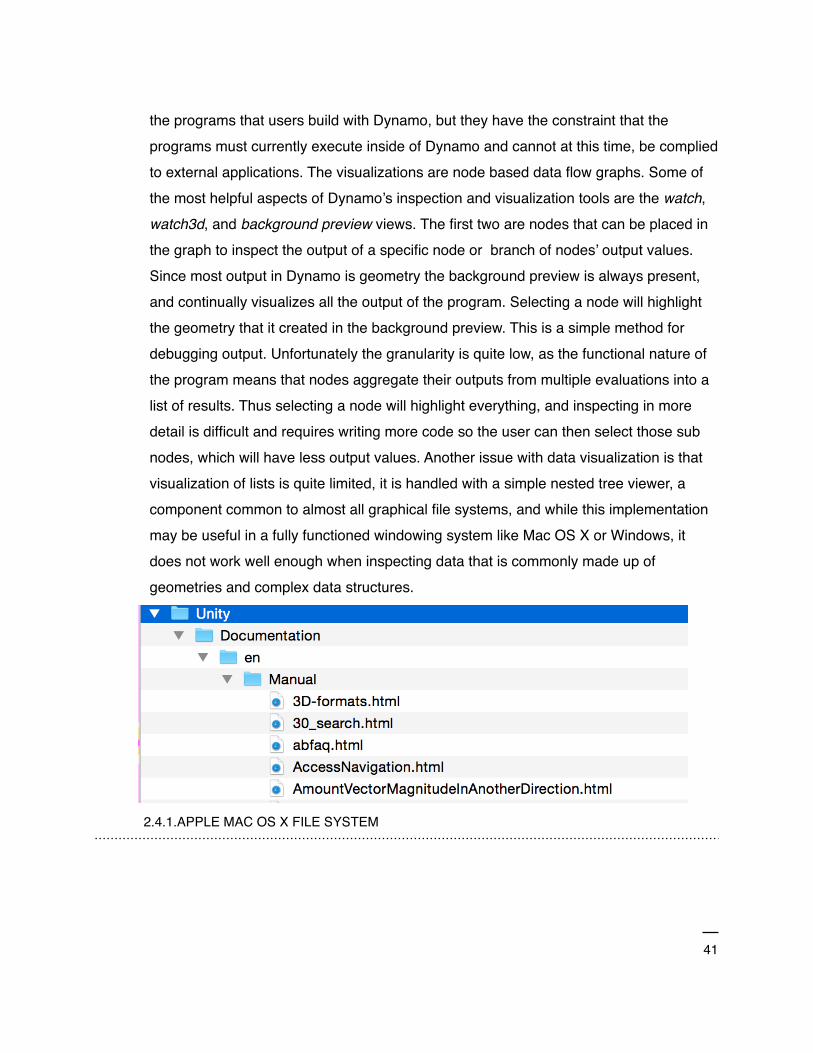
the programs that users build with Dynamo, but they have the constraint that the programs must currently execute inside of Dynamo and cannot at this time, be complied to external applications. The visualizations are node based data flow graphs. Some of the most helpful aspects of Dynamo’s inspection and visualization tools are the watch, watch3d, and background preview views. The first two are nodes that can be placed in the graph to inspect the output of a specific node or branch of nodes’ output values. Since most output in Dynamo is geometry the background preview is always present, and continually visualizes all the output of the program. Selecting a node will highlight the geometry that it created in the background preview. This is a simple method for debugging output. Unfortunately the granularity is quite low, as the functional nature of the program means that nodes aggregate their outputs from multiple evaluations into a list of results. Thus selecting a node will highlight everything, and inspecting in more detail is difficult and requires writing more code so the user can then select those sub nodes, which will have less output values. Another issue with data visualization is that visualization of lists is quite limited, it is handled with a simple nested tree viewer, a component common to almost all graphical file systems, and while this implementation may be useful in a fully functioned windowing system like Mac OS X or Windows, it does not work well enough when inspecting data that is commonly made up of geometries and complex data structures.
�2.4.1.APPLE MAC OS X FILE SYSTEM
�41

I have worked with the Dynamo team at Autodesk as an intern and software engineer for some time. It has been my experience that while the necessity to use functional constructs like, currying, partial function application, mapping, and aggregation is immediately confusing to new users, and even to users versed in visual programming languages, it does provide a very effective introduction to these complex computational ideas. Some of them are not totally necessary for programming, especially merely for getting work done in some limited task. But, importantly, they define a different way of thinking. The power of the hybrid textual visual tool comes from the various entry points that Dynamo enables, so that users of different skill levels can use the tool to be productive at their own paces.
• Grasshopper : (McNeel) Grasshopper is a visual programming plugin for the Rhinoceros surface modeling package. Its primary focus is to provide a visual interface to the large Rhino geometry library. It also provides many builtin tools for list and jagged nested list manipulations. Like Dynamo, it performs in a somewhat functional way, most nodes return new data structures so mutation is not possible, and a user can access all possible transformation states of data. This also lets a user inspect the results from one node to the next to understand what transformation that node has performed.
This language has a large community and numerous extensions. Time is handled by simply executing the graph at some specified interval. While most functional languages support recursion, Grasshopper does not. Grasshopper handles iteration in a semi-automatic way, by attempting to find an appropriate set of data types for any function in the argument that is handed to that function. It will automatically attempt to call a node multiple times over a list of inputs if those inputs can be passed to the function. This is a form of the map procedure or auto mapping in functional languages.
• Universe (NeoPax,2010) is a visual programming language that exists as a plugin for Unity3d and is situated as an extension of the Unity3d game engine, primarily it is used for building games. It ties into unity quite completely and attempts to offer all of Unity’s core features through visual code. The structure of visual code between XYZ (this software developed in this thesis) and universe is quite similar. They both use graph
�42

with two main types of edges, control and data flow edges. Universe also supports variables, introducing stateful code, and iteration. It is a 2d visual language and suffers from some as the same issues as other graph based visual programming languages: As the program graph scales up, it’s homogenous visualization becomes a hinderance as nodes appear very similar and are all roughly the same size. Universe attempts to rectify this with procedural abstraction and a small mini-map.
The most successful aspect of universe is the ability to use universe graphs as components on objects in Unity3d. The component model of object oriented programming is sometimes more intuitive than an inheritance based one. Components can be summarized as abilities that are added to objects. They enable the object to have multiple behaviors that all operate on the object. One of these components acting on some object can be defined by a universe program, another might be a regular textual program, this model is quite powerful and elegant. What is especially beautiful is the coexistence of visual and textual code both existing on the same level in a complex system. This also helps to keep graphs small as entire programs are not defined there, but components that define a specific behavior at the object level.
• Playmaker FSM(Hutang Games,2010) is another plugin for unity3d with a large and active community. While this tool does not have general computational abilities and raw expressive power as some of the other languages, its documentation and ease of use have grown its rate of adoption. The tool is a simple visual finite state machine presented in a graph. States are nodes and can have any arbitrary code in them that executes when the state is active. This code is referred to as an action. The state also has a series of input and output triggers, these triggers show the possible transitions that are possible from state to state. Certain actions fire specific state transitions and then the graph begins executing whatever code is in the next state that the graph has transitioned to.
Finite State Machines are very applicable to game design, and other areas of interactive applications, but are quite poor analogues for all computation. In the context of unity3d, this tool has selected an appropriate model to illustrate computation and its large user base exemplifies this.
�43
3. Introduction To XYZ (software prototype)I have developed a new prototype visual programming language, I have named
this software XYZ, the source code can be found online at https://github.com/holyjewsus/XYZ-Visual-Programming.
3.1.Design Principles
The following is a list of design principles that I have tried to adhere to when making design decisions during the development of XYZ.
• Everything can be used to compute, and everything is code.
• Object Oriented, physical objects in space.
• Clarity and visibility over speed.
• Visibility over clarity.
• Unique visualizations where possible to make use of the memory palace or loci method(Yates,1966)
• Make dangerous code clear (variables, side effects, mutations)
• Use the opportunities that 3d space affords(Color, scale, translucency, distance, rotation, perspective, multiple views, animation, placement(auto-layout in 3 dimensions))
• What code does, how it works, is more important than what it makes.
3.2.Software Overview
The prototype software that has been developed as the main deliverable of this thesis is currently named XYZ, to reflect its 3 dimensional nature as one of its most unique aspects.The software is an open source visual programming language which is publicly hosted on Github.com. It has been developed on top of Microsoft .NET(Mono
�44
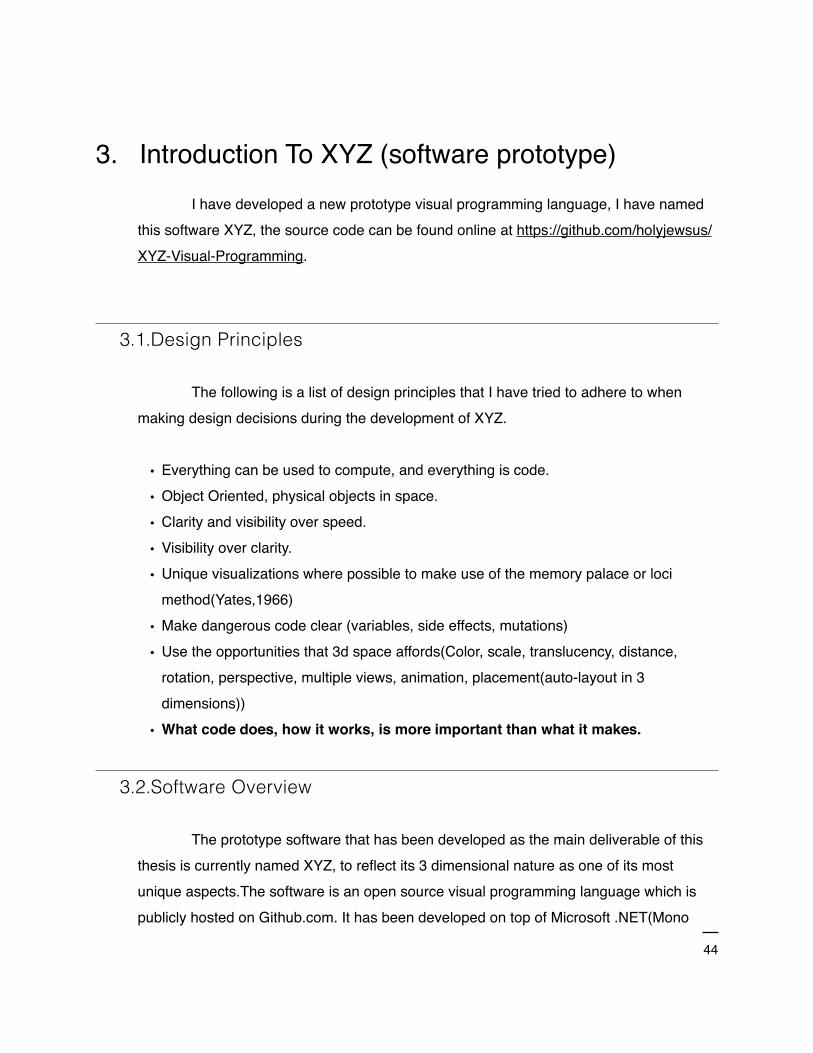
Project) inside of the Unity3d GameEngine. It can be classified as a hybrid visual/textual, explicit execution language that requires an understanding of the concept of control flow. That is, that there exists a explicit sequence of computations that will take place in the, and the output state of a node can be evaluated deterministically. The simplest lesson to learn in XYZ is that both execution flow and data flow are required for a program to function.
�3.2.1.XYZ EXECUTION AND DATA CONNECTORS CREATING A NUMBER AND A CUBE
It visualizes blocks of code and control flow blocks as 3 dimensional objects with unique hierarchical / class inheritance based visualizations. This means that nodes that share common functionality look like each other and as their functionality becomes more specific so too does their visualization. It has two types of wires or arcs, data connectors(orange) and execution connectors(magenta). There are further sub-classifications of data connectors which I will describe later with examples.
�45
�
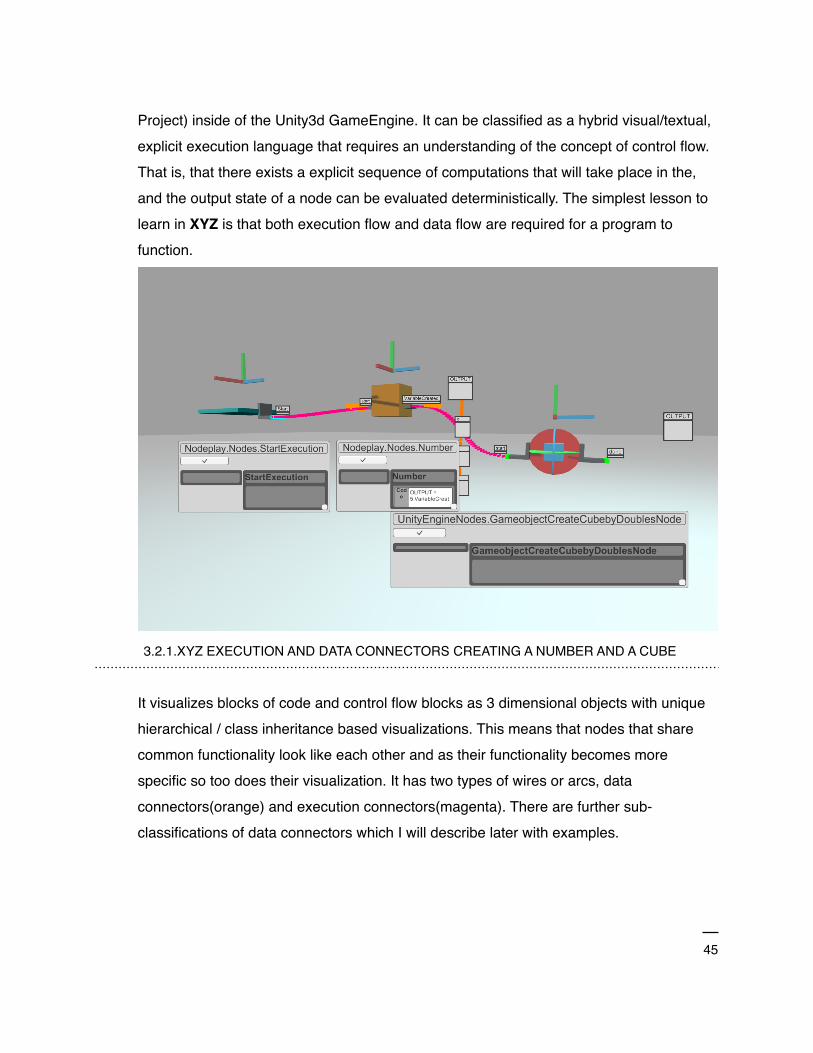
3.2.2.XYZ 3 NESTED LOOPS PROGRAM TO CREATE CUBES IN SPACE
For a user to build a program that executes they must connect control flow connectors from node to node in the order they wish them to execute. This is the analog of placing code on a new line in a textual language or nesting it within a function call to another function. This decision was made to support workflows that rely on iteration. Data connectors are like wires or arcs in a data flow language, they carry the outputs of previous computation downstream to other functions as input parameters. I will define the program space as the space in the world that contains the source code, nodes, and connectors. The execution space, on the other hand is the space that contains the results of computations, the geometrical or otherwise graphical and non graphical(text,lists,numbers) output from those computations.
�46

�
3.2.3.XYZ AFTER EVALUATION
In XYZ, program space and the execution space are shared as can be seen in the figure above. If a computation creates a geometrical or visualizable output then it will located in the same space as the code itself. As can be seen above, the output of the graph has been a series of cubes placed in a 3D grid of x,y,z coordinates arranged into one larger cube.
�47

� 3.2.4.XYZ EXECUTION RESULTS FOR THE CUBE NODE
To the right you can see many small visualizations that have been generated in the space somewhere between the execution and program space next to a node, these visualizations are the output values of a node each time it was executed during the entire execution of a program. Since this node was nested inside three loops we see that it has many executions and we can now inspect each one of these results.
Each result is a single cube that was placed at a specific x,y,z location. Each of these execution results can be further inspected for its exact properties. This is XYZ’s debugger and inspector capability, which directly contributes to the visualization of the program in space after execution. I believe this inspection and debugging capability is needed for first time programmers learning about computation, but can also be used to understand complex computations at a glance from far away, and can be used more precisely when needed by adjusting camera position and zoom to explore specific node outputs at a specific time. It also updates in realtime as the code executes to make obvious what code is executing and what the results are.
�48

One of the interesting tradeoffs between a data and control flow visual language is the ease with which a data flow language can expose computation results. Since these languages usually use functional constructs like Map and Reduce and the API’s of these languages almost always enforce immutability, or try to, by returning new objects, new geometry, new lists etc.
With this approach, one only needs to worry what computations are performed, and not how the actual operations are carried out. Explicit state modification is avoided by using single assignment: a programmer creates a new object by copying an existing one and specifying the desired differences, rather than modifying the existent object’s state. Also, instead of specifying a sequence of state changes, the programmer defines operations by specifying object dependencies. (Boshernitsan,Downes, 2004)
These functional constructs usually aggregate the results of all their computations and return a list containing all of them, in this way we can see the flow of data from one node to another, and to see how many times a node was executed we must look at the output from that node. This type of visualization puts more emphasis on the output of a piece of code rather than the data transformations at each step.
The last important illustration in these figures that needs to be addressed is the blue, semi-transparent nested spaces that surround branches of code. These zones appear automatically downstream from certain control flow nodes and define a branch of logic that will execute together. A list of these is kept as a way to quickly navigate the program, this can be visualized as a 2d map or list of all branches. The idea of quickly navigating through programs by sub routines, functions, classes, etc. is a common practice in Integrated development environments, such as MonoDevelop and Visual Studio, but this idea is also present in the space of 3d modeling tools and video games where navigating in 3d space is precisely the goal. In CAEL3D, the authors propose a similar user generated list of routines, which are also conceptualized as rooms or spaces, this is a powerful metaphor for relating navigation of code to space and relates to one of the main goals of the thesis, which is to build memorable landmarks in program space. I believe using automatically generated navigation lists or maps from the resulting
�49

branching that occurs when using a control flow is a viable way to create visual landmarks within the program space.
In order to avoid getting lost somewhere in the 3D space (as can happen in the real world also), CAEL3D can index underlying structures to find (and hence navigate to) the place a user might want to go to. Browsing strategies - e.g. browsing through a list of all the routines in the program - support this process heavily. Moreover,visual clues taking the form of 3D comments can be utilized for marking certain points in space, e.g., while numerously going back and forth between various routines in the program. (Reeth,Flerackers,1993)
XYZ has built-in primitive nodes for control flow and list manipulation. It also supports creating, setting, and getting the values of variables. To extend the language quickly XYZ supports multiple ways of adding new nodes to the library:
• building nodes in c# with a simple syntax
• writing python code directly into a node window while using the tool in realtime.
• importing precompiled .Net code (some of the builtin nodes are written this way) this methodology is based on zero touch import as implemented in Dynamo(Autodesk,2014)
• procedural abstraction or nesting a visual program within one node. This is analogous to defining a function in a textual language, the custom nodes of Dynamo or the nesting in Cube. This is an act of substitution, a single node is substituted for an entire graph at execution time.
3.3.Basic Visualization Features
To summarize the features that were outlined in the last section, XYZ features the following types of visualizations of the code produced using the language.
• Combination of data flow and control flow Languages
• Creating spatial zones that define branches of logic that execute together as as simple way of creating space and navigating the graph.
• Connecting execution results with instantiated objects in the same space, and vice versa.
• Inspecting data with inspector node and evaluation results.
�50

• Similar to ARK, interacting with created objects, when an object is visualized we can interact with it and find out what methods it holds, this is a very literal and visual metaphor for explaining object oriented programming and it’s extremely spatial. Blending code and output together. Unity3d itself uses a metaphor exactly like this by using a component model of programming.
• Nodes are visualized based on their class by loading a set of visualizations and aggregating them together.
• Types are visualized on the ports of nodes. For now this is only implemented in a limited way, but will be expanded upon.
• Nodes change size based on their dependence, this simply means that a node whose output values are used more often by other nodes grows in physical size to illustrate its importance at a glance.
• Labels and text in some instances rotate to always face the camera, in others where the amount of text is unknown, and could be very large, it exists in the YZ plane, perpendicular to the normal direction of data and control flow, thus it can be seen with a switch of camera viewpoint and occluded when not desired.
3.4.The User Interface
A basic node with no explicit visualization might look like the figure below. Each data input and output is visualized with a smaller 3d port object and label, here it is the default, a grey sphere. The node itself is a simple orange cube, and has a coordinate system gizmo for easy positioning in space. The execution connectors are L shaped brackets which border the node and stack to allow branching or multiple outputs that are called in succession. When an execution output fires it sends a message to the next node that it is attached to, which makes that node evaluate itself. This usually means performing a small computation using the values on the input ports of the node.
For example, the node below creates a geometrical cube at an x,y,z location. When the execution connector (magenta wire) is trigged from some previous node, it starts the evaluation on this cube node, the cube node, then looks at its 3 inputs for x,y,z and places a cube at that location. When its computation is complete it fires its done
�51
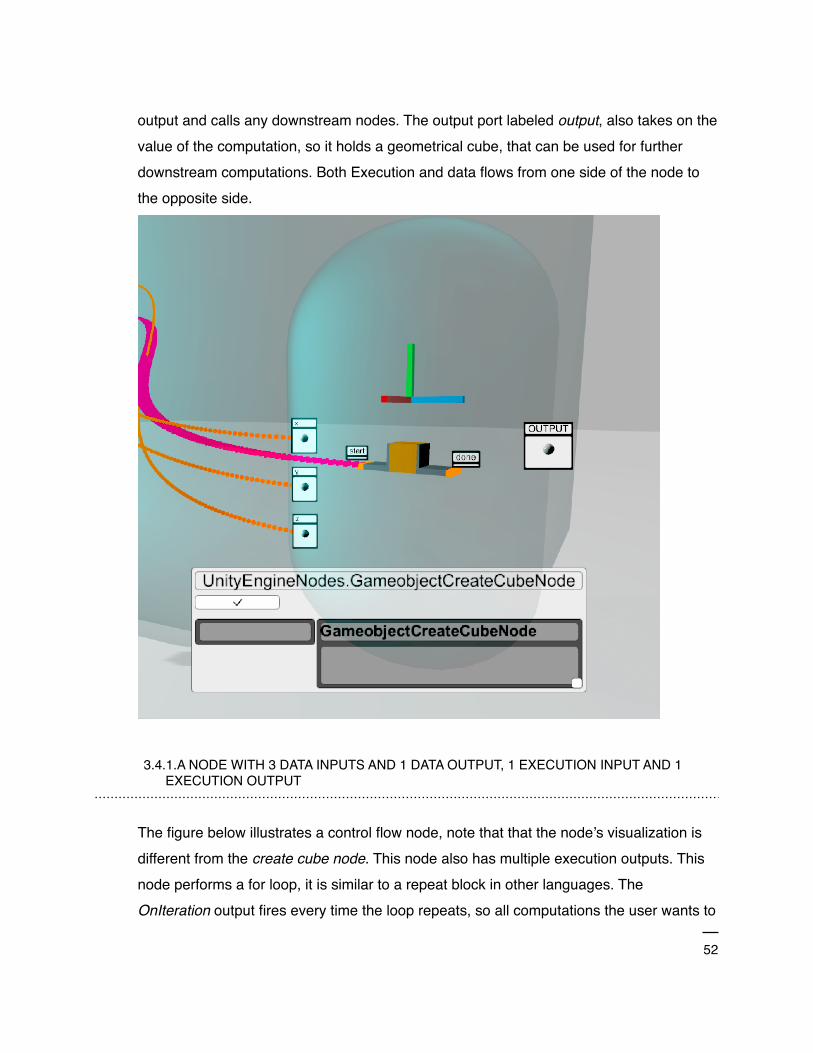
output and calls any downstream nodes. The output port labeled output, also takes on the value of the computation, so it holds a geometrical cube, that can be used for further downstream computations. Both Execution and data flows from one side of the node to the opposite side.
�
3.4.1.A NODE WITH 3 DATA INPUTS AND 1 DATA OUTPUT, 1 EXECUTION INPUT AND 1 EXECUTION OUTPUT
The figure below illustrates a control flow node, note that that the node’s visualization is different from the create cube node. This node also has multiple execution outputs. This node performs a for loop, it is similar to a repeat block in other languages. The OnIteration output fires every time the loop repeats, so all computations the user wants to
�52
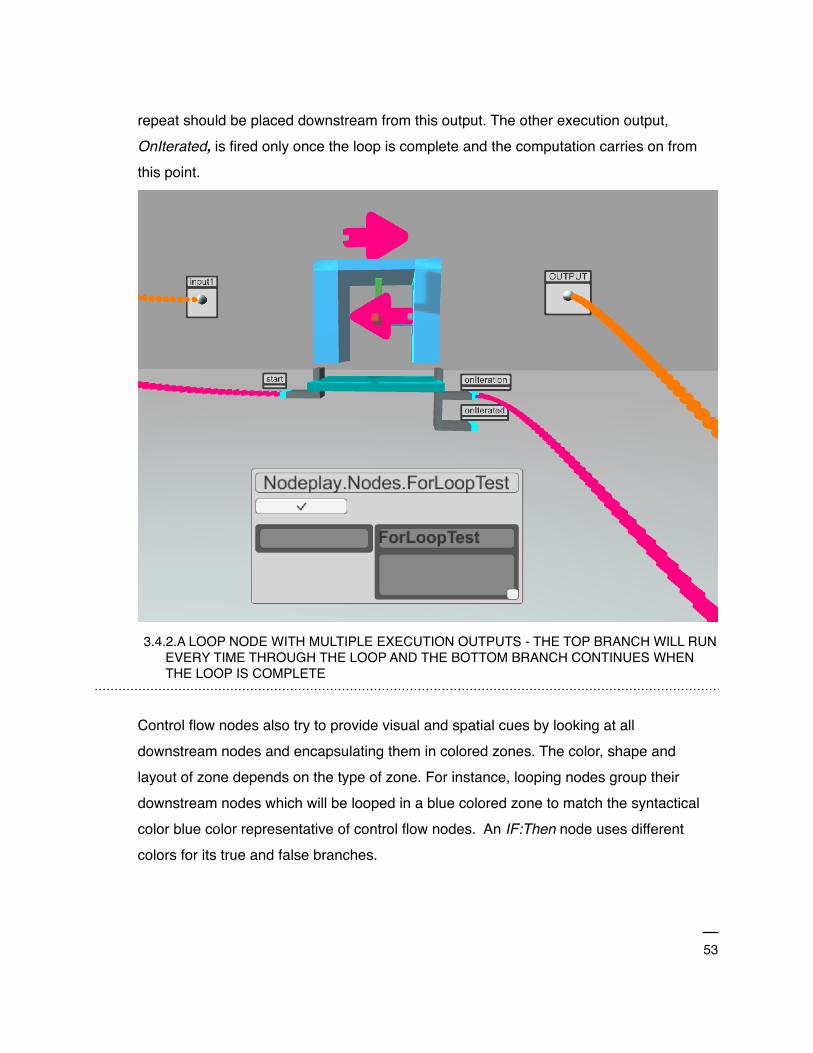
repeat should be placed downstream from this output. The other execution output, OnIterated, is fired only once the loop is complete and the computation carries on from this point.
�3.4.2.A LOOP NODE WITH MULTIPLE EXECUTION OUTPUTS - THE TOP BRANCH WILL RUN
EVERY TIME THROUGH THE LOOP AND THE BOTTOM BRANCH CONTINUES WHEN THE LOOP IS COMPLETE
Control flow nodes also try to provide visual and spatial cues by looking at all downstream nodes and encapsulating them in colored zones. The color, shape and layout of zone depends on the type of zone. For instance, looping nodes group their downstream nodes which will be looped in a blue colored zone to match the syntactical color blue color representative of control flow nodes. An IF:Then node uses different colors for its true and false branches.
�53
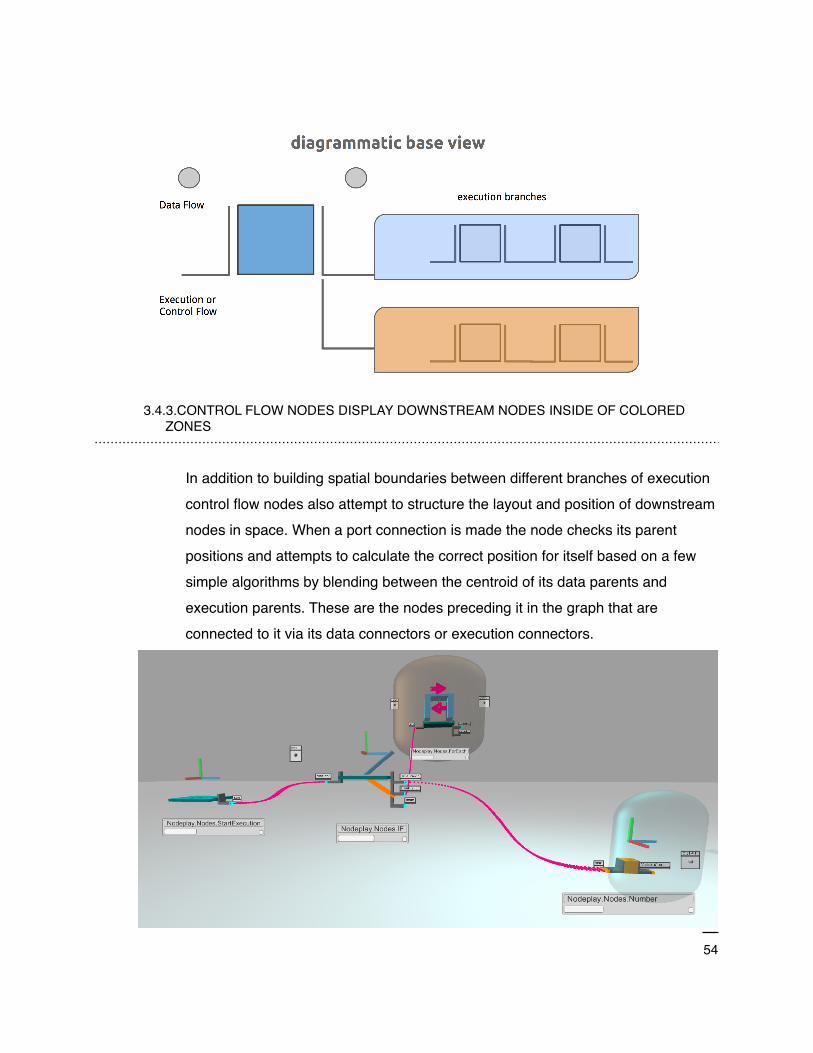
�3.4.3.CONTROL FLOW NODES DISPLAY DOWNSTREAM NODES INSIDE OF COLORED
ZONES
In addition to building spatial boundaries between different branches of execution control flow nodes also attempt to structure the layout and position of downstream nodes in space. When a port connection is made the node checks its parent positions and attempts to calculate the correct position for itself based on a few simple algorithms by blending between the centroid of its data parents and execution parents. These are the nodes preceding it in the graph that are connected to it via its data connectors or execution connectors.
�
�54
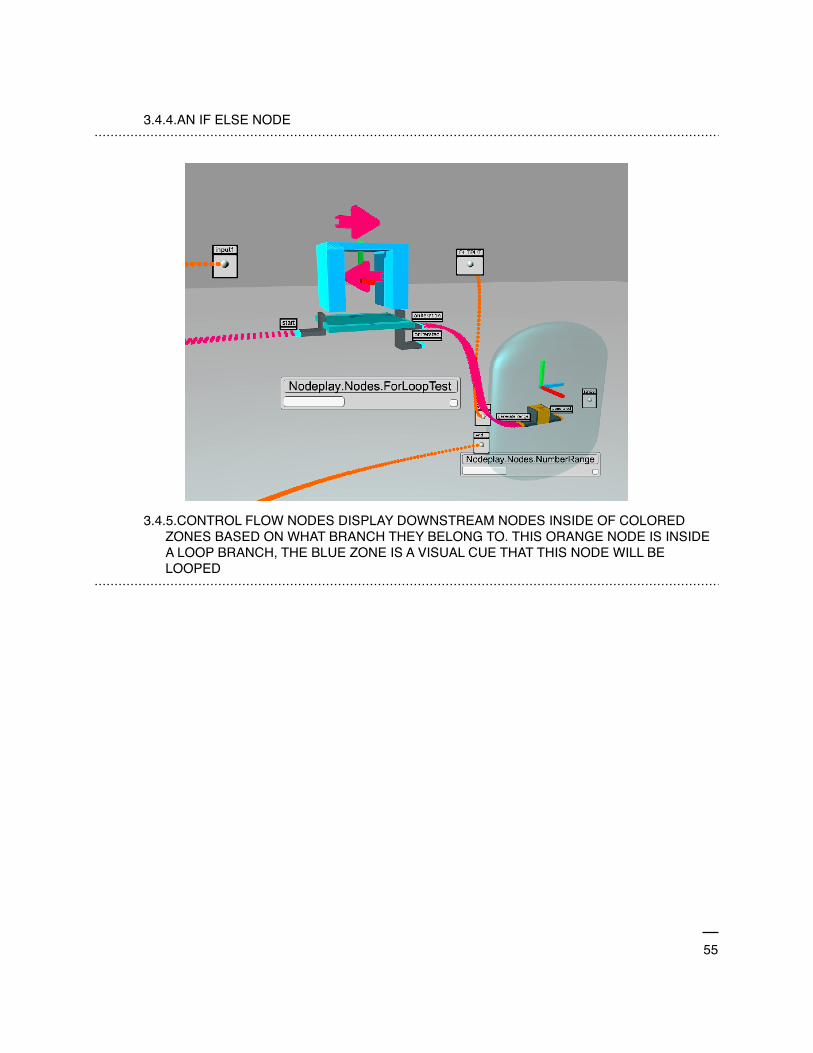
3.4.4.AN IF ELSE NODE
�3.4.5.CONTROL FLOW NODES DISPLAY DOWNSTREAM NODES INSIDE OF COLORED
ZONES BASED ON WHAT BRANCH THEY BELONG TO. THIS ORANGE NODE IS INSIDE A LOOP BRANCH, THE BLUE ZONE IS A VISUAL CUE THAT THIS NODE WILL BE LOOPED
�55
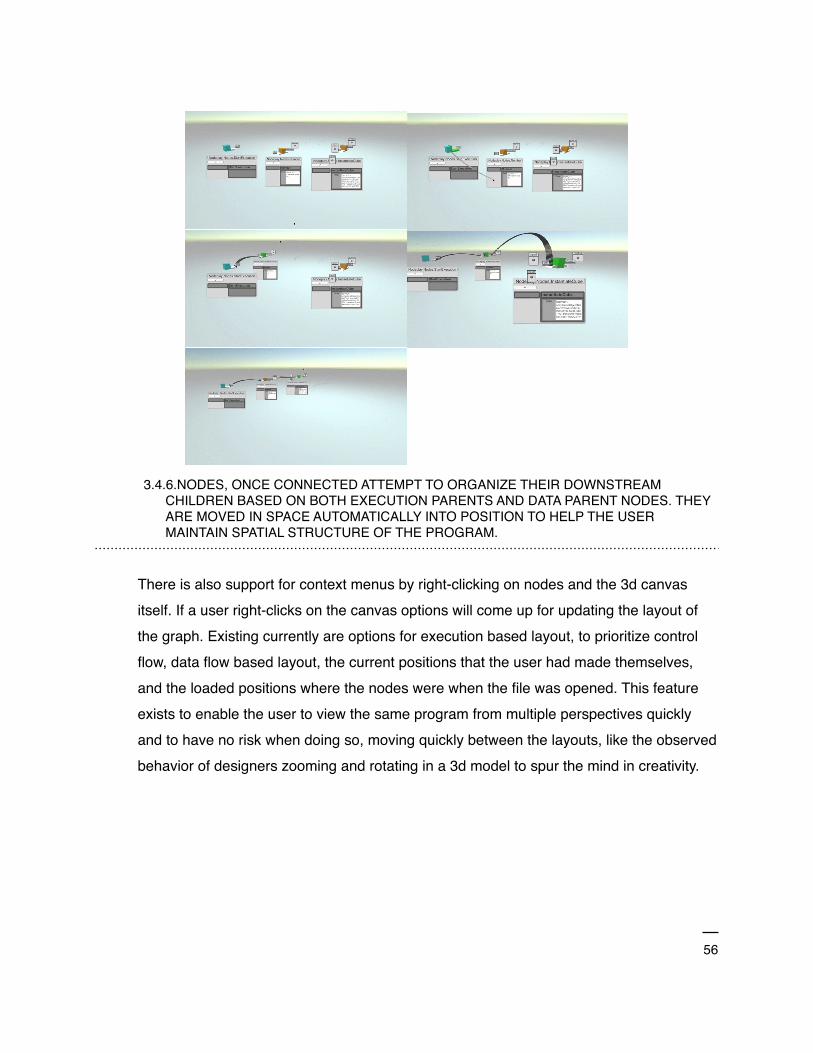
�3.4.6.NODES, ONCE CONNECTED ATTEMPT TO ORGANIZE THEIR DOWNSTREAM
CHILDREN BASED ON BOTH EXECUTION PARENTS AND DATA PARENT NODES. THEY ARE MOVED IN SPACE AUTOMATICALLY INTO POSITION TO HELP THE USER MAINTAIN SPATIAL STRUCTURE OF THE PROGRAM.
There is also support for context menus by right-clicking on nodes and the 3d canvas itself. If a user right-clicks on the canvas options will come up for updating the layout of the graph. Existing currently are options for execution based layout, to prioritize control flow, data flow based layout, the current positions that the user had made themselves, and the loaded positions where the nodes were when the file was opened. This feature exists to enable the user to view the same program from multiple perspectives quickly and to have no risk when doing so, moving quickly between the layouts, like the observed behavior of designers zooming and rotating in a 3d model to spur the mind in creativity.
�56

�3.4.7.NODE LAYOUT OPTIONS CONTEXT MENU, LETS A USER REPOSITION ALL NODES
BASED ON DIFFERENT ALGORITHMS TO VIEW THE SAME PROGRAM IN DIFFERENT LAYOUTS.
�57
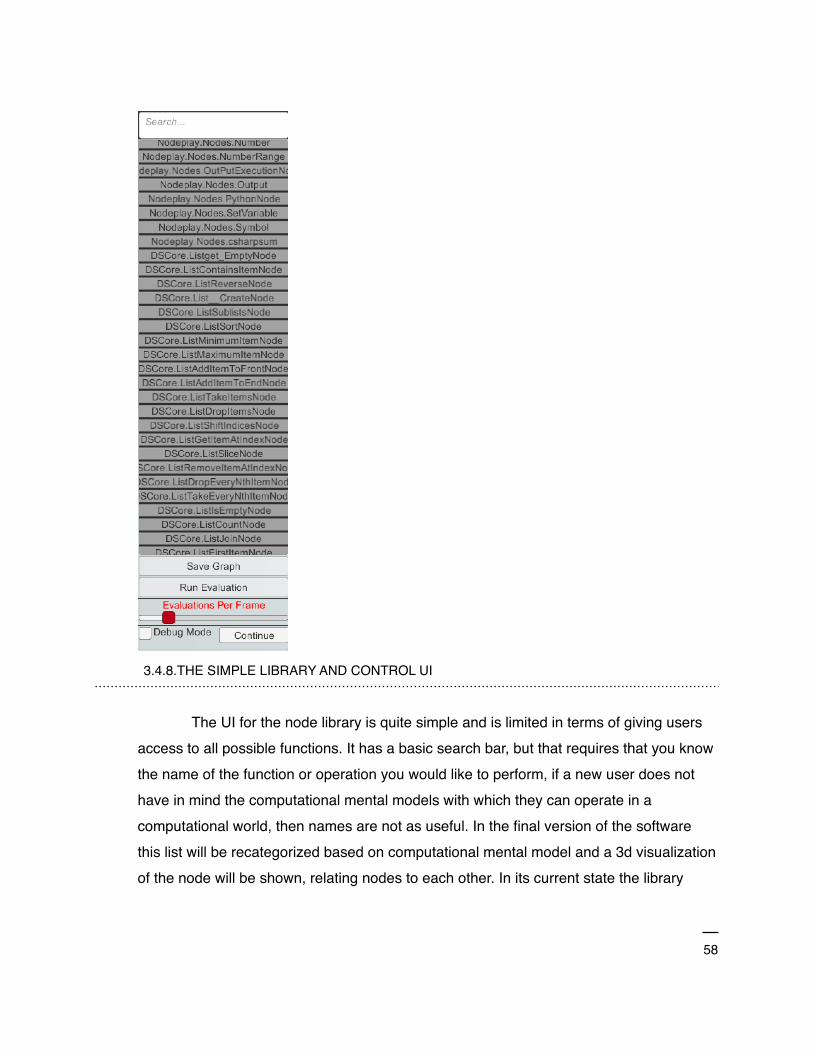
�3.4.8.THE SIMPLE LIBRARY AND CONTROL UI
The UI for the node library is quite simple and is limited in terms of giving users access to all possible functions. It has a basic search bar, but that requires that you know the name of the function or operation you would like to perform, if a new user does not have in mind the computational mental models with which they can operate in a computational world, then names are not as useful. In the final version of the software this list will be recategorized based on computational mental model and a 3d visualization of the node will be shown, relating nodes to each other. In its current state the library
�58

presents a series of buttons with the namespace ,class and name of the node, pressing this button instantiates the node in front of the current camera position.
Also present in the figure is a debug mode checkbox and a continue button. This is part of XYZ’s debug and inspection tools. It’s very simple to use, if a user checks this box and runs their graph, the computation will jump to each currently executing node, like a textual debugger, you can inspect the current node’s values and then hit continue to move to the next node. The camera appropriately frames the view of the node and smoothly transitions to the next so that context is not lost.
The red slider present here simply changes the speed of the computation, this will be addressed further in chapter 7. during the technical discussion of implementing a control flow based tool.
3.5.Sample Graphs
Three nested loops to create a cube
�3.5.1.NESTED FOR LOOPS AND OPENED EVALUATION RESULTS INSPECTORS
�59
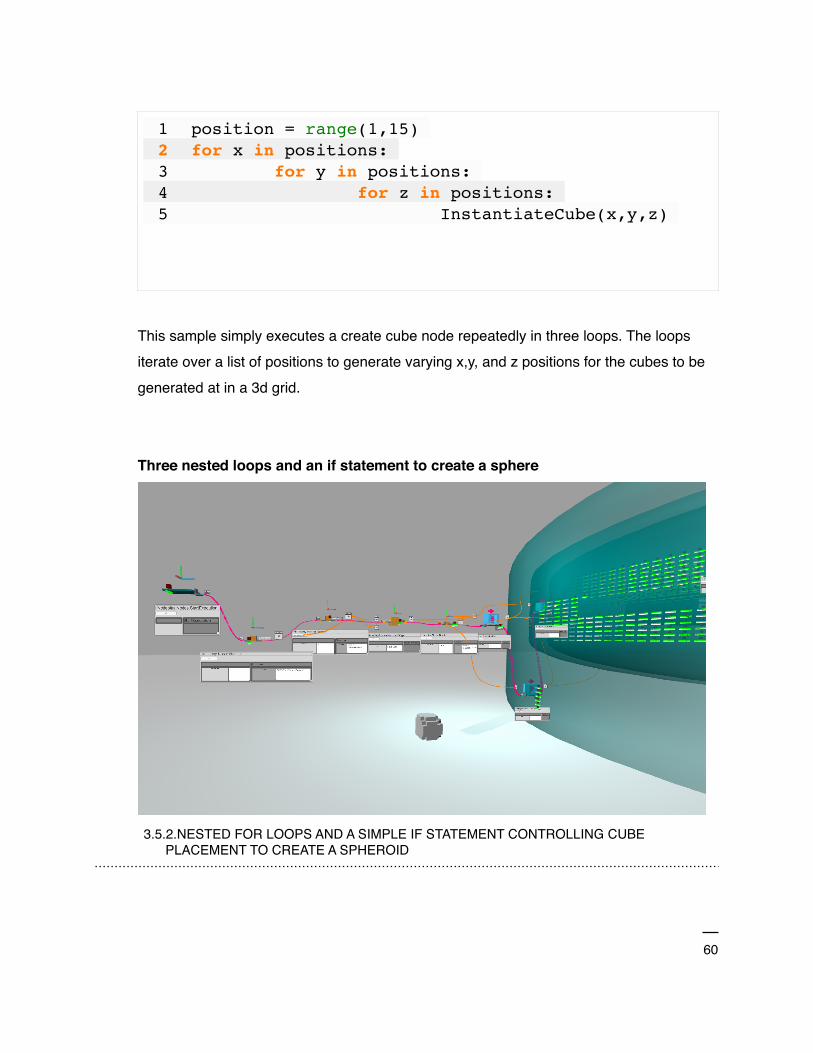
This sample simply executes a create cube node repeatedly in three loops. The loops iterate over a list of positions to generate varying x,y, and z positions for the cubes to be generated at in a 3d grid.
Three nested loops and an if statement to create a sphere
�3.5.2.NESTED FOR LOOPS AND A SIMPLE IF STATEMENT CONTROLLING CUBE
PLACEMENT TO CREATE A SPHEROID
1 position = range(1,15) 2 for x in positions: 3 for y in positions: 4 for z in positions: 5 InstantiateCube(x,y,z)
�60

This sample builds on the last program by adding a conditional statement and some math. We check to make sure that the position we’re going to add a cube to is below some distance x from the center of the 3d grid. This ends up making a spheroid shape of constant radius.
�3.5.3.VISUALIZING INSPECTING NUMBER OF TIMES THAT CUBE WAS CREATED VS
NUMBER OF TIMES IF STATEMENT FIRED
Inspecting the evaluation results allows us to see that the if statement fired more times than the number of cubes that were built, so during some executions the IF node was false, and a cube was not created.
�61
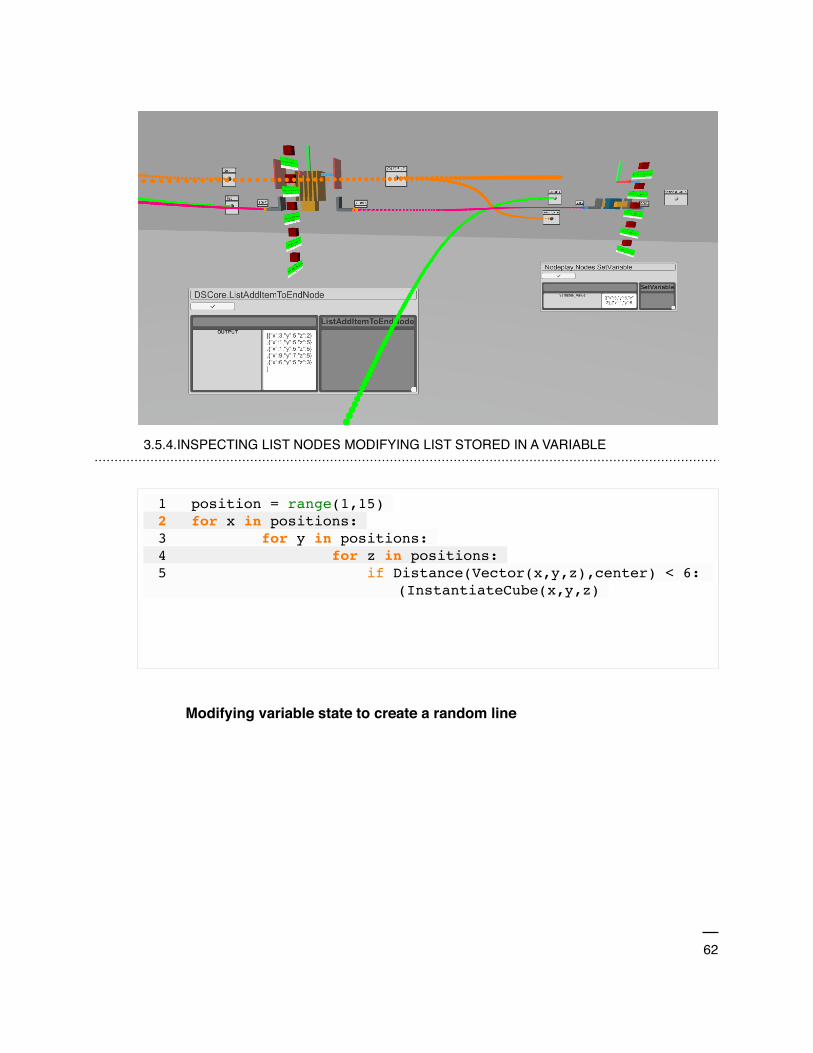
�3.5.4.INSPECTING LIST NODES MODIFYING LIST STORED IN A VARIABLE
Modifying variable state to create a random line
1 position = range(1,15) 2 for x in positions: 3 for y in positions: 4 for z in positions: 5 if Distance(Vector(x,y,z),center) < 6:
(InstantiateCube(x,y,z)
�62

�3.5.5. A GRAPH THAT STORES POINTS IN A LIST TO CREATE A RANDOM LINE
This sample creates a set of random points by continually generating a new random point and appending to a list, stores the list in a variable, and when the loop exits passes all the points to a node that makes a line.
�63

�3.5.6.INSPECTING THE LIST OF POINTS AND CORRELATING THEM WITH THE
GENERATED PINK LINE
1 linepositions = [] 2 3 4 for i in range(5): 5 randompoint = vector3 ( random(100), random(100),
random(100))6 linepositions = linepositions.addToEnd(randompoint) 7 8 CreateLine(linepositions)
�64

4. Object Recognition and Symbol Selection
4.1.Exploration Of Node(Function) Visualization
� �
�65

4.1.1.CLUSTERS OF COMMON FUNCTIONS AND SIMPLE ICONS DESIGNED AS SPECIAL PROJECT FOR 6.034 AI WITH P.WINSTON BY AUTHOR
The figure above is taken from previous work performed as part of a special project in relation to this thesis exploring clustering of common nodes from a mature visual language as an attempt to understand the inherent structure in a library of code and to find mechanisms for generating visualizations that fit the functions of those procedures. I include this work here as a possible future exploration for methods to semi-automatically, or automatically generate node visualizations. Currently, visualizations in XYZ, are curated and nodes rely on being intelligently inherited using object oriented coding practices to build appropriate aggregated visualizations. This work might provide avenues for the implementation of statistical algorithms for automatic visualization for visual programming languages. As described in the original work,
I decided to use a simple unsupervised learning approach to help me make sense of the functions in the core library … Each vector has 16 dimensions, and the node namespace and name. Some are binary, others are numeric. …After parsing the library and turning it into this feature set, my feeling is that the most beneficial features to look implement parsing / recognition for are those that illustrate the transformation from input to output data. The last 4 binary features are filtering, rearrange, mutate, and generate…
The most useful and applicable product of this work to this thesis directly is the naming that occurred of the various clusters that were generated. This provided some guidance as to the class structure for visualizations in XYZ and the node types that should be included, as well as how to generate the most general possible visualizations for base types.
4.2.Object Recognition in Humans
In this section I will briefly relate some process modeling and human vision studies that have guided my selection and design of symbols and node visualizations.
�66

Summarized by Figl, is the one currently accepted higher level overview of memory formation and storage.
When users try to memorize a model, three steps of cognitive processing take place: encoding of sensory input in mental representations that can be stored in memory, storage of information and retrieving stored information. Atkinson and Shiffrin [11] were the first who suggested distinguishing between three types of memory stores: sensory memory, short-term memory and long- term memory. (Figl,2012 )
I have proceeded with the assumption that simplification of visualizations will decrease the necessary cognitive load of the first step. If a simple visualization is used across class types, in this case node types then memory relations and positions will be simpler, more importantly remembering the function of the node will be simpler. We must avoid too similar visualizations of course, as then functions become confused and the problem of homogeneity becomes obvious as the graph grows in size.
In 3d the problem can be slightly exacerbated as text labels can be very far away from the camera. It has not been properly implemented, but a future implementation of the labeling scheme should adjust font size for ‘important’ nodes. These can be nodes that have many dependencies or have been marked. To aid in recalling a function, the library of nodes is always present to compare the names and visualizations of nodes with. If the library were organized more categorically based on function of nodes, so that clusters of function and their visualizations would aid in recall, as discussed below in two independent studies dealing with classification of object views.
Object Cues are the first inputs to categorization; they provide perceptual organization of the stimulus on which categorization processes operate. One function of object cues is therefore to represent important perceptual differences between categories. Reasoning backwards from this property,Schyns and Murphy(1994) suggested that the need to distinguish categories that initially ‘look alike’ could the creation of new object cues that change the perception of the stimuli. The Functionality Principle summarizes this view (Schyns and Murphy,1994): ‘ if a fragment of a stimulus categorizes objects (distinguishes members from non-members), the fragment is instantiated as a unit in the representational code of object concepts’ (Schyns,1998)
�67

Taking into consideration the functionality principle, I believe, when dealing with simple and similar visualizations the unit of disambiguation should be clear, relatively large, and simple. The class based visualizations that I use mirror the functional structure of the node’s code base and aggregate simple visualizations together to define a specific node but with recognizable parts that define a path from most general to specific function. A programmer can use these visualizations as units of disambiguation between general and specific groupings of nodes. The challenge is to provide to the user cues, so that they can compare the correct level of disambiguation units between nodes. Relative size correlated with specificity is one approach.
For example subjects could learn that ‘green and square’ defined the objects of a category. Importantly, there is no ambiguity as to which features characterize which objects.((Schyns,1998)
As explained below the class based visualizations that use visually similar objects from classes that are in the same inheritance tree, helps to generalize these visualizations to different viewpoints for a user. This helps them to recognize this visualization from different perspectives in 3d space.
Experiment 1 demonstrates that familiarity with several members of a class of novel 3D objects generalizes in a viewpoint-dependent manner to cohort objects from the same class….Experiment 3 demonstrates that this generalization is restricted to to visually similar objects rather than all objects learned in a given context(Tarr,Gauthier,1998)
By using simple 3 dimensional visualizations that are visually similar based on node function, and are aggregated with sizes that are correlated to functional complexity level we can build clear units of disambiguation that can be compared from multiple perspectives and distances to remind the user of node function and location.
�68
5. Spatio-Temporal Reasoning Necessary For Programming
5.1.Fundamental Mental Models
• Functions : functions are abstract mathematical objects, that transform data. They are generally difficult to describe as they essentially have very few properties, no mass, no immediate visualization. They usually have an input and output of various types, and depend on this and some name. The functions we are most familiar with are simple mathematical ones, like “+” , where input and output types are both numbers. After the function returns the result, it might as well vanish. Functions become more tangible when viewed through the lens of object oriented programming or when visualized as a tangible node in space.
• State : state is a simple computational and logical concept, that must be handled with care. It can introduce exponential complexity.
• Execution : execution requires an understanding of the sequence of functions over time. If we have the understanding that computations do not all happen in parallel and that some computations require the results to previous ones linear and cyclic execution as a concept falls out of this.
• Conditionals : conditional logic relies on a basic understanding of boolean logic, conditional program constructs may move data or control to a specific branch when a test if true or false.
• Memory : requires an understanding of state and execution. Places in memory that change their value over time are referred to as variables.
• Variables : variables are locations in memory that can be named, referred to by name, and can change their values over time.
• Lists : lists are a simply a sequence of data stored in a specific order.
• Iteration, Loops : iteration or looping is a concept that lies at the heart of many algorithms. It is simply accessing all items in a sequence and performing some operation as we access each of them.
�69

• Procedural Abstraction : this concept is the naming of a set of functions as a single function. It is simple, but the act allows the creation of complex software.
• Recursion : recursion builds on procedural abstraction, it is the idea that a procedure will call itself.
• Objects : objects are a binding of data and functions together, they are a mechanism for organizing programs and attempting to reduce the complexity of code.
• Methods : methods are functions that are bound to objects and as such only make sense in terms of those objects.
• Instantiation : Instantiation is the act of producing a token from a type. The type is an abstract definition or schema, while the token is a physical manifestation of the type.
• Mutation : since objects can define data and reference variables, we can say that their state changes depending on the value of all their current variables taken in combination. Mutation is what occurs when an object is modified.
• Types : type refers to the definition of a specific class of objects.
5.2. 3D Data Visualization Applications
Described in this chapter are various visualization applications that use 3 dimensions to represent data in general. These applications were studied as precedents for both the visual language components and inspector functions.
• Three-Dimensional Representation For Program Execution: (Henry Lieberman,1989) this tool is a dynamic display of arbitrary program execution over time in 3 dimensions. This work makes an interesting contribution to program visualization strategies that is similar to Form3, in that it purports to use the z dimension as a time based view of program execution. The use of color and rotation also represent different aspects of program execution. The program flow is conceptually regarded as a graph built of nodes representing functions. The idea of re-rooting this function call graph is central to this work, this re-rooting is, as explained by the author, a change of perspective, “Re-rooting a containment tree is a good way to emphasize the target
�70
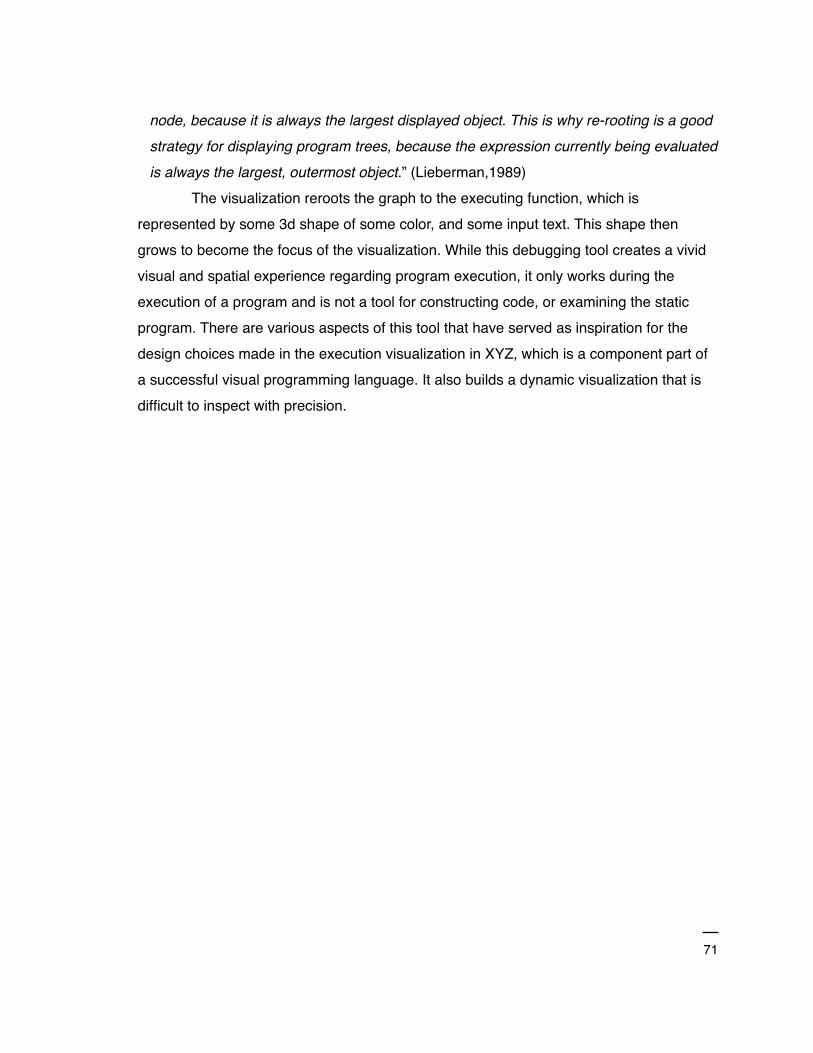
node, because it is always the largest displayed object. This is why re-rooting is a good strategy for displaying program trees, because the expression currently being evaluated is always the largest, outermost object.” (Lieberman,1989)
The visualization reroots the graph to the executing function, which is represented by some 3d shape of some color, and some input text. This shape then grows to become the focus of the visualization. While this debugging tool creates a vivid visual and spatial experience regarding program execution, it only works during the execution of a program and is not a tool for constructing code, or examining the static program. There are various aspects of this tool that have served as inspiration for the design choices made in the execution visualization in XYZ, which is a component part of a successful visual programming language. It also builds a dynamic visualization that is difficult to inspect with precision.
�71

�5.2.1.EXECUTION OVER TIME WITH RE-ROOTING
�72

• Framework for 3d data visualization,(Steven Reiss) The PLUM package developed at Brown University is a package for visualizing abstract data objects in 3d space. There are many different types of visualization objects present in PLUM for mapping data structures to appropriate visualizations for viewing in 3 dimensions.
Abstract graphical objects are represented in PLUM as entities with properties, constraints, and components. The properties represent the parameters that control how the object is to be drawn. The constraints relate objects to each other. The components identify other objects that are contained within this object. (Reiss,1993)
These include interesting interactive tree structures based on work done at Xerox, 3d tagged objects, time sequence visualizations, and general array visualization. Many of
�73

these exist in some form or another in XYZ.
�5.2.2.VARIOUS VISUALIZATIONS FROM PLUM (TAGS,FILE OBJECTS,AND TIME OBJECTS)
Since visualization of code and object type is a central focus of XYZ, there are many ideas and implementations overlapped between this thesis and the PLUM framework and the previous work of the group at Brown that developed it. A particularly interesting aspect is the description of the hierarchical and component based model of visualization that PLUM has developed to allow it it interoperate with different data structures from external libraries.
There are three base classes that represent these objects, Plumobject to represent the graphics objects themselves, PlumComponent to represent the components, and Plumconstraint to represent the constraints. Subtypes of Plumobject represent the different type of abstract graphics objects, for example
�74
PlumDataObject represents a data object. Subtypes of Plum- Component represent the different types of components. Each component object contains the Plumobject for that component as well as the data that is component specific. For example, a tiled component object contains the extent of the corresponding tile. (Reiss,1993)
While the visualization strategy in XYZ is similar in some respects, they produce some similar visualizations. Some of the simplicity just comes with the nature of the higher level programming afforded by using Microsoft’s .NET and Unity3d’s component based logic to simplify visualization and object introspection. I go into more detail in chapter 3 and 7, but will briefly describe the nature of the visualizations in XYZ. First nodes are visualized in a hierarchical manner, using object-oriented class inheritance.
Nodes supply a list of simple visualization prefabs that are all combined together to create the final visualization for that node. In this way nodes’ implementations and visualizations gets more and more specific and detailed. The control flow nodes are a good example. The most basic control flow node is Start, which is an entry point for evaluation to begin. This node’s visualization is a wide flat cuboid of a cyan color. The ForEach Node inherits from the same base class as the Start node as they are both control flow nodes, it is also visualized as a flat blue cuboid, but adds a loop and arrow visualizations.
Many of the visualization objects explored in PLUM, deal with visualization of data and not of code directly, and not the interactive creation of code. XYZ, also tackles this problem, but in a more limited way. Using the power of Microsoft’s .Net System.Reflection namespace, objects are simply introspected for their properties. These properties may be other objects or simple values, like lists, strings, and numbers. A search is then performed for any recognized types that a visualization type has been designed for and if a match is found, that type is instantiated. These visualizations are shown in a simple expandable tree, which is visualized as a set of continuously smaller
�75

text labels, geometrical visualizations, and buttons.
�5.2.3. XYZ’S TREE OBJECT INSPECTOR SHOWING VISUALIZATIONS, TEXT
DESCRIPTIONS AND NESTED PROPERTIES
The resulting visualizations can be navigated in 3 dimensions by moving the camera, and zooming into various cells of the tree. Pressing a visualization of an object scans its properties and generates a series of new visualizations below it, as a set of new buttons, which can be further inspected. This same type of object inspection and visualization is
�76

used in various places throughout XYZ. One area especially rich for future study is a more effective layout of this simple nested tree structure, as explored in PLUM, possibly using cone trees, fish eye text walls, or modifying the 2 dimensional nature of the wall of visualizations to produce a more memorable structure.
�5.2.4. PERSPECTIVE WALL, CONE TREES, FISHEYE VIEW, (BURNETT ET AL.1995)1
Another interesting aspect that can be inferred from the work, but not illustrated explicitly is the ability to visualize the same type of data using various visualization objects. For instance the authors discuss cone trees, time based visualizers, general array visualizers, and 3d scatter plots. While some of these visualizations might only work for a specific data structure, some of them can be applied to the same data to visualize it in different ways for comparison. This idea is not explored in the text, but seems ripe for future work and can be explored using the geometrical output capabilities of XYZ.
These visualization types are cited by Burnett et al. with the following citations above the 1
figure: (G.Robertson J Mackinlay, and S. Card “Cone Trees: animated 3D Visualizations of Hierarchical Information” CHI 91 Conf. ACM,New York pp. 189-194)(J. Mackinlay, G. Roberston and S. Card, ”The Perspective Wall Detail and Context Smoothly Integrated” Proc. CHI 91 Conf ACM, New York pp.173 -179.)(G. Furnas, ”Generalized Fisheye Views” Proc. CHI 86 Conf ACM, New York pp.16 -23.)
�77
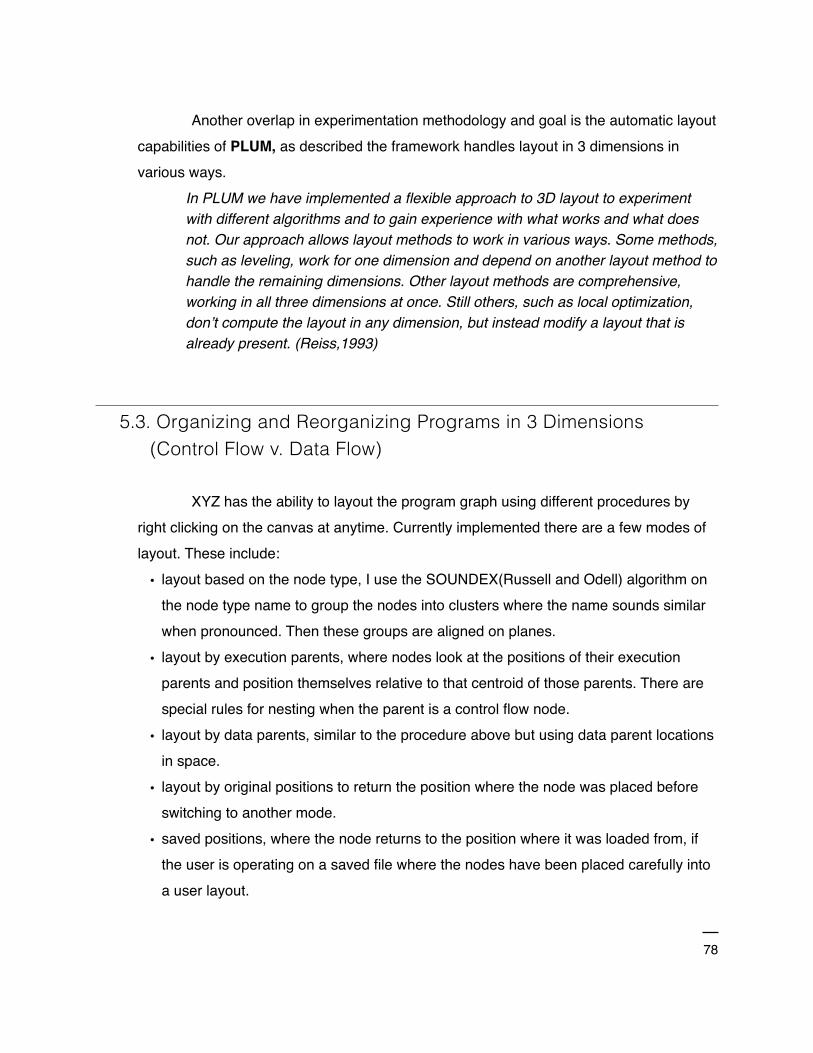
Another overlap in experimentation methodology and goal is the automatic layout capabilities of PLUM, as described the framework handles layout in 3 dimensions in various ways.
In PLUM we have implemented a flexible approach to 3D layout to experiment with different algorithms and to gain experience with what works and what does not. Our approach allows layout methods to work in various ways. Some methods, such as leveling, work for one dimension and depend on another layout method to handle the remaining dimensions. Other layout methods are comprehensive, working in all three dimensions at once. Still others, such as local optimization, don’t compute the layout in any dimension, but instead modify a layout that is already present. (Reiss,1993)
5.3. Organizing and Reorganizing Programs in 3 Dimensions (Control Flow v. Data Flow)
XYZ has the ability to layout the program graph using different procedures by right clicking on the canvas at anytime. Currently implemented there are a few modes of layout. These include:
• layout based on the node type, I use the SOUNDEX(Russell and Odell) algorithm on the node type name to group the nodes into clusters where the name sounds similar when pronounced. Then these groups are aligned on planes.
• layout by execution parents, where nodes look at the positions of their execution parents and position themselves relative to that centroid of those parents. There are special rules for nesting when the parent is a control flow node.
• layout by data parents, similar to the procedure above but using data parent locations in space.
• layout by original positions to return the position where the node was placed before switching to another mode.
• saved positions, where the node returns to the position where it was loaded from, if the user is operating on a saved file where the nodes have been placed carefully into a user layout.
�78
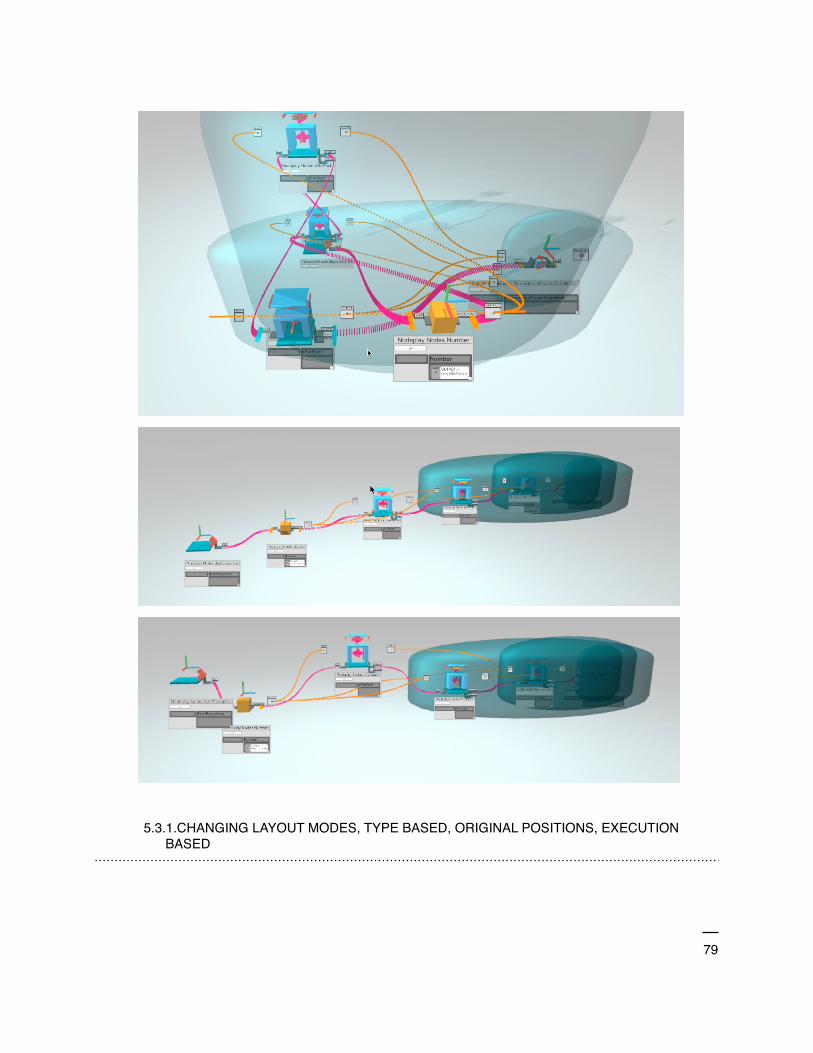
�
�
�
5.3.1.CHANGING LAYOUT MODES, TYPE BASED, ORIGINAL POSITIONS, EXECUTION BASED
�79
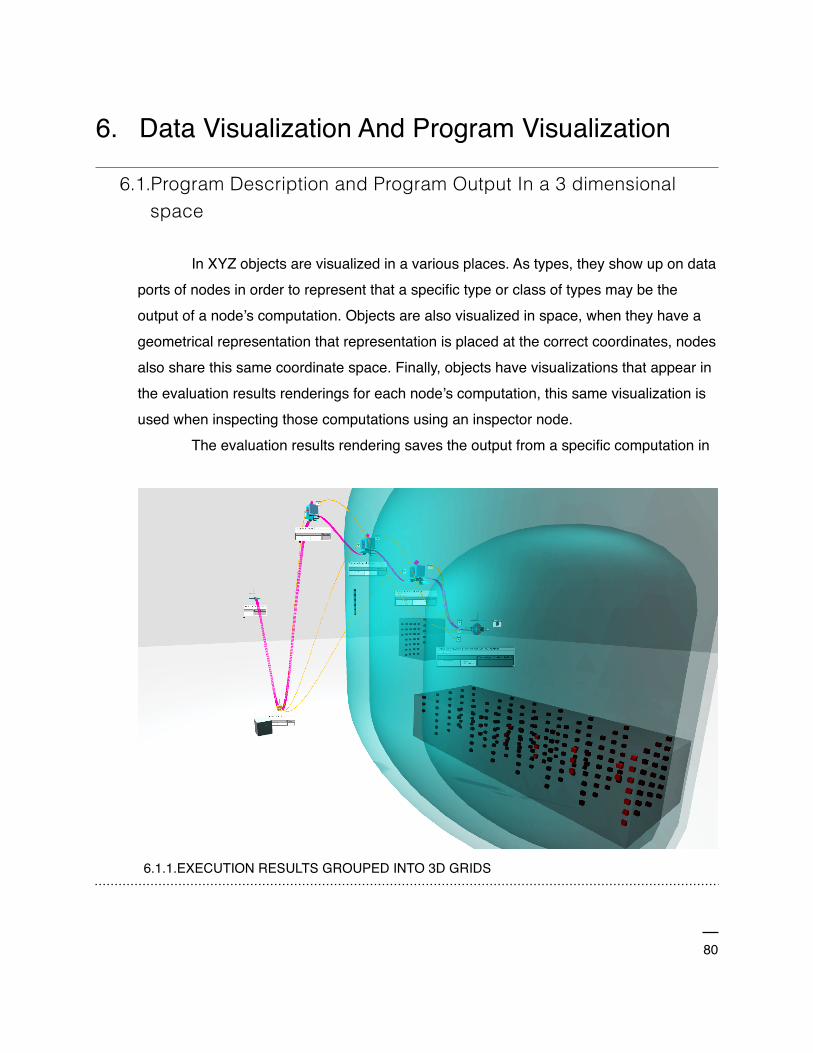
6. Data Visualization And Program Visualization
6.1.Program Description and Program Output In a 3 dimensional space
In XYZ objects are visualized in a various places. As types, they show up on data ports of nodes in order to represent that a specific type or class of types may be the output of a node’s computation. Objects are also visualized in space, when they have a geometrical representation that representation is placed at the correct coordinates, nodes also share this same coordinate space. Finally, objects have visualizations that appear in the evaluation results renderings for each node’s computation, this same visualization is used when inspecting those computations using an inspector node.
The evaluation results rendering saves the output from a specific computation in
� 6.1.1.EXECUTION RESULTS GROUPED INTO 3D GRIDS
�80

�6.1.2.INSPECTING EVALUATION RESULTS
time, and stores the results of that computation, and makes them accessible via a visualization that is related to the node that created it. This is similar to the functionality of a debugger or the functional data structure qualities from other functionally based visual languages that aggregate their outputs. It combines these ideas to enable the user to look at the changing behavior of a node over time.
Currently unimplemented is an idea to blend the space between computation and output further, by introducing an interaction that occurs when a programmer clicks a generated object in space, and is presented with possible computations to perform on that object. This is a simple idea to implement, something like a visual auto-complete which looks up all the methods that an object contains or can have performed on it.
�81

6.2.Shape Grammar For Visualizing Data Structures
Shown in this section is a shape grammar which has been converted from a string grammar. The string grammar produces nested lists of elements, where each element may be a number, and can also be a list. The shape grammar produces nested shapes that represent these numbers. I show this shape grammar as it served as an inspiration for the data inspector in XYZ, and might further serve to make the visualization more spatial. (see figure 5.2.3)
�82

�
� = [12,2,[1,2]]
6.2.1.SHAPE GRAMMAR CONVERTED FROM STRING GRAMMAR FOR NESTED LISTS
�83
7. Software Prototypes
7.1.Goals Implemented
The thesis work achieved many of the goals originally set out, and these were developed to a considerable level. Below is a list of main goals which have been implemented and are present in XYZ.
• 3D visual programming language that enables a programmer to place nodes in 3 dimensional space.
• Many entry points: a user can start programming with nodes with python, c#, or generate them automatically from from .net .dlls
• Support for fundamental computational mental models or computational thinking including: iteration, recursion, variables, procedural abstraction and execution.
• An explicit execution language where one can see where execution is flowing and what node is executing as well as what kind of results those computations are producing at a glance.
7.2.Goals Unimplemented
There also remain goals which are left unimplemented and have only been imagined and developed in initial prototype or diagram form. These are listed below.
• A time slider or scrub wheel for interacting with time and rewinding or scrubbing through the execution of a program. A simple version of this has been implemented that can increase or decrease the speed of the computation by performing more computations per frame.
• Currently all visualizations are made of prefab geometry that are aggregated together to form the final visualizations. These visualizations require curation by the programmer in building an appropriate inheritance tree of nodes which inherit from the appropriate ancestor. The other possible visualization method is for a node’s type to have an explicit visualization. Future work should include some attention to automatic
�84

visualization mechanisms following from node function. This could include parsing the code of a node, statistical methods, or running the node on test data to extract its function empirically.
• Interacting with objects to perform downstream computations on them is a powerful model for blending the program and design space in XYZ. Currently, as stated previously this idea is only implemented insofar as a geometrical object will lead the user to the execution that produced it and help them to inspect other properties of the object, but since there is no type inference or visual autocomplete there is no capability to perform computations on these objects.
7.3.Chronology and Technical Implementation details
The first step in the development of XYZ was the implementation of a user interface for node placement and interaction. This interface could be used to move nodes in 3 dimensions, perform drag operations on them and their ports to generate connections between them, and to select one node at a time. The UI is also able to expose various properties of the model as editable fields to the user, for example, a node might expose its code as a field so that a user can change the computation the node will run directly from the graph. The last portion of the UI is the actual visualization and display code that uses automatic and manual lookup of type information to load appropriate visualizations for the node and its ports. The ports also use a simple layout algorithm to position themselves relative to the node.
This implementation is fairly simple and is built on Unity3d’s open source GUI code. The nodes are represented by a nodemodel class, this class is responsible for storing the computation the node will perform, the results of that computation, and properties like the number of ports and their types. The model is paired with a view, that is responsible for responding to events from the user, like drags, clicks, and selection events.
A bit bizarrely the nodemodel also stores information on building the elements that contribute to the node’s visualization, this is useful so that when a node is subclassed it can pass on its visualization to children nodes without subclassing its view as well.
�85

After the UI was developed to the point where nodes could be instantiated and connected together an initial execution engine prototype was developed. This prototype was a data flow model and was simply a graph search algorithm that would find nodes with no dependencies, execute them and continue to explore the graph depth first, executing nodes when all of their inputs were evaluated, if a node had missing inputs, the algorithm would walk back up the graph and then back down executing the dependencies in the correct order. This prototype worked nicely, but immediately it became clear that implementing control flow would be a struggle, and visualizing it would be even more difficult.
At this point, I began creating ports and connectors that would carry control flow as opposed to data, and storing those on the node models. Actually implementing the necessary logic for executing a graph at will proved to be more difficult, especially since it was critical that nodes could call other nodes in the middle of their computations, then return to the original node, and visually signal by color change that they were executing. To accomplish these goals I used unity coroutines and a very simple task scheduler.
Whenever a node’s computation calls an execution trigger on itself, for example: the for loop node when complete calls done(). This looks at whatever node is attached
to the “done” port and inserts it into the schedule. The intermediate triggers, like “Oniteration” are more complicated, when this trigger is fired its immediate downstream nodes must be inserted into the schedule after the for loop but before any nodes even further downstream. Nodes look at their calling node to determine their correct placement in the schedule.
A large amount of work went into the recursive algorithm that enables the data inspector node and evaluation renderings. This algorithm uses .Net reflection to introspect the object types, and search their properties, these properties are in turn reflected upon and turned into visualizations. Each property and object is turned into a nested tree drawing of buttons that are automatically laid out and shrink in size correlated
1 for i in input1: 2 OUTPUT = i 3 onIteration() 4 done();
�86

with their depth in the tree originating with the original inspected object. When a button is pressed the properties of that object are inspected and generate more sub buttons. Lists automatically open to reveal their items up to a certain length. The buttons also render graphical visualizations of the object type if there is a visualization that can be found by the type name. Some types map to the same visualization.
The evaluation results renderings rely on this inspector code to review a specific computation’s output. When the program begins executing all computation results are destroyed, as well as all geometry that was generated during the last computation. Whenever a piece of geometry is created it is injected with a component that keeps track of what computation created it, in this way it can be tracked back, so that when a user clicks it, a line is draw to the computation that generated it, and its specific properties can be inspected.
The final work that was performed at the end of this thesis was to create an updater node that hooks into unity3d’s update loop and enables interactive workflows that run pieces of code every frame. Any nodes downstream from the updater node run differently from other nodes which show their execution frame by frame, instead they all run in one frame, this lets computations hooked to the updater to all run in one frame as would be expected when working with compiled code in unity.
7.4.Limitations
The main limitations of the prototype are listed below: • Navigation in 3 dimensions is difficult, but in particular positioning nodes in 3 dimensions
remains difficult with only one camera view. In modeling software this problem is usually solved with multiple perspectives or object snapping, these remain possible solutions.
• In attempting to expose some mental models of computation it became clear that these constructs as they are currently implemented cause graphs to grow quickly, for instance, having to create a number or string node whenever a constant must be used quickly grows the size and complexity of the graph, I have started to address this by creating constant nodes that do not require execution, but there is still work to do here, should a
�87

node need to be created at all, or should input arguments have the options of being purely textual?
• The prototype has speed issues as the graph size grows, both in terms of the computational engine model, and the rendering resources needed to draw the graph and all the evaluation results that are created after each node runs, this amount of geometry starts to get very large quickly.
8. Conclusions
8.1.Contributions
This thesis work and the open source code make contributions to the fields of visual languages and architectural education, particularly computation in the context of design. XYZ, is fully open source, built upon other open source projects with cross compatibility in mind. The only proprietary software used is Unity3d, and there is a freely available version to anyone who wants a copy. I believe the open nature of the code and the descriptions are useful, the algorithms for layout, evaluation, inspection may be useful in other projects.
The approach I have taken for providing visualizations, while simple and manual, is extendable, and follows from practices that a competent programmer would be using so, essentially it comes at a low mental and time cost for a user to add their own nodes with visualizations. I also believe this model is quite useful as it relates responsibility to object class, a tenet of object oriented design.
The spatial data inspector is used in various places in XYZ as a debugger, inspector, variable watch panel, etc. The algorithm here may be useful for all kinds of visualization not only inside XYZ and Unity and presents a simple way to extend visualizations.
The final prototype of XYZ at the time of this writing is a fully featured language that is capable of teaching users about many of the foundational mental models of
�88

computation I set out to represent visually. This includes iteration, functions, execution or control flow, variables, objects and state.
The prototype can be extended by writing nodes in multiple languages, or by building compiled .net code and then importing the .dll which will automatically produce a set of nodes with unique port visualizations. Nodes can also be written by using a simple public api, here is an example for the cube node, which executes python code and the xForEach node, which executes compiled c#.
�89
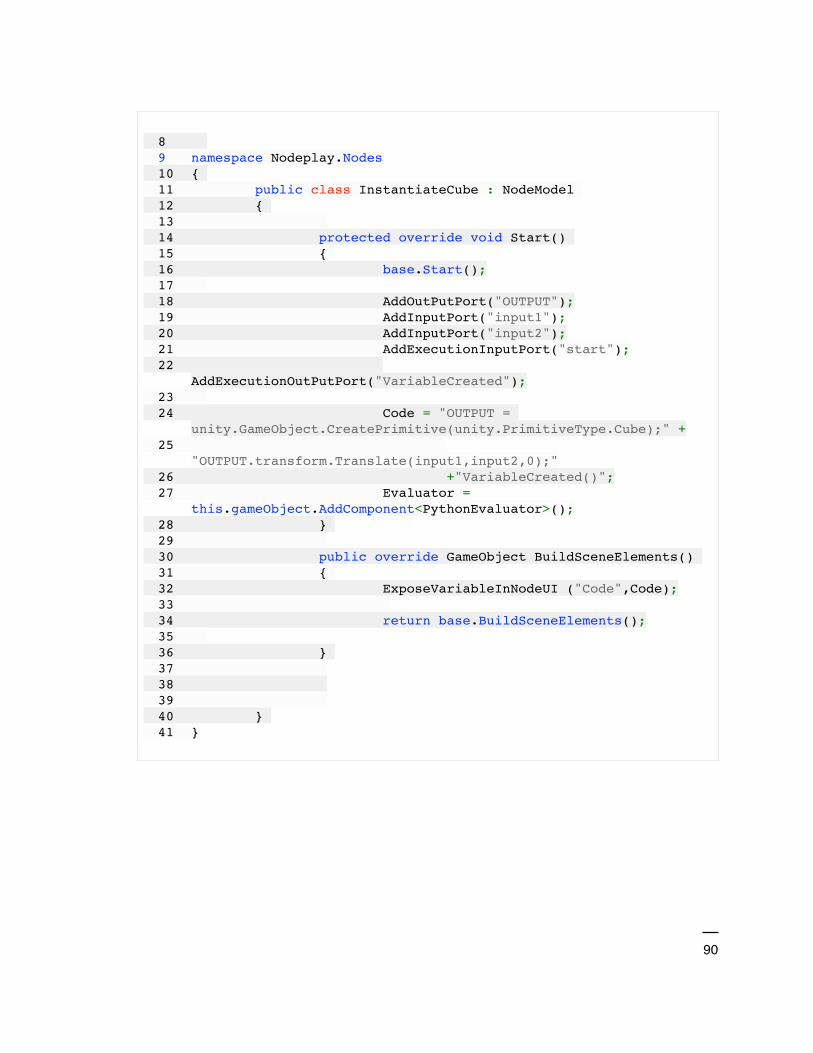
8 9 namespace Nodeplay.Nodes 10 { 11 public class InstantiateCube : NodeModel 12 { 13 14 protected override void Start() 15 { 16 base.Start(); 17 18 AddOutPutPort("OUTPUT"); 19 AddInputPort("input1"); 20 AddInputPort("input2"); 21 AddExecutionInputPort("start"); 22
AddExecutionOutPutPort("VariableCreated");23 24 Code = "OUTPUT =
unity.GameObject.CreatePrimitive(unity.PrimitiveType.Cube);" +25
"OUTPUT.transform.Translate(input1,input2,0);"26 +"VariableCreated()"; 27 Evaluator =
this.gameObject.AddComponent<PythonEvaluator>();28 } 29 30 public override GameObject BuildSceneElements() 31 { 32 ExposeVariableInNodeUI ("Code",Code); 33 34 return base.BuildSceneElements(); 35 36 } 37 38 39 40 } 41 }
�90

A final contribution are algorithms for layout based on graph topology, of course this is not a new idea, and other 3d visualization frameworks have used the structure of the graph in 3d as a guide for layout, the contribution here are the specific
1 namespace Nodeplay.Nodes 2 { 3 public class xForEach : DelegateNodeModel 4 { 5 6 protected override void Start() 7 { 8 base.Start(); 9 AddOutPutPort("OUTPUT"); 10 AddInputPort("input1"); 11 12 AddExecutionInputPort("start"); 13 14 AddExecutionOutPutPort("onIteration"); 15 AddExecutionOutPutPort("onIterated"); 16 17 18 CodePointer = CompiledNodeEval; 19 Evaluator =
this.gameObject.AddComponent<CsharpEvaluator>();20 } 21 22 protected override Dictionary<string,object>
CompiledNodeEval(Dictionary<string,object> inputstate,Dictionary<string,object> intermediateOutVals)
23 { 24 var output = intermediateOutVals; 25 var tempinput1 = inputstate["input1"] as
IEnumerable;26 27 foreach (var i in tempinput1) 28 { 29 output["OUTPUT"] = i; 30 (inputstate["onIteration"] as
Action).Invoke();31 } 32 33 (inputstate["onIterated"] as Action).Invoke(); 34 return output; 35 36 } 37 38 … 48 } 49 }
�91
implementations for type grouping and execution based layout with attempted nesting to build visual structure.
8.2.Limitations Of Approach
There are contradictory goals present in attempting to build a system that can illustrate its execution over time, while also being as fast as possible for the construction of realtime interactive applications. This is the current state of XYZ, and it is currently unresolved. The prototype can do both, but toggling this behavior is difficult to explain to users with the current UI. As of now, all code hooked to an updater now will run in each frame without illustrating each step of execution while, code downstream from a start node will execute in order and update its output at each step.
There are also general speed and optimization issues that have yet to be resolved. These issues became obvious at the end of the work during the building of interactive programs that are executing every frame. If XYZ will be used for anything besides the smallest visual programs, the speed issues must be resolved. Some of these are due to naively loading python interpreters or libraries repeatedly when nodes are executing, or not caching a node’s computation function. There is also a large cost in in updating output text and geometrical visualizations after each computation, these updates are performed even if a branch of nodes are updating faster than every frame, so the changes are not even visible.
More fundamentally, the programs become large and while nodes and program structure are visible, and can be recognized from afar and more nodes can be shown on screen from differing perspectives, the limited positioning interactions and difficulty in moving nodes that are located far away does not help users create unique, and recognizable aggregations of nodes.
A last limitation is that there is no ability to create types/classes of objects as required in a object oriented programming language, or custom visualizations for nodes or variables while live in an XYZ programming session.
�92

8.3.Future Work
The most important areas for possible future work to build upon this thesis are in automatic visualization algorithms that can work by parsing the code into an abstract syntax tree or other data structure. A capability to interact with instantiated objects just like nodes, and by using a visual autocomplete system that can provide all possible operations that can be performed on an object or to that object is another important avenue for future work. This is simple if we have type information. Better methods for interaction and positioning of nodes and aggregating nodes together are critical. There should be less friction and work in placing a node and building connections to other nodes. To aid in this, a smarter zoom and scaling system should be added to the perspective view of the program graph. One that scales text, prioritized nodes, and structures, when they are located far from the camera. A lingering question is what is the appropriate balance between favoring learning and visibility or speed and expressiveness?
9. References
9.1.Works Cited
Boshernitsan, M., & Downes, M. S. (2004). Visual programming languages: A survey. Citeseer.
Retrieved from http://citeseerx.ist.psu.edu/viewdoc/download?
doi=10.1.1.73.2491&rep=rep1&type=pdf
Brennan, K., & Resnick, M. (2012). New frameworks for studying and assessing the development of
computational thinking. In Proceedings of the 2012 annual meeting of the American Educational
Research Association, Vancouver, Canada. Retrieved from http://scratched.gse.harvard.edu/ct/
files/AERA2012.pdf
�93

Bret Victor, beast of burden. (n.d.). Retrieved May 19, 2015, from http://worrydream.com/#!/
LearnableProgramming
Burnett, M., Baker, M., Bohus, C., Carlson, P., Yang, S., & van Zee, P. (1995). Scaling Up Visual
Programming Languages. Computer, 28(3), 45–54.
Curry, H. F., R. Craig, W. (1958). Combinatory Logic Volume I (First Edition edition). North Holland
Publishing Company.
Dynamo BIM. (n.d.). Retrieved May 19, 2015, from http://dynamobim.com/
Figl, K. (2012). Symbol choice and memory of visual models. In Visual Languages and Human-
Centric Computing (VL/HCC), 2012 IEEE Symposium on (pp. 97–100). IEEE. Retrieved from
http://ieeexplore.ieee.org/xpls/abs_all.jsp?arnumber=6344491
Hils, D. (1992). Visual Languages and Computing Survey: Data Flow Visual Programming
Languages. Journal of Visual Languages and Computing, (3), 69–101.
KOSCHITZ, D., & ROSENBAUM, E. (2012). EXPLORING ALGORITHMIC GEOMETRY WITH
“BEETLE BLOCKS:” A GRAPHICAL PROGRAMMING LANGUAGE FOR GENERATING 3D
FORMS. Presented at the 15TH INTERNATIONAL CONFERENCE ON GEOMETRY AND
GRAPHICS ©2012, MONTREAL, CANADA.
Lieberman, H. (1989). A three-dimensional representation for program execution. In Visual
Languages, 1989., IEEE Workshop on (pp. 111–116). IEEE. Retrieved from http://
ieeexplore.ieee.org/xpls/abs_all.jsp?arnumber=77051
Lipovaca, M. (2011). Learn You a Haskell for Great Good!: A Beginner’s Guide (1 edition). No Starch
Press.
Maleki, M. M., & Woodbury, R. F. (n.d.). PROGRAMMING IN THE MODEL. Retrieved from http://
www.sfu.ca/~mmaleki/MaryamMalekiWebsite/Publications_files/Maleki_ACADIA2013.pdf
Minsky, M. L. (1986). The society of mind. New York: Simon and Schuster.
Najork, M. A., & Kaplan, S. M. (1991). The CUBE languages. In Visual Languages, 1991.,
Proceedings. 1991 IEEE Workshop on (pp. 218–224). IEEE. Retrieved from http://
ieeexplore.ieee.org/xpls/abs_all.jsp?arnumber=238829
Neopax, Antares-Universe. (n.d.). Retrieved May 19, 2015, from http://antares-universe.com/
Peppler, K., & Kafai, Y. (2005). Creative coding: Programming for personal expression. Retrieved
August, 30(2008), 314.
�94
PlayMaker - Visual Scripting for Unity3D. (n.d.). Retrieved May 19, 2015, from http://
www.hutonggames.com/
Reiss, S. P. (1993). A framework for abstract 3d visualization. In Visual Languages, 1993.,
Proceedings 1993 IEEE Symposium on (pp. 108–115). IEEE. Retrieved from http://
ieeexplore.ieee.org/xpls/abs_all.jsp?arnumber=269586
Rutten,David ,The Why and How of Data Trees - Grasshopper. (n.d.). Retrieved May 19, 2015, from
http://www.grasshopper3d.com/forum/topics/the-why-and-how-of-data-trees
Rutten, Grasshopper - algorithmic modeling for Rhino. (n.d.). Retrieved May 19, 2015, from http://
www.grasshopper3d.com/
Schyns, P. G. (1998). Diagnostic recognition: task constraints, object information, and their
interactions. Cognition, 67(1-2), 147–179.
Smith, R. (1987). Experiences with the Alternate Reality Kit: An Example of the Tension between
Literalism and Magic. IEEE Computer Graphics and Applications, 7(9), 42–50.
Sutherland, Ivan Edward (September 2003), Sketchpad: A Man-Machine Graphical Communication
System(1963) - preface by Alan Blackwell and Kerry Roddenphone, University of Cambridge
.Tarr, M. J., & Gauthier, I. (1998). Do Viewpoint-Dependent Mechanisms Generalize Across Members
of a Class? Cognition, 67(1-2), 73–110.
TIOBE Software: Tiobe Index. (n.d.). Retrieved May 19, 2015, from http://www.tiobe.com/index.php/
content/paperinfo/tpci/index.html
Van Reeth, F., & Flerackers, E. (1993). Three-dimensional graphical programming in CAEL. In Visual
Languages, 1993., Proceedings 1993 IEEE Symposium on (pp. 389–391). IEEE. Retrieved from
http://ieeexplore.ieee.org/xpls/abs_all.jsp?arnumber=269554
Wolter, J. (2013). Specifying generic depictions of language constructs for 3D visual languages. In
Visual Languages and Human-Centric Computing (VL/HCC), 2013 IEEE Symposium on (pp.
139–142). IEEE. Retrieved from http://ieeexplore.ieee.org/xpls/abs_all.jsp?arnumber=6645258
Yates, F. (1966). The Art of Memory. University of Chicago Press, Chicago
�95
9.2.Works Consulted
Abelson, H., Sussman, G. J., & Sussman, J. (1996). Structure and Interpretation of Computer
Programs - 2nd Edition (second edition edition). Cambridge, Mass.: The MIT Press.
Burnett, M., Cao, N., & Atwood, J. (2000). Time in Grid-Oriented VPLs: Just Another Dimension? In
Visual Languages, 2000. Proceedings. 2000 IEEE International Symposium on (pp. 137–144).
IEEE. Retrieved from http://ieeexplore.ieee.org/xpls/abs_all.jsp?arnumber=874377
Ingalls, D., Wallace, S., Chow, Y.-Y., Ludolph, F., & Doyle, K. (1988). Fabrik: a visual programming
environment. In ACM SIGPLAN Notices (Vol. 23, pp. 176–190). ACM. Retrieved from http://
dl.acm.org/citation.cfm?id=62100
Ko, A. J., Myers, B., Rosson, M. B., Rothermel, G., Shaw, M., Wiedenbeck, S., … Lieberman, H.
(2011). The state of the art in end-user software engineering. ACM Computing Surveys, 43(3), 1–
44. http://doi.org/10.1145/1922649.1922658
Kramer, J.-P., Kurz, J., Karrer, T., & Borchers, J. (2014). How live coding affects developers’ coding
behavior. In Visual Languages and Human-Centric Computing (VL/HCC), 2014 IEEE Symposium
on (pp. 5–8). IEEE. Retrieved from http://ieeexplore.ieee.org/xpls/abs_all.jsp?arnumber=6883013
Neumann, J. V. (1966). Theory of Self-Reproducing Automata (First Edition edition). University of
Illinois Press.
�96

Osawa, N. (2005). Application of jigsaw-puzzle-like 3D glyph to visualizing grammatical constraints. In
Visual Languages and Human-Centric Computing, 2005 IEEE Symposium on (pp. 293–295).
IEEE. Retrieved from http://ieeexplore.ieee.org/xpls/abs_all.jsp?arnumber=1509519
Tarr, M. J., & Bülthoff, H. H. (Eds.). (1999). Object Recognition in Man, Monkey, and Machine (1st
edition). Cambridge, Mass: MIT Press.
�97