VINE: An Open Source Interactive Data Visualization Tool ...
6
VINE: An Open Source Interactive Data Visualization Tool for Neuroevolution Rui Wang, Jeff Clune, and Kenneth O. Stanley Uber AI Labs San Francisco, CA 94103 {ruiwang,jeffclune,kstanley}@uber.com ABSTRACT Recent advances in deep neuroevolution have demonstrated that evolutionary algorithms, such as evolution strategies (ES) and ge- netic algorithms (GA), can scale to train deep neural networks to solve difficult reinforcement learning (RL) problems. However, it remains a challenge to analyze and interpret the underlying process of neuroevolution in such high dimensions. To begin to address this challenge, this paper presents an interactive data visualization tool called VINE (Visual Inspector for NeuroEvolution) aimed at helping neuroevolution researchers and end-users better understand and explore this family of algorithms. VINE works seamlessly with a breadth of neuroevolution algorithms, including ES and GA, and addresses the difficulty of observing the underlying dynamics of the learning process through an interactive visualization of the evolving agent’s behavior characterizations over generations. As neuroevolution scales to neural networks with millions or more con- nections, visualization tools like VINE that offer fresh insight into the underlying dynamics of evolution become increasingly valuable and important for inspiring new innovations and applications. CCS CONCEPTS • Computing methodologies → Genetic algorithms; Neural networks; Artificial life; Evolutionary robotics; KEYWORDS Neuroevolution, visualization, deep learning ACM Reference Format: Rui Wang, Jeff Clune, and Kenneth O. Stanley. 2018. VINE: An Open Source Interactive Data Visualization Tool for Neuroevolution. In GECCO ’18 Companion: Genetic and Evolutionary Computation Conference Compan- ion, July 15–19, 2018, Kyoto, Japan. ACM, New York, NY, USA, 6 pages. https://doi.org/10.1145/3205651.3208236 1 INTRODUCTION Recent progress in deep neuroevolution [3, 7, 9–11] has shown that evolutionary algorithms, such as evolution strategies (ES) and ge- netic algorithms (GA), are capable of training deep neural networks Permission to make digital or hard copies of all or part of this work for personal or classroom use is granted without fee provided that copies are not made or distributed for profit or commercial advantage and that copies bear this notice and the full citation on the first page. Copyrights for components of this work owned by others than the author(s) must be honored. Abstracting with credit is permitted. To copy otherwise, or republish, to post on servers or to redistribute to lists, requires prior specific permission and/or a fee. Request permissions from [email protected]. GECCO ’18 Companion, July 15–19, 2018, Kyoto, Japan © 2018 Copyright held by the owner/author(s). Publication rights licensed to Associa- tion for Computing Machinery. ACM ISBN 978-1-4503-5764-7/18/07. . . $15.00 https://doi.org/10.1145/3205651.3208236 Figure 1: The Mujoco Humanoid Locomotion task. This benchmark is the basis of a number of examples in this pa- per and can be solved by both the ES and GA approaches to neuroevolution. [4] with millions or more parameters (weights) to solve difficult reinforcement learning (RL) problems. Figure 1 illustrates one such popular problem, Mujoco Humanoid Locomotion, which both ES and GA solve effectively [3, 9]. While it is possible to probe the properties of such algorithms, such as in recent investigations into the relationship of ES to finite- difference gradient approximation [6] and stochastic gradient de- scent [14], it is generally difficult to observe the underlying dy- namics of the learning process in neuroevolution and neural net- work optimization. To address this gap and open up the process to observation, we introduce the Visual Inspector for NeuroEvolu- tion (VINE), an interactive data visualization tool aimed at helping those who are interested in neuroevolution to better understand and explore its behavior. The source code for VINE is available at https://www.github.com/uber-common/deep-neuroevolution/ tree/master/visual_inspector. We hope this technology will inspire new understanding, innovations, and applications of neuroevolu- tion in the future. VINE can illuminate both ES- and GA-style approaches. In this paper, we focus on visualizing the result of applying ES to the Mujoco Humanoid Locomotion [2, 12] task from Figure 1. 2 USING VINE In the conventional application of the version of ES popularized by OpenAI [10], a group of neural networks called the pseudo- offspring cloud are optimized against an objective over generations.
Transcript of VINE: An Open Source Interactive Data Visualization Tool ...

VINE: An Open Source Interactive Data Visualization Tool forNeuroevolution
Rui Wang, Jeff Clune, and Kenneth O. StanleyUber AI Labs
San Francisco, CA 94103{ruiwang,jeffclune,kstanley}@uber.com
ABSTRACTRecent advances in deep neuroevolution have demonstrated thatevolutionary algorithms, such as evolution strategies (ES) and ge-netic algorithms (GA), can scale to train deep neural networks tosolve difficult reinforcement learning (RL) problems. However, itremains a challenge to analyze and interpret the underlying processof neuroevolution in such high dimensions. To begin to address thischallenge, this paper presents an interactive data visualization toolcalled VINE (Visual Inspector for NeuroEvolution) aimed at helpingneuroevolution researchers and end-users better understand andexplore this family of algorithms. VINE works seamlessly with abreadth of neuroevolution algorithms, including ES and GA, andaddresses the difficulty of observing the underlying dynamics ofthe learning process through an interactive visualization of theevolving agent’s behavior characterizations over generations. Asneuroevolution scales to neural networks withmillions or more con-nections, visualization tools like VINE that offer fresh insight intothe underlying dynamics of evolution become increasingly valuableand important for inspiring new innovations and applications.
CCS CONCEPTS• Computing methodologies → Genetic algorithms; Neuralnetworks; Artificial life; Evolutionary robotics;
KEYWORDSNeuroevolution, visualization, deep learningACM Reference Format:Rui Wang, Jeff Clune, and Kenneth O. Stanley. 2018. VINE: An Open SourceInteractive Data Visualization Tool for Neuroevolution. In GECCO ’18Companion: Genetic and Evolutionary Computation Conference Compan-ion, July 15–19, 2018, Kyoto, Japan. ACM, New York, NY, USA, 6 pages.https://doi.org/10.1145/3205651.3208236
1 INTRODUCTIONRecent progress in deep neuroevolution [3, 7, 9–11] has shown thatevolutionary algorithms, such as evolution strategies (ES) and ge-netic algorithms (GA), are capable of training deep neural networks
Permission to make digital or hard copies of all or part of this work for personal orclassroom use is granted without fee provided that copies are not made or distributedfor profit or commercial advantage and that copies bear this notice and the full citationon the first page. Copyrights for components of this work owned by others than theauthor(s) must be honored. Abstracting with credit is permitted. To copy otherwise, orrepublish, to post on servers or to redistribute to lists, requires prior specific permissionand/or a fee. Request permissions from [email protected] ’18 Companion, July 15–19, 2018, Kyoto, Japan© 2018 Copyright held by the owner/author(s). Publication rights licensed to Associa-tion for Computing Machinery.ACM ISBN 978-1-4503-5764-7/18/07. . . $15.00https://doi.org/10.1145/3205651.3208236
Figure 1: The Mujoco Humanoid Locomotion task. Thisbenchmark is the basis of a number of examples in this pa-per and can be solved by both the ES and GA approaches toneuroevolution.
[4] with millions or more parameters (weights) to solve difficultreinforcement learning (RL) problems. Figure 1 illustrates one suchpopular problem, Mujoco Humanoid Locomotion, which both ESand GA solve effectively [3, 9].
While it is possible to probe the properties of such algorithms,such as in recent investigations into the relationship of ES to finite-difference gradient approximation [6] and stochastic gradient de-scent [14], it is generally difficult to observe the underlying dy-namics of the learning process in neuroevolution and neural net-work optimization. To address this gap and open up the processto observation, we introduce the Visual Inspector for NeuroEvolu-tion (VINE), an interactive data visualization tool aimed at helpingthose who are interested in neuroevolution to better understandand explore its behavior. The source code for VINE is availableat https://www.github.com/uber-common/deep-neuroevolution/tree/master/visual_inspector. We hope this technology will inspirenew understanding, innovations, and applications of neuroevolu-tion in the future.
VINE can illuminate both ES- and GA-style approaches. In thispaper, we focus on visualizing the result of applying ES to theMujoco Humanoid Locomotion [2, 12] task from Figure 1.
2 USING VINEIn the conventional application of the version of ES popularizedby OpenAI [10], a group of neural networks called the pseudo-offspring cloud are optimized against an objective over generations.

GECCO ’18 Companion, July 15–19, 2018, Kyoto, Japan Rui Wang, Jeff Clune, and Kenneth O. Stanley
The parameters of each individual neural network in the cloud aregenerated by randomly perturbing the parameters of a single “par-ent” neural network. Each pseudo-offspring neural network is thenevaluated against the objective: in the Humanoid Locomotion task,each pseudo-offspring neural network controls the movement of arobot, and earns a score called its fitness based on how well it walks.The ES constructs the next parent by aggregating the parametersof pseudo-offspring based on these fitness scores (almost like asophisticated form of multi-parent crossover, and also reminiscentof stochastic finite differences). The cycle then repeats. The fulldetails of this technique are formalized in [10].
To take advantage of VINE, behavior characterizations (BCs)[8] for each parent and all pseudo-offspring are recorded duringevaluation. Here, a BC can be any property of the agent’s behaviorwhen interacting with its environment. For example, in the MujocoHumanoid Locomotion task we simply use the agent’s final {x, y}location as the BC, which indicates how far the agent has movedaway from the origin and to what location.
The visualization tool then maps parents and pseudo-offspringonto 2D planes according to their BCs. For that purpose, it invokesa graphical user interface (GUI), whose major components consistof two types of interrelated plots: one or more pseudo-offspringcloud plots (on separate 2D planes), and one fitness plot. Illustratedin Figure 2, a pseudo-offspring cloud plot displays the BCs forthe parent and pseudo-offspring in the cloud for every generation,while a fitness plot displays the parent’s fitness score curve as akey indicator of progress over generations.
Users then interact with these plots to explore the overall trendof the pseudo-offspring cloud as well as the individual behaviorsof any parent or pseudo-offspring over the evolutionary process:(1) users can visualize parents, top performers, and/or the entirepseudo-offspring cloud of any given generation, and explore thequantitative and spatial distribution on the 2D BC plane of pseudo-offspring with different fitness scores; (2) users can compare be-tween generations, navigate through generations to visualize howthe parent and/or the pseudo-offspring cloud is moving on the 2DBC plane, and how such moves relate to the fitness score curve(as illustrated in Figure 3, a full movie clip of the moving cloudcan be generated automatically); (3) clicking on any point on thecloud plot reveals behavioral information and the fitness score ofthe corresponding pseudo-offspring.
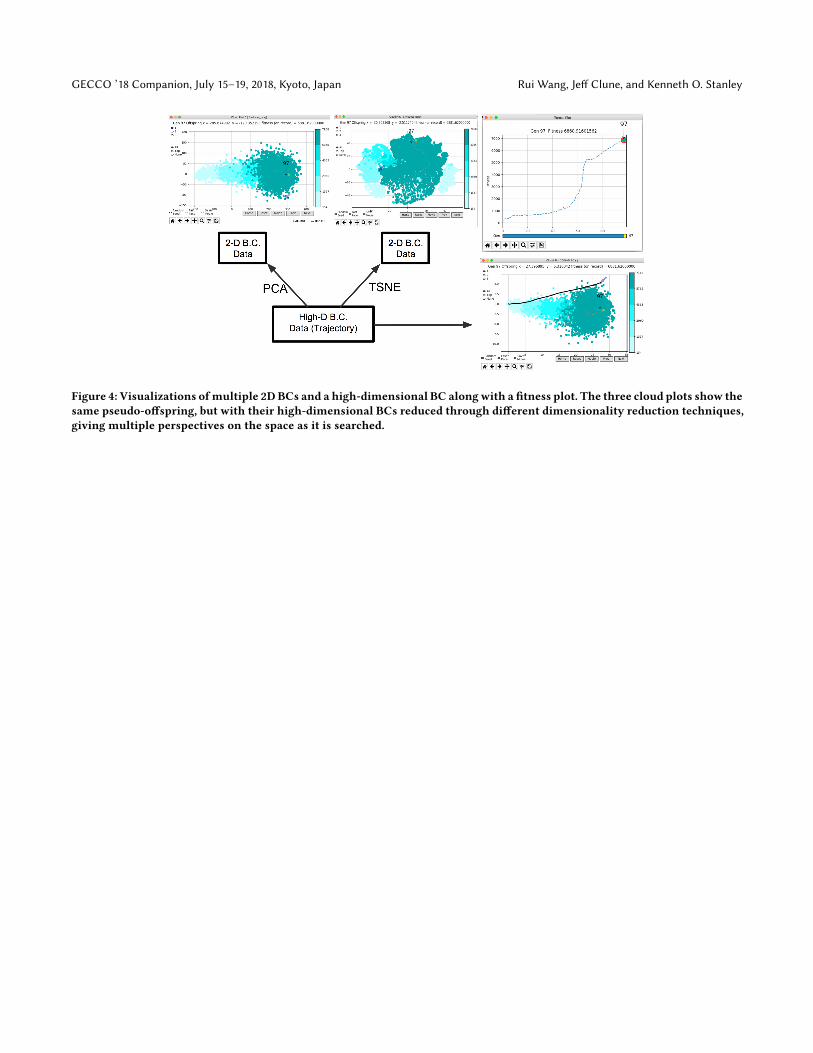
3 ADDITIONAL USE CASESThe tool also supports advanced options and customized visualiza-tions beyond the default features. For example, instead of just asingle final {x, y} point, the BC could instead be each agent’s fulltrajectory (e.g., the concatenated {x, y} for 1,000 time steps). In thatcase, where the dimensionality of the BC is above two, dimension-ality reduction techniques (such as Principal Components Analysis(PCA) [5] or t-Distributed Stochastic Neighbor Embedding (t-SNE)[13]) are needed to reduce the dimensionality of BC data to 2D. Ourtool automates these dimensionality-reduction procedures.
The GUI is capable of loading multiple sets of 2D BCs (perhapsgenerated through different reduction techniques) and displayingthem in simultaneous and connected cloud plots, as demonstratedin Figure 4. This capability provides a convenient way for users to
0 5 10 15 20 25 30 35
−10.0
−7.5
−5.0
−2.5
0.0
2.5
5.0
7.5
66
97
Home Reset Movie Prev NextRandomSeed
FastPace
SaveMovie
123
AllTopNone
154
1560
2966
4372
5778
7184
Gen 97 Parent x = 27.122312 y = -1.911087 fitness (on record) = 6860.91601562
(a) Cloud Plot
60 65 70 75 80 85 90 95
3000
4000
5000
6000
7000
Fitn
ess
66
97Gen 97 Fitness 6860.91601562
Gen 97
(b) Fitness Plot
Figure 2: Examples of a pseudo-offspring cloud plot and afitness plot.
explore different BC choices and dimensionality reduction methods.Furthermore, users can also extend the basic visualization withcustomized functionality. Figure 4 exhibits one such customizedcloud plot that can display certain types of domain-specific high-dimensional BCs (in this case, an agent’s full trajectory) togetherwith the corresponding reduced 2D BCs. Another example of acustomized cloud plot, in Figure 5, allows the user to replay theagent’s deterministic or stochastic behavior that results when itinteracts with an environment.
The tool is also designed to work with domains other than loco-motion tasks. Figure 6 demonstrates a cloud plot that visualizes ESagents trained to play Frostbite, one of the Atari 2600 games [1],where we use the final emulator RAM state (integer-valued vectorsof length 128 that capture all the state variables in a game) as theBC and apply PCA to map the BC onto a 2D plane.
The plot shows that as evolution progresses, the pseudo-offspringcloud shifts towards the left and clusters there. The ability to see thecorresponding video of each of these agents playing the game letsus infer that each cluster corresponds to semantically meaningfuland distinct end states.

VINE: An Open Source Interactive Data Visualization Tool for Neuroevolution GECCO ’18 Companion, July 15–19, 2018, Kyoto, Japan
(a) Video snapshot at Generation 81
(b) Video snapshot at Generation 116
(c) Video snapshot at Generation 397
Figure 3: Frames taken from a VINE-generated video vi-sualizing the evolution of behaviors over generations inHumanoid Walking. The color changes in each generation.Within a generation, the color intensity of each pseudo-offspring is based on the percentile of its fitness score in thatgeneration (aggregated into five bins). The position of eachpoint corresponds to the endpoint of an individual walker(which was the BC in this example).
VINE also works seamlessly with other neuroevolution algo-rithms such as GAs, which maintain a population of offspring overgenerations. In fact, the tool works independently of any specificneuroevolution algorithm. Users only need to slightly modify theirneuroevolution code to save the BCs they pick for their specificproblems. In the code release, we provide such modifications to ourES and GA implementations as examples.
4 CONCLUSIONBecause evolutionary methods operate over a set of points, theypresent an opportunity for new types of visualization. Having im-plemented a tool that provides visualizations we found useful, wewanted to share it with the machine learning community so all canbenefit. As neuroevolution scales to neural networks with millionsor more connections, gaining additional insight through tools likeVINE is increasingly valuable and important for further progress.
ACKNOWLEDGEMENTSWe thank Uber AI Labs, in particular Joel Lehman, Xingwen Zhang,Felipe Petroski Such, and Vashisht Madhavan for valuable sugges-tions and helpful discussions.
REFERENCES[1] Bellemare, M. G., Naddaf, Y., Veness, J., and Bowling, M. (2013). The arcade learningenvironment: An evaluation platform for general agents. J. Artif. Intell. Res.(JAIR),47:253–279.
[2] Brockman, G., Cheung, V., Pettersson, L., Schneider, J., Schulman, J., Tang, J., andZaremba, W. (2016). Openai gym. arXiv preprint arXiv:1606.01540.
[3] Conti, E., Madhavan, V., Petroski Such, F., Lehman, J., Stanley, K. O., and Clune, J.(2017). Improving exploration in evolution strategies for deep reinforcement learningvia a population of novelty-seeking agents. arXiv preprint arXiv:1712.06560.
[4] Goodfellow, I., Bengio, Y., and Courville, A. (2016). Deep learning. MIT press.[5] Hotelling, H. (1933). Analysis of a complex of statistical variables into principalcomponents. Journal of Educational Psychology, 24:417–441.
[6] Lehman, J., Chen, J., Clune, J., and Stanley, K. O. (2017a). ES is more than just atraditional finite-difference approximator. arXiv preprint arXiv:1712.06568.
[7] Lehman, J., Chen, J., Clune, J., and Stanley, K. O. (2017b). Safe mutations fordeep and recurrent neural networks through output gradients. arXiv preprintarXiv:1712.06563.
[8] Lehman, J. and Stanley, K. O. (2011). Abandoning objectives: Evolution throughthe search for novelty alone. Evolutionary computation, 19(2):189–223.
[9] Petroski Such, F., Madhavan, V., Conti, E., Lehman, J., Stanley, K. O., and Clune,J. (2017). Deep neuroevolution: Genetic algorithms are a competitive alterna-tive for training deep neural networks for reinforcement learning. arXiv preprintarXiv:1712.06567.
[10] Salimans, T., Ho, J., Chen, X., Sidor, S., and Sutskever, I. (2017). Evolution Strate-gies as a Scalable Alternative to Reinforcement Learning. ArXiv e-prints, 1703.03864.
[11] Stanley, K. O. (2017). Neuroevolution: A different kind of deep learning. O’ReillyOnline, July 13.
[12] Todorov, E., Erez, T., and Tassa, Y. (2012). Mujoco: A physics engine for model-based control. In IROS, pages 5026–5033. IEEE.
[13] van der Maaten, L. and Hinton, G. (2008). Visualizing high-dimensional datausing t-SNE. The Journal of Machine Learning Research, 9(Nov):2579–2605.
[14] Zhang, X., Clune, J., and Stanley, K. O. (2017). On the relationship between the ope-nai evolution strategy and stochastic gradient descent. arXiv preprint arXiv:1712.06564.
GECCO ’18 Companion, July 15–19, 2018, Kyoto, Japan Rui Wang, Jeff Clune, and Kenneth O. Stanley
Figure 4: Visualizations ofmultiple 2DBCs and a high-dimensional BC alongwith a fitness plot. The three cloud plots show thesame pseudo-offspring, but with their high-dimensional BCs reduced through different dimensionality reduction techniques,giving multiple perspectives on the space as it is searched.

VINE: An Open Source Interactive Data Visualization Tool for Neuroevolution GECCO ’18 Companion, July 15–19, 2018, Kyoto, Japan
(a) Right click a pseudo-offspring to invoke nine stochastic roll-outs.
(b) Right click one of the trajectories as a result of nine roll-outs.
(c) Visualize the agent’s behavior that corresponds to the trajectory in (b).
Figure 5: Users can view videos of any agent’s deterministic and stochastic behaviors through a video pop-up (at bottom).

GECCO ’18 Companion, July 15–19, 2018, Kyoto, Japan Rui Wang, Jeff Clune, and Kenneth O. Stanley
Figure 6: Visualizing agents learning to play Frostbite. Each point is a 2D reduction of a high-dimensional representation ofthe end-state of the game for a particular psuedo-offpsring. Users can click on any point to see the rollout of the game thatleads to this endpoint, revealing the underlying semantics of the space.