VILNIUS UNIVERSITY Donatas Noreika TEMPORAL FEATURES OF ...
24
VILNIUS UNIVERSITY Donatas Noreika TEMPORAL FEATURES OF BINOCULAR RIVALRY AND PERCEPTION OF AMBIGUOUS FIGURES Summary of doctoral dissertation Social sciences, psychology (06 S) Vilnius, 2010
Transcript of VILNIUS UNIVERSITY Donatas Noreika TEMPORAL FEATURES OF ...

VILNIUS UNIVERSITY
Donatas Noreika
TEMPORAL FEATURES OF BINOCULAR RIVALRY AND PERCEPTION OF
AMBIGUOUS FIGURES
Summary of doctoral dissertation
Social sciences, psychology (06 S)
Vilnius, 2010
The dissertation was prepared in 2006 – 2010 at Vilnius University
Scientific supervisor:
prof. habil. dr. Henrikas Vaitkevičius (Vilnius University, social sciences, psychology, 06S)
The dissertation will be defended in the council of psychological science at Vilnius University:
Chairman:
prof. dr. Albinas Bagdonas – (Vilnius University, social sciences, psychology, 06S)
Members:
assoc. prof. dr. Dalia Bagdžiūnienė (Vilnius University, social sciences, psychology, 06S)
prof. habil. dr. Algis-Povilas Bertulis-Čerkelis (Lithuanian University of Health Sciences,
biomedical sciences, biophysics – 02B)
doc. dr. Aušra Daugirdienė (Vilnius Pedagogical University, social sciences, psychology – 06S)
prof. dr. Osvaldas Rukšėnas (Vilnius University, biomedical sciences, biophysics – 02B)
Opponents:
doc. dr. Vaclovas Martišius (Vytautas Magnus University, social sciences, psychology – 06S)
dr. Alvydas Šoliūnas (Vilnius University, biomedical sciences, biology – 01B)
The official defence of the dissertation will take place at the public session of the Council of
Psychology Science in the Conference Hall of the Faculty of Philosophy of Vilnius University
(room No. 201) at 2 p.m. on December 17, 2010.
Address: Universiteto str. 9/1, Vilnius, LT-01513
The summary of the dissertation was sent out on ________
The dissertation is available at the library of Vilnius University
VILNIAUS UNIVERSITETAS
Donatas Noreika
AKIŲ KONKURENCIJOS IR DVIPRASMIŲ FIGŪRŲ SUVOKIMO LAIKINĖS
SAVYBĖS
Daktaro disertacijos santrauka
Socialiniai mokslai, psichologija (06 S)
Vilnius, 2010
Disertacija rengta 2006 – 2010 metais Vilniaus universitete
Mokslinis vadovas:
prof. habil. dr. Henrikas Petras Vaitkevičius (Vilniaus universitetas, socialiniai mokslai,
psichologija – 06 S)
Disertacija bus ginama Vilniaus universiteto psichologijos krypties taryboje:
Pirmininkas:
prof. dr. Albinas Bagdonas – tarybos pirmininkas (Vilniaus universitetas, socialiniai mokslai,
psichologija – 06S)
Nariai:
doc. dr. Dalia Bagdžiūnienė (Vilniaus universitetas, socialiniai mokslai, psichologija – 06S).
prof. habil. dr. Algis-Povilas Bertulis-Čerkelis (Lietuvos sveikatos mokslų universitetas,
biomedicinos mokslai, biofizika – 02B).
doc. dr. Aušra Daugirdienė (Vilniaus pedagoginis universitetas, socialiniai mokslai, psichologija
– 06S).
prof. dr. Osvaldas Rukšėnas (Vilniaus universitetas, biomedicinos mokslai, biofizika – 02B).
Oponentai:
doc. dr. Vaclovas Martišius (Vytauto Didžiojo universitetas, socialiniai mokslai, psichologija –
06S).
dr. Alvydas Šoliūnas (Vilniaus universitetas, biomedicinos mokslai, biologija – 01B).
Disertacija bus ginama viešame psichologijos mokslo krypties tarybos posėdyje, kuris įvyks
2010 m. gruodžio 17 d. 14 val. Vilniaus universiteto Filosofijos fakulteto konferencijų salėje
(201 aud.). Adresas: Universiteto g. 9/1, Vilnius, LT-01513
Disertacijos santrauka išsiuntinėta __________
Disertaciją galima peržiūrėti Vilniaus universiteto bibliotekoje
5
INTRODUCTION
The research problem and scientific novelty of the study
Bistable (multistable) perception is a phenomenon of cognition when the subjective
perception of a person is periodically alternating, while the physical stimulus remains stable.
The phenomenon is applied for various research themes in perception and consciousness, and
enjoys a growing interest in recent years. Different forms of bistable perception has been
described: figure-ground alternations (e.g. vase – faces), apparent 3D objects (e.g. Necker cube),
monocular rivalry, binocular rivalry and so on. (Blake, Logothetis, 2002; Osaka et al., 2010).
Binocular rivalry and ambiguous figures have been the most popular tool of the studies. Though
quite a lot of research has been conducted, the question whether different forms of bistability are
based on the same physiological mechanisms is still left open.
Not only bistable perception is interesting on its own right (notice its frequent use in art,
e.g. M.C. Escher, S. Dali, various painters of 18th century), but it also attracts researchers as a
tool for investigation of characteristics of perception. Seeming so striking in bistable perception
(like abrupt changes of interpretations), the processes are supposedly common in everyday
situations; just they are more vivid and tangible in case of bistability. Some level of ambiguity is
common to all sensory stimulation, therefore the reconstruction of a visual scene, based on the
pattern of active receptors in retina, is rarely completely unproblematic. Some authors think that
eye movements and temporally distributed allocation of visual attention create periodic
fluctuations in information processing efficacy, similar to the dominance – suppression cycle
observed during bistable perception (Leopold and Logothetis, 1999; Mitchell et al., 2004).
Bistable perception is convienient for investigating various characteristics of perception
as its temporal dynamics are responsive to even small changes in stimulus attributes. Even if
minor aspects of physical stimulation are altered (i.e., decreased illumination, shortened
presentation time, transference of the stimulus from the centre of the retina to the periphery
etc.), we will notice changes in easily detectable characteristics of perception (e.g. lengthening
of the average dominance time of one of the interpretations) (Blake, Logothetis, 2002). Due to
this aspect, bistable perception is often used for exploring various aspects of perception.
Along with giving insights about fundamental principles of vision, the mechanisms of
bistable perception are also applicable for creating devices for stereovision, vision prosthesis
and diagnosing diseases (Pachidis, Lygouras, 2005; Miller et al., 2010). The phenomenon of
binocular rivalry is important for creating transparent or semi-transparent monitors (Patterson et
6
al., 2007). The results of binocular rivalry research help to construct the monitors in such a way
that the possibility of binocular rivalry occurrence would be reduced, as binocular rivalry may
prevent seeing important parts of visual images either at the monitor, or in a visual scene.
Bistable perception is an example of sought-after cognitive situations, giving aid to
objectively differentiate conscious perception from the physical stimulation. Although the
physical stimulation is constant, the subjective perception is unceasingly alternating between
available interpretations. It is possible to trace this alternation in a precise way, for example by
means of giving the subject an instruction to push separate buttons while seeing one and the
other interpretation. At the same time, brain imaging methods might be used to trace changes in
brain activation, which are possibly correlating with the times of button presses. This possibility
is the reason why bistable perception is often used for researching neural correlates of
consciousness.
Bistable perception is a common illustration of the rhythmic (cyclic) nature of cognitive
processes: although the physical stimulus remains constant, the interpretation of the visual
images alternates every few seconds. The causes of these cyclical alternations are not agreed
upon. The cyclical nature of neuron activity in millisecond range, however, is quite widely
described. There are refractory periods in the activity cycle of neurons, and the bursts of
separate neurons are inter-adjusted for synchronicity, and these processes cause cyclical
fluctuations of activity in the brain. Supposedly, the synchronization of separate neuronal
ensembles is an important or even the main mechanism for combining the perceived objects into
wholes (Sauve, 1999; Nikolaev et al., 2010).
Although in theoretical models bistable perception is often associated with millisecond-
order cyclical processes in the nervous system (Tong et al., 1998; Shpiro et al., 2007), there are
not many experimental inquiries to directly connect those processes and the alternations of
bistable perception. Should there be experimental proofs of a direct link between cyclical
fluctuations of sensitivity in the nervous system and the cycles of bistable perception, it could
contribute a lot to understanding of the mechanism and functional significance of both process
groups.
A number of theoretical models have been proposed to explain the mechanism of
bistable perception; yet, none of them is widely accepted (Freeman, 2005; Koene, 2006; Laing,
Carson, 2002; Moreno-Bote et al, 2007; Stollenwerk, Bode, 2003 et al.). An experiment to
explore the influence of millisecond-order processes upon the dominance phases of bistable
perception would help to evaluate the theoretical models and provide insight on how the
7
rhythmic process is involved in bistable perception.
The matter under investigation is closely linked to the problem of discrete vs. continuous
perception. The theory of discrete perception holds that perception occurs not evenly, but in
steps. Bistable perception is a nice example to illustrate that perception may sometimes be not
continuous, but to abruptly reverse every few seconds. If the theory of discreet perception is
correct, the periods of bistable perception may be multiples of the smallest perceptual units
(“perceptual quanta”). This hypothesis could be tested by an experiment, with stimuli presented
in discrete time moments rather than continuously, and with the presentation duration
systematically changing. This type of inquiry would contribute to arriving at an answer whether
the periods of bistable perception are composed of smaller discrete units.
The aim of the study
To assess the influence of the flashing rate of the stimuli on the temporal dynamics of
binocular rivalry and perception of ambiguous figures.
The objectives of the study
1. To create a method that could enable to present two independently controlled flashing
stimuli to the left and to the right eye of a subject.
2. To establish if there is dependence between binocular rivalry dominance duration and the
flashing rate of the stimuli.
3. To compare the temporal dynamics of binocular rivalry when counter-phase and sin-
phase (synchronous) stimuli are presented.
4. To explore the influence of flashing rate of the stimuli on the temporal dynamics of
ambiguous figure perception.
5. To examine the temporal stability of mean dominance durations in several minutes, an
hour and several days.
Thesis defended
1. The technical equipment and software that were created for the study enable to present
the stimuli with a precision of 5 µs, which makes it a suitable method for investigating
the temporal features of binocular rivalry and ambiguous figure perception.
2. Mean dominance durations of binocular rivalry differ in a significant way if measured
while presenting flashing stimuli of various rates. The number of dominance duration
8
extremums in the 7 – 11 ms interval differs significantly from the number of extremums
in other intervals (4 – 6 ms and 12 – 30 ms).
3. Instability is common to binocular rivalry dominance durations, i.e. the values of
dominance durations fluctuate within 1 – 2 s if measured at different moments within
several minutes, one hour and several days.
4. More than one factor governs changes of mean dominance durations of binocular rivalry.
THEORETICAL BACKGROUND
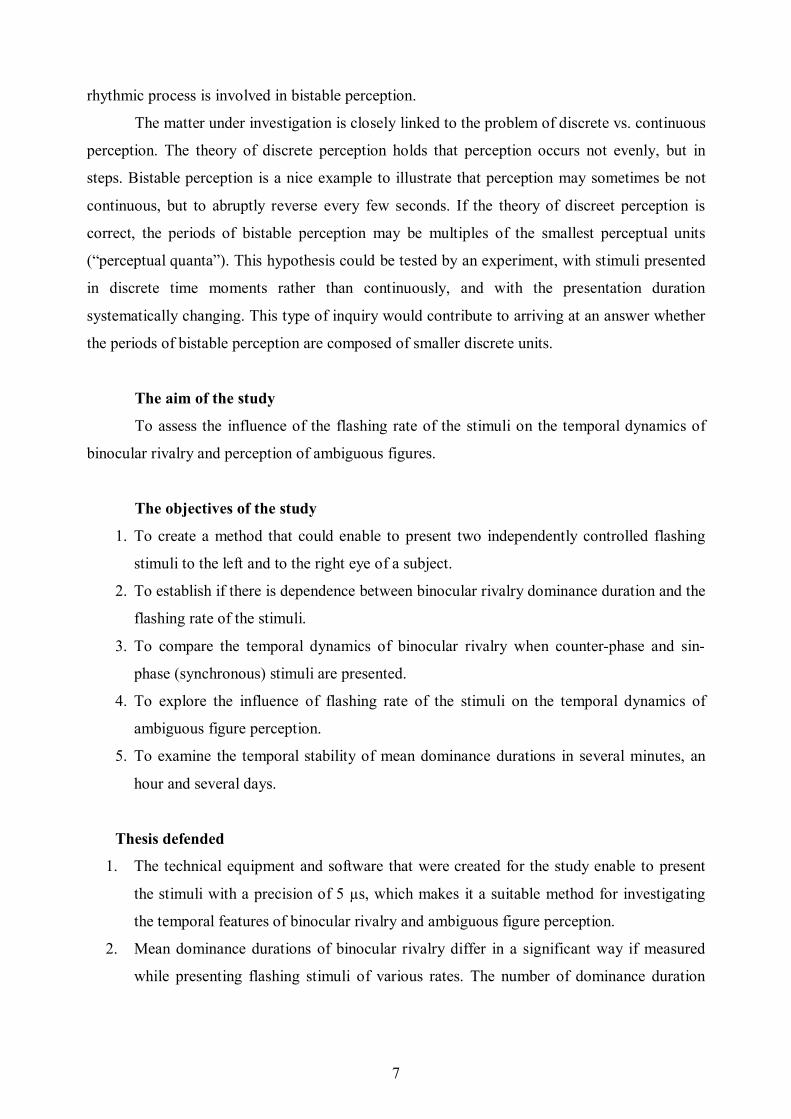
Binocular rivalry is a phenomenon of perception when the conscious perception is
continually switching between two different images, presented to the left and to the right eye
(Fig. 1).
Fig. 1. An example of binocular rivalry stimuli. The left stimulus is presented to the left eye, the right one – to the
right.
The phenomenon of binocular rivalry occurs when the corresponding sites of the left
eye’s and right eye’s retina receives incompatible images. In contrast to the situation of common
vision, the images start to seemingly rival between themselves: the viewer sees one image at a
time, and then the perception switches to the other image, and this sequence of events repeats
for as long as one continues to look.
Ambiguous figures are images with two (or more) equally possible interpretations (Fig.
2). In this case, identical images are presented to both eyes, but possible interpretations of the
viewed image rival between themselves.

9
a) b) c) Fig. 2. Examples of ambiguous figures. a) Rubin’s vase – faces; b) the Necker cube; c) swan – squirrel. While
viewing the images for prolonged durations, one sees either one or the other interpretation, and the interpretations
steadily change each other.
It is still under debate, whether binocular rivalry and perception of ambiguous figures are
governed by the same neuronal mechanisms. Most often, binocular rivalry is explained similarly
as are other forms of bistability, yet a few other factors may play a role in this case, like
predominance of one of the hemispheres, faculties of spatial vision et al. (Blake, Logothetis,
2002; Sterzer et al., 2009).
Binocular rivalry and ambiguous figure perception may by considered as examples of
discrete perception. Rather than shifting gradually, the perception totally transforms every few
seconds in these cases. Although the physical stimulus stays the same, the subject sees either
one or the other interpretation of the image, and the other interpretation may be totally “out of
existence” at that time. The perception vacillates every few seconds and although some
transitional waves exist, mediating the transition from one interpretation to the other (Wilson et
al., 2001), the transitional period lasts only a part of a second, and during the rest of the time, the
subject sees one of the images, totally not seeing the other. This aspect interrelates bistable
perception with wider problems of discrete perception and temporally uneven effectiveness of
information processing in the nervous system.
Neuronal refractory periods and synchronization of the activity of separate neuronal
ensembles make information processing in the nervous system temporally uneven. If the
perceived information is presented at a moment when the nervous system is ready to process it,
the processing will be immediate and effective. These changes in the efficacy of information
processing are in the order of milliseconds and therefore it is hard to investigate it. The temporal
resolution of the contemporary brain imaging methods is usually not sufficient for a precise
record of the neuronal processing fluctuations. One of the possible ways to investigate the
millisecond-order fluctuations of information processing is to present periodical stimuli with
10
exactly controlled flashing rate and to assess whether the flashing rate influences the efficacy of
information processing. There are not many experiments in which millisecond-order periodic
stimuli would be used, and the findings of the studies are contradictory (van Boxtel et al., 2008;
Logothetis et al, 1996; Brascamp et al., 2007; Knapen et al., 2007).
Considering the relevance of this type of a study and the results of the conducted
experiments, we constructed equipment, enabling to present visual stimuli, flashing in
millisecond-range, and examined, whether the flashing rate of the stimuli effects the dominance
durations of binocular rivalry and ambiguous stimulus perception.
METHODS
Subjects
6 male subjects took part in the experiments, mean age – 34.3 y., standard deviation –
15,38, vision normal or corrected to normal. The subjects were staff workers or students at the
Psychophysiology laboratory at Vilnius University and had at least minimal experience of
taking part in psychophysical experiments.
Stimuli
Two types of stimuli were used in the experiments: for binocular rivalry experiments –
two round stimuli of different configurations and for ambiguous figure experiments – the
Necker cube. A special projector was constructed to present the stimuli in such a way, that,
although projected to each eye separately, the stimuli would be seen in one place in space.
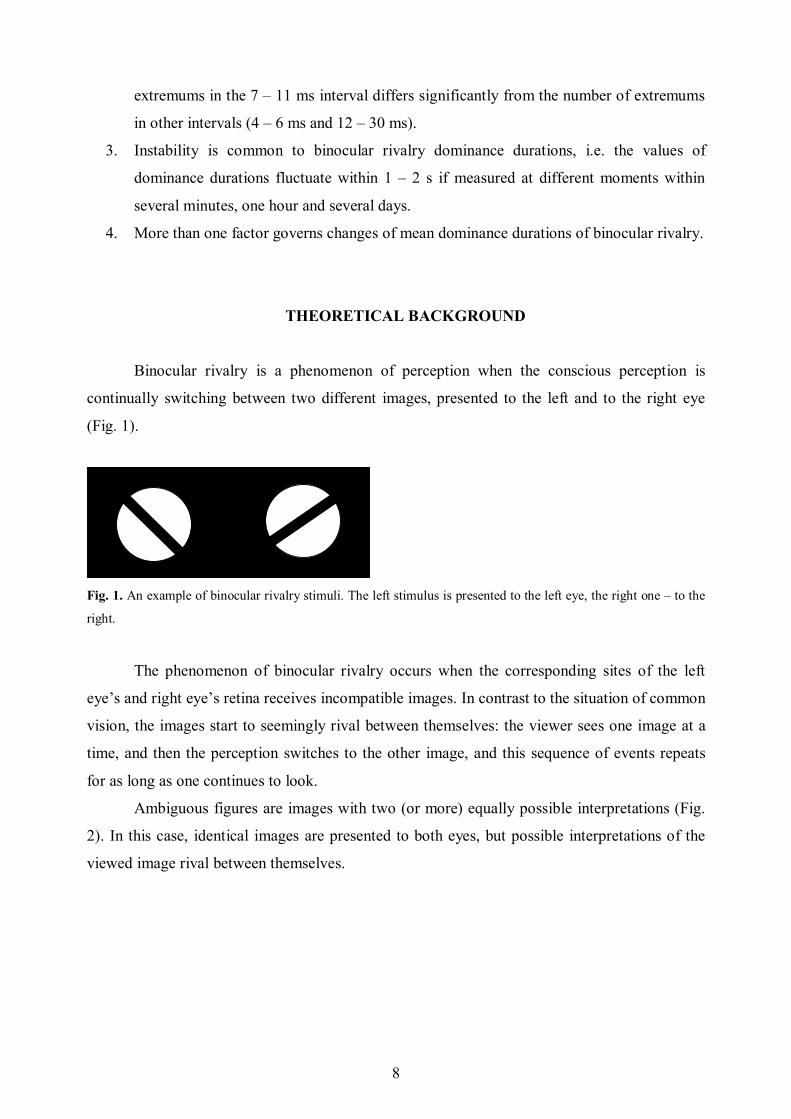
In binocular rivalry experiments two different stimuli (1.7° in diameter), were presented
separately to each eye (Fig. 3). The stimuli were composed of black bars (0.6° in width, tilt
±45°), intersecting white circles (brightness – 0.2 cd/m2). The contrast was 0.9.
Fig. 3. Binocular rivalry stimuli: a) image, presented to the right eye; b) image, presented to the left eye.
11
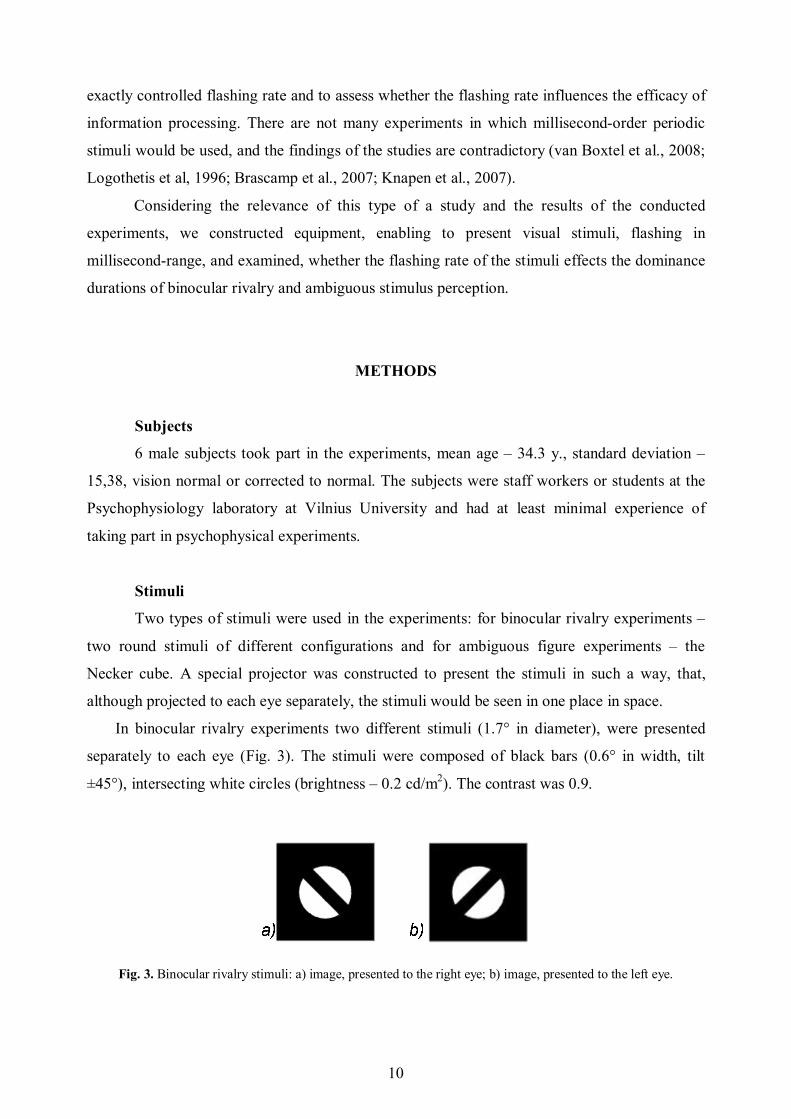
In the Necker cube experiments the same two images of a 3D cube were presented to
both eyes, image size 4,91 degrees of visual angle, brightness 0,2 cd/m2 (Fig. 4).
Fig. 4. Stimuli of the ambiguous figure experiment. The left stimulus was presented to the left eye, the right
stimulus – to the right eye (the stimuli identical). The cross – a mark for eye fixation.
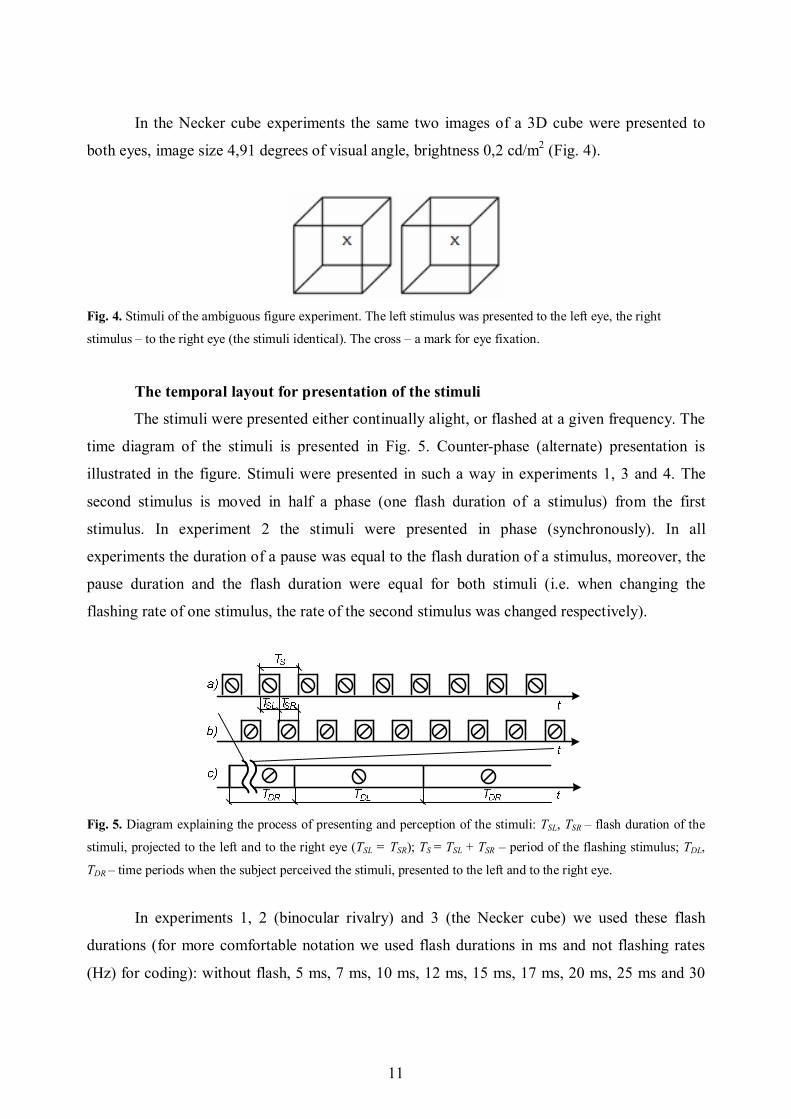
The temporal layout for presentation of the stimuli
The stimuli were presented either continually alight, or flashed at a given frequency. The
time diagram of the stimuli is presented in Fig. 5. Counter-phase (alternate) presentation is
illustrated in the figure. Stimuli were presented in such a way in experiments 1, 3 and 4. The
second stimulus is moved in half a phase (one flash duration of a stimulus) from the first
stimulus. In experiment 2 the stimuli were presented in phase (synchronously). In all
experiments the duration of a pause was equal to the flash duration of a stimulus, moreover, the
pause duration and the flash duration were equal for both stimuli (i.e. when changing the
flashing rate of one stimulus, the rate of the second stimulus was changed respectively).
Fig. 5. Diagram explaining the process of presenting and perception of the stimuli: TSL, TSR – flash duration of the
stimuli, projected to the left and to the right eye (TSL = TSR); TS = TSL + TSR – period of the flashing stimulus; TDL,
TDR – time periods when the subject perceived the stimuli, presented to the left and to the right eye.
In experiments 1, 2 (binocular rivalry) and 3 (the Necker cube) we used these flash
durations (for more comfortable notation we used flash durations in ms and not flashing rates
(Hz) for coding): without flash, 5 ms, 7 ms, 10 ms, 12 ms, 15 ms, 17 ms, 20 ms, 25 ms and 30
12
ms. In experiment 4 we used stimuli from a narrower interval – 4 through 20 ms, changing the
flash durations in 1 ms step (17 flash durations altogether). The flash duration in each session
was constant, and the order of presenting flash durations was random in all experiments.
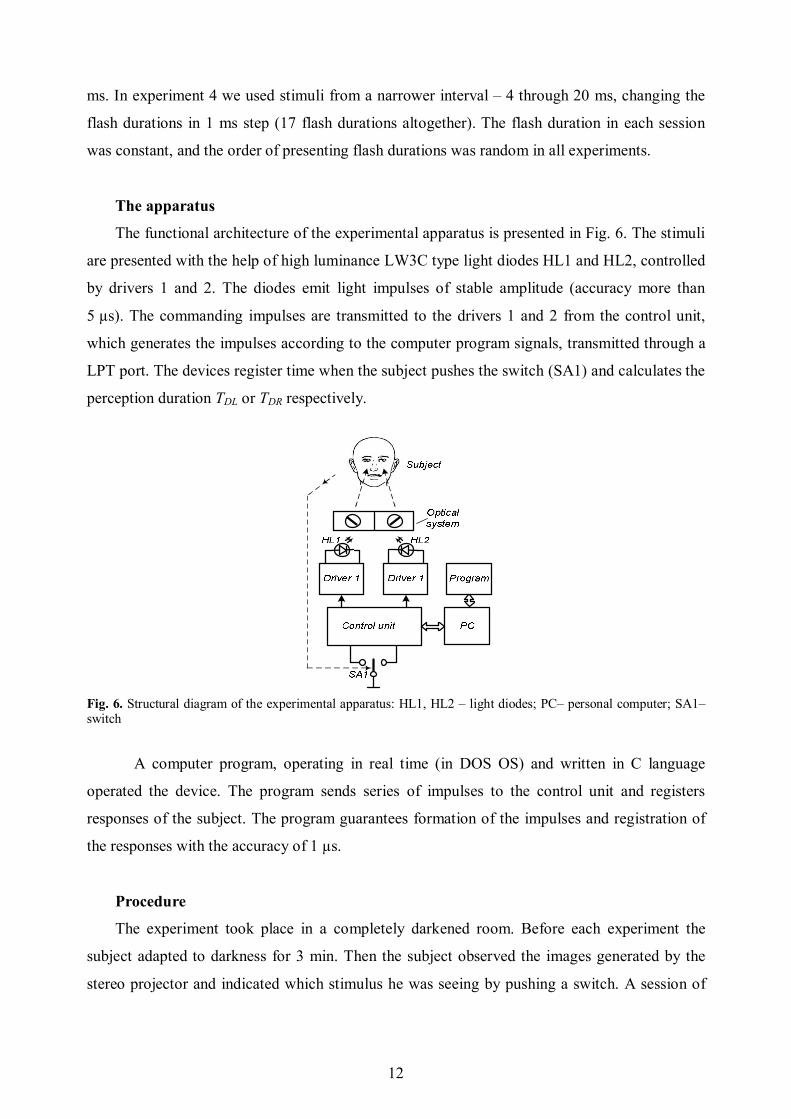
The apparatus
The functional architecture of the experimental apparatus is presented in Fig. 6. The stimuli
are presented with the help of high luminance LW3C type light diodes HL1 and HL2, controlled
by drivers 1 and 2. The diodes emit light impulses of stable amplitude (accuracy more than
5 µs). The commanding impulses are transmitted to the drivers 1 and 2 from the control unit,
which generates the impulses according to the computer program signals, transmitted through a
LPT port. The devices register time when the subject pushes the switch (SA1) and calculates the
perception duration TDL or TDR respectively.
Fig. 6. Structural diagram of the experimental apparatus: HL1, HL2 – light diodes; PC– personal computer; SA1– switch
A computer program, operating in real time (in DOS OS) and written in C language
operated the device. The program sends series of impulses to the control unit and registers
responses of the subject. The program guarantees formation of the impulses and registration of
the responses with the accuracy of 1 µs.
Procedure
The experiment took place in a completely darkened room. Before each experiment the
subject adapted to darkness for 3 min. Then the subject observed the images generated by the
stereo projector and indicated which stimulus he was seeing by pushing a switch. A session of

13
the experiment with one randomly chosen flash duration lasted 3 min. (around 50 switches were
performed during that time). A 1 min. break followed each session, after which the experiment
continued with another flash duration. 10 sessions (17 in experiment 4) with different flash
durations were performed in such a way. Every subject repeated the experiment 2 - 6 times (at
different days), and the results were averaged separately for each subject, according to the
corresponding measuring sessions (flash durations).
Data analysis
The subjects were instructed to hold the button pressed while perceiving one of the stimuli
(Fig. 3 (a)) and to hold the button released while seeing the other stimulus (Fig. 3 (b)). The
computer program recorded the absolute time of every press and release of the switch, and
computed the duration of every press and release. The press and release durations were treated
as dominance durations of one and the other stimuli respectively. The mean dominance
durations of the stimulus presented to each eye for every flash duration were computed. As
mean dominance durations and the profile of the curve differed individually in a significant way,
the data of separate subjects were not averaged and the analysis with individual data was
performed instead. We were more interested in the differences of dominance durations, but not
in the absolute values, so we standardized the absolute dominance duration values with respect
to the average of each eye: we counted ΔT = T – TVID, where ΔT – difference of the mean
dominance duration; T – mean dominance duration, of a given flash duration; TVID – mean
dominance duration of the eye, counted by summing all the flash durations results for that eye
(TVID is counted separately fore each eye). We specified mean dominance duration as a function
of the stimulus flash duration. The profile of the curve was analyzed, looking for statistically
significant differences among mean dominance durations, registered while presenting stimuli of
different flash durations.
We tested the fit of the curve with the Kolmogorov-Smirnov test and found that in most
cases the distribution of the data does not satisfy the criteria of the normal distribution. We used
the nonparametric Mann-Whitney test for the independent samples to compare the means of
dominance durations.
For analyzing rates of dominance duration maximums and minimums in different ranges
of the function, we performed extremum analysis of the function. We defined extremum as a
point, where the variation (direction) of the function changes its sign (minimum: from – to +;
maximum: from + to -). If the neighbouring points of the extremum did not differ in statistically

14
significant way from one of the extremums, we also ascribed them to extremums. Outside
(marginal) points of the curve were ascribed to extremums according to the function’s change of
its sign from the closest extremum (from one side). We tested the equality of proportions of the
extremums using nonparametric Cochran’s Q test.
Looking for factors that could possibly explain the distribution of the mean dominance
durations, we have performed factor analysis. We used both absolute values and differences
from the mean dominance durations of an eye for the analysis, examining how individual
differences affect the values. We counted data from all the participants for factor analysis.
Analysing the possibility of cyclical repetition of the dominance durations in each
session, we used autocorrelation analysis.
MAIN RESULTS
The results of the experiment demonstrated that mean dominance durations, measured
while presenting stimuli of different flash durations, differ in a significant way (Fig. 7).
DN
-1,5
-1
-0,5
0
0,5
1
1,5
-5 0 5 10 15 20 25 30 35
Stimulus flash duration (ms)
Δt (
s)
RightLeft
No flicker
LO
-1,5
-1
-0,5
0
0,5
1
1,5
-5 0 5 10 15 20 25 30 35
Stimulus flash duration (ms)
Δt (
s)
RightLeft
No flicker
Fig. 7. Experimental results with the counter-phase stimulus presentation. Standardized mean dominance durations
of 2 subjects. X axis – stimulus flash duration (ms), Y axis (Δt (s)) – standardized mean dominance duration (s).
The Y-axis zero point denotes the mean dominance duration of each eye, computed by summing all flash durations
of the eye. Data of individual subjects is presented in separate graphs. The vertical bars denote standard error of the
mean.
The experimental results confirmed the hypothesis, that mean dominance durations, as a
function of stimulus flash durations has distinct extrema. Fig. 7 shows that the dependence of
mean dominance duration on stimulus flash duration is not a monotonic function. Mean

15
dominance durations, measured while presenting stimuli of different flash durations, differ in a
significant way, though the profile of the curve is different for individual subjects. The total
mean dominance duration also differs individually. The mean dominance duration differs
individually within the range of 1 – 2 s.
For analyzing rates of dominance duration maxima and minima in different ranges of the
function, we performed extremum analysis of the function. Fig. 8 demonstrates extremum rates,
obtained by dividing the examined range into intervals of 3 flash durations in each. The
extremum numbers obtained from 21 experiments (6 subjects).
Right eye
0
10
20
30
40
50
60
5 - 10 ms 12 - 17 ms 20 - 30 msRange of the flash duration
Num
ber o
f ext
rem
a (%
)
Number of maxima
Number of minima
Left eye
05
1015
20
2530
3540
45
5 - 10 ms 12 - 17 ms 20 - 30 ms
Range of the flash duration
Num
ber o
f ext
rem
a (%
)
Number of maxima
Number of minima
-25
-20
-15
-10
-5
0
5
10
15
20
25
30
5 - 10 ms 12 - 17 ms 20 - 30 ms
Range of the flash duration
Max
imum
num
ber m
inus
m
inim
um n
umbe
r (%
)
0
2
4
6
8
10
12
14
16
5 - 10 ms 12 - 17 ms 20 - 30 ms
Range of the flash duration
Max
imum
num
ber m
inus
m
inim
um n
umbe
r (%
)
Fig. 8. Comparison of extremum numbers, obtained while presenting stimuli of different flash durations, in intervals of 3 flash durations. Data from 21 experiment (6 subjects). a) number of extrema, obtained while presenting stimuli of different flash durations (in percent). b) Differences of maxima and minima in the given intervals; every column is obtained by subtracting number of minima from the number of maxima.
It is obvious from Fig. 8 that the distribution of extremums in different ranges is not
equal (Cochran‘s Q p = 0.005 < 0,05). Although the examined intervals were not equal in
length, because of the different distances between the examined flash durations, this preliminary
data is sufficient to see the pronounced differences among some of the ranges. Maximums
predominate in the range of short flash durations (5 – 10 ms). In the middle interval of the
examined range (12 – 17 ms) there are fewer extremums and no clear predominance of either
maximums or minimums is vivid. In the interval of 20 – 30 ms the tendencies differ fot the left
16
and in the right eye. Minimums are more frequent in the right eye and maximums in the left.
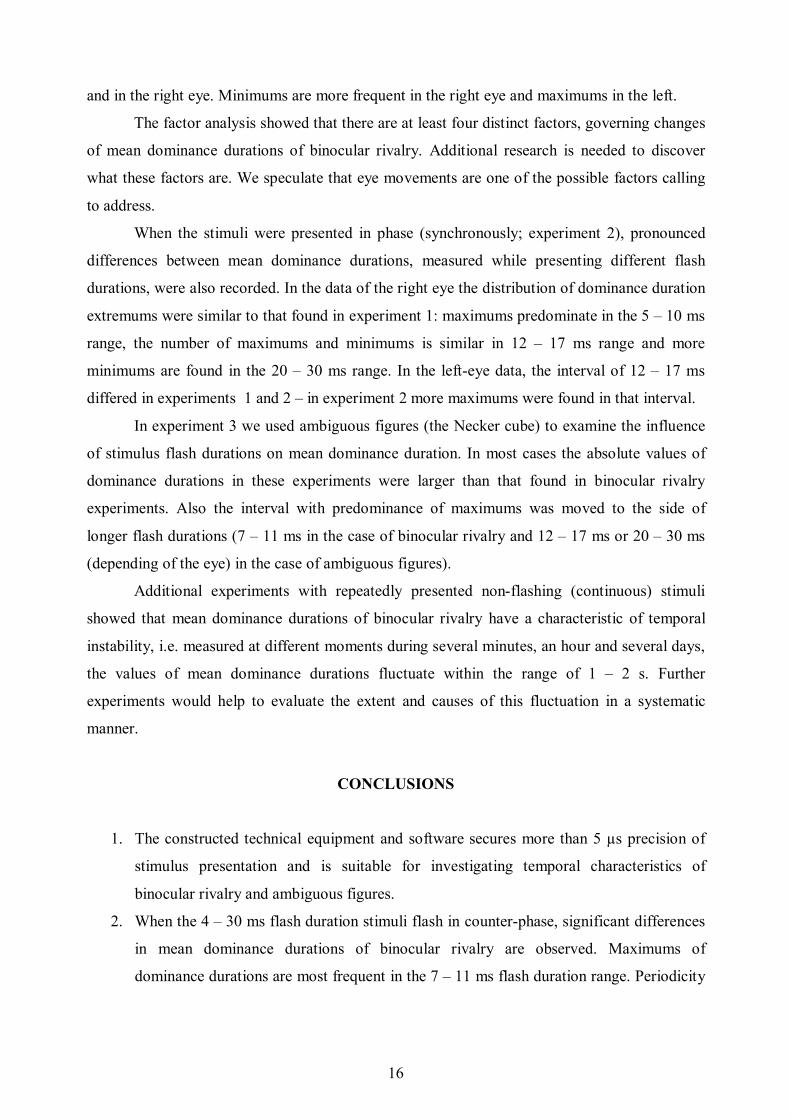
The factor analysis showed that there are at least four distinct factors, governing changes
of mean dominance durations of binocular rivalry. Additional research is needed to discover
what these factors are. We speculate that eye movements are one of the possible factors calling
to address.
When the stimuli were presented in phase (synchronously; experiment 2), pronounced
differences between mean dominance durations, measured while presenting different flash
durations, were also recorded. In the data of the right eye the distribution of dominance duration
extremums were similar to that found in experiment 1: maximums predominate in the 5 – 10 ms
range, the number of maximums and minimums is similar in 12 – 17 ms range and more
minimums are found in the 20 – 30 ms range. In the left-eye data, the interval of 12 – 17 ms
differed in experiments 1 and 2 – in experiment 2 more maximums were found in that interval.
In experiment 3 we used ambiguous figures (the Necker cube) to examine the influence
of stimulus flash durations on mean dominance duration. In most cases the absolute values of
dominance durations in these experiments were larger than that found in binocular rivalry
experiments. Also the interval with predominance of maximums was moved to the side of
longer flash durations (7 – 11 ms in the case of binocular rivalry and 12 – 17 ms or 20 – 30 ms
(depending of the eye) in the case of ambiguous figures).
Additional experiments with repeatedly presented non-flashing (continuous) stimuli
showed that mean dominance durations of binocular rivalry have a characteristic of temporal
instability, i.e. measured at different moments during several minutes, an hour and several days,
the values of mean dominance durations fluctuate within the range of 1 – 2 s. Further
experiments would help to evaluate the extent and causes of this fluctuation in a systematic
manner.
CONCLUSIONS
1. The constructed technical equipment and software secures more than 5 µs precision of
stimulus presentation and is suitable for investigating temporal characteristics of
binocular rivalry and ambiguous figures.
2. When the 4 – 30 ms flash duration stimuli flash in counter-phase, significant differences
in mean dominance durations of binocular rivalry are observed. Maximums of
dominance durations are most frequent in the 7 – 11 ms flash duration range. Periodicity
17
is characteristic to the intervals of maximum and minimum predominance – the same
tendency or either maximums or minimums to dominate repeats itself every 4 – 6 ms.
3. When the stimuli are presented in phase (synchronously), the tendency or the extremum
distribution in the right-eye data is similar to that found in the case of counter-phase
stimuli: maximums predominate in the 5 – 10 ms range (46,7 %), the number of
maximums and minimums is similar in 12 – 17 ms range (33 ir 31 %), and more
minimums are found in the 20 – 30 ms range (46,7 %). In the left-eye data, contrary to
the counter-phase experiment, more maximums are found in the 12 – 17 ms interval
(31,1 %).
4. With ambiguous-figure stimuli, the absolute values of mean dominance durations are 0,5
– 2 s larger than that found in binocular rivalry experiments. The interval with
predominance of maximums is moved towards longer flash durations in case of
ambiguous-figure perception: 7 – 11 ms in the case of binocular rivalry and 12 – 17 ms
or 20 – 30 ms, depending on the eye, in the case of ambiguous figures.
5. Instability is common to binocular rivalry dominance durations, i.e. the values of
dominance durations fluctuate within 1 – 2 s range when measured at different moments
within several minutes, one hour and several days.
6. More than one factor determines changes of mean dominance durations of binocular
rivalry.
REFERENCES
1. Blake R., Logothetis N. K. Visual Competition // Nature Reviews Neuroscience, 2002,
vol.3. P. 1-11.
2. Brascamp J.W., Knapen T.H.J., Kanai R., van Ee R., van den Berg A.V. Flash
suppression and flash facilitation in binocular rivalry // Journal of Vision, 2007, vol.
7(12). P. 1-12.
3. Freeman A.W. Multistage Model for Binocular Rivalry // Journal of Neurophysiology,
2005, vol. 94, p. 4412-4420.
4. Knapen T.H.J., Paffen C., Kanai R., van Ee R. Stimulus flash alters interocular grouping
during binocular rivalry // Vision Research, 2007, vol. 47. P. 1-7.
5. Koene A. R. A model for perceptual averaging and stochastic bistable behavior and the
role of voluntary control // Neural Computation, 2006, vol.18. P. 3069-3096.
18
6. Laing C.R., Carson C.C. A spiking neuron model for binocular rivalry // Journal of
Computational Neuroscience, 2002, vol.12 P. 39-53.
7. Leopold D. A., Logothetis N.K. Multistable phenomena: changing views in perception //
Trends in cognitive science, 1999, vol. 3(7).P. 254–264.
8. Mitchel J.F., Stoner G.R., Reynolds J.H. Object-based attention determines dominance
in binocular rivalry // Nature, 2004, vol. 429. P. 410-413.
9. Logothetis N.K., Leopold D.A., Sheinberg D.L. What is rivalling during binocular
rivalry? // Nature, 1996, vol. 380. P. 621-624.
10. Miller S. M., Hansell N.K., Ngo T.T., Liu G.B., Pettigrew J. D., Martin N. G., Wright
M.J. Genetic contribution to individual variation in binocular rivalry rate // PNAS, 2010
Vol. 107, P. 2664-2668.
11. Moreno-Bote R., Rinzel J., Rubin N. Noise-Induced Alternations in an Attractor
Network Model of Perceptual Bistability // Journal of Neurophysiology, 2007, vol. 98, P.
1125-1139.
12. Nikolaev A.R., Gepshtein S., Gong P., van Leeuwen C. Duration of coherence intervals
in electrical brain activity in perceptual organization // Cerebral cortex, 2010, vol. 20. P.
365-382.
13. Osaka N., Matsuyoshi D., Ikeda T., Osaka M. Implied motion because of instability in
Hokusai Manga activates the human motion-sensitive extrastriate visual cortex: an fMRI
study of the impact of visual art // Neuroreport, 2010, vol. 10. P. 264-7.
14. Pachidis T.P., Lygouras J.N. Pseudo-Stereo Vision System: A Detailed Study // Journal
of Intelligent and Robotic Systems, 2005, Vol. 42. P. 135-167.
15. Patterson R., Winterbottom M., Pierce B., Fox R. Bicocular rivalry and head-worn
displays // Human factors, 2007, vol. 49(6). P. 1083-1096.
16. Sauve K. Gamma-band synchronous oscillations: resent evidence regarding their
functional significance // Consciousness and cognition, 1999, vol. 8. P. 213-224.
17. Shpiro A., Curtu R., Rinzel J., Rubin N. Dynamical Characteristics Common to
Neuronal Competition Models // Journal of Neurophysiology, 2007, vol. 97. P. 462-473.
18. Sterzer P., Kleinschmidt A., Rees G. The neural bases of multistable perception // Trends
in cognitive sciences, 2009, vol. 13(7). P. 310-318.
19. Stollenwerk L., Bode M. Lateral neural model of binocular rivalry // Neural
Computation, 2003, vol.15. P. 2863-2882.
20. Tong F., Nakayama K., Vaughan J. T., Kanwisher N. Binocular rivalry and visual

19
awareness in human extrastriate cortex // Neuron, 1998, vol. 21. P. 753–759.
21. van Boxtel J.J.A., Alais D., Erkelens C.J., van Ee R. The role of temporally coarse form
processing during binocular rivalry. PLoS ONE 3(1): e1429, 2008.
22. Wilson H. R., Blake R., Lee S.H. Dynamics of travelling waves in visual perception //
Nature, 2001, vol. 412. P. 907–910.
REZIUMĖ
Akių konkurencija ir dviprasmių figūrų suvokimas yra dvi iš daugelio nestabilaus
(alteruojančio) suvokimo formų. Nestabilus suvokimas – tai pažinimo reiškinys, kai subjektyvus
suvokiamas vaizdas ar garsas periodiškai kinta, fiziniam stimului išliekant pastoviam.
Pastaraisiais metais šis reiškinys sulaukia vis daugiau tyrėjų dėmesio, nes yra pritaikomas
įvairioms suvokimo ir sąmonės savybėms tirti. Nors atlikta nemažai tyrimų, iki šiol nėra aišku,
ar įvairios nestabilaus suvokimo formos yra pagrįstos tais pačiais fiziologiniais mechanizmais.
Nors akių konkurencijos ir dviprasmių figūrų suvokimas paprastai yra siejamas su
milisekundžių eilės informacijos apdorojimo procesų netolygumais nervų sistemoje, trūksta
tyrimų, bandančių tiesiogiai sieti šiuos du procesų tipus. Jei tyrimais pavyktų patvirtinti
tiesioginį ryšį tarp cikliškų jautrumo svyravimų nervų sistemoje ir nestabilaus suvokimo ciklų,
tai padėtų geriau suprasti nestabilaus suvokimo veikimo mechanizmą ir nervų sistemos jautrumo
svyravimų funkcinę reikšmę.
Dėl neuronų darbo refrakcinių periodų ir atskirų neuronų grupių sinchronizacijos,
informacijos apdorojimas nervų sistemoje nėra tolygus. Jei suvokiama informacija yra
pateikiama tokiu momentu, kai nervų sistema yra pasirengusi ją apdoroti, apdorojimo
efektyvumas bus didesnis. Šie informacijos apdorojimo netolygumai yra milisekundžių eilės,
todėl tiksliau juos ištirti yra labai sudėtinga. Dabartinių smegenų vaizdavimo metodų laikinės
rezoliucijos paprastai neužtenka, kad būtų galima tiksliai fiksuoti minimuosius neuronų darbo
netolygumus. Vienas iš galimų būdų tirti milisekundžių eilės informacijos apdorojimo
netolygumus yra pateikti periodinius stimulus su tiksliai kontroliuojamu dažniu, ir žiūrėti, ar
stimulų mirksėjimo dažnis veikia informacijos apdorojimo efektyvumą. Tyrimų, kuriuose būtų
pateikiami milisekundžių eilės periodiniai stimulai, ir nagrinėjama stimulų mirksėjimo dažnio
įtaka, yra nedaug, ir jų rezultatai yra prieštaringi.
Atsižvelgdami į tokio pobūdžio tyrimų aktualumą ir iki šiol atliktų šios srities tyrimų
20
rezultatus, sukūrėme specialią įrangą, leidžiančią pateikti dideliu dažniu mirksinčius stimulus
nepriklausomai į vieną ir kitą akį, ir tyrėme, ar stimulų mirksėjimo dažnis lemia akių
konkurencijos ir dviprasmių figūrų suvokimo dominavimo trukmę.
Tyrimo tikslas
Ištirti, kaip akių konkurencijos ir dviprasmių figūrų suvokimo laikinę dinamiką veikia
pateikiamų stimulų mirksėjimo dažnis.
Uždaviniai
1. Sukurti metodą, padedantį tirti akių konkurencijos ir dviprasmių figūrų suvokimo
laikines savybes, pateikiant į vieną ir kitą akis du nepriklausomu dažniu mirksinčius
stimulus.
2. Nustatyti, ar egzistuoja akių konkurencijos vidutinės dominavimo trukmės
priklausomybė nuo pateikiamų stimulų mirksėjimo dažnio.
3. Palyginti dominavimo trukmių dinamiką pateikiant priešfazėje ir fazėje mirksinčius
stimulus.
4. Ištirti stimulų mirksėjimo dažnio įtaką dviprasmių figūrų laikinėms savybėms.
5. Panagrinėti akių konkurencijos dominavimo trukmių dinamiką įvairiose laiko skalėse
(kelių minučių, valandos ir parų eigoje).
Ginamieji teiginiai
1. Sukurtoji techninė ir programinė įranga užtikrina stimulų pateikimą didesniu negu 5 µs
tikslumu ir yra tinkama akių konkurencijos ir dviprasmio suvokimo laikinėms savybėms
tirti.
2. Pateikiant 4 – 30 ms trukmės dažniu mirksinčius stimulus, fiksuojami reikšmingi
skirtumai tarp akių konkurencijos vidutinių dominavimo trukmių. Ekstremumų dažnis 7
– 11 ms intervale reikšmingai skiriasi nuo dažnio kituose intervaluose (4 – 6 ms ir 12 –
30 ms).
3. Akių konkurencijos dominavimo trukmėms būdingas laikinis nestabilumas, t.y.
matuojant dominavimo trukmę skirtingais laiko momentais kelių minučių, valandos ir
kelių parų eigoje, vidutinių dominavimo trukmių reikšmės svyruoja 1 – 2 s ribose.
4. Akių konkurencijos vidutinės dominavimo trukmės pokyčius lemia daugiau negu vienas
faktorius.
21
Metodika
Tyrimo dalyviai. Eksperimentuose savanoriškai dalyvavo 6 vyriškos lyties dalyviai,
amžiaus vidurkis – 34,3 m., standartinis nuokrypis – 15,38, rega normali arba pakoreguota iki
normalios. Dalyviai buvo Vilniaus universiteto Psichofiziologijos laboratorijos darbuotojai arba
studentai ir turėjo bent minimalią dalyvavimo psichofizikiniuose eksperimentuose patirtį..
Aparatūra ir stimulai. Mirksintiems akių konkurencijos ir dviprasmių figūrų suvokimo
stimulams pateikti buvo sukonstruota speciali aparatūra ir programinė įranga, leidžianti pateikti
regimuosius vaizdus didesniu negu 5 µs tikslumu. Akių konkurencijos tyrimams naudoti į vieną
ir kitą akis pateikiami skirtingos konfigūracijos 1,7° regimojo kampo dydžio apskritimo formos
stimulai, dviprasmių figūrų suvokimo tyrimams – Nekerio kubas.
Tyrimo stimulai buvo pateikiami arba ištisai šviečiantys, arba mirksintys tiksliu
užprogramuotu intervalu. Mirksintys stimulai mirksėjo arba priešfazėje (pakaitomis), arba fazėje
(sinchroniškai), ir tyrėme, ar stimulų mirksėjimo pobūdis turi įtakos suvokimui. Trijuose
eksperimentuose tyrimui naudotos tokios stimulo vieno pateikimo trukmės: be mirksėjimo, 5
ms, 7 ms, 10 ms, 12 ms, 15 ms, 17 ms, 20 ms, 25 ms ir 30 ms. Eksperimento eigoje šios trukmės
buvo parenkamos atsitiktine tvarka. 4 eksperimente naudoti stimulai iš siauresnio intervalo –
nuo 4 ms iki 20 ms, parenkant stimulus kas 1 ms (iš viso 17 stimulo pateikimo dažnių).
Eksperimento eiga. Eksperimentas vyko visiškai užtemdytame kambaryje. Iki
eksperimento pradžios 3 min. buvo skiriamos adaptacijai tamsoje. Vėliau tyrimo dalyvis stebėjo
pateikiamus vaizdus stereoprojektoriuje ir spausdamas mygtuką nurodė, kurį stimulą matė.
Matavimo serija su kiekviena atsitiktinai parinkta stimulo pateikimo trukme tęsėsi 3 min. (per šį
laiką įvykdavo apie 50 stimulo suvokimo kitimų). Po 1 min pertraukos ji buvo tęsiama su kita
atsitiktinai parinkta kita trukme, ir taip vieno eksperimento metu buvo atliekama dešimt (4
eksperimente – 17) matavimo serijų su visomis dominančiomis stimulo pateikimo trukmėmis.
Su kiekvienu tiriamuoju toks eksperimentas pakartotas du – šešis kartus (skirtingomis dienomis)
ir rezultatai suvidurkinti kiekvienam tiriamajam atskirai pagal atitinkamas matavimo serijas.
Duomenų tvarkymas. Kompiuterio programa fiksavo kiekvieno mygtuko nuspaudimo ir
atleidimo absoliutų laiką ir apskaičiavo kiekvieno nuspaudimo ir atleidimo trukmę. Buvo
skaičiuojama vidutinė kiekvienos akies stimulo dominavimo trukmė esant kiekvienai stimulo
pateikimo trukmei. Analizuotas gautos kreivės pobūdis, ieškant statistiškai reikšmingų skirtumų
tarp dominavimo laiko reikšmių, užfiksuotų pateikiant skirtingos trukmės stimulus.
Dominavimo trukmių maksimumų ir minimumų dažnių skirtinguose funkcijos diapazonuose
22
analizei, atlikta funkcijos ekstremumų analizė. Tiriant gautų vidurkių pasiskirstymo galimo
paaiškinimo bendresniais faktoriais galimybę, atlikta faktorinė analizė. Ieškant ciklinio
pasikartojimo galimybių tarp išmatuotų dominavimo trukmių, atlikta autokoreliacinė analizė.
Rezultatai
Eksperimento rezultatai parodė, kad tarp vidutinių dominavimo trukmių, išmatuotų
pateikiant skirtingos trukmės stimulus, išryškėja reikšmingi skirtumai., nors tarp tyrimo dalyvių
kreivės pobūdis skiriasi. Individualiai labai skiriasi ir bendras dominavimo laiko vidurkis.
Vidutinė dominavimo trukmė tarp tyrimo dalyvių svyruoja 2 – 4,5 s ribose.
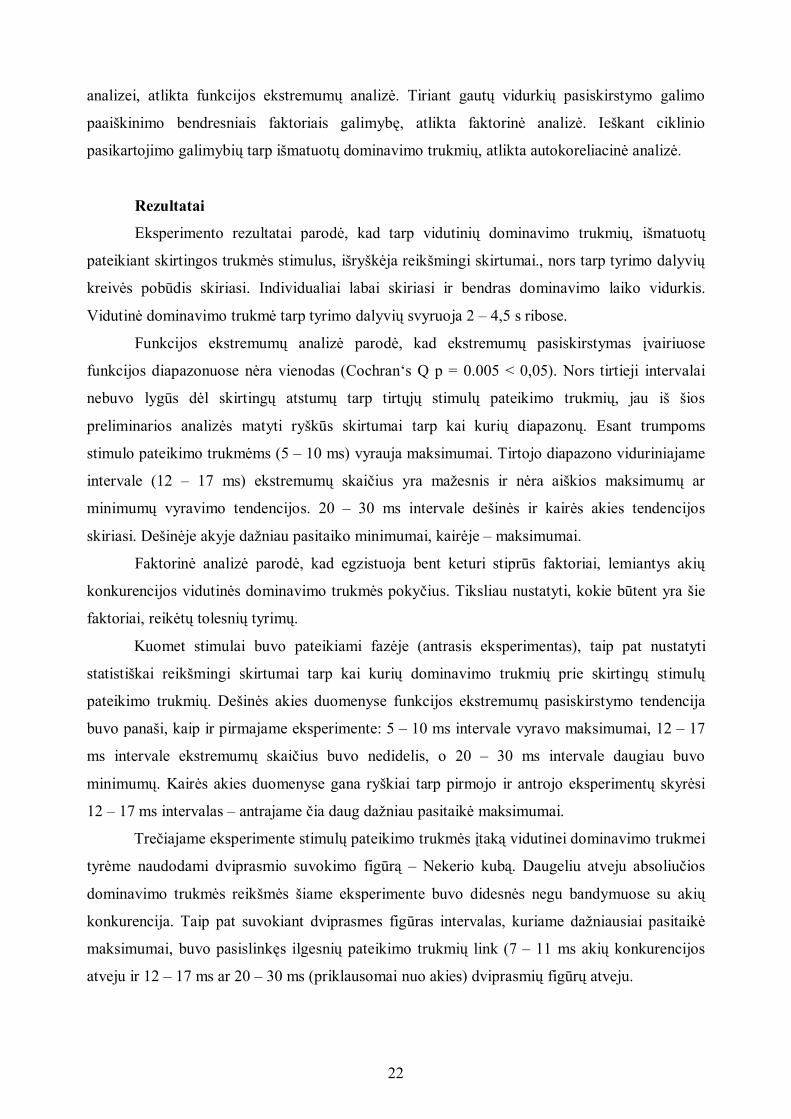
Funkcijos ekstremumų analizė parodė, kad ekstremumų pasiskirstymas įvairiuose
funkcijos diapazonuose nėra vienodas (Cochran‘s Q p = 0.005 < 0,05). Nors tirtieji intervalai
nebuvo lygūs dėl skirtingų atstumų tarp tirtųjų stimulų pateikimo trukmių, jau iš šios
preliminarios analizės matyti ryškūs skirtumai tarp kai kurių diapazonų. Esant trumpoms
stimulo pateikimo trukmėms (5 – 10 ms) vyrauja maksimumai. Tirtojo diapazono viduriniajame
intervale (12 – 17 ms) ekstremumų skaičius yra mažesnis ir nėra aiškios maksimumų ar
minimumų vyravimo tendencijos. 20 – 30 ms intervale dešinės ir kairės akies tendencijos
skiriasi. Dešinėje akyje dažniau pasitaiko minimumai, kairėje – maksimumai.
Faktorinė analizė parodė, kad egzistuoja bent keturi stiprūs faktoriai, lemiantys akių
konkurencijos vidutinės dominavimo trukmės pokyčius. Tiksliau nustatyti, kokie būtent yra šie
faktoriai, reikėtų tolesnių tyrimų.
Kuomet stimulai buvo pateikiami fazėje (antrasis eksperimentas), taip pat nustatyti
statistiškai reikšmingi skirtumai tarp kai kurių dominavimo trukmių prie skirtingų stimulų
pateikimo trukmių. Dešinės akies duomenyse funkcijos ekstremumų pasiskirstymo tendencija
buvo panaši, kaip ir pirmajame eksperimente: 5 – 10 ms intervale vyravo maksimumai, 12 – 17
ms intervale ekstremumų skaičius buvo nedidelis, o 20 – 30 ms intervale daugiau buvo
minimumų. Kairės akies duomenyse gana ryškiai tarp pirmojo ir antrojo eksperimentų skyrėsi
12 – 17 ms intervalas – antrajame čia daug dažniau pasitaikė maksimumai.
Trečiajame eksperimente stimulų pateikimo trukmės įtaką vidutinei dominavimo trukmei
tyrėme naudodami dviprasmio suvokimo figūrą – Nekerio kubą. Daugeliu atveju absoliučios
dominavimo trukmės reikšmės šiame eksperimente buvo didesnės negu bandymuose su akių
konkurencija. Taip pat suvokiant dviprasmes figūras intervalas, kuriame dažniausiai pasitaikė
maksimumai, buvo pasislinkęs ilgesnių pateikimo trukmių link (7 – 11 ms akių konkurencijos
atveju ir 12 – 17 ms ar 20 – 30 ms (priklausomai nuo akies) dviprasmių figūrų atveju.

23
Papildomi eksperimentai su pakartotinai pateikiamais nemirksinčiais (ištisai
šviečiančiais) stimulais parodė, kad akių konkurencijos vidutinėms dominavimo trukmėms yra
būdingas laikinis nestabilumas, t.y. matuojant dominavimo trukmę skirtingais laiko momentais
valandos eigoje, vidutinių dominavimo trukmių reikšmės svyruoja 1 – 2 s ribose. Tiksliau
įvertinti šio svyravimo mastui ir priežastims reikėtų tolesnių eksperimentų.
Išvados
1. Sukurtoji techninė ir programinė įranga užtikrina stimulų pateikimą didesniu negu 5 µs
tikslumu ir yra tinkama akių konkurencijos ir dviprasmio suvokimo laikinėms savybėms
tirti.
2. Pateikiant 4 – 30 ms trukmės pastoviu dažniu priešfazėje mirksinčius stimulus,
fiksuojami reikšmingi skirtumai tarp akių konkurencijos vidutinių dominavimo trukmių.
Dominavimo trukmių maksimumai dažniausiai pasitaiko 7 – 11 ms intervale.
Maksimumų ir minimumų vyravimo intervalams yra būdingas periodiškumas – vieninga
maksimumų ar minimumų vyravimo tendencija kartojasi kas 4 – 6 ms.
3. Pateikiant fazėje mirksinčius stimulus, dešinės akies duomenyse funkcijos ekstremumų
pasiskirstymo tendencija yra panaši, kaip ir priešfazėje mirksinčių stimulų atveju: 5 – 10
ms intervale vyrauja maksimumai (46,7 %), 12 – 17 ms intervale maksimumų ir
minimumų skaičius yra panašus (33 ir 31 %), o 20 – 30 ms intervale dažnesni
minimumai (46,7 %). Kairės akies duomenyse, skirtingai nuo eksperimento priešfazėje,
12 – 17 ms intervale dažniau pasitaiko maksimumai (31,1 %).
4. Suvokiant dviprasmes figūras, absoliučios dominavimo trukmės yra 0,5 – 2 s didesnės
negu bandymuose su akių konkurencija. Suvokiant dviprasmes figūras intervalas,
kuriame dažniausiai pasitaiko maksimumai, yra pasislinkęs ilgesnių pateikimo trukmių
link: 7 – 11 ms akių konkurencijos atveju ir 12 – 17 ms ar 20 – 30 ms, priklausomai nuo
akies, dviprasmių figūrų atveju.
5. Akių konkurencijos dominavimo trukmėms būdingas laikinis nestabilumas, t.y.
matuojant dominavimo trukmę skirtingais laiko momentais kelių minučių, valandos ir
kelių parų eigoje, vidutinių dominavimo trukmių reikšmės svyruoja 1 – 2 s ribose.
6. Akių konkurencijos vidutinę dominavimo trukmę lemia daugiau negu vienas faktorius.

24
LIST OF AUTHOR‘S PUBLICATIONS
Noreika D., Švegžda A., Stanikūnas R., Vanagas V., Vaitkevičius H. Abiakės
konkurencijos reiškinio laikinės charakteristikos // Psichologija. 2008, T. 37, P. 7-19.
Noreika D. Regimosios informacijos diskretinimas laike ir jos ryšys su abiake
konkurencija // Žmogus XXI amžiuje: kas naujo? VI Jaunųjų mokslininkų psichologų
konferencija / [sudarė I. Salialionė, A. Kairys], Vilnius: Vilniaus universiteto leidykla, 2009, P.
7-13.
Noreika D., Vaitkevičius H., Švegžda A., Vanagas V. Stanikūnas R., Bliznikas Z. A
Flickering Stimuli Method for Investigating Temporal Features of Binocular Vision //
Electronics and Electrical Engineering. – Kaunas: Technologija. 2010, No. 7 (103), P. 35-38.
ABOUT THE AUTHOR
Donatas Noreika finished his bachelor studies in psychology in 2003 and master studies
in clinical psychology in 2005, both in Vilnius University. In 2006 he started his doctoral
studies in Vilnius university. Since 2004 Donatas actively participated in organizing “The
conference of young scientists in psychology” in Vilnius University and other young scientists’
events in Lithuania.
Donatas’ scientific interests include cognitive processes, psychophysiology, mental
imagery and psychology of creativity. At the same time he is interested in practical psychology:
psychological consulting, group processes, encouraging creativity and interdisciplinary projects.