VILLAGE LEVEL GROUNDWATER ASSESSMENT USING …
10
VILLAGE LEVEL GROUNDWATER ASSESSMENT USING GEOSPATIAL TECHNIQUE Rahul Y Nandurkar 1 , Shailesh Deshpande 2 , R Nagarajan 3 1,2 Tata Research Development and Design Centre, TCS Innovation Labs, Pune, India {r.nandurkar, shailesh.deshpande}@tcs.com, 3 Centre of Studies in Resources Engineering, Indian Institute of Technology Bombay, India { [email protected]} KEYWORDS: Geospatial database, Groundwater assessment, Crop pattern, ArcGIS. ABSTRACT: Water demand is increasing in rural areas day by day because of increased requirements for irrigation, domestic usage, lifestyle changes, and so on. Moreover, the groundwater is drawn indiscriminately to fulfill these needs affecting water availability. Choosing economically viable crop patterns under such demanding conditions is the challenging task. The main objective of this study is to find out the suitable crop pattern under the limited groundwater supply conditions. Umred Tehsil, Nagpur District in India was chosen as a study area. Geospatial database (ArcGIS) layers were created for topography, drainage pattern, soil texture, and geomorphology for assessing the potential of groundwater. Rainfall trend over past year was identified using Man- Kendall statistical analysis. Dry spell analysis was done for no rainfall events occurred during Kharif seasons. Water table fluctuations were identified to assess groundwater recharge from rainfall. Drinking (human, livestock etc.) and crop water requirements from individual villages were calculated and mapped. By analysing the geospatial database for the study area, we identified locations experiencing severe water stresses. The study showed that 60 (~31%) villages out of 192 villages in Umred Tehsil faced groundwater availability deficit for the normal rainfall year (based on standard precipitation index) in 2011. According to cost-benefit analysis, Cotton was found to be the best crop to cultivate during Kharif and Rabi season during the normal rainfall conditions. 1. INTRODUCTION Rapid expansion of industry, increase in the population, and the water intensive cropping patterns are resulting in increasing water demand and exploitation of groundwater (WWAP U., 2003). The overexploitation of groundwater has severe socio-economic consequences in semi-arid region. The excess withdrawal of groundwater than recharge has led to the decline of water table (Rai et al., 2006). In India, the water table has dropped by 4m in Delhi, Gujarat, Haryana, Karnataka, Punjab, Rajasthan and Tamil Nadu (CGWB, 2014).The situation is further aggravated by decreasing the availability of surface water in India. Estimated surface water availability in India was 2384 km 3 in the year 2000 against 6008 km 3 in 1947 (Nagarajan, 2006). Groundwater is an important resource of freshwater throughout the world (Singh, 2013). Groundwater constitutes one-third of all the freshwater in the world and it fulfils the water requirement for domestic usage (37%), agriculture (42%), and industrial sector (22%) (Doll et al., 2012). In rural and urban India, groundwater is the predominant source of drinking water supply. The groundwater recharge quantity depends on the frequency and intensity of rainfall, infiltration and soil moisture (Oke et al., 2014), (Machiwal & Jha, 2014). It is seen that mean groundwater level increases (deeper from ground surface) sharply with decreasing rainfall. The objectives of this research were a) to develop a geospatial database for assessing the groundwater availability at the village level, and b) to find out the changes in crop pattern for a given groundwater availability. Individual village information on population, cultivable area, well-irrigated area, surface water irrigated area etc. was derived from Census of India (2011). The information was used to estimate drinking and irrigation water demand. Surface water supply and groundwater storage of the study area was calculated. Water Table Fluctuation (WTF) method was used to estimate groundwater recharge for a given aquifer boundaries. For the simplicity, aquifer boundaries were considered to be same as village administrative boundaries. Using total water demand and groundwater availability, the net groundwater availability at the village level was estimated. The villages were classified according to net groundwater availability. According to net groundwater availability at the village level, we suggested the best suitable crop pattern beneficial to farmers. Integration of the geospatial technologies such as remote sensing and Geographic Information System (GIS) has recognized to be an effective tool in groundwater assessment (Krishnamurthy et. al. 1996), (Sander,1996), (Kamaraju et. al, 1996), (Saraf and Choudhury, 1998). GIS is been used for groundwater potential assessment considering various thematic maps such as lithology, lineaments, DEM, hydrogeological information, drainage system, slope, well logs and pumping test (Semere S. 2003), (Agarwal et al, 2013), (Anbazhagan & Jothibasu, 2016). We considered demographic and crop information to estimate the water demand along with parameters affecting ground water to find out the deficit or surplus of groundwater in a given area.
Transcript of VILLAGE LEVEL GROUNDWATER ASSESSMENT USING …

VILLAGE LEVEL GROUNDWATER ASSESSMENT USING GEOSPATIAL
TECHNIQUE
Rahul Y Nandurkar1, Shailesh Deshpande
2, R Nagarajan
3
1,2Tata Research Development and Design Centre, TCS Innovation Labs, Pune, India
{r.nandurkar, shailesh.deshpande}@tcs.com, 3Centre of Studies in Resources Engineering, Indian Institute of Technology Bombay, India {[email protected]}
KEYWORDS: Geospatial database, Groundwater assessment, Crop pattern, ArcGIS.
ABSTRACT: Water demand is increasing in rural areas day by day because of increased requirements for
irrigation, domestic usage, lifestyle changes, and so on. Moreover, the groundwater is drawn indiscriminately to
fulfill these needs affecting water availability. Choosing economically viable crop patterns under such demanding
conditions is the challenging task. The main objective of this study is to find out the suitable crop pattern under the
limited groundwater supply conditions. Umred Tehsil, Nagpur District in India was chosen as a study area.
Geospatial database (ArcGIS) layers were created for topography, drainage pattern, soil texture, and
geomorphology for assessing the potential of groundwater. Rainfall trend over past year was identified using Man-
Kendall statistical analysis. Dry spell analysis was done for no rainfall events occurred during Kharif seasons.
Water table fluctuations were identified to assess groundwater recharge from rainfall. Drinking (human, livestock
etc.) and crop water requirements from individual villages were calculated and mapped. By analysing the geospatial
database for the study area, we identified locations experiencing severe water stresses. The study showed that 60
(~31%) villages out of 192 villages in Umred Tehsil faced groundwater availability deficit for the normal rainfall
year (based on standard precipitation index) in 2011. According to cost-benefit analysis, Cotton was found to be the
best crop to cultivate during Kharif and Rabi season during the normal rainfall conditions.
1. INTRODUCTION
Rapid expansion of industry, increase in the population, and the water intensive cropping patterns are resulting in
increasing water demand and exploitation of groundwater (WWAP U., 2003). The overexploitation of groundwater
has severe socio-economic consequences in semi-arid region. The excess withdrawal of groundwater than recharge
has led to the decline of water table (Rai et al., 2006). In India, the water table has dropped by 4m in Delhi, Gujarat,
Haryana, Karnataka, Punjab, Rajasthan and Tamil Nadu (CGWB, 2014).The situation is further aggravated by
decreasing the availability of surface water in India. Estimated surface water availability in India was 2384 km3 in
the year 2000 against 6008 km
3 in 1947 (Nagarajan, 2006).
Groundwater is an important resource of freshwater throughout the world (Singh, 2013). Groundwater constitutes
one-third of all the freshwater in the world and it fulfils the water requirement for domestic usage (37%),
agriculture (42%), and industrial sector (22%) (Doll et al., 2012). In rural and urban India, groundwater is the
predominant source of drinking water supply. The groundwater recharge quantity depends on the frequency and
intensity of rainfall, infiltration and soil moisture (Oke et al., 2014), (Machiwal & Jha, 2014). It is seen that mean
groundwater level increases (deeper from ground surface) sharply with decreasing rainfall.
The objectives of this research were a) to develop a geospatial database for assessing the groundwater availability at
the village level, and b) to find out the changes in crop pattern for a given groundwater availability. Individual
village information on population, cultivable area, well-irrigated area, surface water irrigated area etc. was derived
from Census of India (2011). The information was used to estimate drinking and irrigation water demand. Surface
water supply and groundwater storage of the study area was calculated. Water Table Fluctuation (WTF) method
was used to estimate groundwater recharge for a given aquifer boundaries. For the simplicity, aquifer boundaries
were considered to be same as village administrative boundaries. Using total water demand and groundwater
availability, the net groundwater availability at the village level was estimated. The villages were classified
according to net groundwater availability. According to net groundwater availability at the village level, we
suggested the best suitable crop pattern beneficial to farmers.
Integration of the geospatial technologies such as remote sensing and Geographic Information System (GIS) has
recognized to be an effective tool in groundwater assessment (Krishnamurthy et. al. 1996), (Sander,1996),
(Kamaraju et. al, 1996), (Saraf and Choudhury, 1998). GIS is been used for groundwater potential assessment
considering various thematic maps such as lithology, lineaments, DEM, hydrogeological information, drainage
system, slope, well logs and pumping test (Semere S. 2003), (Agarwal et al, 2013), (Anbazhagan & Jothibasu,
2016). We considered demographic and crop information to estimate the water demand along with parameters
affecting ground water to find out the deficit or surplus of groundwater in a given area.

2. DATA AND METHODS As per the research objective, information required for estimation of net groundwater availability was collected
from various sources. Table 1 highlights data sets, their source and usage.
Table 1 Attributes for Ground Water Assessment
Data Source Usage
Groundwater level ( Pre and Post
Monsoon) and Well logs
Groundwater Survey and
Development Agency
(GSDA) Nagpur
Groundwater level fluctuation and
hydrogeological settings
SRTM Digital elevation model
(30m×30m) resolution (2014)
United States Geological
Survey (USGS, 2016)
DEM
Slope
Drainage Network
Maximum and Minimum
Temperature (1901-2001),Relative
humidity(1901-2001)
India Water Portal ,2016 Evapotranspiration
Agriculture (2011-2012) Revenue Department Crop water requirement
Soil GSDA, Nagpur Soil texture
Population Census of India 2011 Drinking water demand
Livestock Livestock census 2012 Drinking water demand
Rainfall[Yearly(1901-2001),
Monthly(1901-2001),
Weekly(2000-2015)]
India Water Portal, 2016
Maharain, 2016
Regional variation of rainfall
Season wise water requirement
Dry spell analysis
Surface storage structure (2011-2012) Irrigation department, Umred Surface water supply
Geomorphology GSDA, Nagpur Terrain analysis
Field survey
Agriculture practices in the village
Ground water level.
Water stress villages cross verified
ArcGIS version 10.2 was used for creating geospatial database layers for various attributes (Table 1). R-software
version 3.2.5 was used to analyse rainfall trends and groundwater levels. In this study, SPI package (Josemir N.,
2012) was used for SPI calculations. FUME package (Santander Meteorology Group, 2012) was used for Mann-
Kendall trend (MK) test and Sen-Slope estimations.
2.1 Study area
Umred Tehsil in Nagpur District, Maharashtra is one the drought affected regions in central India. Umred Tehsil
lies between 20˚40’0’’N to 21˚0’00’N latitude and 79˚0’0’’E to 79˚25’00’’E longitude encompassing a
geographical area of about 97,900 hectares (ha). There are 192 villages that are administered by 47-gram panchayat
in the Umred Tehsil (Figure 1). Villages under forest area and urban area (ID 193 and 194, Figure 1) were not
considered in the analysis. The study area experiences tropical semi-arid climate. The average maximum and
minimum temperatures in summer are 48˚C and 30˚C respectively and in winter are 32˚C and 5˚C respectively. It
receives the normal annual rainfall of 1006.78 mm where 90% of precipitation occurs during June to September
month. The maximum monsoon rainfall of 1814.9 mm was reported in the year 2013 and minimum of 521.5 in
1982. The mean monsoon rainfall is 1029.65mm (1982-2013). The maximum monsoon rainy days were 21 in
month July 2010. The rainy season (wet period) usually starts from mid-June and last for about 5 months up to the
end of October. November to April is considered as the dry period. The normal annual potential evapotranspiration
is 80.52 mm (1901-2002).
The minimum and maximum of elevation are 169 and 421m above MSL. Slope information derived from SRTM
reveals 0 to 10% slope area is dominant (Table 1). They are suitable for agriculture and possible to locate multiple
recharge structures. The area under different land uses and land covers (LULC) within the study area is: forest -
19668.98 ha, non agriculture - 5925.86 ha, fallow land - 3091.88 ha, total unirrigated land area - 37523.13 ha, total
irrigated land - 8791.59 ha; area irrigated by canal - 3260.45 ha, area irrigated by well - 3834.97 ha - area irrigated
by tanks and lakes - 848.95 ha. The Soil in this region is dominated by the clay content to the depth of 10 – 25cm.
The Clayey soil has high water holding capacity. Plateaus and pediplain landforms are present in this region. Black
soil overlaying weathered Deccan basaltic rock act as a shallow aquifer that caters to recharging of shallow dug
wells. The recharges into wells come from agriculture return flow.

Figure 1 Study Area
2.2 Methodology
Information required for estimation of water demand and surface water supply was collected from various sources
(Table 1). The village boundaries were digitized from the map used by census 2011. The individual village
boundary was stored as a polygon and was assigned a unique identification number (ID). The attributes of the
village such as population, household number, cultivable and uncultivable land, irrigation sources etc. were
attached to this polygon. Daily rainfall data was collected from Umred rain gauge station.
MK test is a non-parametric statistical procedure. MK test is used for evaluating trends in data over time. It can be
used with the data set which includes irregular sampling intervals and missing data. The MK statistics is denoted by
parameter ZC. The positive and negative value of ZC indicates an increase and decrease in constitute concentration
over the time period. The Sen-Slope estimator was used to find out the magnitude of an annual trend of
groundwater levels and rainfall. The Sen-Slope estimator or Theil-Sen estimator calculates the median slope of
possible multiple lines through the data pairs. SPI is based on the cumulative distribution of a given rainfall event
occurring at a given station. A gamma distribution has been found to be the best fit for historic rainfall data. SPI is
given as:
𝑆𝑃𝐼 = (𝑋𝑖𝑗− 𝑋𝑖𝑚)
𝜎 1
Where, 𝑖= rain gauge station no., 𝑗= observation no., 𝑋𝑚= long-term seasonal mean. The rainfall and groundwater
level trend was obtained using MK test and Sen-Slope estimator test. Yearly rainfall analysis has been done using
SPI to define normal and drought years. Weekly rainfall analysis was carried out using dry-spell analysis to
estimate supplement irrigation for the crop-water requirement.
Water requirement for population from individual villages was estimated on yearly basis as follows:
𝑄𝐷𝑊 ( 𝑚3) = {(𝑇𝑜𝑡𝑎𝑙 𝑝𝑜𝑝𝑢𝑙𝑎𝑡𝑖𝑜𝑛 𝑜𝑓 𝑣𝑖𝑙𝑙𝑎𝑔𝑒)0.055 𝑚3𝑝𝑐𝑑}365 2
𝑄𝐿𝑊 ( 𝑚3) =
{[(𝑐𝑎𝑡𝑡𝑙𝑒𝑠)0.085 + (𝑠𝑤𝑖𝑛𝑒𝑠)0.015 + (𝑏𝑖𝑟𝑑𝑠)0.004 + (𝑠ℎ𝑒𝑒𝑝𝑠)0.005 + (𝑑𝑜𝑔𝑠)0.002)] 𝑚3𝑝𝑐𝑑} 365 3
Q 𝐼𝑊 ( 𝑚3 ) = (𝐶𝑟𝑜𝑝 𝐴𝑟𝑒𝑎 ( 𝑚2) ) × (𝑇𝑜𝑡𝑎𝑙 𝐶𝑟𝑜𝑝 𝑤𝑎𝑡𝑒𝑟 𝑑𝑒𝑚𝑎𝑛𝑑 ( 𝑚)) 4
The steps followed for assessment of groundwater at village level are:
1. Calculate total annual water demand which includes drinking water demand (livestock 𝑄𝐿𝑊 ( 𝑚3) and
human𝑄𝐷𝑊 ( 𝑚3) ) and irrigation water demand Q 𝐼𝑊 ( 𝑚3 ) which includes supplementary irrigation in Kharif
and irrigation water requirement in Rabi season. Use equation no. 2, 3 and 4 as mentioned in above.

2. Check deficit/excess groundwater availability between groundwater recharge and groundwater demand. For the
estimation of groundwater recharge at the village level, we used water table fluctuation method. The method of
groundwater assessment is shown in Figure 2. Due to time constrained we did not conduct pumping test in the
study area. According to earlier work in this study area and norms given in guidelines, we considered specific
yield ‘Sy’ for weathered or vesicular, jointed basalt as per norms was 0.01 (CGWB, 2009), (Saha D and
Agrawal A k, 2006).
Figure 2 Groundwater Assessment Methodology
Further water deficit/excess groundwater availability map was used for cost-benefit analysis of crops. Based on the
field survey and considering market prices of 2011-12 in Nagpur commodity market, we found out the best suitable
crop for various scenarios. Considering parameters for each crop such as initial cost (seeds, labour, pesticide,
sulphate, cow dung and transportation) and market price, we calculated net profit.
3. RESULTS AND DISCUSSIONS
3.1 Rainfall analysis
Rainfall in the study area (ZC) showed decreasing trend over past 10 years. Though the number of rainy days show
increasing trend (0.333 day/year) in the study area because of positive ZC values, the annual rainfall deceased with
magnitude of 8.3818 mm (Sen Slope) (Table 2a, 2b ). The estimated annual rainfall is 1030 mm (95% confidence)
in year 2040.
Table 2a Annual Rainfall Trend Analysis
Annual ZC Sen Slope Trend
Rainfall -0.4379 -8.3818 ↓
Number of Rainy Days 0.3307 0.333 ↑
Table 2b Monsoon Rainfall Trend Analysis
Monsoon ZC Sen Slope Trend
Rainfall -0.4379 -12.98 ↓
Number of Rainy Days 0.3294 0.33 ↑
Note: ↑ - Increasing Trend; ↓ - Decreasing trend
SPI was used to find out the normal year and the drought year. SPI was calculated using 2002-2015 annual
monsoon period (June- Sept.) data using R- Software of SPI package as shown in Figure 3. 700 mm rainfall was
considered as the threshold for drought and normal year classification (Figure 3). According to above classification
(Figure 3) year 2014 (rainfall= 695.2 mm) is abnormally dry year. Figure 4 displays the frequency of dry spell
occurrences in the study area from 2002 to 2015. The dry spell analysis was done considering Indian meteorogical
week from 23rd
to 45th
. This dry spell count used is for Kharif crop water demand. The observed dry spell count in
the year 2011 was 4. Farmers do not sow seed until farm field get enough soil water content. Hence, the first dry
spell in the year 2011 was not considered for the crop water requirement calculation. Generally, in the study area,
Kharif season starts from mid-June.
Groundwater recharge area
WTF= (∆h × A × Sy)
Total water demand (Drinking and Irrigation)
Deficit/ Excess Surface water supply for drinking and irrigation = Total surface water supply – Total water
demand
Deficit surface water supply for drinking and irrigation = Total Groundwater demand
Excess\deficit groundwater availability = Groundwater availability – Total Groundwater Demand
Total surface water supply for drinking and
irrigation purpose
Groundwater availability
1) Total surface water supply
Net Groundwater Availability
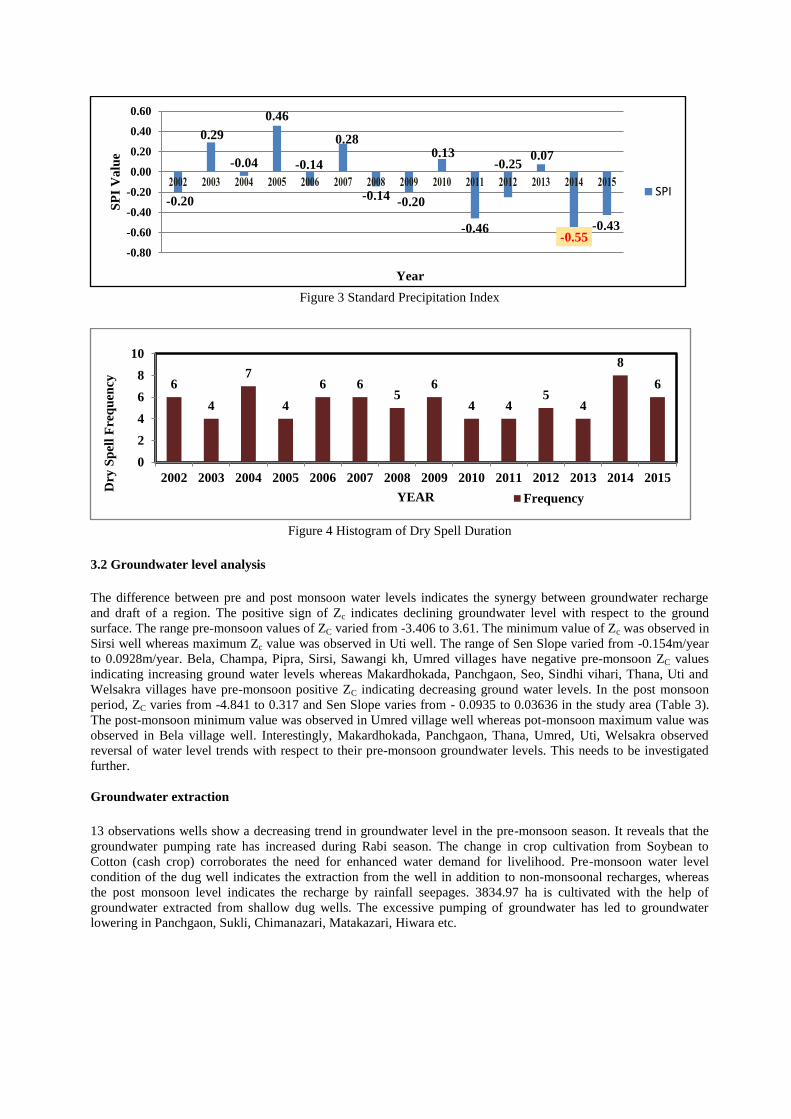
Figure 3 Standard Precipitation Index
Figure 4 Histogram of Dry Spell Duration
3.2 Groundwater level analysis
The difference between pre and post monsoon water levels indicates the synergy between groundwater recharge
and draft of a region. The positive sign of Zc indicates declining groundwater level with respect to the ground
surface. The range pre-monsoon values of ZC varied from -3.406 to 3.61. The minimum value of Zc was observed in
Sirsi well whereas maximum Zc value was observed in Uti well. The range of Sen Slope varied from -0.154m/year
to 0.0928m/year. Bela, Champa, Pipra, Sirsi, Sawangi kh, Umred villages have negative pre-monsoon ZC values
indicating increasing ground water levels whereas Makardhokada, Panchgaon, Seo, Sindhi vihari, Thana, Uti and
Welsakra villages have pre-monsoon positive ZC indicating decreasing ground water levels. In the post monsoon
period, ZC varies from -4.841 to 0.317 and Sen Slope varies from - 0.0935 to 0.03636 in the study area (Table 3).
The post-monsoon minimum value was observed in Umred village well whereas pot-monsoon maximum value was
observed in Bela village well. Interestingly, Makardhokada, Panchgaon, Thana, Umred, Uti, Welsakra observed
reversal of water level trends with respect to their pre-monsoon groundwater levels. This needs to be investigated
further.
Groundwater extraction
13 observations wells show a decreasing trend in groundwater level in the pre-monsoon season. It reveals that the
groundwater pumping rate has increased during Rabi season. The change in crop cultivation from Soybean to
Cotton (cash crop) corroborates the need for enhanced water demand for livelihood. Pre-monsoon water level
condition of the dug well indicates the extraction from the well in addition to non-monsoonal recharges, whereas
the post monsoon level indicates the recharge by rainfall seepages. 3834.97 ha is cultivated with the help of
groundwater extracted from shallow dug wells. The excessive pumping of groundwater has led to groundwater
lowering in Panchgaon, Sukli, Chimanazari, Matakazari, Hiwara etc.
-0.20
0.29
-0.04
0.46
-0.14
0.28
-0.14 -0.20
0.13
-0.46
-0.25 0.07
-0.55 -0.43
-0.80
-0.60
-0.40
-0.20
0.00
0.20
0.40
0.60S
PI
Va
lue
Year
SPI
6
4
7
4
6 6 5
6
4 4 5
4
8
6
0
2
4
6
8
10
2002 2003 2004 2005 2006 2007 2008 2009 2010 2011 2012 2013 2014 2015
Dry
Sp
ell
Fre
qu
ency
YEAR Frequency

Table 3 Groundwater Level Fluctuation Analysis - Mann-Kendall test
Village Name Pre & Post-Monsoon ZC Sen Slope Trend
Bela May -2.0156 -0.154 ↓
Oct 0.317 0.0077 ↑
Champa May -1.217 -0.0454 ↓
Oct -1.077 -0.0125 ↓
Makardhokada May 1.36 0.03636 ↑
Oct -3.282 -0.04482 ↓
Panchgaon May 1.773 0.0185 ↑
Oct -2.908 -0.0466 ↓
Pipra May -2.533 -0.088 ↓
Oct -3.687 -0.068 ↓
Seo May 2.610 0.0928 ↑
Oct 0.257 0.03636 ↑
Sindhi Vihari May 1.335 0.02 ↑
Oct -0.327 0 ↓
Sirsi May -3.406 -0.1 ↓
Oct -4.176 -0.0833 ↓
Sawangi kh May -1.413 -0.033 ↓
Oct -1.5894 -0.035 ↓
Thana May 2.285 0.0654 ↑
Oct -0.980 -0.025 ↓
Umred May -0.827 -0.0304 ↓
Oct -4.841 -0.0935 ↓
Uti May 3.61 0.064 ↑
Oct -2.877 -0.02631 ↓
Welsakra May 0.663 0.00526 ↑
Oct -0.772 -0.011 ↓
Note: ↑ - Increasing Trend; ↓ - Decreasing trend
Rainfall- Groundwater recharge relationship
The ratio of groundwater recharge to rainfall within the study area was found to be in range of 4% to 13 %. These
recharge values are consistent in earlier studies on groundwater development in hardrock (Limaye, 2009). Seasonal
fluctuation of water table is correlated with the monsoon rainfall (correlation coefficient 0.56). The negative
groundwater level fluctuation occurred in post- monsoon is attributed to abstraction in Kharif season influenced by
dry spell events. In contrast, the positive groundwater level fluctuation occurred in few villages is due to the
construction of water storage structure. These observations highlight the unpredictable nature of hard rock aquifers.
However groundwater level rises with higher rainfall in the same well, higher rainfall does not ensure higher
recharge over the entire region.
3.3 Surface water supply (deficit/excess)
Rainfall is the main source for groundwater recharge and surface storage in the semi-arid region. Stored water in
the storage structure and conveyance structures contribute to the recharge of nearby wells. The average surface
water supply of all villages was 166538.859 m3
for the year 2011. The maximum surface water supply in the village
was 1386945 m3 (Figure 5a). Water demand of the individual villages was calculated by considering annual crop
water irrigation requirement mainly in Kharif and Rabi seasons and drinking water demands for population and
livestock. The annual mean water demand was 307818.042 m3 with the maximum water demand of 2383641.006
m3 (Figure 5b).
The deficit/excess surface water supply was estimated as the difference between the water supply and demand.
Positive balance indicates the excess of water whereas negative balance indicates the deficit or scarcity. It was
found that 170 villages suffered from surface water deficit/water-scarce. The average annual net surface water
supply was found +141279 m3 in the year 2011 and minimum deficit surface water supply was -1121400 m
3
(Figure 5c).

3.4 Groundwater Availability (deficit/excess)
Groundwater recharge for the year 2011 was calculated using water table fluctuation method. Considering pre-
monsoon and post-monsoon water level of the well of the villages, we calculated change in water level. The
average annual recharge for the year 2011 was 1,96,812.63 m3, the minimum was 3,688.12 m
3 and the maximum
was 11,51,411.23 m3 over the region (Figure 5d).
The deficit/ excess groundwater availability at village level was estimated as the difference between groundwater
recharge and groundwater demand. The average net groundwater availability of the year 2011 was 55,533.45 m3.
The minimum net groundwater availability was -8,92,098.15 m3 in 2011. The maximum net groundwater
availability was 9,58,001.23 m3 in 2011. There were 60 villages that have deficit groundwater availability. Those
villages were classified as water stress villages (Figure 5e and 5f) requiring crop management.
The following crop management for water stressed villages is suggested: a) avoid distribution losses, b) minimize
or stop summer cropping (nominal area) practices and ban the water-intensive crops in Rabi season too and c)
construct storage and recharge structures.
Figure 5a Total Surface Water Supply in Umred Tehsil Figure 5b Total Water Demand in Umred Tehsil
Figure 5c Deficit/Excess of Surface Water Supply Figure 5d Groundwater Availability of Umred Tehsil

Figure 5e Deficit/Excess Groundwater Availability Figure 5f Percentage Deficit/Excess Groundwater
Availability with Respect to Total Water Demand
3.5 Cost-Benefit Analysis for Principle Crops
By considering water input as cost and net profit as benefit, we performed cost-benefit analysis. The minimum
Cost- Benefit Ratio (CBR) will indicate the best suitable crop (Table 5 and Figure 6).
Table 4 Principle Crops in the Study Area
Sr.no. Principle
Crop Season
Irrigation
Type
Total Crop Water requirement
(mm)
Crop Duration
(days)
1. Cotton Kharif Irrigated 700-1300 180-195
2. Paddy Kharif Irrigated 450-700 90-150
3. Soybean Kharif Rainfed 450-700 135-150
4. Wheat Rabi Irrigated 450-600 120-150
5. Total pulse Rabi Irrigated 450-700 75-110
6. Sorghum Rabi Rainfed 450-600 120-130
(Data Source: Food and Agriculture Organization, 2016, and Government of Maharashtra)
Considering the assumption, in the normal rainfall scenario a) Cotton (CBR=0.45), b) Paddy and Sorghum
(CBR=0.49) were best suited for irrigated arable land in Kharif and Rabbi season respectively. Similarly, for
rainfed arable land a) Soybean and Sorghum (CBR=1.10), b) Soybean and Pulses (1.18) were appropriate crop
pattern in Kharif and Rabi season respectively. In worst rainfall scenario, for both irrigated and rainfed arable land,
the most suitable crop pattern were a) Soybean and Sorghum (CBR=1.10), b) Soybean and Pulses (CBR=1.18) in
Kharif and Rabi season respectively.

Table 5 Cost-Benefit Analysis for Crops
Principle
Crop
Total Water
Requirement in
Thousand Cubic
Meter Per Acre
Yield
Per Acre
(In
Quintal
Per
Acre) **
Initial
Investment (In
Thousand
Rupees Per
Acre)**
Market Price
(In Thousand
Rupees Per
Acre)**
Net Profit (In
Thousand
Rupees Per
Acre)
Min. Cost
Benefit
Ratio (Per
Acre)
Max. Cost
Benefit
Ratio (Per
Acre)
Average
Cost
Benefit
Ratio (Per
Acre)
Cotton 7 to 13 5 to 10 12 to 15.5 22.5 to 45 10.5 to 29.5 0.67 0.24 0.45
Paddy 4.5 to 7 8 to 10 11 32 to 40 21 to 29 0.21 0.16 0.18
Soybean 4.5 to 7 5 to 7 11 15 to 21 4 to 10 1.13 0.45 0.79
Wheat 4.5 to 6 10 to 12 14 20 to 24 6 to 10 0.75 0.45 0.60
Total pulse 4.5 to 7 4 to 6 10.8 to 14 20 to 30 9.2 to 16 0.49 0.28 0.39
Sorghum 4.5 to 6 8 to 10 12 24 to 30 12 to 18 0.38 0.25 0.31
(Data Source: **Agmarket,2016, and field survey)
Figure 6 Cost Benefit Analysis of Principle Crops in Umred Tehsil
4. CONCLUSION
This study shows that systematic groundwater assessment at village level using geospatial database could be used
effectively to assess water scarcity. In the present study, the geospatial database facilitated an analysis of different
parameters affecting water demand and supply. Some of the specific observations are:
1) 60 villages out of 192 (~31%) suffered from deficiency of groundwater availability whereas remaining 132
villages (~69 %) have excess groundwater availability. The maximum and minimum water demand was
2383641.006 m3 and 0 m
3 respectively. 2) If dry spell occurs continuously, it leads to loss of crops and less yield.
Use of drip irrigation (supplement irrigation) during dry spell will ensure judicious use of available water.
Cultivation of relatively less water intensive crops like Soybean (instead of water-intensive Cotton) should be
adopted during dry spell period. 3) According to cost-benefit analysis, Cotton is the best suitable crop for villages
with adequate irrigation facilities in Kharif and Rabi season both. If irrigation facilities (supplement irrigation) are
available only in Kharif season then Paddy in Kharif and Sorghum in Rabi season is the best crop pattern. In the
absence of irrigation facility, farmers should go for ‘Soybean and Sorghum’ or ‘Soybean and Pulses’ combination
of crops. 4) In the individual farm level, farmers should dig farm level ponds for artificial groundwater recharge. At
the village level, construction of surface water storage structures should be adopted with community participation.
5. REFERENCES
Agarwal, R., Garg, P. K., and Garg, R. D, 2013. Remote sensing and GIS based approach for identification of
artificial recharge sites. water resources management, 27(7), pp. 2671–2689.
Agmrket, 2016. Reterived July, 2016, from
http://www.agmarknet.nic.in/agnew/NationalBEnglish/DatewiseCommodityReport.aspx
Anbazhagan, S, and Jothibasu, A. 2016. Geoinformatics in groundwater potential mapping and sustainable
development: a case study from southern India. Hydrological Sciences Journal, 61(6), pp. 1109–1123.
CGWB, 2009. Detailed guidelines for implementing the ground water estimation methodology, Ministry of water
resources, Government of India from http://www.cgwb.gov.in/documents/GEC97-Detailed_Guidelines.pdf, pp. 218

CGWB, 2014. Report on the Dynamic ground water resources of India (2011-2014), pp. 33.
Dewandel, B., Perrin, J., Ahmed, S., Aulong, S., Hrkal, Z., Lachassagne, P., Massuel, S. (2010). Development of a
tool for managing groundwater resources in semi-arid hard rock regions: Application to a rural watershed in South
India. Hydrological Processes, 24(19), pp. 2784–2797.
Doll, P., Hoffmann-Dobrev, H., Portmann, F. T., Siebert, S., Eicker, A., Rodell, M., Scanlon, B. R. 2012. Impact of
water withdrawals from groundwater and surface water on continental water storage variations. Journal of
Geodynamics, 59-60, pp. 143–156.
Food and Agriculture Organization .2016, Retrived July 23, 2015 from
http://www.fao.org/docrep/s2022e/s2022e07.htm
Goyal, S. K., Chaudhary, B. S., Singh, O., Sethi, G. K., and Thakur, P. K. 2010. Variability analysis of groundwater
levels - A GIS-based case study. Journal of the Indian Society of Remote Sensing, 38(2), pp. 355–364.
GSDA Pune. 2014. Report on the Dynamic Ground Water Resources of Maharashtra (2011-2012), pp. 167.
India Water Portal. 2016. Retrieved July 21, 2015, from www.indiawaterportal.org/met_data
Josemir Neves. 2012. Compute SPI index, Retrieved September 20, 2016 from https://cran.r-
project.org/web/packages/spi/spi.pdf
Kamaraju, M.V.V., Bhattacharya, A., Reddy, G. S., Rao, G. C., Murthy, G. S. and Rao, T. Ch. M. 1996, Ground-
water potential evaluation of west Godavari district, Andhra Pradesh state, India—A GIS approach. groundwater,
34 pp. 318–325.
Krishnamurthy, J., Manavalan, P., & Saivasan, V. 1992. Application of digital enhancement techniques for
groundwater exploration in a hard-rock terrain. International Journal of Remote Sensing, 13(15),pp. 2925-2942.
Limaye S.D 2009. Groundwater development in hard rock. Retrieved September 9, 2016,
from http://www.eolss.net/Sample-Chapters/C07/E2-09-05-05.pdf.
Maharain. 2016. Retrieved 2015, from www.maharain.com
Machiwal, D., & Jha, M. K. 2014. Characterizing rainfall-groundwater dynamics in a hard-rock aquifer system
using time series, geographic information system and geostatistical modelling. Hydrological Processes, 28(5), pp.
2824–2843.
Nagarajan R. 2006. Water conservation, use and management for semiarid regions, Capital Publishing Company,
New Delhi, pp.353, ISBN-81-85589-34-8.
Oke, M. O., Martins, O., & Idowu, O. A. 2014. Determination of rainfall-recharge relationship in River Ona basin
using soil moisture balance and water fluctuation methods. International Journal of Water Resources and
Environmental Engineering, 6(1), pp. 1–11.
Rai, S. N., Manglik, A., & Singh, V. S. 2006. Water table fluctuation owing to time-varying recharge, pumping and
leakage. Journal of Hydrology, 324(1-4), 350–358.
Saha, D., & Agrawal, A. K. 2006. Determination of specific yield using a water balance approach–case study of
Torla Odha watershed in the Deccan Trap province, Maharastra State, India. Hydrogeology Journal, 14(4), 625-
635.
Sander, P. 1996. Remote Sensing and GIS For Groundwater Assessment in Hard Rocks: Applications to Water
Well Siting in Ghana and Botswana. PhD dissertation, Chalmers University of Technology, Sweden, Publ. A 80.
Saraf,et al. 1998. Integrated remote sensing and GIS for groundwater exploration and identification of artificial
recharge sites. International journal of remote sensing, 19(10) , pp.1825-1841.
Santander Meteorology Group, 2012. FUME Package, Retrieved September 20,2016. from
http://www2.uaem.mx/r-mirror/web/packages/fume/fume.pdf.
Singh, A. 2013. Simulation and optimization modeling for the management of groundwater resources. I: Distinct
Applications. Journal of Irrigation and Drainage Engineering, 140(4), pp. 4013021.
Semere S. 2003. Remote Sensing and GIS: Applications for Groundwater Potential Assessment in Eritrea, Royal
Institute of Technology, Sweden .pp.1-147.
Turner, A. G., & Annamalai, H. 2012. Climate change and the South Asian summer monsoon. Nature Climate
Change, 2(8),pp. 587–595.
United States Geological Survey (USGS) 2016, Earth Explorer, Retrieved July 25, 2015, from
http://earthexplorer.usgs.gov/.
WWAP, U. 2003. United Nations World Water Assessment Programme. The World Water Development Report 1:
Water for People, Water for Life.