· Web viewthe role of the choke coil, as a high impedance at high frequencies, is to be a barrier...
93
Measurement of a Computerized Machine Tool Controller BMEVIVEM264 Szamel, László Kohari, Zalán Created by XMLmind XSL-FO Converter.
Transcript of · Web viewthe role of the choke coil, as a high impedance at high frequencies, is to be a barrier...

Measurement of a Computerized Machine Tool Controller
BMEVIVEM264
Szamel, LászlóKohari, Zalán
Created by XMLmind XSL-FO Converter.

Measurement of a Computerized Machine Tool Controllerírta Szamel, László és Kohari, Zalán
Publication date 2012Szerzői jog © 2011
Created by XMLmind XSL-FO Converter.
Tartalom1. Insulation diagnostics ....................................................................................................................... 1
1. Motivations for insulation diagnostics ................................................................................... 12. Insulation resistance measurement of transformers ............................................................... 13. Partial discharge measurement ............................................................................................... 2
3.1. Definition, types ......................................................................................................... 23.2. PD measurement techniques ...................................................................................... 33.3. Data processing .......................................................................................................... 53.4. PD measurement on electrical rotating machines ...................................................... 6
4. Measurement tasks to perform ............................................................................................... 74.1. Insulating resistance ................................................................................................... 74.2. Partial discharge measurement .................................................................................. 7
5. Test questions ......................................................................................................................... 86. References .............................................................................................................................. 87. Test log ................................................................................................................................... 9
7.1. Insulation resistance measurement ............................................................................ 97.2. Partial discharges measurement ................................................................................. 9
7.2.1. PD measurement in current transformer ....................................................... 97.2.2. PD measurement in case of needle-plane electrodes .................................... 97.2.3. PD measurement in case of plane insulator between different sized plane electrodes .............................................................................................................. 10
2. Investigation of electrical switching devices ................................................................................. 111. Knowledge base necessary for accomplishing the lab work: ............................................... 112. Investigation of medium voltage vacuum circuit breaker .................................................... 11
2.1. Tasks to be accomplished ........................................................................................ 122.2. The devices used for the measurement .................................................................... 122.3. Measurement and evaluation ................................................................................... 13
3. Investigation of MCB overload behavior ............................................................................. 143.1. Measurement and evaluation ................................................................................... 143.2. The devices used for the measurement .................................................................... 153.3. Steps of measurement and evaluation ..................................................................... 153.4. References and further readings .............................................................................. 16
3. Measurement of Magnetic Field of Electric Machines .................................................................. 171. Object of measurement ......................................................................................................... 172. Measurement tasks ............................................................................................................... 173. Procedure of the measurement ............................................................................................. 184. Operation of the 600 kV test transformer ............................................................................. 19
4.1. Conditions and procedure of the switch on of the equipment ................................. 204.2. Procedure of the switch off ...................................................................................... 21
5. Control questions .................................................................................................................. 216. Template of measuring report ............................................................................................... 21
6.1. Measurement of Magnetic Field of Electric Machines ........................................... 216.2. Indoor measurement perpendicular to the cable duct .............................................. 226.3. Outdoor measurement close to the transformer, perpendicular to the cable duct .... 226.4. Outdoor measurement between the high voltage laboratory and the transformer, parallel to the cable duct .................................................................................................................. 23
4. Investigation of windings of electric machines ............................................................................. 241. Distribution of the overvoltage inside the winding of transformers .................................... 24
1.1. Initial voltage distribution inside the winding ......................................................... 24
Created by XMLmind XSL-FO Converter.

Measurement of a Computerized Machine Tool Controller
1.2. Effect of steepness on the initial voltage distribution .............................................. 262. Voltage distribution after a certain time ............................................................................... 26
2.1. Effect of the steepness of the damping part of the wave on voltage Umax ................ 283. Examination with chopped voltage wave ............................................................................. 294. Experimental study of voltage distribution, deteminaton of oscillation diagram ................ 31
4.1. Examination of stresses in a transformer of delta connection ................................. 334.2. Overvoltage transported between coils situated at the same column ...................... 334.3. High voltage tests .................................................................................................... 34
5. Task of measurement ............................................................................................................ 355.1. Description of the measurement ............................................................................. 36
5. Investigation of Salient pole Synchronous Machine ..................................................................... 371. The object of measurement .................................................................................................. 372. Theoretical basics ................................................................................................................. 37
2.1. Scope of synchronous machine ............................................................................... 372.2. Operation of synchronous machine ......................................................................... 372.3. Requirements for connecting to the mains .............................................................. 37
3. Statement of the task ............................................................................................................ 373.1. Main equipment of the investigated arrangement .................................................. 373.2. The process of measurement .................................................................................. 383.3. Recording the no-load and the short-circuit diagrams ............................................ 413.4. Connecting of synchronous machine to the mains (synchronizing) ........................ 423.5. Control of active and reactive power. Change of load-angle δ ............................... 423.6. Recording of current-vectordiagram ....................................................................... 423.7. Recording of V-curves ............................................................................................ 433.8. Recording of P(δ) curves ........................................................................................ 44
4. Evaluation of measurement, protocol ................................................................................... 455. Questions ............................................................................................................................. 456. Recommended literature ..................................................................................................... 46
6. Frequency converter-fed field-oriented controlled induction motor drive Error: Reference source notfound
1. The keywords of the necessary knowledge: ......................................................................... 472. Introduction .......................................................................................................................... 47
2.1. The components of the drive .................................................................................. 472.2. The driven machine ................................................................................................ 482.3. The used instruments ............................................................................................... 482.4. Manipulation of the drive ........................................................................................ 482.5. The process of the switching on .............................................................................. 482.6. Measuring tasks ....................................................................................................... 49
2.6.1. Setting the parameters, using the graphical interface. ................................ 492.6.2. Investigating the characteristic Park-vector loci and time functions. ......... 492.6.3. Investigating the input current time function. ............................................. 492.6.4. Open-loop control of IM (without speed feedback) with slip comensation (scalar control). ................................................................................................................. 492.6.5. Open loop vector control of IM (sensorless field-orinted control) ............. 492.6.6. Closed loop vector control (filed-oriented control) of IM .......................... 49
7. Examination of switched reluctance motor drives ......................................................................... 521. Purpose of this exercise ........................................................................................................ 522. Theoretical basics ................................................................................................................. 52
2.1. Design of SRM ........................................................................................................ 522.2. Power supply of SRM drives ................................................................................... 52
3. Details for the measurement ................................................................................................. 533.1. Main components of the drive ................................................................................. 53
Created by XMLmind XSL-FO Converter.
Measurement of a Computerized Machine Tool Controller
3.2. Power supply of the SRM drive .............................................................................. 543.3. Drive startup ............................................................................................................ 553.4. Operation of the drive .............................................................................................. 563.5. Using the Voltech 3-phase power analyzer (PA) for power measurements ............ 56
4. Measurement exercises ........................................................................................................ 564.1. Overview of the circuit, the operation of the SRM drive ........................................ 564.2. Checking the current shapes under different load and at rotation speeds ................ 564.3. Checking the current Park-vector ............................................................................ 574.4. Calculating the drive efficiency ............................................................................... 57
5. Questions .............................................................................................................................. 576. References ............................................................................................................................ 57
8. Measurement of a speed controlled DC servo drive ...................................................................... 581. Scope of the measurement .................................................................................................... 582. Theoretical background of the measurement ....................................................................... 58
2.1. Characteristics of PMDC servo drives .................................................................... 582.2. Features of the servo amplifier ................................................................................ 592.3. Control of the servo drive ........................................................................................ 59
3. Introduction of the measurement .......................................................................................... 593.1. Main components of the drive being studied ........................................................... 593.2. Startup and handling of the drive ............................................................................ 60
4. Measurement tasks ............................................................................................................... 604.1. Measurement of the torque characteristics .............................................................. 604.2. Investigation of effects of current limitation ........................................................... 604.3. Investigation of current and speed curves with different speed reference signals . . 614.4. Measurement of the Bode diagram of the control loop ........................................... 61
5. Test questions ....................................................................................................................... 616. Questions to think about ....................................................................................................... 617. References ............................................................................................................................ 61
9. Computerized Machine Tool Controller ........................................................................................ 621. Scope of the measurement .................................................................................................... 622. Theoretical background of the measurement ....................................................................... 62
2.1. Characteristics of PMDC servo drives .................................................................... 622.2. Features of the servo amplifier ................................................................................ 632.3. Control of the servo drive ........................................................................................ 63
3. Introduction of the measurement .......................................................................................... 643.1. Main components of the drive being studied ........................................................... 643.2. Startup and handling of the drive ............................................................................ 64
4. Measurment tasks ................................................................................................................. 654.1. Become familiar to control tasks regarding the machining tool .............................. 654.2. Investigate the movements on an oscilloscope ........................................................ 654.3. Trajectory design ..................................................................................................... 654.4. Trajectory programming .......................................................................................... 654.5. Trajectory following test .......................................................................................... 66
5. Test questions ....................................................................................................................... 666. Questions to think about ....................................................................................................... 667. References ............................................................................................................................ 66
Created by XMLmind XSL-FO Converter.

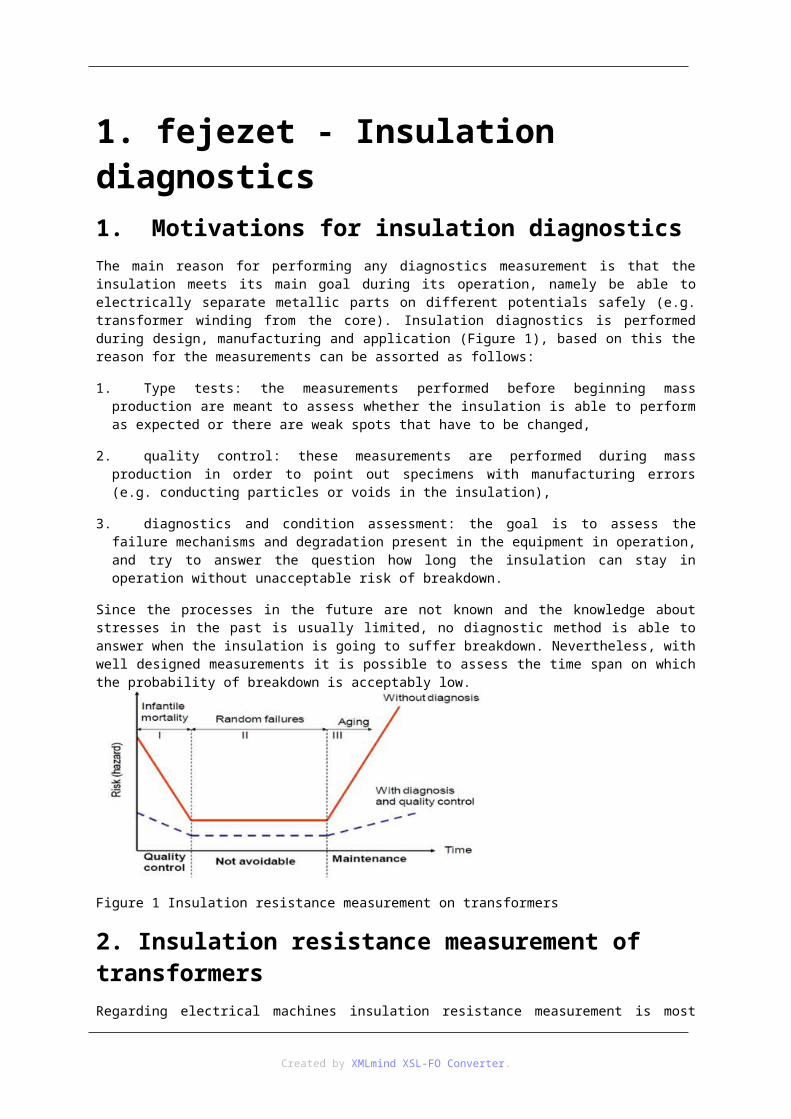
1. fejezet - Insulation diagnostics1. Motivations for insulation diagnosticsThe main reason for performing any diagnostics measurement is that the insulation meets its main goal during its operation, namely be able to electrically separate metallic parts on different potentials safely (e.g. transformer winding from the core). Insulation diagnostics is performed during design, manufacturing and application (Figure 1), based on this the reason for the measurements can be assorted as follows:
1. Type tests: the measurements performed before beginning mass production are meant to assess whether the insulation is able to perform as expected or there are weak spots that have to be changed,
2. quality control: these measurements are performed during mass production in order to point out specimens with manufacturing errors (e.g. conducting particles or voids in the insulation),
3. diagnostics and condition assessment: the goal is to assess the failure mechanisms and degradation present in the equipment in operation, and try to answer the question how long the insulation can stay in operation without unacceptable risk of breakdown.
Since the processes in the future are not known and the knowledge about stresses in the past is usually limited, no diagnostic method is able to answer when the insulation is going to suffer breakdown. Nevertheless, with well designed measurements it is possible to assess the time span on which the probability of breakdown is acceptably low.
Figure 1 Insulation resistance measurement on transformers
2. Insulation resistance measurement of transformersRegarding electrical machines insulation resistance measurement is most important in case of transformers. In case of insulation diagnostic measurements the windings, the core and the vessel form a multi-electrode system. Between these electrodes lie the insulations of the transformer. Regarding high voltage power transformers, these are in almost all cases oil-paper insulations.
The components of the insulation have strong influence on each other. The paper adsorbs some of the contamination causing conduction in the oil (ionic particles, ageing products and a part of paper), accordingly elevating the volume resistance of the oil. At the same time, products originating from the ageing of the paper dissolve in the oil, due to mechanical impacts (e.g. dynamic effect of inrush current) paper fiber makes its way to the oil. Water in the paper accelerates ageing badly: in case of 3% of water content the average length of molecules halve ten times faster than in case of 0,3%.
The value of the insulation resistance is the function of water content and ageing. The conductivity of the oil impregnated paper is given in terms of its specific (volume) resistivity. The increment of the water content by 1% decrements this value by one order. This is the basis of the application of resistivity measurement on power transformers as a diagnostic tool. Meanwhile it has to be considered that the results of insulation resistivity measurement are specific to that particular object, while volume resistivity is characteristic of the material. The
Created by XMLmind XSL-FO Converter.
Insulation diagnostics
latter cannot be measured in real-life conditions.
In practice insulation resistivity measurements and the calculated absorption coefficient are applied for the condition assessment of transformers. Other methods of transformer diagnostics based on the measurement of dielectric properties are high time constant polarization spectrum measurement by means of recovery voltage measurement and loss tangent and capacity measurement. To perform dielectric measurements on a transformer it has to be taken out of service and the conductors connecting to the measured winding have to be dismounted.
In practice insulation resistivity measurements and the calculated absorption coefficient are applied for the condition assessment of transformers. Other methods of transformer diagnostics based on the measurement of dielectric properties are high time constant polarization spectrum measurement by means of recovery voltage measurement and loss tangent and capacity measurement. To perform dielectric measurements on a transformer it has to be taken out of service and the conductors connecting to the measured winding have to be dismounted.
The above mentioned properties are all dependent on temperature. The temperature of the transformer, due to its size, cannot be treated as homogeneous. At the same time during measurements we have to settle for the indication of the temperature gauge of the transformer of the temperature calculated from the DC resistivity measurements of the winding. The latter gives more accurate results, since we measure the dielectrics separating the core from the windings themselves.
Insulation resistivity measurement is carried out as current measurement in case of DC voltage excitation. After switching of the voltage source the current decays near exponentially and it becomes constant just after a shorter or longer time, meaning that the voltage/current ratio – the insulation resistance – is increasing accordingly. This can be easily understood if we consider the general equivalent circuit of insulating materials (Figure 2). When we switch on the DC supply, the current will have different components. The fastest decaying is the component charging C geo, the geometric or vacuum capacitance. This component is also present when there is no insulating material between the electrodes. Its name comes from the fact that it symbolizes the capacitance which is given from the electrode configuration. Due to electric field, polarization effects start to develop in the material, which process needs time. The R i C i elements represent the magnitude and through the time constant of the RC element the velocity of development. The stationary current we would like to measure is coming from R 0.
Considering the time constants of the polarization effects and the restrictions of field measurements, the R o
insulation resistance is defined as the resistivity value measured after 60 seconds of switching on the power supply. The insulation resistivity should be measured on every voltage level and phase. Commercially available devices usually operate with 1 kV, 2.5 kV or 5 kV of maximum voltage. As mentioned before, R o is temperature dependent. Accordingly, the measured value has to be corrected with a method given in the concerning standard to a reference temperature.
As the condition of the transformer insulation is represented not only in the insulation resistance but also in the polarization effects, the so called absorption coefficient (K A) was introduced to represent both of them. It is calculated as the ratio of the value measured at 60 and 15 seconds (K A =R o 60 /R o 15). The value of K A is decreasing with the aging of the insulation. Another advantage of using the absorption coefficient is that it characterizes the effects in the insulating material, and with calculation of the ratio the effects of the electrode configuration is eliminated, so that results from different transformer constructions can be compared.
Figure 2 Partial discharge measurement
3. Partial discharge measurement3.1. Definition, typesIf we place insulating material between electrodes and we start to elevate the electric field, we get very low current until we stay below the electrical strength of the material. Exceeding the electrical strength the material
Created by XMLmind XSL-FO Converter.
Insulation diagnostics
cannot resist further to the electrical field and breakdown occurs. Partial discharges occur when the insulation breaks down partially, but the discharge does not bridge the electrodes. Basically 3+1 types of partial discharges (PD) can be distinguished: internal or void discharge, surface discharge, corona discharge plus treeing, which means the presence of PD and is a process very close to breakdown (Figure 3…Figure 6).
Figure 3
Figure 4
Figure 5
Figure 6
The application of PD measurement as a diagnostic tool has several reasons. The high temperature of discharges, even when they are just partial, degrades the organic insulation materials. Compared to the other ageing processes, they lead the fastest to breakdown, accordingly we can expect this measurement to predict breakdown. PD can be also an indicator of failure mechanisms, even if they do not cause degradation themselves. Their appearance can indicate e.g. the delamination of the layers of a multi-layer insulation.
3.2. PD measurement techniquesPartial discharges do not mean the bridging of the electrodes and transferring charge from one electrode to other, but in the small space where the PD occurs, ionization processes are initiated and due to the electric field the ions and electrons start to move, charge separation is evolving. Due to their small weight, electrons can accelerate to almost the speed of light. On the electrodes the charge separation appears as a small amount of
Created by XMLmind XSL-FO Converter.

Insulation diagnostics
charge and accordingly a small current impulse. At the location of the PD the current impulse has a very short duration in orders of nanoseconds. During its propagation – either in cables or in winding systems – the current impulse is suffering dispersion and during propagation the high frequency components are attenuated heavily, and accordingly the rising time is getting longer.
Figure 7
The real amount charge flowing in the discharge itself is not measureable at the electrodes. This can be understood considering the capacitive equivalent circuit of partial discharges (Figure 7). In the circuit the C v
capacitance represents the capacitance of the void itself, C s represents the dielectric “in series” with this, while C p represents the capacitance of all the other dielectric (e.g. the capacitance of the cable section). Prior to the PD the C v capacitance of the void is charged to a voltage V b. In the moment of the PD, this voltage collapses to a voltage V r called remaining voltage. The voltage change occurring on the C p capacitance is approximately dependent on the C s /C p ratio, the so called apparent charge measurable at the electrodes is approximately proportional to C s.
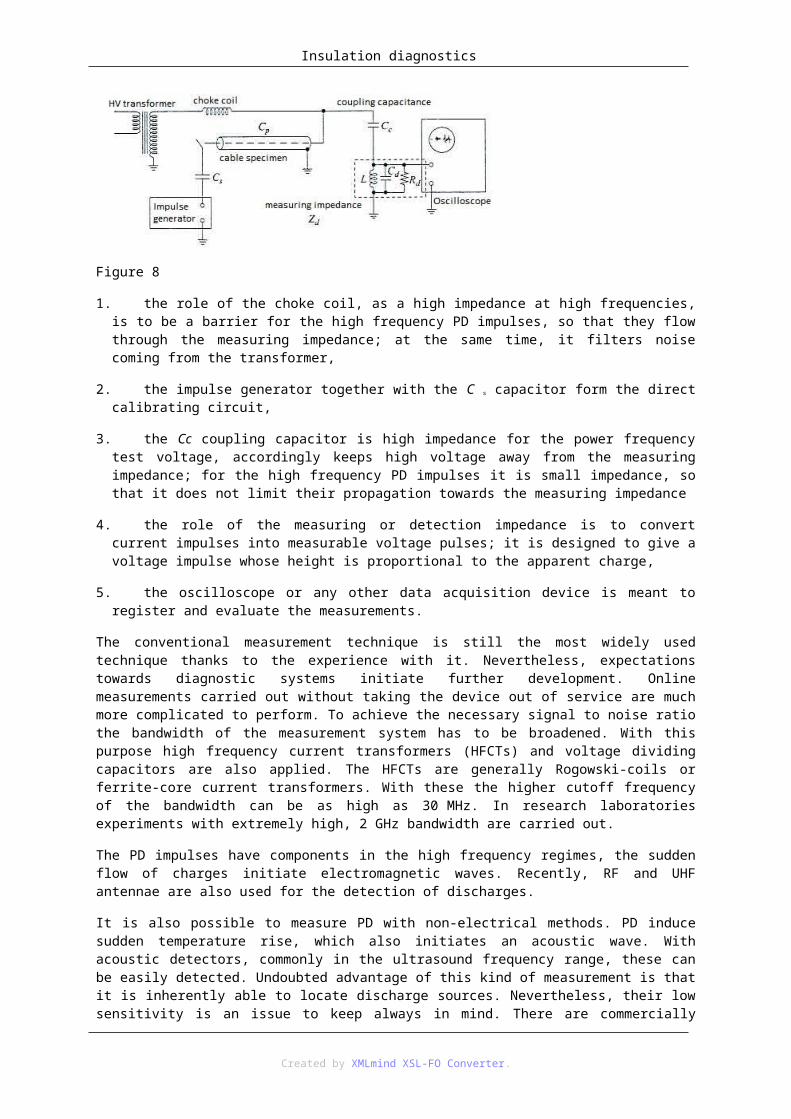
The conventional measurement technique (Figure 8) is based on the measurement of the apparent charge. As a first approach, the level of degradation of the insulation can be considered as to be proportional to the apparent charge. Accordingly the measurement is carried out with an integrating circuit, which higher cutoff frequency is usually not higher than 1 MHz, common values are between 200 and 800 kHz. As the C s capacitance is different for each specimen, the measuring system has to be calibrated. This is performed by the injection of a known charge impulse into the specimen through the calibrating capacitor (C s). The function of the elements of the circuit:
1. The HV transformer feeds the circuit with the necessary high AC voltage,
Figure 8
1. the role of the choke coil, as a high impedance at high frequencies, is to be a barrier for the high frequency PD impulses, so that they flow through the measuring impedance; at the same time, it filters noise coming from the transformer,
2. the impulse generator together with the C s capacitor form the direct calibrating circuit,
3. the Cc coupling capacitor is high impedance for the power frequency test voltage, accordingly keeps high voltage away from the measuring impedance; for the high frequency PD impulses it is small impedance, so that it does not limit their propagation towards the measuring impedance
4. the role of the measuring or detection impedance is to convert current impulses into measurable voltage pulses; it is designed to give a voltage impulse whose height is proportional to the apparent charge,
5. the oscilloscope or any other data acquisition device is meant to register and evaluate the measurements.
Created by XMLmind XSL-FO Converter.

Insulation diagnostics
The conventional measurement technique is still the most widely used technique thanks to the experience with it. Nevertheless, expectations towards diagnostic systems initiate further development. Online measurements carried out without taking the device out of service are much more complicated to perform. To achieve the necessary signal to noise ratio the bandwidth of the measurement system has to be broadened. With this purpose high frequency current transformers (HFCTs) and voltage dividing capacitors are also applied. The HFCTs are generally Rogowski-coils or ferrite-core current transformers. With these the higher cutoff frequency of the bandwidth can be as high as 30 MHz. In research laboratories experiments with extremely high, 2 GHz bandwidth are carried out.
The PD impulses have components in the high frequency regimes, the sudden flow of charges initiate electromagnetic waves. Recently, RF and UHF antennae are also used for the detection of discharges.
It is also possible to measure PD with non-electrical methods. PD induce sudden temperature rise, which also initiates an acoustic wave. With acoustic detectors, commonly in the ultrasound frequency range, these can be easily detected. Undoubted advantage of this kind of measurement is that it is inherently able to locate discharge sources. Nevertheless, their low sensitivity is an issue to keep always in mind. There are commercially available systems for continuous online monitoring of power transformers. These consist of more, usually piezoelectric sensors, with that they are able to pinpoint exactly the failure spots.
During the discharges the electrons get to an excited state. While the fall back to their original position, they emit their energy as photons, most of them in the UV light range. In case of transparent insulating media PD can be detected optically.
3.3. Data processingThe reasons for post-measurement data processing are:
1. achieve as effective noise filtering as possible,
2. automatically distinguish between different types of discharges sources and separation from noise,
3. location the failure.
The noise filtering is necessary because the PD impulses are minute signals, usually in orders of picocoulombs. These have to be measured in a noisy industrial or substation environment. Furthermore the external noise or the switching impulses of power electronics can be very similar to the PD signals. If we are not prepared for that, the measurement can give a false positive result, which means that we qualify a device in good condition as faulty. Needless to say what the reactions of the leader of the substation or power plant would be due to the money spent on the “reparation” of a device in good condition.
Fortunately there are techniques that help us to prevent these mistakes to happen. At the beginnings of PD measurements digital techniques were not yet available, so the measurements had to be carried out in the presence of an expert, who, with many years of experience, from the flashing signals appearing on the oscilloscope screen was able to distinguish between noise and several discharge sources. They discovered that different phenomena have different behavior in function of the phase angle of the test voltage. This is of big importance, because the different phenomena represent different levels of danger to the insulation. Research during the last two decades all had the goal to translate the knowledge of the experts to a sophisticated automated system. Below a list of these techniques can be found. Their detailed explanation is beyond the scope of this syllabus.
1. pulse phase analysis, PPA
It is based on the fact that the distribution of discharges along the test voltage is different for noise and for the different phenomena:
1. noise has no correlation with test voltage phase, while disturbances (e.g. phase controlled power electronics) have perfect correlation,
2. corona discharges appear symmetrically to the peak of the voltage,
3. surface discharges occur after the zero crossing,
Created by XMLmind XSL-FO Converter.

Insulation diagnostics
4. internal discharges appear before the zero crossing and they do not appear after the peak.
This technique was supplemented with several further methods:
1. statistical analysis: it describes the distribution of discharges quantitatively with in terms of statistical expressions and their relation to the normal distribution (mean value, skew, kurtosis etc.); gives good results if only one type of discharge source is present, but it is not able to separate different phenomena,
2. neural networks: tries to simulate human recognition; needs large amount of teaching information and has quite high computation resource demands,
3. fuzzy logic: partial discharges are dependent in a complex way on many, sometimes not known phenomena; exactly this kind of phenomena is called “fuzzy” in English, accordingly fuzzy logic is inherently able to process PD signals; it can handle problems whose relations are not known or vague; for proper operation it needs large number of rules, that are usually unknown for real insulations,
4. wavelet transform: the goal of its application is noise reduction; it lies between time and frequency domain analysis; after decomposing a signal into different “wavelets”, it is able to distinguish between noise and PD impulses,
5. fractal analysis: as fractals are able to describe the shape of objects, they are able to describe the three-dimensional patterns of the PPA.
1. Pulse magnitude analysis, PMA
During the measurement the magnitude of discharges is recorded and a histogram is calculated. The Weibull-distribution if fit to the resulting density. According to recent research the scale and shape parameter of the Weibull-distribution are characteristic to the PD type. In case of more PD sources, the five parameter distribution is used, where the distribution is the sum of two two-parameter distribution and the fifth coefficient describes the weight of each phenomenon in the resulting distribution.
1. Time-frequency mapping
It is a newly developed technique. PD signals are measured with very high bandwidth. The impulses are treated separately, and not their integrated charge but their length and characteristic frequency content are measured. Then the discharges are mapped on a two dimensional diagram in function of the length and frequency. Different phenomena has different location on the map and the borders of the groups are determined by means of fuzzy-c clustering.
3.4. PD measurement on electrical rotating machinesIn case of rotating machines the assessment of the type and danger of the discharges is essential, as their insulation over 3 kV cannot be designed to be PD free (in other devices, e.g. cables, their presence is practically unacceptable). In most cases, PD is not dangerous, because many parts are made of PD resistant materials like mica. Accordingly, the measurement system has to indicate failure if the magnitude of the discharges is too high. The only question to answer is the meaning of “too high”… Based on the experience, which in case of rotating machines includes already 20 years of online measurements, critical levels can be determined.
The online monitoring of PD – their continuous measurement – is the most widely used in the insulation diagnostics of stators. In North-America almost 50% of the power plant generators are equipped with this kind of devices and are used to plan maintenance. PD is usually indicator (but not a root cause) of the following failures:
1. overheating,
2. cyclic load,
3. contamination with partly conducting particles,
4. loose winding in the stator slots,
5. different manufacturing problems, like improper impregnation, improper separation of high voltage parts.
Created by XMLmind XSL-FO Converter.
Insulation diagnostics
In most cases 80 pF (almost standardized) coupling capacitors are used, measuring devices have high bandwidth to achieve good signal-to-noise ratio.
4. Measurement tasks to perform4.1. Insulating resistanceInsulating resistance measurement is carried out at the High Voltage Laboratory of the Electric Power Engineering Department. The specimen is an inductive, oil-paper insulated voltage transformer. The type of the measuring device is Metrel TeraOhm 5 kV.
As first step the green “Guard” output has to be connected to earth. Then the device can be connected to the 230 V power source. After switching on, wait until the self calibration finishes. Then the measurement cables can also be connected to the proper output.
As a voltage transformer is measured, the voltage should be chosen relatively low, to 250 V. The length of the measurement should be 60 seconds, the value recorded during the measurement should be the resistance value at 15 seconds.
The task is to determine the insulating resistance and the absorption coefficient between the high and low voltage winding of the transformer, between the high voltage winding and the core, and between the low voltage winding and the core. For measuring between the core and windings, the earthing has to be removed from the transformer.
4.2. Partial discharge measurementMeasurements are carried out in the designated room of the High Voltage Laboratory.
Figure 9
Figure 9 shows the measurement arrangement. The system consisting of the detection impedance and the measuring device has a bandwidth of 40 kHz – 200 kHz, consequently this is a conventional measuring device. During the laboratory practice, the following specimens will be measured:
1. high voltage current transformer,
2. plane-needle electrodes,
3. insulating plane between plane electrodes of different size.
Created by XMLmind XSL-FO Converter.
Insulation diagnostics
During the measurement simpler, directly measurable quantities will be used as mentioned in the syllabus.
1. On the above specimens, the inception and extinction voltage of the PD have to be determined (the voltage where the magnitude of PD overpasses a limit), and from that the hysteresis will be observed.
2. Measure the PD magnitude in function of test voltage.
3. The PD patterns on the oscilloscope will be analyzed and the distribution in function of the test voltage phase will be described.
5. Test questions1. The knowledge of all the laboratory safety regulations is the prerequisite of beginning the measurements.
2. Draw the reliability-time diagram of the equipments with and without diagnostics. Denominate the reason of failures on the different sections and describe the possible actions.
3. On what factors is the value of insulation resistance dependent?
4. What is the main difference between the volume resistivity and insulation resistivity?
5. Draw the general equivalent circuit of the insulating materials and denominate the role of each component.
6. What is absorption coefficient and what are the advantages of its application?
7. Enumerate the types of partial discharges.
8. Why is PD measurement a valuable measurement technique?
9. Draw the arrangement of the conventional PD measurement and shortly describe the role of its elements.
10. What types of non-electrical PD measurement techniques exist?
11. What are the goals of data processing techniques?
12. What poses a big problem to PD diagnosis of rotating machines?
13. What types of failures can be detected on rotating machines with PD measurement?
6. References1. Luspay Ödön. Közép- és Nagyfeszültségű Hálózati Berendezések Diagnosztikai Vizsgálata. s.l. : Magyar Áramszolgáltatók Egyesülete, 2000.
2. Dr. Horváth Tibor, László Tamás, dr. Máthé Balázs, dr. Németh Endre. Villamos szigetelések vizsgálata. Budapest : Műszaki Könyvkiadó, 1979.
3. dr. Németh Endre, Dr. Horváth Tibor. Nagyfeszültségű szigeteléstechnika. Budapest : Tankönyvkiadó, 1990.
4. Partial Discharge Diagnostics and Electrical Equipment Insulation Condition Assessment. Stone, Greg C. 5, October 2005, IEEE Transactions on Dielectrics and Electrical Insulation, Vol. 12.
5. Evolution of Slot Partial Discharges under Electrical, Thermal and Mechanical Stresses. M. Lévesque, C. Hudon, M. Bélec, E. David. Vancuver, Canada : s.n., 2008. IEEE International Symposium on Electrical Insulation.
6. Identification of Defects Generating PD in AC Rotating Machines by Means of Fuzzy-Tools. A. Contin, A.Tessarolo. Vancuver, Canada : s.n., 2008. IEEE International Symposium on Electrical Insulation.
7. Stator Insulation Problems Associated with Low Voltage and Medium Voltage PWM Drives. G.C. Stone, I. M. Culbert, B.A. Lloyd. 2007. IEEE Cement Industry Technical Conference.
Created by XMLmind XSL-FO Converter.
Insulation diagnostics
7. Test log7.1. Insulation resistance measurement
Time of measurement:
Place:
Name of students + NEPTUN CODE:
Between HV and LV winding Between HV winding and core Between LV winding and core
R 15
R 60
K A
7.2. Partial discharges measurementThe measurements are carried out with elevation of the voltage from inception voltage to 7 kV and the apparent charge and the voltage is recorded in four points lying between them. Afterwards the voltage is gradually decremented and values are recorded in four points until the extinction of the discharges. The magnitude for the inception and extinction voltage (qmin) has to be determined according to the noise level, values between 1…50 pC can be chosen, common values are between 5…10 pC.
7.2.1. PD measurement in current transformer
Apparent charges: qmin = …..
Inception voltage: Uinc = …..
Extinction voltage: Uext = …..
U [kV] Uinc 7kV Uext
q [pC]
Description of phase resolved PD diagram. Which type of PD occurred?
7.2.2. PD measurement in case of needle-plane electrodes
Apparent charges: qmin = …..
Inception voltage: Uinc = …..
Extinction voltage: Uext = …..
U [kV] Uinc 7kV U
Created by XMLmind XSL-FO Converter.

Insulation diagnostics
ext
q [pC]
Description of phase resolved PD diagram. Which type of PD occurred?
7.2.3. PD measurement in case of plane insulator between different sized plane electrodes
Apparent charges: qmin = …..
Inception voltage: Uinc = …..
Extinction voltage: Uext = …..
U [kV] Uinc 7kV Uext
q [pC]
Description of phase resolved PD diagram. Which type of PD occurred?
Created by XMLmind XSL-FO Converter.

2. fejezet - Investigation of electrical switching devices1. Knowledge base necessary for accomplishing the lab work:1. Overcurrent, overload current, fault current, short-circuit current;
2. Structure and operation of low and medium voltage circuit breakers;
3. Operation of vacuum circuit breakers;
4. Relays, releases, current transformers;
5. Protection characteristics;
6. Coordination of protecting devices;
7. Role of contactors, their operation.
2. Investigation of medium voltage vacuum circuit breakerNowadays, the users are not confined to only one pre-set overload characteristic curve with state-of-the-art protecting devices. The user can set the operation of these units within specified limits. This makes possible to adjust the protection to the needs of a protecting system, and to accomplish current and/or time discrimination with other protecting devices. Circuit breakers in medium voltage systems do not include built-in protection. However, flexibility is essential in power distribution, especially if such overload can occur in the system, which could not be predicted during the design process. In this case, it is enough to fine-tune the protection characteristics.
The SIPROTEC–4 type protection unit is a numerical protection relay that also performs control and monitoring functions and therefore supports the user in cost-effective power system management, and ensures reliable supply of electric power to the customers. The integrated control function permits control of disconnect devices (electrically operated/ motorized switches) or circuit-breakers via the integrated operator panel. The present status (or position) of the primary equipment can be displayed. 7SJ63 supports substations with single and duplicate busbars. The number of elements that can be controlled (usually 1 to 5) is only restricted by the number of inputs and outputs available. As an example, Fig. 1 shows the connection diagram of circuit breaker control function.
Created by XMLmind XSL-FO Converter.

Investigation of electrical switching devices
Fig. 1. Typical wiring for motor direct control; Q0 circuit breaker, Y circuit breaker coils, R relay, In digital input
2.1. Tasks to be accomplishedThe connection diagram for the measurement can be seen in Fig. 2.
Fig. 2. Connection diagram for the investigation of a medium voltage vacuum circuit breaker
2.2. The devices used for the measurement1. M1: SIEMENS 3AE1103-1 12 kV vacuum circuit breaker,
2. VR: SIEMENS SIPROTEC 7SJ63 programmable, multifunction protection relay,
3. CTr: SIEMENS 4MC6353-BX current transformer, 400:1,
Created by XMLmind XSL-FO Converter.

Investigation of electrical switching devices
4. T1: toroid transformer; 1 KVA, 220/0-240 V,
5. T2: 230/24 V separating transformer,
6. T3: 230/230 V separating transformer,
7. A1: ammeter; 5…100 A;
8. SK: EAW type 230V, synchronous clock,
9. K1: switch for disabling/enabling protective function.
2.3. Measurement and evaluationSteps of measurement:
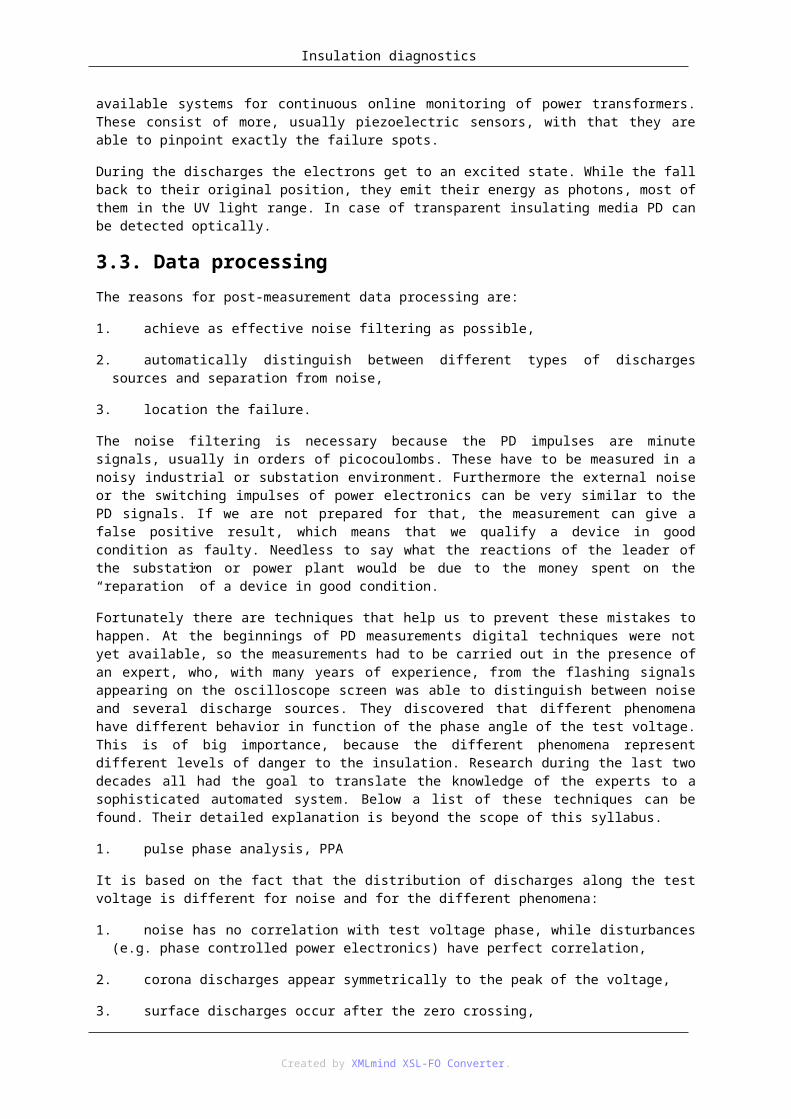
Protection can be disabled by turning switch K1 into STOP position. This has been accomplished by the programming of the protective relay (see R11, R12, and R13 in Fig. 3). The output R12 provides a close command to the CB. This can be controlled from through the user interface of the control panel. Output R11 opens the CB contacts, and output R13 is reserved for the protecting operation. If the protection is enabled, then R11 is blocked by the program in the control panel. By closing switch K1, the outputs R11 and R13 will be connected parallel, and any of the output contacts, including the output programmed for protection, can trigger the CB. By opening K1, output R13 will be detached, therefore the protection cannot give an open command to the circuit breaker.
After disabling the protection, and closing the vacuum circuit breaker, the current can be set by the toroid transformer. The value of the current can be read from the ammeter or from the display of the control panel. Note: A rated CB current of 200 A is programmed in the protection relay. After setting the current, the CB should be opened. This makes possible to enable the protection by turning switch K1 into START position. When the synchronous clock is reset to zero, the CB can be closed from the control panel. The current starts to flow in the circuit until the protection interrupts it. The synchronous clock indicates the time elapsed before the CB opened.
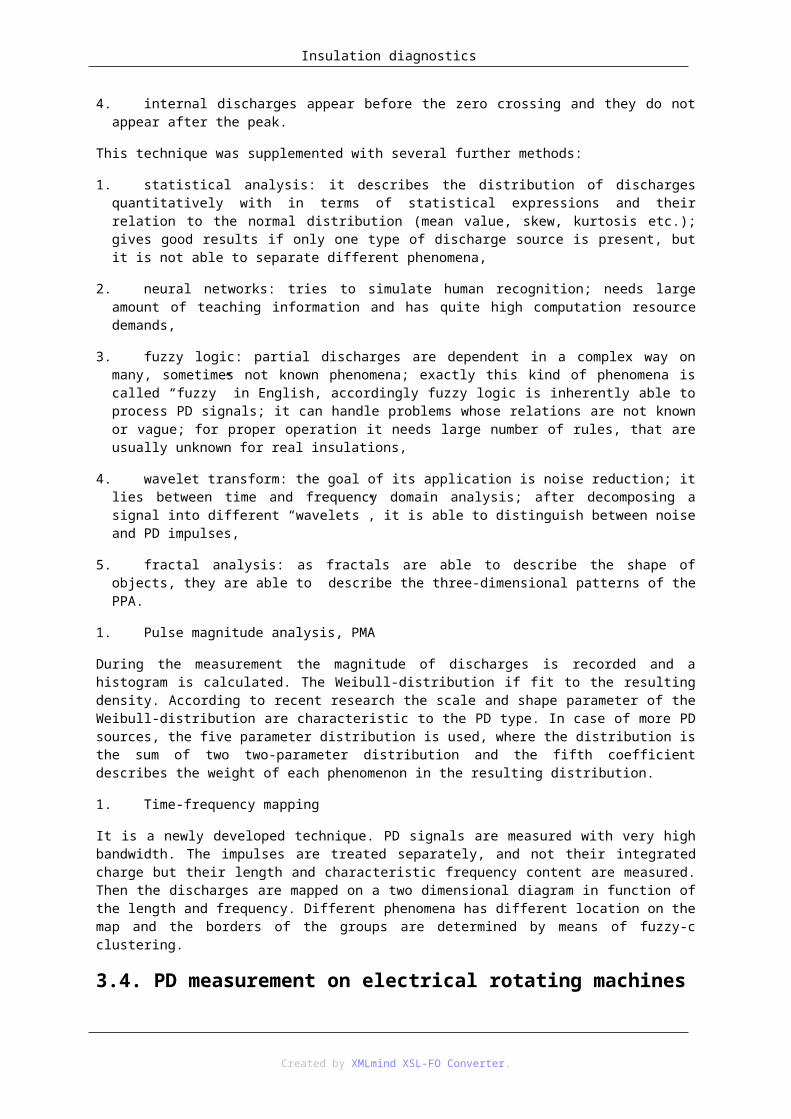
The programmed overload time-current characteristic curve is plotted in Fig. 4.
Created by XMLmind XSL-FO Converter.

Investigation of electrical switching devices
Fig. 3. Connection diagram of the protection relay (fragment)
Fig. 4. Programmed time-current characteristic curve
3. Investigation of MCB overload behavior
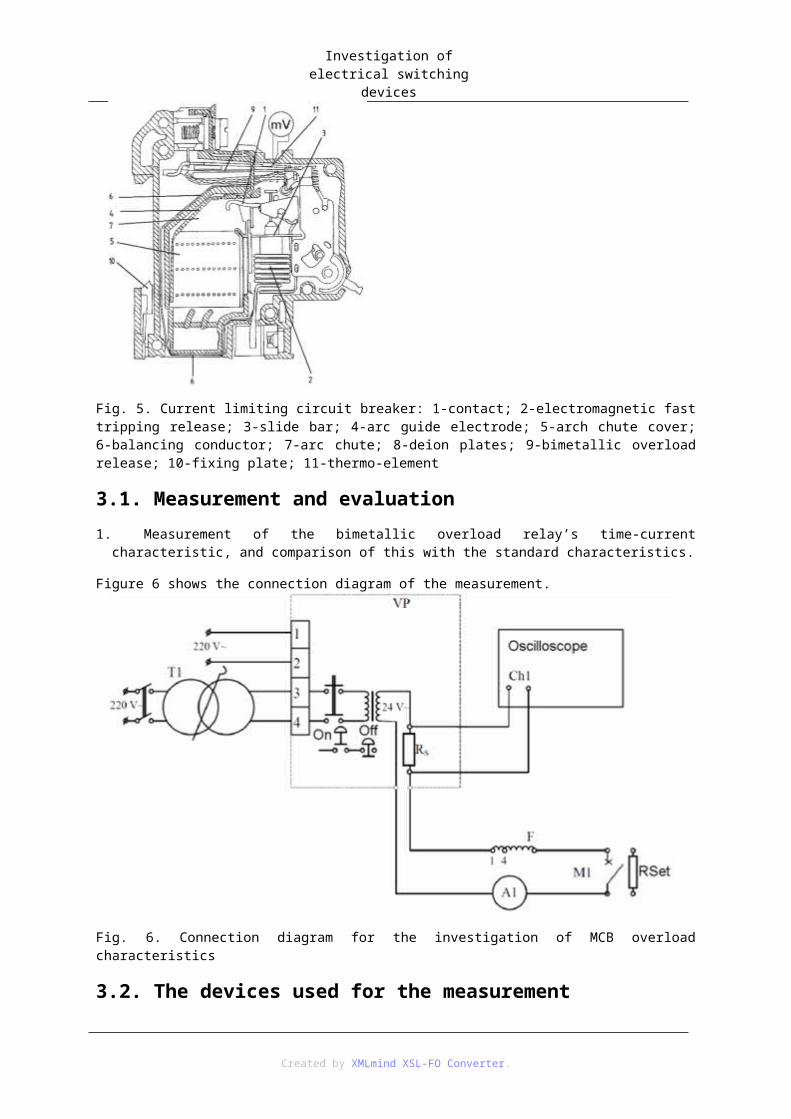
Fig. 5. Current limiting circuit breaker: 1-contact; 2-electromagnetic fast tripping release; 3-slide bar; 4-arc guide electrode; 5-arch chute cover; 6-balancing conductor; 7-arc chute; 8-deion plates; 9-bimetallic overload release; 10-fixing plate; 11-thermo-element
3.1. Measurement and evaluation1. Measurement of the bimetallic overload relay’s time-current characteristic, and comparison of this with the
standard characteristics.
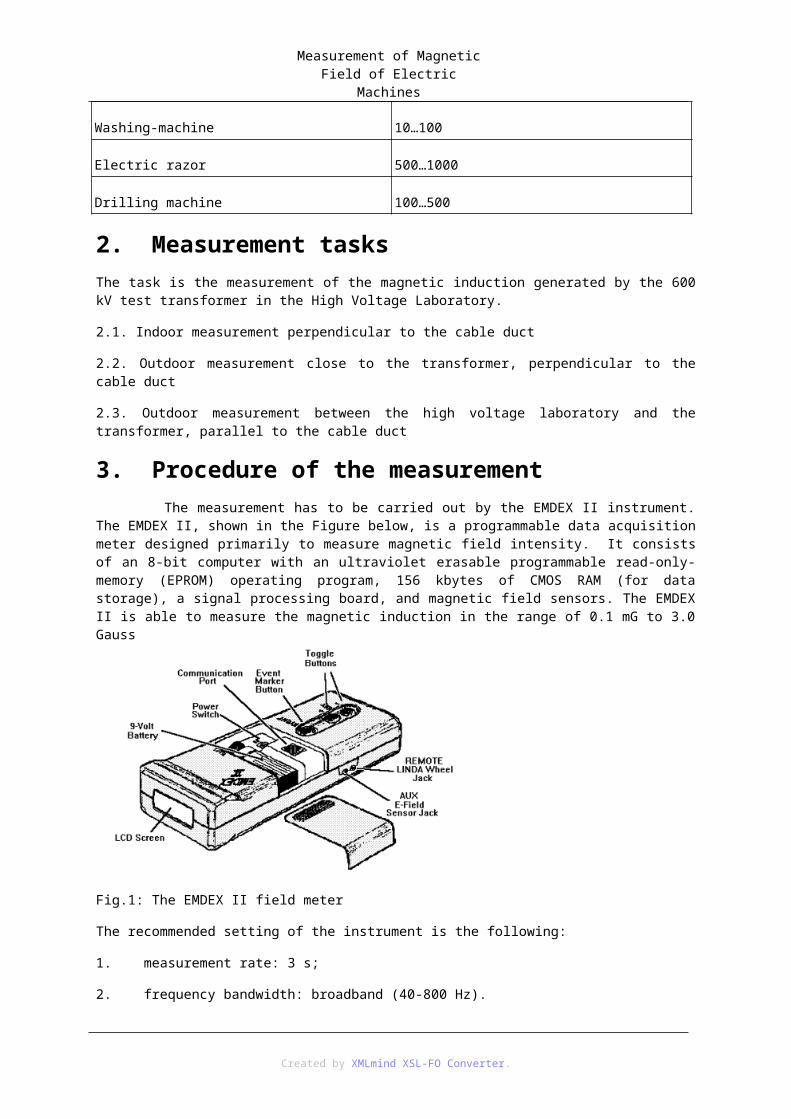
Figure 6 shows the connection diagram of the measurement.
Created by XMLmind XSL-FO Converter.

Investigation of electrical switching devices
Fig. 6. Connection diagram for the investigation of MCB overload characteristics
3.2. The devices used for the measurement1. VP: panel; 0,96 kVA, 380/24 V,
2. T1: toroid transformer; 1 KVA, 220/0-240 V,
3. F: coreless choke coil; 50 Hz, max 2.25 A,
4. A1: ammeter; 5…100 A,
5. M1: MCB,
6. Oscilloscope,
7. BE1: Setting resistance.
3.3. Steps of measurement and evaluationIt is important that the bimetallic strip must cool back to the ambient temperature before each measurement. This can be ensured by waiting 4-5 minutes between two measurements. The smallest disconnection current of the fast tripping release and the characteristics of the overload relay have to be measured according to the circuit in Fig. 6. By slowly raising the supply voltage with the toroid transformer (T 1), the smallest disconnecting current (Ir) of the fast tripping release can be found. During this test, the bimetallic strip can heat up, therefore it must be cooled back to ambient temperature before the next test. The characteristic curve of the overload release can be recorded with currents less than Ir. It is advised to start the measurement with higher currents, in order to wait less for the cooling. Smaller the current, less the tripping time and more the necessary time for cooling.
The test current can be set with the help of the setting resistance (RSet), during the cooling periods. The standard MCB characteristics can be seen in Fig. 7, whereas Fig. 8 shows the characteristic curve with given tolerance. The measured characteristic curve has to be compared graphically with these curves.
Created by XMLmind XSL-FO Converter.

Investigation of electrical switching devices
Fig. 7. Time-current characteristic curves of MCBs
Fig. 8. Standard characteristic curves of MCBs
3.4. References and further readings[1]
Koller L., Novák B, Electrical switching devices and insulators, TÁMOP, 2011.
[2]
Koller L., Kisfeszültségű kapcsolókészülékek, Műegyetemi kiadó, 2005.
[3]
Koller L., Kisfeszültségű kapcsolókészülékek szerkezete és üzeme, Műegyetemi kiadó, 2005.
[4]
Koller L., Nagyfeszültségű kapcsolókészülékek, Műegyetemi kiadó, 2005.
Created by XMLmind XSL-FO Converter.

3. fejezet - Measurement of Magnetic Field of Electric Machines1. Object of measurement Unwanted effects occur very often relating to the usage of electric energy. These unwanted effects are the consequences of different physical phenomena, mainly regarding to the fields in the neighborhood of transmission lines, substations, transformers and switchgears. The effect of the fields are twofold: in one hand they have influence on the biological processes, on the other hand they have influence on other electric and electronic equipment and systems. In order to avoid the unwanted effects, the tolerable limit values are specified by recommendations, directives or standards.
The biological limit values are specified in the EU (and in Hungary too) in mandatory directives according to the recommendations created by WHO (World Health Organization). These limits are specified by the 63/2004. (VII. 26.) ESzCsM directive in Hungary. The limitation of exposure of the general public to electric and magnetic fields at 50 Hz frequency are the following:
1. electric field: 5000 V/m
2. magnetic induction: 100 μT
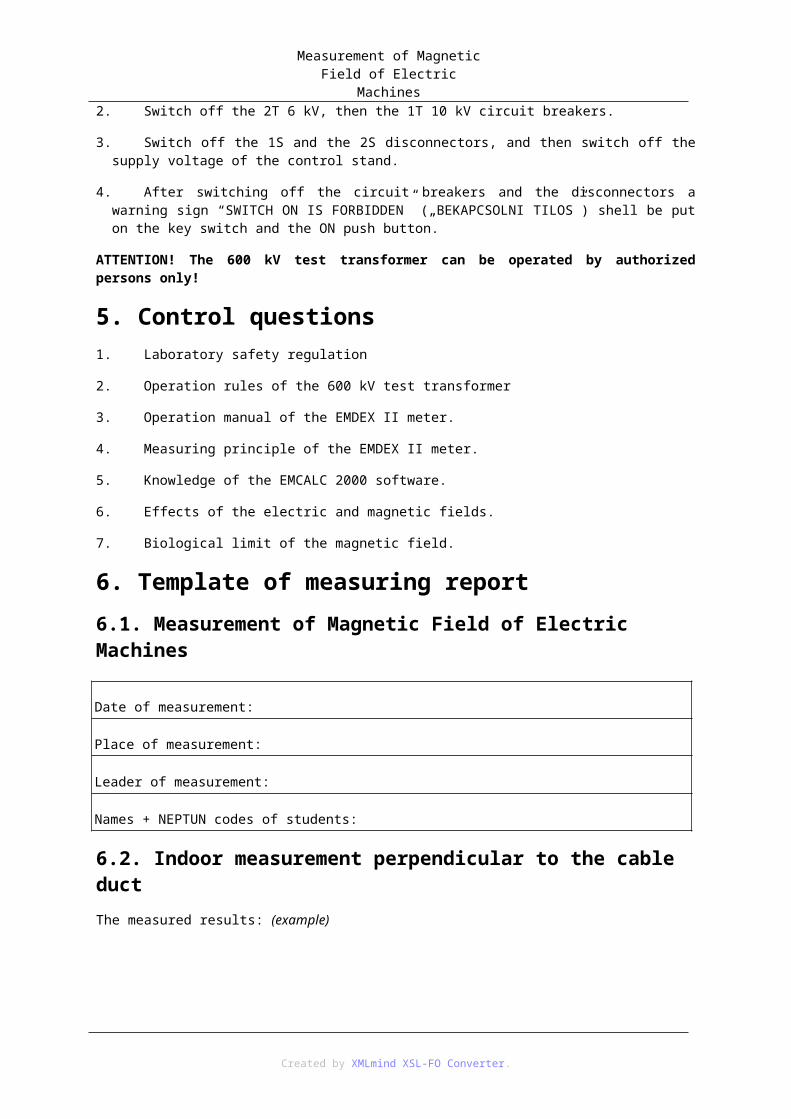
The typical values of the magnetic induction close to certain household appliances can be seen in the following table:
Appliance Magnetic induction
[μT]
Cooker 500…1000
Iron 10…100
Hair drier 1000…2500
Vacuum cleaner 10…1000
Table lamp 500…1000
Tv receiver 100…500
Washing-machine 10…100
Electric razor 500…1000
Drilling machine 100…500
2. Measurement tasksThe task is the measurement of the magnetic induction generated by the 600 kV test transformer in the High Voltage Laboratory.
2.1. Indoor measurement perpendicular to the cable duct
Created by XMLmind XSL-FO Converter.
Measurement of Magnetic Field of Electric Machines
2.2. Outdoor measurement close to the transformer, perpendicular to the cable duct
2.3. Outdoor measurement between the high voltage laboratory and the transformer, parallel to the cable duct
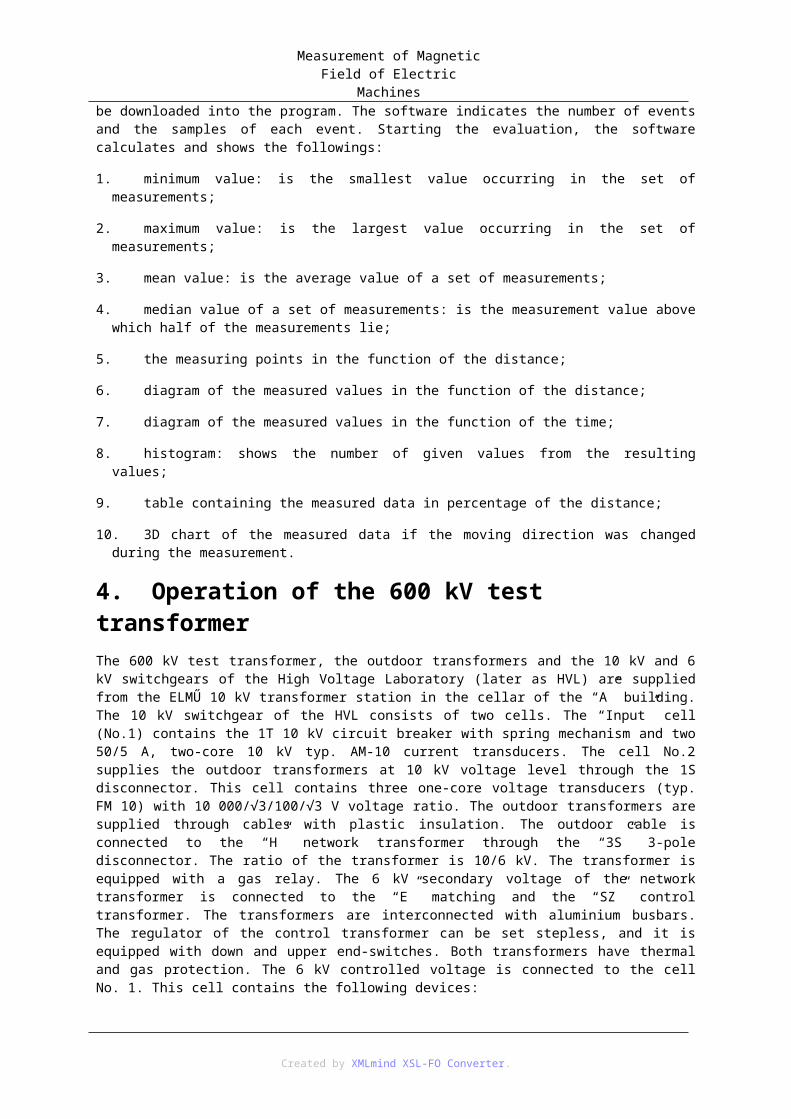
3. Procedure of the measurement The measurement has to be carried out by the EMDEX II instrument. The EMDEX II, shown in the Figure below, is a programmable data acquisition meter designed primarily to measure magnetic field intensity. It consists of an 8-bit computer with an ultraviolet erasable programmable read-only-memory (EPROM) operating program, 156 kbytes of CMOS RAM (for data storage), a signal processing board, and magnetic field sensors. The EMDEX II is able to measure the magnetic induction in the range of 0.1 mG to 3.0 Gauss
Fig.1: The EMDEX II field meter
The recommended setting of the instrument is the following:
1. measurement rate: 3 s;
2. frequency bandwidth: broadband (40-800 Hz).
The measurement has to be carried out in the HVL. An electric arc shall be created by the 600 kV test transformer. The length of the arc is about 0,5 m, and its time duration is about 1 minute in order to avoid the overheating of the transformer. The magnetic field generated by the cables in the cable duct should be measured during the presence of the arc. Care should be taken to the appropriate movement of the instrument in order to collect the most optimal number of measuring points. The distances between the measuring points should be uniform as far is possible. The available measuring time interval is about 1 minute. This allows to collect about 20 measured data. The cable duct is considered as reference, and the measurement has to be carried out in a zone perpendicular to the cable duct which has the width of 6 m (from -3 m to +3 m). If the sampling rate is 3 s, this corresponds about one measuring point in each 30 cm. The measurement is repeated parallel to the cable duct in a length of 6 m. Between two measurements under load condition (existing arc) the measurement should be repeated under no load condition in order to compare the results. One measurement should be done parallel and two measurements should be done perpendicular to the cable duct at two different locations.
The Linear Data Acquisition (LINDA) Measurement Wheel should be used with the EMDEX II. The LINDA enables the EMDEX II to make magnetic field and location measurements simultaneously. In order for the EMDEX II to be used with the LINDA wheel, the meter must be loaded with the LINDA Operating Program. The data is transferred from the EMDEX II into a LINDA dataset, which can be analyzed and plotted using EMCALC 2000.
Created by XMLmind XSL-FO Converter.
Measurement of Magnetic Field of Electric Machines
Fig.2: The Linear Data Acquisition (LINDA) Measurement Wheel
The EMDEX II is able to fix and store different measuring results in order to avoid the download of the data after each measurement. The results of the next measurement should be stored as a new “EVENT”. The stored data can be analyzed after the measurements with the EMCALC 2000 software. Having a length component, the EMCALC 2000 is able to plot the results versus the distance.
After starting the EMCALC 2000 software, the EMDEX II meter should be connected to the PC via an USB cable and the stored measuring results can be downloaded into the program. The software indicates the number of events and the samples of each event. Starting the evaluation, the software calculates and shows the followings:
1. minimum value: is the smallest value occurring in the set of measurements;
2. maximum value: is the largest value occurring in the set of measurements;
3. mean value: is the average value of a set of measurements;
4. median value of a set of measurements: is the measurement value above which half of the measurements lie;
5. the measuring points in the function of the distance;
6. diagram of the measured values in the function of the distance;
7. diagram of the measured values in the function of the time;
8. histogram: shows the number of given values from the resulting values;
9. table containing the measured data in percentage of the distance;
10. 3D chart of the measured data if the moving direction was changed during the measurement.
4. Operation of the 600 kV test transformerThe 600 kV test transformer, the outdoor transformers and the 10 kV and 6 kV switchgears of the High Voltage Laboratory (later as HVL) are supplied from the ELMŰ 10 kV transformer station in the cellar of the “A” building. The 10 kV switchgear of the HVL consists of two cells. The “Input” cell (No.1) contains the 1T 10 kV circuit breaker with spring mechanism and two 50/5 A, two-core 10 kV typ. AM-10 current transducers. The cell No.2 supplies the outdoor transformers at 10 kV voltage level through the 1S disconnector. This cell contains three one-core voltage transducers (typ. FM 10) with 10 000/√3/100/√3 V voltage ratio. The outdoor transformers are supplied through cables with plastic insulation. The outdoor cable is connected to the “H” network transformer through the “3S” 3-pole disconnector. The ratio of the transformer is 10/6 kV. The transformer is equipped with a gas relay. The 6 kV secondary voltage of the network transformer is connected to
Created by XMLmind XSL-FO Converter.

Measurement of Magnetic Field of Electric Machines
the “E” matching and the “SZ” control transformer. The transformers are interconnected with aluminium busbars. The regulator of the control transformer can be set stepless, and it is equipped with down and upper end-switches. Both transformers have thermal and gas protection. The 6 kV controlled voltage is connected to the cell No. 1. This cell contains the following devices:
1. 6 kV vacuum circuit breaker (“2T”);
2. current transducer with 40/5 A ratio in one phase;
3. voltage transducer with 6000/100 V ratio between two phases;
4. disconnector (“2S”) for disconnection of the cable to the “P” transformer;
5. earthing disconnector (‘1FS”) for earthing of the cable to the “P” transformer, interlocked with the 2S disconnector.
The switchgear can be operated from the reconstructed control stand. The disconnectors can be operated by acknowledging switches (typ. BM2), the circuit breakers can be operated by operating-acknowledging switches (typ. SM2). The “SZ” control transformer can be set from this control stand too. The control stand contains the necessary electromechanical, electronic and digital protections and their fault display unit. The switchgear is equipped with the following protections:
1. two-step digital overcurrent protection at 10 kV produced by Protecta (typ. DTI2 EP);
2. electronic impedance protection produced by VEIKI-ERŐKAR (typ. D-Z);
3. electronic undervoltage relay produced by Protecta (typ. Eu);
4. time relays produced by BBC;
5. auxiliary relays (types: RUS, Finder, Schrack) for tripping, on/off operations, interlocks and indication;
6. MCB-s produced by BBC.
The wiring is made of MKH 1 kV Cu cables routing in plastic cable ducts and their ends are equipped with ferrules. The outdoor H, E and SZ transformers were reconstructed by Ganz Transelektro Rt.
4.1. Conditions and procedure of the switch on of the equipment1. Before the switch on: visual inspection of the condition of the outdoor transformers and the test transformer
(technical condition, condition of the insulators, busbars, oil leakage, connections etc.);
2. Visual inspection of the condition of the secondary supply system and the fault indicators and check the presence of the supply voltages;
3. Check the presence of the voltage at the head of the input 10 kV cable by a voltage indicator;
4. Check the ON position of the 1S, 3S, 2S, 4S or 5S (300 kV or 600 kV connection of the P transformer) disconnectors;
5. ATTENTION: The 4S and the 5S disconnectors are not interlocked! ON position of both disconnectors simultaneously is FORBIDDEN!
6. Check the position of the inhibit switch on the door of the 10 kV switchgear cell No.1 (the operation of the switchgears can be inhibited from here during service, maintenance, inspection etc.);
7. The control stand can be switched on by turning the key switch and pushing the ON switch. This will be indicated by the control lamp;
8. Check the down-end position of the control transformer, otherwise the switch on of the circuit breakers are not allowed.
9. Check the indications of the Retesz 1, Retesz 2, Retesz 3 interlock lamps; all three lamps should be on,
Created by XMLmind XSL-FO Converter.

Measurement of Magnetic Field of Electric Machines
otherwise the switching on of the circuit breakers are not allowed. The meaning of the indications:
10. One red and one green signal lamps are situated above the door at the right side of the control stand. When the switchgear is switched off, the green lamp is on, the door can be used. When the 10 kV circuit breaker is switched on, the red lamp is on, the door must not be used. If any door is opened in this situation, the 10 kV circuit breaker will be switched off automatically, and a fault indication will occur.
11. If the above conditions are fulfilled, the H, E and SZ transformers can be switched on by the operation of the 1T 10 kV circuit breaker. The presence of the 10 kV can be checked by the voltmeter on the control stand.
12. If any abnormal event cannot be experienced, the P test transformer can be switched on by the operation of the 2T 6 kV circuit breaker. After switching on of the circuit breaker, the presence of the 6 kV voltage, the 6 kV operating current and the operating current of the P test transformer can be checked respectively by the 6 kV line-to line voltmeter, the ammeter supplied from the 40/5 A current transducer and the ammeter measuring the current of the 5/5 A current transducer of the P test transformer.
13. Now the output voltage of the P test transformer can be increased by the operation of the UP switch of the SZ transformer. The upper end position of the control transformer is indicated by a lamp on the control stand. During the operation of the control transformer an indicator lamp named ’Szabályzó jár’ (i.e. ‘controller operates’) is on.
14. In a case of any abnormality, fault or accident danger both circuit breakers of the two voltage levels (6 and 10 kV) must be switched off by the emergency off switch (big red push button located on the control stand).
4.2. Procedure of the switch off1. After completing the measurements the equipment shell be switched off after setting the SZ transformer to
the down-end position.
2. Switch off the 2T 6 kV, then the 1T 10 kV circuit breakers.
3. Switch off the 1S and the 2S disconnectors, and then switch off the supply voltage of the control stand.
4. After switching off the circuit breakers and the disconnectors a warning sign “SWITCH ON IS FORBIDDEN” („BEKAPCSOLNI TILOS”) shell be put on the key switch and the ON push button.
ATTENTION! The 600 kV test transformer can be operated by authorized persons only!
5. Control questions1. Laboratory safety regulation
2. Operation rules of the 600 kV test transformer
3. Operation manual of the EMDEX II meter.
4. Measuring principle of the EMDEX II meter.
5. Knowledge of the EMCALC 2000 software.
6. Effects of the electric and magnetic fields.
7. Biological limit of the magnetic field.
6. Template of measuring report6.1. Measurement of Magnetic Field of Electric Machines
Created by XMLmind XSL-FO Converter.

Measurement of Magnetic Field of Electric Machines
Date of measurement:
Place of measurement:
Leader of measurement:
Names + NEPTUN codes of students:
6.2. Indoor measurement perpendicular to the cable ductThe measured results: (example)
Diagram of the magnetic induction in the function of the distance created by the EMCALC 2000 software: (example)
Evaluation:
6.3. Outdoor measurement close to the transformer, perpendicular to the cable ductThe measured results: (example)
Diagram of the magnetic induction in the function of the distance created by the EMCALC 2000 software: (example)
Created by XMLmind XSL-FO Converter.
Measurement of Magnetic Field of Electric Machines
Evaluation:
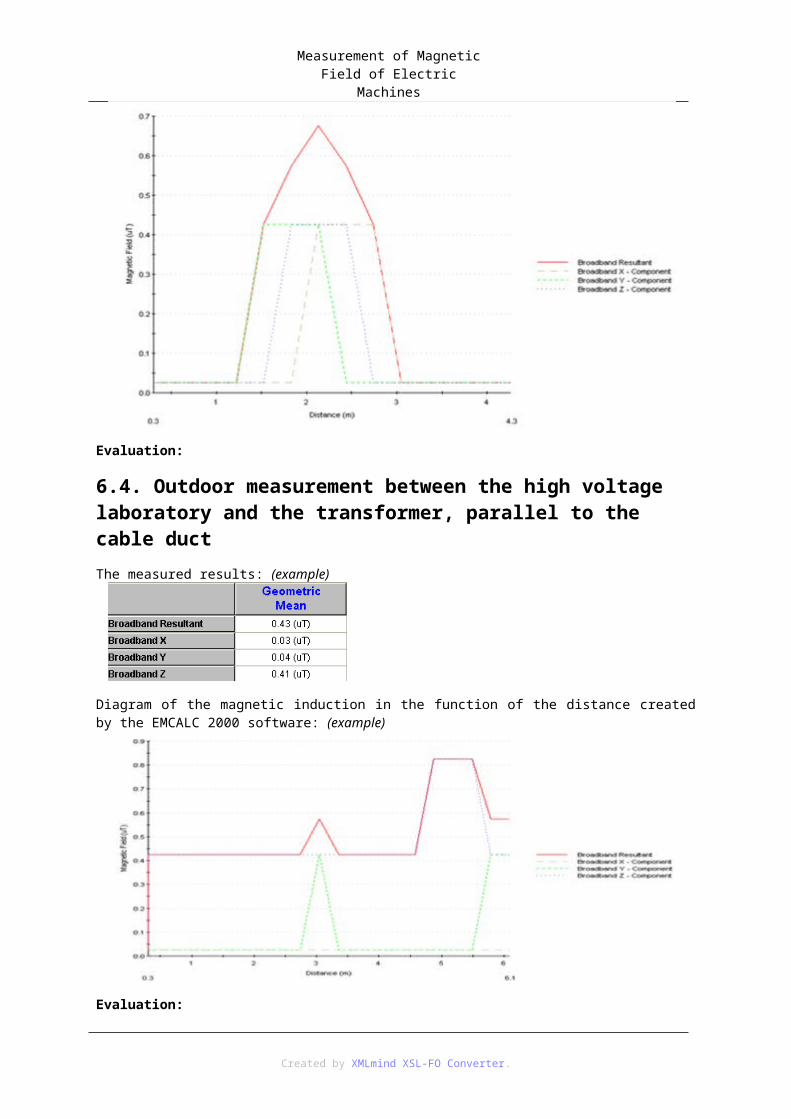
6.4. Outdoor measurement between the high voltage laboratory and the transformer, parallel to the cable ductThe measured results: (example)
Diagram of the magnetic induction in the function of the distance created by the EMCALC 2000 software: (example)
Evaluation:
Created by XMLmind XSL-FO Converter.

4. fejezet - Investigation of windings of electric machinesThis guide has been made for the MSc students of specialization “Electric machines and drives”. Knowledge connecting to the measurement of insulation resistance and partial discharges is now completed by overvoltage impulse tests. This topic is presented connecting to the examination of the insulation of transformers.
1. Distribution of the overvoltage inside the winding of transformersTo dimension the insulation between the turns and layers as well as the insulation between the winding and earth, it is necessary to know their electric stress. This stress in case of normal operation and AC test voltage is much lower than it is in case of an overvoltage, thus the letter one must be taken into consideration during dimensioning.
It is known, that the intensity of electric stress in a certain winding due to a given overvoltage is determined by the wave-impedance, the value of the inductance, resistance, from the point of the transient processes the winding can be substituted by simplified circuit diagram shown in Fig. 1. In this circuit diagram L and R represent the inductance and the resistance per a unity length, while C x and C f are the serial capacitance and the capacitance related to the ground.
Fig. 1.: Equivalent circuit of the winding
1.1. Initial voltage distribution inside the windingWhen an overvoltage of a high initial steepness enters into the coil, the initial u C (x) voltage distribution will be practically determined by the capacitances. Its reason is that in case of a high du/dt steepness X C <<R<<X L. As a primary estimation resistance and inductive reactance can be considered to be infinity; in this case the voltage distribution at t=0 can be expressed by the following differentiating equation:
(1)
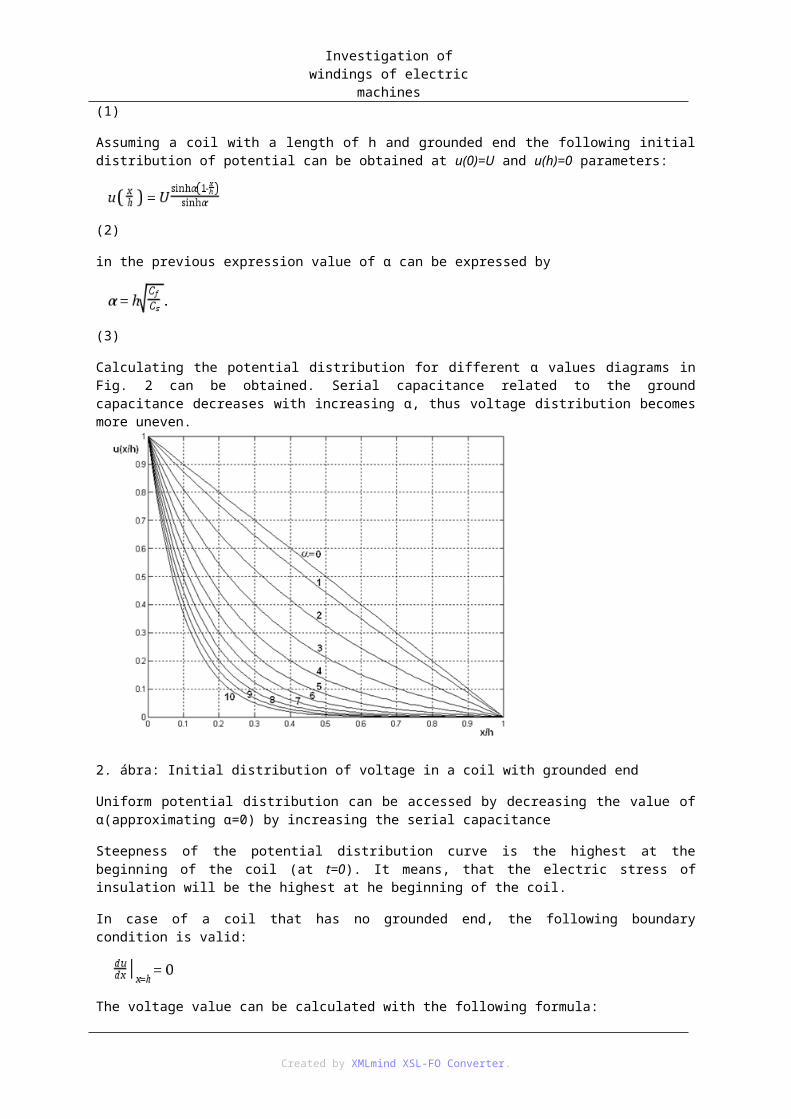
Assuming a coil with a length of h and grounded end the following initial distribution of potential can be obtained at u(0)=U and u(h)=0 parameters:
(2)
in the previous expression value of α can be expressed by
(3)
Created by XMLmind XSL-FO Converter.
Investigation of windings of electric machines
Calculating the potential distribution for different α values diagrams in Fig. 2 can be obtained. Serial capacitance related to the ground capacitance decreases with increasing α, thus voltage distribution becomes more uneven.
2. ábra: Initial distribution of voltage in a coil with grounded end
Uniform potential distribution can be accessed by decreasing the value of α(approximating α=0) by increasing the serial capacitance
Steepness of the potential distribution curve is the highest at the beginning of the coil (at t=0). It means, that the electric stress of insulation will be the highest at he beginning of the coil.
In case of a coil that has no grounded end, the following boundary condition is valid:
The voltage value can be calculated with the following formula:
(4)
The voltage of a given point reaches it steady state value after oscillations. The first – highest – overshoot can be not more than the difference between the steady state and the initial value. In practice the real oversoot is significantly less than the previous one because of the resistance of the coil and the damping effect of the iron core.
Created by XMLmind XSL-FO Converter.

Investigation of windings of electric machines
Fig. 3.: Initial voltage distribution along a coil with grounded end
Frequencies of oscillations are determined by the inductance and capacity of the coil. Usually more oscillations with different frequencies are superimposed. Time of oscillation depends on the damping. The total oscillation process can be longer than the standard incoming wave (1,2/50).
Initial voltage distribution curves for different α values in a coil with open end can be seen in Fig. 3. Comparing Fig. 2 and Fig. 3 it is interesting, that in case of α≥4, the initial voltage distribution is independent of the grounding of the end. Taking into consideration, that in case of power transformers usually α>5 is valid, voltage distribution in transformers with coils of star connection is independent from the grounding or not grounding of the star point.
1.2. Effect of steepness on the initial voltage distributionBecause of assumption R=∞ and L=∞ the diagrams of voltage distribution represented before are valid for impulses with steep front, practically for unit step. Decreasing the steepness of the front, resistance and inductance of the coil cannot be considered to be infinite related to the capacitances. In this case these elements are also influencing the potential distribution making it more uniform.
2. Voltage distribution after a certain timeLet us select a point of the coil (for example point B in the middle) and examine the time function of the voltage (Fig. 4). Initial (capacitive) voltage U c appearing at the moment of the intrusion of voltage impulse is always less than the value at uniform potential distribution, in our case U C <U/2.
After a certain time (when the voltage impulse is at its descending part) the voltage distribution is determined by the resistance and inductance of the coil. Therefore the voltage is equal to the value at uniform distribution in case of unit step and nearly equal to the value at uniform distribution in case of decreasing voltage.
As it is known, a coil with given L and C s parameters has several self-frequencies, thus it is possible, that some of them are the same as the base frequency or its higher harmonics. Unit step contains the total spectrum of frequency, so all of the harmonic oscillations can be developed. As the steepness of the overvoltage impulse decreases, higher frequencies will be missing from the spectrum, number of higher harmonics developed is reducing, thus the oscillations become more and more “smooth”, base frequency becomes more and more dominant. At a signal with very low steepness, no oscillation is developing, so the voltage distribution along the coil will be nearly uniform.
Created by XMLmind XSL-FO Converter.

Investigation of windings of electric machines
Fig. 4.: Change of voltage as a function of time at a given point of a coil
Usually the highest stress for the insulation is the first overshoot U max. It is independent from the fact, that this overshoot appears at different moments at different parts of the coil. Theoretical enveloping curve of maximal voltages (Fig. 5) can be easily constructed knowing the diagram of the initial voltage distribution in the following way. Calculate the difference between the uniform and initial voltage values and add it to the values of uniform distribution from point to point. The real voltage peaks are lower than the theoretical ones at the beginning of the coil because of the damping effects mentioned before. However at the end they can exceed the theoretical peaks because of the addition of reflected waves.
Created by XMLmind XSL-FO Converter.
Investigation of windings of electric machines
Fig. 5.: Enveloping curve of maximal voltages
2.1. Effect of the steepness of the damping part of the wave on voltage Umax
Oscillations appearing inside the coil have much lower frequency than the frequency connected to the steepness of the front of incoming overvoltage impulse. As a result, at the moment, when the voltage reaches U max, the overvoltage impulse is beyond its maximum and it is decreasing. Voltages at certain points of the winding are oscillating around the value calculated for the uniform distribution. Thus it is obvious, that U max is higher in case of a wave with long damping part (meaning higher halfvalue-time) than in case of rapidly damping impulse. So the steepness of the back of the overvoltage wave (halfvalue-time) influences the maximal stress as well, see Fig. 6.
Created by XMLmind XSL-FO Converter.

Investigation of windings of electric machines
Fig. 6.: Relationship between halfvalue-time and Umax
3. Examination with chopped voltage waveChopped voltage wave is generated e.g. when a protective spark gap at the input connection of a transformer starts to operate with a relatively low time delay (4-10 microseconds). In this case the front part and the peak of the overvoltage wave reach the winding of the transformer, but after the operation of the spark gape the voltage drops suddenly to zero. Standardized overvoltage impulse with chopped wave can be seen in Fig. 7.
Created by XMLmind XSL-FO Converter.
Investigation of windings of electric machines
7. ábra: Standard full and chopped wave
Steepness of the wave at the moment of chopping is significantly higher than the steepness at the front.
Created by XMLmind XSL-FO Converter.

Investigation of windings of electric machines
(Standard lightning impulse has a front time of 1,2 μs and a halfvalue-time of 50 μs.) For outer insulators like supporting and bushing insulators, chopped overvoltage wave is a lower stress related to the total one, because the time during the insulator is under the effect of the overfolage is shorter, thus the probability of flashover or breakdown is lower.
For inner insulations the chopped overvoltage impulse can be a higher stress because of two reasons. On one hand, because of the very high steepness of the chopping a very non-iniform voltage distribution can be generated with oscillations of high magnitude. On the other hand, these oscillations are superimposed to the ones generated by the front of the overvoltage, thus it is possible, that two waves with the same phase are added (intensification). Thus, the magnitude of the resultant wave can be higher than the maximal value of the oscillations generated by the front or the chopping separately. Decreasing parameter α, stresses caused by the copped wave are also decreasing.
4. Experimental study of voltage distribution, deteminaton of oscillation diagramTime function of voltage at certain points of the winding is similar to the one represented in Fig. 8. From such a diagram initial capacitive voltage U c and highest voltage peak U max can be determined directly. Their change along the winding can be constructed as well.
Fig. 8. ábra: Time function of voltage at a given connection point
Oscillation diagram representing the voltage at different time and positions can be constructed by the following way. Voltage values at moments t 1, t 2, t 3, ... are determined from oscillograms recorded as a function of time at different points. (See Fig. 8.) Doing this for several point if the winding it is possible to draw how the voltage is changing along the coil at given time moments (t 1, t 2, t 3, ...), see Fig. 9. Drawing such diagrams (usually five to ten ones) in one figure, the oscillation diagram can be obtained. (Fig. 10.)
Created by XMLmind XSL-FO Converter.
Investigation of windings of electric machines
9. ábra: Voltage distribution along the wingding at t=t1
From the oscillation diagram it is possible to determine the voltage distribution along the coil at different time moments.
Created by XMLmind XSL-FO Converter.

Investigation of windings of electric machines
10. ábra: Oscillation diagram of a coil
4.1. Examination of stresses in a transformer of delta connectionIt is typical, that an overvoltage impulse reaches the transformer travelling along two or three phase conductors. In transformers, where the coils are connected in delta, the overvoltage wave reach the end of the coils at the same time, thus the stress is significantly different related to the star connection.
11. ábra: Voltage distribution of a coil in a delta connection
4.2. Overvoltage transported between coils situated at the same columnPrevious examinations are valid for overvoltages in one coil. However in a transformer there are at least two
Created by XMLmind XSL-FO Converter.

Investigation of windings of electric machines
coils on one column with close inductive and capacitive coupling between them, thus these coils are influencing each other. Accurate determination of this mutual influence is possible with matrix calculation. The result of such a calculation can be summarized as follows.
Presence of unstressed coil has low influence on the voltage distrtibution in the stressed coil. It is especially true, if the stressed coil is the higher voltage one. Oscillations are generated in the unstressed coil due to the couplings. Initial voltage is determined mainly by the self and mutual capacitances of the coils, then the voltage starts to oscillate around the values determined by the self and mutual inductances (practically around the values of the linear distribution multiplied by the transformation ratio).
Highest voltage in unstressed coil is strongly influenced by the ratio of parameters α 1 and α2, the transformation ratio, and the direction of winding (same or opposite).
Especially high voltage peaks can be generated, if the end of unstressed coil N is not grounded. Depending on the previously described factors the peak overvoltage at the ungrounded end can be 10-30 times higher than it is in stressed coil K . This voltage is really dangerous for the insulation of the unstressed coil. Therefore there is a regulation, that during the test procedure the endpoints of unstressed coils must be connected to the ground with loading impedances that are equal to the load during normal operation (practically the wave impedance of the lines connected to the transformer).
As an example for the impulse test of the high voltage side of a star-delta transformer circuit diagram in Fig. 12 is represented indicating the points where waves are registered. (In the figure R1 and R2 denote the wave impedances connected to coils N and K, FO denotes the voltage divider, while KO is the oscilloscope registrating the overvoltage signal.
Fig. 12.: Circuit diagram of overvoltage test
4.3. High voltage testsPower transformers are tested by HV impulses with parameters described in standards (according to the coordinating insulation level).
Created by XMLmind XSL-FO Converter.

Investigation of windings of electric machines
Time function of voltage at different points of the coils (starting points, endpoints of coils, star point, etc.; to which the oscilloscope can be connected without destructing the transformer) have to be measured while a test impulse is connected five times to the transformer. The test was successful if the oscillograms are the same and identical to the oscillogram obtained from type tests.
When the insulation inside the transformer is damaged due to an overvoltage (most typical damage is a breakdown at the beginning of a coil between turns or plates) a significant change in the inductance of the coil occurs. This results in a modified oscillation diagram. Knowing the oscillograms of damaged and undamaged coils it is possible to estimate the type and the place of the damage. Usually oscillation of the star point is examined for this purpose. (Fig. 13.)
13. ábra: Csillagponti lengések képe ép és menetzárlatos tekercselésnél
5. Task of measurementVoltage distribution in the coil of a transformer is measured at connection points prepared at the high voltage coil of a three phase transformer Tr. The equivalent circuit of the measurement can be seen in Fig. 14. Impulse generator “KL” generates 50 adjustable voltage impulses per a second, thus the oscilloscope denoted by “KO” can be used in automatic mode instead of single shot mode.
Created by XMLmind XSL-FO Converter.

Investigation of windings of electric machines
Fig. 14.: Examination of a transformer from the high voltage side
5.1. Description of the measurementSet the output voltage of the impulse generator to a value given by the lecturer while the generator is connected to the coil. Connecting a known impulse to the input of coil N, initial voltage U c and maximal voltage U max
related to the ground at different connection points have to be measured as it is represented in Fig. 14a. Then the peak value of voltage difference between two neighbouring connection points (ΔU max ) will be measured, see Fig. 14b. Based on this measurement potential difference between turns can be estimated.
Stresses because of a voltage impulse from the low voltage side can be examined by test circuit in Fig. 15a. The peak of the input voltage can be some Volts; therefore output voltage of the test impulse is reduced by a resistive voltage divider. In this case values of U max and ΔU max are measured as it can be in Fig. 15a and b.
Fig. 15.: Examination of the transformer from low voltage side
Created by XMLmind XSL-FO Converter.

5. fejezet - Investigation of Salient pole Synchronous Machine1. The object of measurementOperation of salient pole synchronous machine, conditions of connecting to the network. Generator and motor mode of operation, control of active and reactive energy flow. Experimental measuring of no-load and short-circuit characteristic curves, current-vectordiagram and "V"-curves.
2. Theoretical basics2.1. Scope of synchronous machineTraditional synchronous motors are usually applied in huge power (P>100 kW) constant rpm drives, e.g. pumps, piston compressors, mills. Semiconductor fed synchronous motor drives realize speed control and start-up with constant torque. Main application field of permanent magnet synchronous machines is the servo- , robot and machine tool drives.
Synchronous generators are mainly used for energy production in power plants.
The stator of synchronous machines is made usually with 3-phase windings; the rotor is cylindrical (with constant air gap) or designed with salient pole (with variable air gap).
2.2. Operation of synchronous machineThe pole system produced by the excitation coils of the rotor (or by permanent magnet attached to the rotor) joins with the magnetic field pole system of the stator. The synchronous machine fed from power line can run only at the rpm identical to the rpm of the stator winding's field (synchronous speed). Consequently the synchronous machine is unable to start up by itself. In power stations turbines are revving the synchronous generators up to the synchronous speed. A motor can start up if the frequency of the supply inverter is increasing from zero to nominal. A synchronous motor equipped with starting cage is able to start up as an induction machine. During the asynchronous mode the excitation windings are short-circuited. Regardless of starting method prior to the connecting to the mains the synchronous machine has to be synchronized.
2.3. Requirements for connecting to the mainsFirst the driving machine revs the generator up to the synchronous speed and then the generator voltage must be adjusted to the mains voltage. Connection can be performed with sinusoidal curves of both mains’ and generator voltages are identical, i.e.
- phase sequence,
- frequency,
- rms value,
- phase position
are exactly the same.
Checking out the requirements for connecting to the mains is performed with the synchronizing unit SzB.
3. Statement of the task3.1. Main equipment of the investigated arrangement
Created by XMLmind XSL-FO Converter.

Investigation of Salient pole Synchronous Machine
1. Sz EVIG SGH 75 G4, type salient pole synchronous machine, 12 kVA, 400/231 V, 17.6 A, 1500/min, star connected stator. Excitation: 38 V, 15 A.
2. G EVIG EDP 24 04 type dc machine with separate excitation, 0.6 kW, 40 V, 15 A, separate excitation: 220 V, 0.25 A.
3. E EVIG EDH 56 L4, type dc machine with compound excitation, 10 kW, 220 V, 45 A, 1450/min, separate excitation: 220 V, 0.95 A.
4. S ORISTROB DD-201 type stroboscope
5. SzB synchronizing unit
6. A1 ampermeter, 3 mA ... 15 A.
7. A2 ampermeter, 60 mA ... 6 A.
8. A3 60 mV/5 mA instrument with shunt resistors for 10, 20, 50 A.
9. A4 ampermeter, 2.5-5 A.
10. Wl, W2 wattmeter, 2.5-5 A, 75-150-300-450-600 V.
11. ÁV current transformer, 12.5-25-50 A/5 A.
12. V1 voltmeter, 150-300-450-600 V.
13. V2 voltmeter, 120-240-600 V.
14. RSz sliding resistance, 8 , 25 V, 7.6 A (in the excitation circuit of Sz).
3.2. The process of measurementBoth motor and generator operations of synchronous machine have to be investigated using the arrangement by Fig 1. Controlled converter SzÁ is appropriate for 4/4 operation.
Created by XMLmind XSL-FO Converter.
Investigation of Salient pole Synchronous Machine
Fig 1. Scheme of arrengement
The schematic circuit diagram is shown in Fig 2. Although the investigated machine is a salient pole synchronous machine, in the range of rated operation (especially at over excitation) can be considered as a cylindrical-rotor one, This consideration simplifies the task for resolve.
The arrangement of machines starts by dc machine E (see Fig 2).
Created by XMLmind XSL-FO Converter.
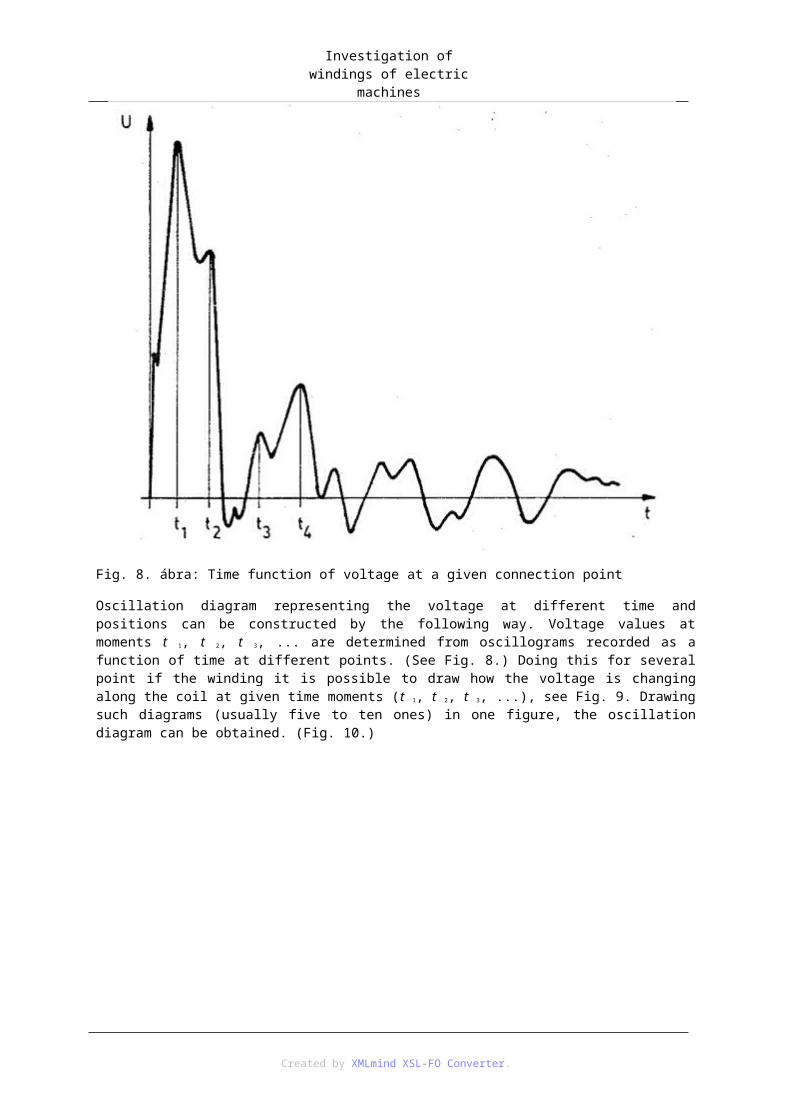
Investigation of Salient pole Synchronous Machine
Fig 2. Schematic circuit diagram
The speed of machine arrangement can be set by changing the terminal voltage of dc machine E. The required (synchronous) speed can be determined with the stroboscope. In the 10% range around the synchronous speed the speed can be determined using the vibrating reed frequency meter of the synchronizing unit when SzB switched on and the synchronous machine is excited. Exciting current of synchronous machine have to be set by the power supply GSz of exciting machine G.
Fig 3. Synchronizing unit SzB
In Fig 3 Ki= off, Be= on, GÉP= machine, HÁL= mains
Created by XMLmind XSL-FO Converter.

Investigation of Salient pole Synchronous Machine
Fig 4 Circuit diagram of synchronizing unit SzB
Both mains and synchronous machine can be considered to be symmetrical therefore powers are measured by one wattmeter method using current transformer. Active power is measured in phase W, the current coil of wattmeter W2 is wired into the circuit of phase W, the voltage coil connected to phase W and the neutral. To measure the reactive power the current coil of wattmeter W2 is also wired into the circuit of phase W, but the voltage coil connected to the U-V line voltage. Be careful by calculating the three phase power values!
Connecting of synchronous machine to the mains has to be executed with synchronizing unit SzB.
The scheme of wiring the terminals of mains (R-S-T-0) end that of machine (U-V-W-0) is shown in Fig 3.
According to the circuit diagram of SzB (Fig 4) the voltmeter 1 measures the difference between the phase voltages of the mains UH and the machine UG. The double frequency meter 3 shows the frequency of both the mains voltage and the machine voltage. Using the switch 9 can be selected the voltage for voltmeter 2 and phase sequence indicator 4. When all the requirements for connecting to the mains are fulfilled connection is performed by pressing push- button 6 while using push- button 7 the synchronous machine will be separated. The contactor activated by push- button 6 connects only the corresponding phase terminals of the mains and the machine leaving the neutrals separate.
3.3. Recording the no-load and the short-circuit diagramsTo record the no-load diagram the scheme of Fig 2. is used. It is recommended to perform the task at constant nominal (synchronous) speed. The speed or it’s stability can be determined or checked using the stroboscope. Begin measure at the maximum value of excitation and decrease it monotonously following the down side of the hysteresis loop.
Created by XMLmind XSL-FO Converter.

Investigation of Salient pole Synchronous Machine
To record the (symmetrical) short-circuit diagram the terminals of synchronous machine have to be wired, most simple at the side of SzB. Unlike at no-load measurement in this case neither the value of the speed nor it’s stability are required. Since current at short-circuit (when the excitation currant kept constant) actually does not varies even significant changing of the speed. The previous experience can be explained as follows: the value of reactance Xd(f)=j2πfLa is more than the value of R even at frequencies significantly less then synchronous one, thus the quotient
specifying the short-circuit current gives constant, because Up(f) is also represents linear dependency of the stator frequency. The speed n standards specify for short-circuit measurement n≥0.2nn.
Fig 5 The shape of U0(Ig) and the Iz(Ig) diagrams
Begin measure at the maximum value of excitation and decrease it monotonously. Do not load the stator circuit continuously with current greater then rated value!
3.4. Connecting of synchronous machine to the mains (synchronizing)Check fulfilment of all requirements for connecting to the mains using the instruments in the synchronizing unit. If the phase sequence of the voltages at the synchronous machine and at the mains differ, switch off the system in safe conditions modify the circuit as necessary. Consider the correct operation of wattmeters then switch on the system again.
3.5. Control of active and reactive power. Change of load-angle δAnalyzing Fig 2 determine how can be changed the value and the sign of the active power and those of the reactive power. See and notice whether changing one kind of power modifies the other or not. Using the stroboscope follow the changes in load-angle.
3.6. Recording of current-vectordiagramKeeping the Ig excitation current constant measure 5-5 working points both in motor and generator modes. I g is given by the instructor. The endpoints of the current-vector can be drawn based on measured active and reactive power values. The character of the diagrams is shown in Fig 6.
Created by XMLmind XSL-FO Converter.

Investigation of Salient pole Synchronous Machine
Fig 6 The shape of current-vectordiagram
3.7. Recording of V-curvesKeeping the active power P constant, measure and draw the V-curves in the motor mode of the synchronous machine. P values are given by the instructor. Find the accurate value of the minimum point of the curves, the current minimum at the given power. In underexcited state the operation may cause instability. The character of the diagrams is shown in Fig 7. Dashed line 1 shows the limit of stabile operation area for machine with cylindrical rotor. Because of the salient pole rotor (reluctance torque) the limit of stabile operation area is higher according to the line 2.
Created by XMLmind XSL-FO Converter.

Investigation of Salient pole Synchronous Machine
Fig 7 V-curves of synchronous machine
3.8. Recording of P(δ) curvesKeeping the Ig excitation current constant, measure the active power P and the load-angle, both in motor and generator modes. Ig values are given by the instructor. Draw the active power P vs. load-angle. Take the number of pole-pairs into account. Do not load the stator circuit continuously with current greater then rated value. Find the load angle at the stability limit of the operation. Once synchronism is lost decreasing the stator current can machine return into the synchronism. In the case of unsuccessful return to synchronism disconnect the synchronous machine from the mains. The character of the diagrams is shown in Fig 8.
Created by XMLmind XSL-FO Converter.

Investigation of Salient pole Synchronous Machine
8. ábra: Active power P vs. load-angle δ
4. Evaluation of measurement, protocolProtocol includes the process of the measurement, the calculations and the evaluation of results. Draw and evaluate the no-load and short circuit diagrams, the current-vector diagram, the V-curves and the P(δ) diagram.
5. Questions1. Based on Fig 1 determine the direction of energy flow in the arrangement of machines both at motor and
generator operation of synchronous machine.
2. How should be manipulated the direction of energy flow in the arrangement of machines when synchronous machine is connected to the mains?
3. How should be realized motor and how generator operation of synchronous machine when it was connected to the mains?
4. Define the emf. of synchronous machine. How can you measure it?
5. Interpret the overexcited and underexcited state of synchronous machine.
6. How can be realized overexcited and underexcited state of synchronous machine?
7. How can be realized a soft start of the arrangement of machines?
8. Interpret the requirements for connecting to the mains.
9. How should be set the right frequency prior to the connecting to the mains and how should be checked the fulfillment?
10. How should be set the right stator voltage prior to the connecting to the mains and how should be checked the fulfillment?
11. How should be checked the phase sequence of the stator voltage in synchronous machine? How should be corrected the phase sequence in the case of inadequacy?
12. How should be set the right stator voltage phase position prior to the connecting to the mains and how should be checked the fulfillment?
13. Draw the scheme of wiring the wattmeter by one wattmeter method to measure active power. How to calculate the right three/phase value from the reading?
14. Draw the scheme of wiring the wattmeter by one wattmeter method to measure reactive power. How to calculate the right three/phase value from the reading?
15. During the recording of the no-load diagram what have to be kept constant and what have to be changed? What should be manipulated while performing the task?
16. What requirement have to be fulfilled and what have to be changed during the recording of the short-circuit diagram? What should be manipulated while performing the task?
17. What requirement has to be fulfilled and what have to be changed during the recording of the current-vectordiagram? What should be manipulated while performing the task?
18. What requirement has to be fulfilled and what have to be changed during the recording of the V-curves? What should be manipulated while performing the task?
19. Taking the arrangement of machines into consideration explain the order in the switching on process.
20. What should be manipulated to change the value and the sign of the active power?
Created by XMLmind XSL-FO Converter.

Investigation of Salient pole Synchronous Machine
21. What should be manipulated to change the value and the sign of the reactive power?
22. What is the connection between the measured load-angle, the "electrical" load-angle and the number of pole-pairs?
23. How to calculate the emf. voltage of the separately excited dc machine?
6. Recommended literature
[1] McPherson, G., Laramore, R. D.: Introduction to Electrical Machines and Transformers. John Wiley & Sons 1990.
ISBN-10: 0471635294 | ISBN-13: 978-0471635291
[2] Fitzgerald, A. E.,Kingsley, C., Umans, S.: Electric Machinery, McGraw-Hill, 2002.
ISBN-10: 0073660094 | ISBN-13: 978-0073660097
[3] Chapman, S. J.: Electric Machinery Fundamentals, McGraw-Hill, 2003.
ISBN-10: 0072465239 | ISBN-13: 978-0072465235
Created by XMLmind XSL-FO Converter.
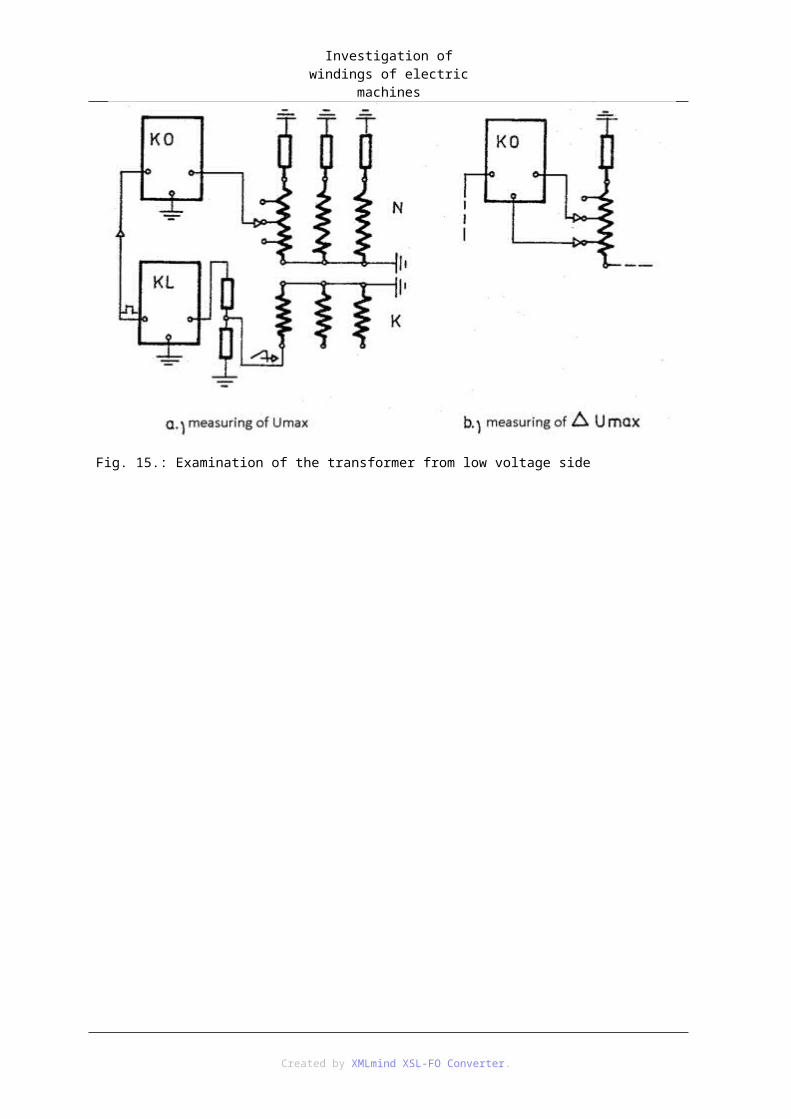
6. fejezet - Frequency converter-fed field-oriented controlled induction motor drive1. The keywords of the necessary knowledge:Induction motor (IM) Voltage source inverter (VSI), Pulse width modulation (PWM), Field-oriented control, Park(Space)-vectors
2. IntroductionThe new concept nowadays is the universal drive controller (UNIDRIVE). It means that the same unit can supply and control either induction or synchronous machines, with different control strategies.
It is true for most of the AC drives, that the power circuit practically the same: a current controlled pulse width modulated (PWM) voltage source inverter (VSI). The sensors necessary for current control and the current controllers are practically the same too. The outer speed control loop is field-oriented control in both cases, its implementation is different for the two machines. However the control hardware is programmable, so the flexibility is in the software. With a well-designed control program it can be made possible for the user to configure the system: what kind of motor, what kind of control structure and method is used fo drive control.
Its advantage from the viewpoint of the manufacturer are: one development cost, larger volume production, from the viewpoint of the user are: one training cost, one type of spare part, spare drive to stock, one supplier to be contacted. The price is obviously a little bit larger, caused by the built in configuration change ability. A universal unit is always more expensive than a special, one purpose unit containing only the definitely necessary functions.
The properties of the drives are:
1. Selectable operation modes:
1. Open loop speed control (without speed feedback) of an induction machine (IM), with slip compensation (scalar control).
2. Open loop vector control (speed sensorless field-oriented control) of IM.
3. Closed loop vector control (field-oriented control) of IM.
4. Control of a brushless synchronous servo drive.
1. Optional modules to avoid redundancy (encoder processing, resolver converter, EMC filter, communication units, etc.).
2. Optional modules to provide better application adaption (application module, different buses).
3. User friendly programming (configuring) menu driven graphical interface.
The aim of the laboratory exercise is to examine a UNIDRIVE-controlled IM drive with different control strategies.
2.1. The components of the driveThe block scheme of the drive is given in Fig.1. Its data are the following:
Type: UNI 2401Nominal power: 5.5 kWNominal current: 12 AMax.
Created by XMLmind XSL-FO Converter.

Frequency converter-fed field-oriented controlled induction
motor drivecurrent (60s): 18 AInput voltage: 3x380-480 VInput frequency: 48-62 Hz
2.2. The driven machineIt is an IM, with the following data:
Nominal power: 5.5 kWNominal voltage: 3×380 VNominal current: 13 ANominal speed: 960 rpm
2.3. The used instrumentsSILEX TMI-02 torque measuring instrument connected between the drive unit and the machine. Tektronix AM 503 current sensor with its amplifier to examine the input current. Tektronix 2246A oscilloscope to display the Park(Space)-vector loci and time functions.
The load can be modified by the excitation of the DC machine on the same shaft. The armature of the DC machine is connected to a load resistance.
2.4. Manipulation of the driveThe control unit stores the changeable parameters in registers. To manipulate the drive these must be changed, which can be done in three ways:
WARNING: WITHOUT KNOWING THE EFFECT OF THE PARAMETER CHANGE, DO NOT MODIFY! ITS WRONG VALUE CAN DESTROY THE DRIVE!!
1. There are many parameters to be changed in a modern drive (during commissioning, adaption to an application, and during opration also). It needs intelligent user-friendly manipulation. There is a graphical commissioning PC program (Unisoft) which can communicate with the drive on-line through the optional serial port. The parameters can be modified on-line (in ONLINE mode), stored in files, uploaded to the drive. The measured and processed signals of the control unit are refreshed continuously on the screen of the PC (in ONLINE mode). There are 14 functionally separated menus, the identification of the parameters is a 4 digit numerical code (the first two are the menu identifiers). A detailed description of the parameters can be displayed (DETAIL). In most of the menus the display form is graphical (block scheme), rarely numerical (table). The most frequently used parameters are collected in menu no.0. There is a possibility for the user to collect his most important parameters in a menu (Custom). As an example the graphical representation of menu 7 is given in Fig.3. for the parameters of the analogue in and output ports. The list of all menu parameters and its graphical representation (if any) is available at the site of the measurement.
2. The PC is not always available or necessary (e.g. during the regular operation of an industrial drive). That is why a local control possibility is necessary. There are buttons and displays on the front panel of the drive (minimal design). We shall use the PC control; the local control facilities are not descried.
3. Through the control terminals (in and output signals, analogue and digital in an outputs) the selected parameters can be set and displayed directly and clearly (these are available on the aux. front panel):
2.5. The process of the switching on1. Plug: PC (Windows can be started; the Unisoft icon starts the program).
2. Switching on the instruments.
3. ENG, ELŐRE, HÁTRA must be Up.
4. 3x380 V for the supply of the drive.
5. 2x110 V= for the excitation of the load machine.
6. Loading the parameters: There are many prepared parameter files for the different modes of operation in the HDD of PC in path c:\unidrive\*.ctd:
Created by XMLmind XSL-FO Converter.

Frequency converter-fed field-oriented controlled induction
motor drive7. Now the drive can be enabled (ENG), (in the case of open loop control, RESET is also needed), the direction
of rotation can be selected (ELŐRE-HÁTRA), reference can be set by the potentiometer. At acceleration and deceleration the control changes the reference with the given ramp. Too fast modification of the reference can cause problem: At acceleration over-current can occur. At deceleration overvoltage can occure (mainl at no-load without brake chopper). In the case of error the drive stops (coasts), ENG should be switched off, the error must be cleared by RESET, and then the drive can be started again, if the error ceases.
8. To set the parameters on-line and to monitor the drive values on-line the PC program must be switched to ONLINE (by clicking on OFFLINE). To set the parameter first you must click on it, then type or select its new value and click on CHANGE. There are only readable parameters. Without ONLINE connection the new value is set only in the memory of the PC!
2.6. Measuring tasks2.6.1. Setting the parameters, using the graphical interface.
2.6.2. Investigating the characteristic Park-vector loci and time functions.
2.6.3. Investigating the input current time function.
2.6.4. Open-loop control of IM (without speed feedback) with slip comensation (scalar control).
1. Checking, how the speed is kept constant.
2. Effect of the wrong compensation (e.g. the motor nominal current can be modified temporarily in menu 5.).
3. Measuring the U-f function (they can be read in menu 5).
4. Effect of the low frequency voltage rising (boost) (05.15, in %).
5. Providing the nominal voltage with over-modulation (05.20 parameter=1). Investigating the modification of harmonic content. Observing the current.
6. Modifying the switching frequency (parameter 05.18, fix values can be selected, see DETAIL), observing the current pulsation.
7. Using the brake chopper.
8. Observing the motor current vector in d-q reference frame. At low frequency, at field weakening also.
2.6.5. Open loop vector control of IM (sensorless field-orinted control)
1. The speed is calculated from the measured currents and the output voltage by a motor model. It needs the magnetising current and the stator resistance. These can be measured by the drive in the following way:
2. Parameter 05.12 must be set to 1, then the drive is enabled, the magnetising current is measured. It must be executed at no-load, the drive accelerates automatically to 50% speed. If the measurement is successful, parameter 05.12 is reset to zero. (Can be that this measurement modifies the nominal cosφ).
3. In case of zero value of parameter 05.14 the resistance is measured at every enable (at ELŐRE-HÁTRA switch).
4. All these can be execute in the COMISSIONING screen by clicking on the AUTOTUNE and executing the requested operations written on the screen.
2.6.6. Closed loop vector control (filed-oriented control) of IM
It is a direct field-oriented control; its block scheme is given in Fig.2.
1. Checking, how the speed is kept constant.
Created by XMLmind XSL-FO Converter.
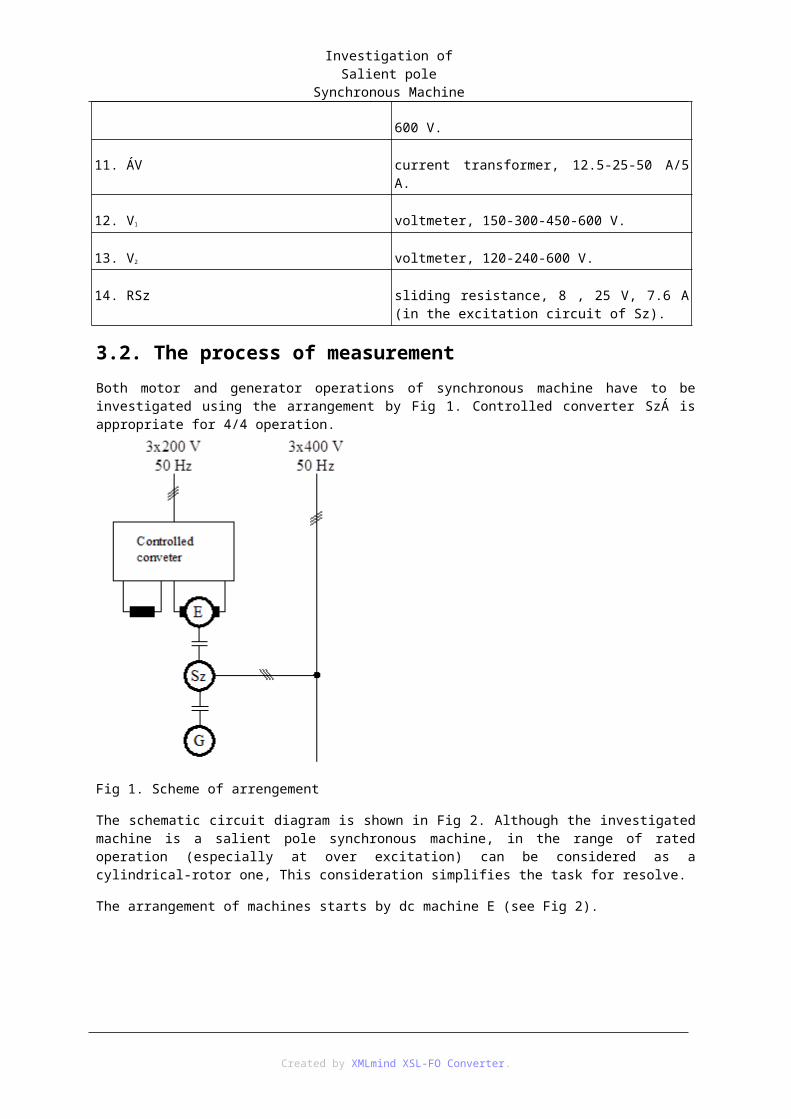
Frequency converter-fed field-oriented controlled induction
motor drive2. Observing the motor current vector in d-q reference frame.
3. Providing the nominal voltage with over-modulation (parameter 05.20).
Fig.1. Block scheme of the drive
Fig.2.Block scheme of the field-orinted (vector) control.
Created by XMLmind XSL-FO Converter.

Frequency converter-fed field-oriented controlled induction
motor drive
Fig.3. Block diagram of menu 7.
Created by XMLmind XSL-FO Converter.

7. fejezet - Examination of switched reluctance motor drives1. Purpose of this exerciseTo introduce problems related to the design and control of high-quality, high-torque switched reluctance motor drives. To introduce the operation and the control properties with a drive made in the UK.
2. Theoretical basics2.1. Design of SRMThe design of SRMs is very similar variable reluctance stepping motors without tooth multiplication. Both the stator and the rotor have salient poles and the winding is on the stator. This is the simplest electric rotating machine with concentric windings. Based on its design it is the simplest, cheapest to produce electric rotating machine. It has lots of variations in design and in power supply. In case of symmetric design for four-quadrant operation we need at least 3 phases. Despite this it is possible to find SRM drives with one- and two-phase. For high-quality, toque ripple free drives normally 4 or 6 phases are used.
2.2. Power supply of SRM drivesThe difference between the operation of the SRM drives and the variable-reluctance stepping motor drives is that with SRM drives – similarly to the matched drive of permanent magnet synchronous machines – the current is controlled based on the angular position of the rotor. The current magnitude is defined by the torque demanded by the drive. With stepping motor drives the commutation of the phases is based on frequency defined by the user and the current is kept constant. The angular position of a stepping motor’s rotor is based on the torque required by the current situation. For this reason a stepping motor mode has lowest efficiency. Furthermore with the stepping motor drives – similarly to the synchronous drives supplied by constant voltage and frequency source – it is also possible the fall out of synchronism. With high quality handling tasks it cannot be allowed.
The SRM drives have good efficiency because they are the kind of unipolar synchronous machine drives where there is no windings on the rotor. For the operation there is no need for current at the rotor, and the direction of the torque is independent from the current direction. The direction of the torque is based on that in which angular position of rotor we have current in certain phases. Because of the unipolar power supply the hysteresis loss of this machine is lower than with other machines. The copper losses are reduced by the simple windings because the most of the windings have a role in torque generation compared to regular synchronous, asynchronous and DC machines where the need for head coil increases the length of the copper wires which will result increased size and losses of the machine.
An important factor with the selection of SRM drives is number of phases. Assuming synchronous design for the machines for creating positive and negative torque we can have 180 degrees at most per phase. So the maximum ratio of current is 50%. In case of an n-phase SRM we can have current in n/2 phases at the same time. Because of this it is fortunate to have 4- or 6-phase SRM so we can have current in 2 or 3 phases which makes easy to create ripple-free torque. During this exercise we will work with a 3-phase SRM. In case of a 3-phase machine the most common method is that we have current only in one phase not mentioning the commutation when we switch between phases. For this operation mode we can use simpler electronic circuit compared to the regular half-bridge. In this case the 3 phase connected in Y and current controller controls the star point current. The phase transistors are determining the active phase. The drive in this exercise is not using this method.
It is specific for 3-phase SRM drives that when designing the machine the purpose is to have a linear inductivity-angular position profile and to create torque the current magnitude and switching angle are being modified. At higher rotation speed the torque-control by the current signal is limited because of the voltage limit. In these cases the main control option is the changing of the switching angle. At this time the shape of the
Created by XMLmind XSL-FO Converter.

Examination of switched reluctance motor drives
phase currents are different compared to the low-frequency ones.
3. Details for the measurement3.1. Main components of the drive1. SRM machine (type SR 75):
1. 3-phase stator windings: In=15 A, 6 teeth,
2. 8 teeth at the rotor,
3. stator/rotor: 48/50 teeth,
4. Mn=48 Nm, Mmax=72 Nm, nmax=1500/min
1. SRH the power supply for SRM
2. PA – Voltech 3-phase power analyzer (PM 3000)
3. EAG – DC load machine (balance machine): type 5 EMD 135/4 made by Egyedi Kismotorgyár:
1. Un=220V, In=40 A, Pn=10 kW
2. nn=1500 /min,
3. k=0.716 m (length of the balance beam),
4. Ug=220 V.
1. Ag – Deprez ampere meter Imh=3A
2. At – Deprez ampere meter 60 mV/0.6 mA (with 50 A/60 mV shunt)
3. HP – HP Oscilloscope for displaying current waveforms, and Park-vectors
4. F – Rotation per minute display (can be found on the front panel of SRH)
5. Rt –Load resistor: Un=380/220 V, Pmax=10 500 W
6. Rg –Slide resistor: R=200 Ω, U=250 V
7. Rf – Break resistor: R=8+8 Ω, U=250 V
8. Av1, Av2, Av3– The current transformers placed in the SRM drive’s circuit in order to provide signals for check the current waveforms. (see also at the Park-vector creator’s manual) 100 A=>15 V
9. KAv – Clamp current transformer
10. TD – Tachodynamo: U=25 V (n=1000/min)
11. Vt – Deprez volt meter: Umh=6-12-30-60-120-300-600 V
Created by XMLmind XSL-FO Converter.
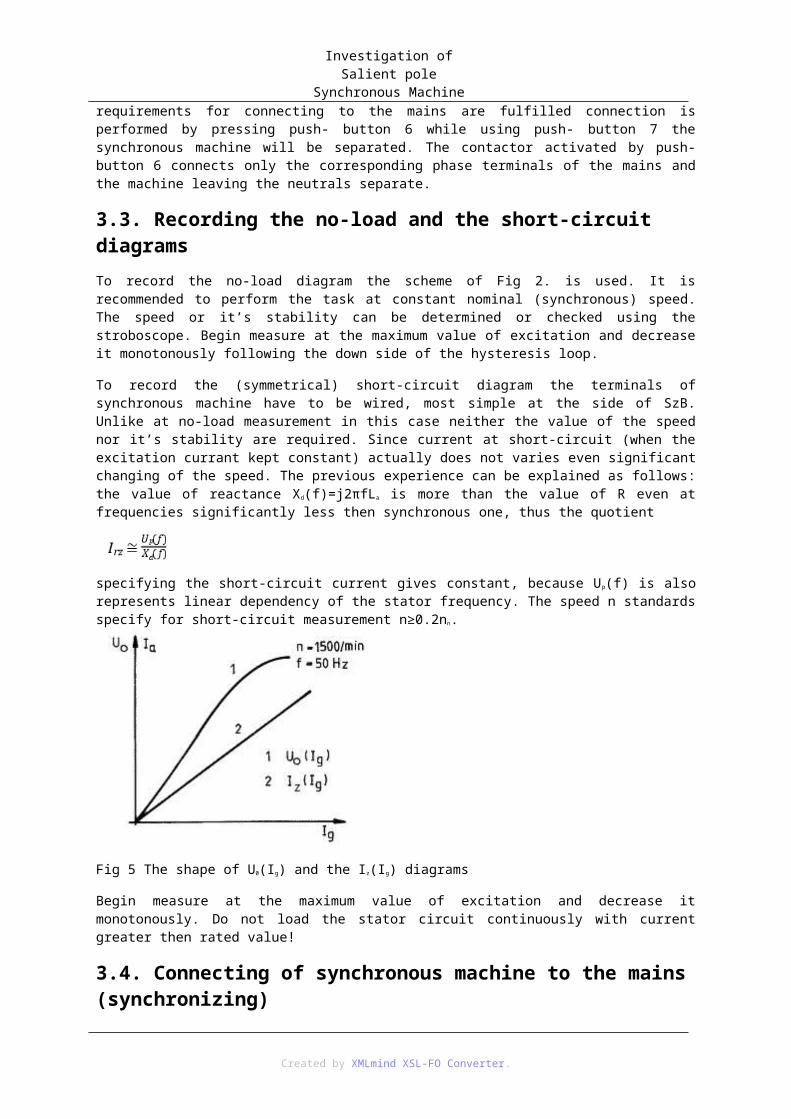
Examination of switched reluctance motor drives
Figure 1.: The stucture of the drive
3.2. Power supply of the SRM drive1. The controls for the drive
Figure 2.: The controls for the drive
1. START: Enabling drive control at startup,
2. ELŐRE/HÁTRA: Switch for changing the rotation direction,
3. INCH: Switch on the minimal speed mode,
4. ALAPJEL: Potentiometer for rotation speed signal (P),
5. STOP: Normal shutdown of the drive with using the generator as a break,
6. VÉSZGOMB: Emergency shutdown,
7. RESET: Shutdown because of errors, and resetting the software after errors.
1. Parameters can be set at the control panel (with a screwdriver)
1. maximum and minimum speed,
2. the speed of the inch mode,
3. the acceleration and the breaking limit,
Created by XMLmind XSL-FO Converter.

Examination of switched reluctance motor drives
4. the rotation speed controller’s P- and I- element,
5. the torque limit in motor mode,
6. the torque limit in generator mode.
1. Displays
1. LEDs:
2. Test signals:
1. The power electronic circuit and its operation
Figure 3.: The power electronic circuit
The power supply contains a 3-phase diode-based bridge circuit (EI), high-voltage capacitors at the DC side (K), charge- and discharge-resistors (R, Rk), A, B, C the 3-phase and their regenerating breaking mode (BR) IGBT modules.
At the startup of the 3-phase power supply the K DC capacitors are being charged throw R charge resistor and EI rectifier to reach the desired voltage level. Then they got short-circuited throw the R charging resistor.
In case of no supply voltage, the K capacitor gets short-circuited throw Rk discharge resistor. The A, B, C IGBT module connected to the phases contain 2 transistors and 2 diodes. The circuit provides one-way current flow as needed for the SRM drive. When the transistors are on, a positive voltage level is connected to the phase-coils, when they are off, the diodes conduct the current so voltage connected to the phase-coils has an opposite sign. It is possible to have 0 voltage level by using a transistor and an opposite diode for conduction.
The BR breaking-mode IGBT’s task is to consume the entire energy - generated in this case – throw Rf resistor, because throw the diode-bridge it is not possible to fed it back.
1. Block diagram of the drive’s control
Figure 4.: Block diagram of the drive’s control
3.3. Drive startup
Created by XMLmind XSL-FO Converter.

Examination of switched reluctance motor drives
1. Set the P potentiometer to 0.
2. Turn on the 3×380 V network.
3. Make sure there is no error signal or sign of fault operation. In case of correct operation ‘0’ sign can be seen on F display.
3.4. Operation of the drive1. Set the rotation direction by the ELŐRE/HÁTRA switch.
2. Start the drive with the START button.
3. Set the desired rotation by the P potentiometer.
4. In case of any error stop the drive by the VÉSZGOMB button. Before restarting the error should be corrected and after that use the RESET button.
5. To stop the drive use the STOP button.
6. During the operation it is allowed to change to rotation speed by the P potentiometer and to change the direction by the ELŐRE/HÁTRA switch.
3.5. Using the Voltech 3-phase power analyzer (PA) for power measurements1. Turn on the PA by the POWER button.
2. Set the 3-phase 3-wire mode by the 3 4W switch.⊘
3. Select the summed display of values by Σ switch. (for example: power: W)
4. Push the INTEGRATOR button at the MENUS.
5. In the display menu select <enable> by the combination of SELECT, ENTER, then select <trigger> and finally <manual>.
6. When the operating point is correct, push the Whr button to display the energy.
7. Push START/RESET button to start the integration.
8. After the desired the time read the time and energy values.
9. Push STOP button to stop the integration.
4. Measurement exercises4.1. Overview of the circuit, the operation of the SRM driveIf all equipment is working correctly the machine starts turn rotate. In F display and at the Vt voltmeter indicates rotation signal. The HP oscilloscope shows current signal form. During the exercise we gradually increase the base signal with P potentiometer until the desired speed.
4.2. Checking the current shapes under different load and at rotation speedsThe task is to observe signal forms of the grid, the motor supply current and to indentify tendencies. To measure current conducting times in percents at load and rotation speed defined by the measurement supervisor. To take the current Park-vector at these operating points.
Created by XMLmind XSL-FO Converter.

Examination of switched reluctance motor drives
4.3. Checking the current Park-vectorThe task is to take current Park-vector at the operating point form previous exercise and cross-check it with time functions.
4.4. Calculating the drive efficiencyAt the operating point defined by the measurement supervisor use the VOLTECH power analyzer to measure the power consumed by the drive. For precise measurement measure filtered and averaged value. The power supplied by the drive can be calculated by multiplying the torque and the angular speed.
5. Questions1. What is the design of SRM like?
2. Why these motors called switched reluctance motors?
3. What are the considerations for choosing phase number?
4. Based on which criteria can we select the phase number of the stator and the rotor?
5. What kind of inductivity-angular position profile can we use for a 3-phase SRM?
6. What kind of control system can we use for a 3-phase SRM?
7. What kind of circuits can we use for a 3-phase SRM’s power supply?
8. What are the advantages and disadvantages of SRMs?
9. From electronics point of view how can you describe a SRM drive?
10. Where can we use SRM drives?
Questions to think about
1. How we operate a one-phase SRM drive?
2. Why can’t we use the tooth multiplication similarly as with stepping motors?
3. How magnetic saturation effect the torque?
4. Is it possible to use a SRM at area of magnetic saturation?
6. References[1]
Schmidt István, Vincze Gyuláné, Veszprémi Károly: Villamos szervo- és robothajtások, Műegyetemi Kiadó, 191-201. oldal, 2000.
Created by XMLmind XSL-FO Converter.

8. fejezet - Measurement of a speed controlled DC servo drive1. Scope of the measurementGoal of the measurement is to examine control features and characteristics of a complete, commercial drive system. The DC servo drive system consists of a permanent magnet DC (PMDC) servo motor and a servo amplifier. The latter incorporates the power electronics, the control circuits and the power supply.
2. Theoretical background of the measurement2.1. Characteristics of PMDC servo drivesPMDC (permanent magnet, DC) motors (Fig. 1.) have an internal induced voltage (back EMF, u b) which is proportional to the angular speed of the shaft (w). Their torque (m) is proportional to the drawn current (i):
(8-1)
where
ub is the internal induced voltage (back EMF),
m is the torque of the motor,
KE is the voltage coefficient of the motor [Vs/rad] in SI units,
KT is the torque coefficient of the motor [Nm/A] in SI units,
w is the angular speed of the shaft,
i is the current drawn by the motor.
Figure 1: Schematics of the servo driveunder consideration
In case of permanent magnet excitation, both coefficients (kE and kT) are constants and the pole flux is constant. When expressing the two constants in the same units (in SI system Vs=Nm/A), their numeric values are also the same.
The angular speed of a motor is determined by the 2nd law of Newton:
Created by XMLmind XSL-FO Converter.

Measurement of a speed controlled DC servo drive
(8-2)
where
mt is the braking torque of the load being driven by the motor,
θ is the moment of inertia of the rotating parts.
The current drawn by the motor (and hence the torque of it) can be calculated from the following equation:
(8-3)
Here each product is a voltage component of the equivalent circuit of the motor (see Fig. 1).
R is the armature (here rotor) resistance of the motor,
L is the armature inductance of the motor.
On the basis of the steady state form (dn/dt=0) of the above equations, the torque-speed function of the motor can be expressed:
(8-4)
2.2. Features of the servo amplifierThe servo amplifier is a four quadrant DC chopper circuit, which is able to output three different, discrete voltage levels (+Udc, -Udc and zero).
The mean (average) value of the output can be varied between these levels by applying high frequency switching (5-50 kHz). Usually PWM(Pulse width modulation) with constant switching frequency is applied.
In bipolar operation the switching is performed between +Udc and –Udc, while in unipolar operation, the switching is done between +Udc and zero or –Udc and zero. According to these, there are two different chopper control methods are in use.
In a complementer control, T1, T4 and T2, T3 are two pairs. Transistors within the pairs are switched together, different pairs are switched oppositely (e.g. when T1 and T4 are turned on, the T2 and T3 are turned off. In this case the output voltage is bipolar. In case of alternative control T1, T4 and T2, T3 are switched alternatively with half period shift in time. The output voltage is unipolar. In practice the unipolar is preferred, as it results lower ripples for the same DC level.
2.3. Control of the servo drive1. In case of DC servo drives, usually multiple, cascaded control loops are applied. The control in the simplest
case may consists of a single current (torque) control loop. Most controllers apply speed control with current control. However in many cases there is a need also for position control. In these cases position control with speed control is applied. In these latest case, design of three cascaded control loop is necessary.
2. Current control can be performed also by hysteresis controller. The drive in this measurement is a speed controlled DC servo drive with a PI controller in its current control loop and with PWM.
3. Introduction of the measurement3.1. Main components of the drive being studied
Created by XMLmind XSL-FO Converter.
Measurement of a speed controlled DC servo drive
1. PMDC servo motor (type EZG-703.0-101):
1. Equipped with a tachometer (9,56 V/1000 rpm),
2. Mn=3 Nm, In=13 A, Imax=40 A, KT=0,24 Nm/A, Θ=0,00192 kgm2, nmax=2500 rpm,
3. Time constants: Tv=3,3 ms, Tm=19 ms.
1. Transistorized servo amplifier(type: CVT 012.3, manufactured by EVIG-STROMAG)
1. Operation domains: 4/4, control mode: alternative with 8,5 kHz PWM frequency,
2. Controls the speed of the motor, consists of cascaded speed and current controllers. The current controller provides the current limitation (both short and long term currents),
3. Both the current controller and the speed controller are analogue PI type ones,
4. Mean value of maximum voltage: ±150 V, short time maximum current: ±20 A, permanent current: ±12 A.
1. Power supply of the servo amplifier
Three phase full bridge, which consists of diode rectifiers supplied by a three phase 380 V/110 V transformer. The supply is equipped with filtering capacitors, and a brake chopper with a brake resistor, which prevents overvoltages of the DC rails.
1. Load
Loading is performed by an eddy current braking device, which is equipped with arms. Torque can be calculated as the product of weights (in Newtons) hanging on the arms and the length of the arms (in meters).
1. Metering
For the speed measurement, a voltmeter is available; the current of the motor can be measured by an ampermeter. For the investigation of dynamic properties, a signal generator and an oscilloscope is to be used.
3.2. Startup and handling of the drive1. Turn on the 230 V, 50 Hz and the 3×400 V, 50 Hz network.
2. Enable the control of the transistors by turning on the ON-OFF switch.
3. Enable the controller.
4. Set the desired speed reference level by a potentiometer. Onto connectors labeled by “signal generator”, different signals such as sinusoidal, trapezoidal and triangular can be connected. The signal is added to the reference provided by the potentiometer.
5. Current limitation can be set by the current limit potentiometer.
6. Turn off process is the same but in opposite order.
4. Measurement tasks4.1. Measurement of the torque characteristicsThe goal is to determine the M(I) curve of the motor, and to verify the value of the torque constant (K T) at three different rpm values. Determine the effects of friction! During this measurement the torque produced by the eddy current load device is measured.
4.2. Investigation of effects of current limitation
Created by XMLmind XSL-FO Converter.
Measurement of a speed controlled DC servo drive
Measure a controlled n(I) curve with maximum and minimum current limits.
4.3. Investigation of current and speed curves with different speed reference signalsDetermine the required conditions for speed reference following without distortion! Determine the maximum follow able speed ramp (dn/dt) both for minimum and maximum current limits! Data should be taken with different mean values of the speed reference.
4.4. Measurement of the Bode diagram of the control loopTake the Bode diagram of the control loop! For setting of the controllers, Bode diagram of the open loop should be measured. During this measurement, Bode diagram of the closed loop has to be measured. A Bode diagram consists of an amplitude diagram (ratio of output and input amplitudes of sinusoidal signals as a function of frequency) and a phase diagram (phase shift between sinusoidal output and input signals as a function of frequency). During the measurement, the mean value of the speed reference signal should be zero.
5. Test questions1. Which are the most important parameters and features of DC servo motors?
2. Which are the advantages and disadvantages of DC servo drives?
3. Which are the most important equations describing the operation of a DC motor?
4. Introduce a circuit, which can be used in the supply of DC servo motors!
5. How can we control such a circuit?
6. What are the differences between unipolar and bipolar control modes?
7. In which case the current ripples are higher?
8. How is it possible to determine the output torque of a motor from the measurement results?
9. Why is it necessary to perform the measurements on a closed control loop?
10. What is the relation between the Bode diagrams of the closed and the open control loops?
6. Questions to think about1. How to prove that the units of the torque and voltage constants are the same?
2. At which speed occurs the maximum in current ripples in case of unipolar and bipolar control modes?
3. Give an approximation to the ratio of these maximum current ripples, when the switching frequency is the same!
4. Overshoot is experienced in the speed signal, when the reference is a square wave. How is it possible to explain this on the basis of the Bode diagram?
7. ReferencesSchmidt István, Vincze Gyuláné, Veszprémi Károly: Villamos szervo- és robothajtások, Műegyetemi Kiadó, 46-67. oldal, 2000.
Created by XMLmind XSL-FO Converter.

9. fejezet - Computerized Machine Tool Controller1. Scope of the measurementGoal of the measurement is to familiarize a computerized controller (CNC controller), which is used in CNC „Computerized Numerical Control” systems. However the device is able to serve all functions required by state-of-the art machine tools. In the following we will focus on two-axis movements (prepositioning of the tool). The two-axis movement is performed by two DC drives (motor and controlled electronic supply). In reality this means the X and Z axis movements (prepositioning) of the tool during the machining process. The CNC controller regulates the DC drives such a way that it follows a prescribed trajectory (path) with a prescribed speed profile. The operation of the controller can be studied by using freely rotating DC servo motors without the machine tool itself. The device contains the same 4 quadrant DC servodrives as in the measurement before. The main drive is simulated only, other functions like tool change and wear correction are not discussed here.
2. Theoretical background of the measurement2.1. Characteristics of PMDC servo drivesPMDC (permanent magnet, DC) motors (Fig. 1.) have an internal induced voltage (back EMF, u b) which is proportional to the angular speed of the shaft (w). Their torque (m) is proportional to the drawn current (i):
(9-1)
where
ub is the internal induced voltage (back EMF),
m is the torque of the motor,
KE is the voltage coefficient of the motor [Vs/rad] in SI units,
KT is the torque coefficient of the motor [Nm/A] in SI units,
w is the angular speed of the shaft,
i is the current drawn by the motor.
Figure 1: Schematics of the servo drive under consideration
In case of permanent magnet excitation, both coefficients (KE and KT) are constants and the pole flux is constant.
Created by XMLmind XSL-FO Converter.

Computerized Machine Tool Controller
When expressing the two constants in the same units (in SI system Vs=Nm/A), their numeric values are also the same.
The angular speed of a motor is determined by the 2nd law of Newton:
(9-2)
where
mt is the braking torque of the load being driven by the motor,
θ is the moment of inertia of the rotating parts.
The current drawn by the motor (and hence the torque of it) can be calculated from the following equation:
(9-3)
Here each product is a voltage component of the equivalent circuit of the motor (see Fig. 1).
R is the armature (here rotor) resistance of the motor,
L is the armature inductance of the motor.
On the basis of the steady state form (dn/dt=0) of the above equations, the torque-speed function of the motor can be expressed:
(9-4)
2.2. Features of the servo amplifierThe servo amplifier is a four quadrant DC chopper circuit, which is able to output three different, discrete voltage levels (+Udc, -Udc and zero).
The mean (average) value of the output can be varied between these levels by applying high frequency switching (5-50 kHz). Usually PWM (Pulse width modulation) with constant switching frequency is applied.
In bipolar operation the switching is performed between +Udc and –Udc, while in unipolar operation, the switching is done between +Udc and zero or –Udc and zero. According to these, there are two different chopper control methods are in use.
In a complementer control, T1, T4 and T2, T3 are two pairs. Transistors within the pairs are switched together, different pairs are switched oppositely (eg. when T1 and T4 are turned on, the T2 and T3 are turned off. In this case the output voltage is bipolar. In case of alternative control T1, T4 and T2, T3 are switched alternatively with half period shift in time. The output voltage is unipolar. In practice the unipolar is preferred, as it results lower ripples for the same DC level.
2.3. Control of the servo driveIn case of DC servo drives, usually multiple, cascaded control loops are applied. The control in the simplest case may consists of a single current (torque) control loop. Most controllers apply speed control with current control. However in many cases there is a need also for position control. In these cases position control with speed control is applied. In this latest case, design of three cascaded control loop is necessary.
Current control can be performed also by hysteresis controller. The drive in this measurement is a speed controlled DC servo drive with a PI controller in its current control loop and with PWM.
Created by XMLmind XSL-FO Converter.

Computerized Machine Tool Controller
3. Introduction of the measurement3.1. Main components of the drive being studied1. NC 90 T machine tool controller (NC-Technika Zrt.)
Main parts of the device:
1. 16 bit CPU unit (I 80186 µP 8 MHz clock frequency, 384 k UV EPROM and 128 k CMOSRAM memories), equipped also with auxiliary circuits for a motor control and measurements,
2. I/O unit performing PLC functions,
3. Keyboard, monitor and serial communication unit operated by a different µP,
4. Power supply unit.
1. 2 pieces of PMDC servo motors (type EZG-703.0-105):
1. equipped by tachometer (9.6 V at 1000/min speed),
2. ANDIMIK-I-04/2500-D type 2500 pulses/revolution incremental position sensor,
3. Mn=3 Nm, In=13 A, Imax=80 A, KT=0.24 Nm/A, Θ=0.00192 kgm2, nmax=2500/min,
4. Time constants: Tv=3.3 ms, Tem=19 ms.
1. 2 pieces of servo amplifiers (CVT 012.4, EVIG-STROMAG type)
1. 4 quadrant, alternative control, PWM frequency 8.5 kHz,
2. speed control with cascaded current control: this protects the motor (commutation current limitation and time dependent thermal current limitation),
3. P150/90 type power supply in the same box with the CNC controller.
1. Oscilloscope a to investigate the motor current and speed signals
3.2. Startup and handling of the drive1. Turn on the 230 V, 50 Hz and the 3×400 V, 50 Hz supply.
2. Turn on the main switch of the box. After several minutes of self-test, the screen gives an OK signal and takes the SELECT state. In this state the desired operation modes can be set, the CNC controller can be programmed.
3. Any kind of motion (manual, auto or test) of the motors is only possible if:
1. the emergency shutdown button is off,
2. the NC ready LED is on,
3. the MACHINE ON function is active in the main menu (light instead of being dark).
After these are set, the motors can be controlled. Without a control command they are keeping their position, and they produce torque if needed to conserve it.
1. Before starting programming it is necessary to move the simulated main drive to left (M03) or right (M04) as machining cannot be made in reality without it.
2. Mode, submenu or function can be chosen by using the function buttons next to the menu items. Step back towards the main menu is possible with the bottommost page back button. After turning on the MACHINE
Created by XMLmind XSL-FO Converter.

Computerized Machine Tool Controller
ON mode, a flashing „R” indicates an error till x0, z0 references are set.
3. Under the ZERO menu item, three possible references can be set: FLOAT – the current position will be the reference, GRID - position according to the next 0-pulse and the third possibility is position indicated by end switches, but such switches are not present in the measurement setup. When positioning to GRID was selected, then after CYCLUS START it is possible to move on the grid by using the ±x and ±z buttons.
4. After setting the reference point, the system automatically changes to TOOL selection mode, which is useless in this measurement set, so one should go back to the main menu.
5. From the MANUEL menu, motors can be operated manually by using the ±x or ±z buttons, while the speed can be varied. The default speed is 100*F [rpm], where F is a programmed speed vector with m/min dimension. The value set can be modified percent wise by using the lower button. By activating one of the 1, 0.1 and 0.01 function buttons, the displacement becomes incremental: in z direction it will be ±1, ±0.1 or ±0.01 mm, while one full revolution of motor „z” means 10 mm. One full revolution of motor „x” means 20 mm displacement, when diametric evaluation is set.
6. From the MANUEL menu by choosing MPGX and MPGZ, following mode can be set. In this case, the reference positions are set by the handwheel.
7. From the MANUEL menu, also some programming can be done by defining “sentences”.
8. In EDIT mode, in the PROGR submenu it is possible to make longer programs. On the screen, the LY program of actual program memory can be seen, where Y is four digit numbers. This can be erased by CLEAR, or can be saved to a background memory by DIR, from where it can be recalled by its number. There are 8-10 burnt in programs in a non-volatile, read only memory. These can be loaded into the actual program memory by LOADPROM.
9. In EDIT mode it is possible to set the parameters of the system (PARAM) or to program PLC function (INTERF), or to handle programs stored on external devices (CASETT, RS232).
10. After exiting EDIT mode, the COMPILE follows, which accepts only errorless programs, otherwise error is indicated.
11. In TEST mode it is possible to test a program by trial run or step by step. In GRAPH mode, resultant movements of a program, in x, z plane, can be visualized. NORMAL fits the screen, otherwise details can be magnified as well..
12. The AUTO mode is the real run of the program. This can be launched by CYCLUS START. Verification can be performed by in GRAPH (graph) or ALPHA mode (text). A program can be stopped by CYCLUS STOP or by an internal conditional command built into the program itself” (P3).
4. Measurment tasks4.1. Become familiar to control tasks regarding the machining tool
4.2. Investigate the movements on an oscilloscopeInvestigate the movements according to different sentence type on the oscilloscope. The oscilloscope can visualize the current and speed of both motors. According to these, speed and acceleration of the given motor can be verified. Current scale is 10 A/10 V, speed scale is 1000 rpm/9.6 V.
4.3. Trajectory designCalculate and design a prescribed trajectory.
4.4. Trajectory programming
Created by XMLmind XSL-FO Converter.

Computerized Machine Tool Controller
Make a program which follows the designed trajectory, and verify it in TEST mode.
4.5. Trajectory following testInvestigate the following of the designed trajectory in AUTO mode. For this, oscilloscope function of the CNC controller’s memory can be used.
5. Test questions1. How can we specify a DC servo motor?
2. Which are the advantages and disadvantages of DC servo drives?
3. Which are the most important equations describing the operation of a DC motor?
4. Introduce a circuit, which can be used in the supply of DC servo motors!
5. How can we control such a circuit?
6. What are the differences between unipolar and bipolar control modes?
7. In which case the current ripples are higher?
8. How is it possible to determine the output torque of a motor from the measurement results?
6. Questions to think about1. How to prove that the units of the torque and voltage constants are the same?
2. At which speed occurs the maximum in current ripples in case of unipolar and bipolar control modes?
3. Give an approximation to the ratio of these maximum current ripples, when the switching frequency is the same!
7. ReferencesIstvan Schmidt, Gyulane Vincze, Karoly Veszpremi: Electric servo and robot drives, Műegyetemi Kiadó, pages 46-67, Budapest 2000 (in hungarian).
Created by XMLmind XSL-FO Converter.