magbuhatrobotics.files.wordpress.com · Web viewLet’s say that with the motor used by the EV3 and...
19
Chapter 17. data logging In this chapter, I’ll show you how to use EV3 features that you’ve already learned about to log motor and sensor data in files, making your EV3 a data logger. Data logging is the process of acquiring and recording data. First, we’ll experiment to determine what the Motor Rotation block’s Current Power reading really means. Then, we’ll examine how the Move Steering block’s Steering parameter behaves. We’ll wrap up with an experiment to test the reliability of the LightPointer program from Chapter 11, which uses the Color Sensor to point the TriBot in the direction of a light source. I’ll only use features common to both the EV3 Home and Education Editions, but the Education Edition has more ways to collect and present data from experiments, making it a great tool for classroom use. If you’re working with the Education Edition, it’s well worth your time to investigate these features. data collection and the EV3 Collecting data is critical to any experiment, but collecting data by hand can be tedious and error prone. Most people just aren’t that good at recording measurements quickly at precise intervals or over long periods of time. Fortunately, computers excel at this kind of task. The combination of the EV3 Brick computer and sensors makes the EV3 ideal for collecting data. When designing a program, it can be useful to run some tests to learn how a sensor or motor will react under the conditions you expect your program to experience. The more you know about the motors, sensors, and programming blocks, the easier it is to write working programs, so let’s dive right in with an experiment! investigating the current power reading The Motor Rotation block has a Measure - Current Power mode, which tells us the motor’s power as a general expression of strength at a particular moment. The Move block’s Power parameter is connected to this mode, and in the following sections we’ll write some simple data-logging programs to explore this connection.
Transcript of magbuhatrobotics.files.wordpress.com · Web viewLet’s say that with the motor used by the EV3 and...

Chapter 17. data loggingIn this chapter, I’ll show you how to use EV3 features that you’ve already learned about to log motor and sensor data in files, making your EV3 a data logger. Data logging is the process of acquiring and recording data.First, we’ll experiment to determine what the Motor Rotation block’s Current Power reading really means. Then, we’ll examine how the Move Steering block’s Steering parameter behaves. We’ll wrap up with an experiment to test the reliability of the LightPointer program from Chapter 11, which uses the Color Sensor to point the TriBot in the direction of a light source.
I’ll only use features common to both the EV3 Home and Education Editions, but the Education Edition has more ways to collect and present data from experiments, making it a great tool for classroom use. If you’re working with the Education Edition, it’s well worth your time to investigate these features.
data collection and the EV3
Collecting data is critical to any experiment, but collecting data by hand can be tedious and error prone. Most people just aren’t that good at recording measurements quickly at precise intervals or over long periods of time. Fortunately, computers excel at this kind of task. The combination of the EV3 Brick computer and sensors makes the EV3 ideal for collecting data.
When designing a program, it can be useful to run some tests to learn how a sensor or motor will react under the conditions you expect your program to experience. The more you know about the motors, sensors, and programming blocks, the easier it is to write working programs, so let’s dive right in with an experiment!
investigating the current power reading
The Motor Rotation block has a Measure - Current Power mode, which tells us the motor’s power as a general expression of strength at a particular moment. The Move block’s Power parameter is connected to this mode, and in the following sections we’ll write some simple data-logging programs to explore this connection.
THE CURRENTPOWERTEST PROGRAM
For our first experiment, we’ll record the Current Power reading of motor B as we adjust the Power parameter of a Large Motor block using the CurrentPowerTest program shown in Figure 17-1. The program starts the motor running at 100 percent power and then enters a loop in which the Power parameter of the Large Motor block is stepped down from 100 to 1. It records the Current Power at each step, and each time through the loop, the Power parameter and the Current Power reading is written to the CurrentPowerTestData file.
Instead of using a File Access block to write the Power parameter and the Current Power reading separately, the data file created by the program contains one line for each measurement. Each line contains both pieces of information separated by a comma, a format known as comma-separated values (CSV). Files in this format typically use .csv for an extension. Spreadsheet programs know how to work with data files in this format, so arranging the data this way will make it easier for us to analyze later.
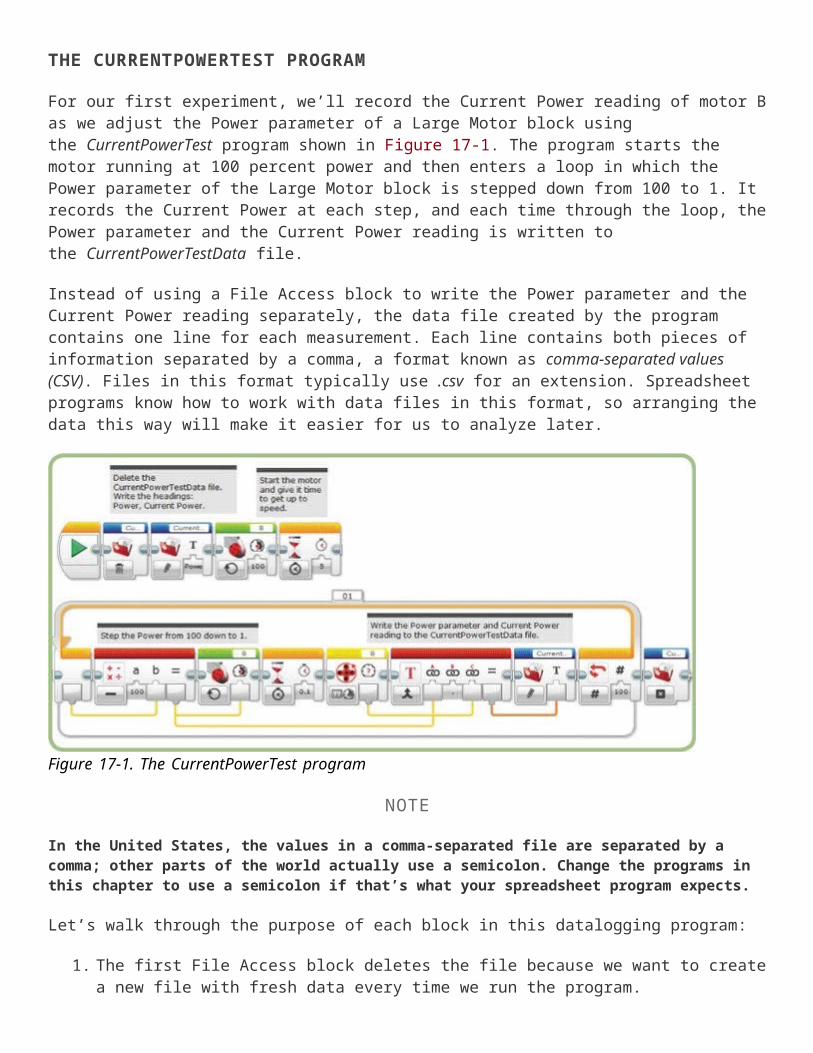
Figure 17-1. The CurrentPowerTest program
NOTE
In the United States, the values in a comma-separated file are separated by a comma; other parts of the world actually use a semicolon. Change the programs in this chapter to use a semicolon if that’s what your spreadsheet program expects.
Let’s walk through the purpose of each block in this datalogging program:
1. The first File Access block deletes the file because we want to create a new file with fresh data every time we run the program.
2. The second File Access block writes “Power, Current Power” to the file, to serve as headings for the data.
3. The Large Motor block uses On mode to start motor B running at 100 percent power.
4. The Wait block pauses the program for five seconds to give the motor time to accelerate to full power.
5. The Loop block repeats 100 times, one time for each Power parameter from 100 down to 1.
6. The Math block computes the Power parameter by subtracting the Loop Index from 100. The first time through the loop, the result is 100; the next time, it’s 99; and so on. The last time through the loop, the Loop Index will be 99, and the Power parameter will be 1.
7. The result of the Math block is passed to the Large Motor block to change the Power parameter.
8. The Wait block gives a small pause to allow the motor to slow down to the new Power parameter.9. The Motor Rotation block uses Measure - Current Power mode to read the Current Power value and
put it on the data wire.
10. The Text block combines the Power parameter used by the Large Motor block and the value read by the Motor Rotation block and separates the two values with a comma (,).
11. The File Access block writes the value from the Text block to the CurrentPowerTestData file.12. The final block closes the CurrentPowerTestData file.
When you run the program, motor B starts moving at full speed. After five seconds, it slowly ramps down and stops when the program ends, after about 10 seconds. At that point, there should be a file on the EV3 named CurrentPowerTestData.rbt that contains the data from this experiment.

Use the Memory Browser (Tools▸Memory Browser from the menu) to upload the file from your EV3 to your computer. Before you save the file, change the extension to .csv so that your text editor or spreadsheet program recognizes the format. It’s also a good idea to add a number to the end of the filename so that you can keep data from individual runs of the program (Figure 17-2).
Figure 17-2. Saving the data file
You can open the file in a text editor, word processor, or spreadsheet program. I prefer to use a spreadsheet (such as OpenOffice.org Calc or Microsoft Excel) to analyze data so I can look at the raw numbers and easily create graphs. Table 17-1 shows how the two headings and first 10 measurements should look in a spreadsheet program (the measurement number corresponds to the spreadsheet’s row number). The Power parameter starts at 100 and decreases by 1, as expected. The Current Power starts at 76 and stays pretty constant for these first 10 measurements.
Table 17-1. the current power for the first 10 power parameter measurementsMeasurement # power Current power
1 100 76
2 99 77
3 98 76
4 97 74

Measurement # power Current power
5 96 75
6 95 76
7 94 77
8 93 75
9 92 75
10 91 76
Scrolling down the file to where the Power parameter is 50, I see that here, the Current Power reading more closely matches the Power parameter, as shown in Table 17-2.
When you look at a graph of the entire data set (in Figure 17-3), you should get a better sense of how the Power parameter and the Current Power reading are related.
Table 17-2. the current power measurements from power parameters 53 through 44Measurement # power Current power
49 53 54
50 52 53
51 51 52
52 50 52
53 49 49
54 48 47
55 47 47
56 46 47
57 45 46
58 44 45

Figure 17-3. Graph of the Power parameter and Current Power reading
From this graph, I can see that when the Power parameter is below 70, the Current Power reading closely matches it. The two values aren’t always exactly the same, which is why the graph shows a little wiggle rather than a straight line, but they’re also never more than one apart.
The Current Power reading tops out when the Power parameter is about 75 and stays there for higher Power parameters. It turns out that the maximum value of 75 is specific to a particular motor. If I use motor C instead, I get a similar set of data, but with a maximum at 78. Other motors also give slightly different values, all in about the same range.
We’ll explore the relationship between the Current Power and the Power parameter further, using the Rotation Sensor to measure how fast the motor is moving at different Power settings, and relate that to the Current Power reading. To make doing this easier, we’ll build the LogData My Block to assemble several values into a comma-separated list and write them to a file.
THE LOGDATA MY BLOCK
The CurrentPowerTest program (see Figure 17-1) uses a Text block to join the Power parameter and Current Power reading values, separated by a comma. Combining three values together and separating them by commas requires two Text blocks, and each additional value requires another Text block. This code for data formatting can quickly become large, making the program’s logic more difficult to see. Creating the LogData My Block stops formatting code from cluttering the main program.
This block also writes the formatted data to a file and adds a timestamp to each value, using a Timer block, to indicate when the measurement was recorded. Timestamps are useful in experiments where time is an important factor, and timestamping the data can also help you identify any odd pauses or other timing issues in the program.
Figure 17-4 shows the LogData My Block, which combines a timestamp and up to four Text values. Most values are numbers, but I used Text parameters so that I can use this block to write the headings as well. Here’s how this My Block works:
1. The number of the timer to use is passed in on a data wire. The Timer block reads the appropriate timer and passes this value to the first Text block.

2. The first Text block combines the timestamp from the Timer block with one Input parameter, separating them by a comma.
3. The following three Text blocks each take the value from the previous Text block and add a comma and one Input parameter.
4. The final block writes the formatted data to the file whose name is passed in to the My Block as an Input parameter.
The My Block Building window doesn’t show which parameter is connected to which block, but you can simply set the name and icon for each parameter, from left to right, and move the Numeric parameter to the left or right as needed. (The order doesn’t really matter.) Then, after the My Block is created, you can move the data wires around so that each Input parameter goes to the correct block.
THE CURRENTPOWERTEST2 PROGRAM
The CurrentPowerTest2 program, shown in Figure 17-5, is based on the CurrentPower program and adds a new measurement. Each time through the loop, after changing the Power parameter, the program reads the Rotation Sensor, pauses for one second, and reads the Rotation Sensor again. The difference between the current reading and the previous one will tell us how far the motor has moved during that one-second pause, giving us the average speed in degrees per second. The Current Power reading for the motor is also logged, so once all the data is collected, we’ll be able to see the relationship between the Current Power reading and the motor’s actual speed.
Figure 17-4. The Logdata My Block
The LogData My Block at the beginning of the program writes the headings to the CurrentPowerTestData file, and the one in the Loop block writes the Power parameter, Current Power reading, and the computed speed.
This program takes about 100 seconds longer to run because of the one-second pause between the Rotation Sensor readings. After the program completes, copy the CurrentPowerTestData file to your computer and examine the data.
Table 17-3 shows the data from my test when the Power parameter is near 100 and when it’s near 50. The speed is about 10 times the Current Power reading because the Current Power is in fact the speed of the motor measured in degrees per one-tenth of a second!
Table 17-3. data from the currentpowertest2 program

power Current power
100 79 803

power Current power
99 80 801
98 79 803
97 79 801
96 79 803
95 79 799
94 78 802
93 79 800
92 78 802
... ... ...
50 51 510
49 48 498
48 48 490
47 47 481
46 47 470
45 44 460
44 43 450
43 43 438
42 42 430
41 41 420
40 40 408
39 39 400
NOTE
The Current Power and Speed values in Table 17-3 don’t differ by exactly a factor of 10 because the pause between Rotation Sensor readings is actually a little longer than a second, which increases the calculated average speed value by just a little. Also, the EV3 constantly adjusts the motor’s speed to keep it moving at the correct rate.

We could get a more accurate measure of the time between the two Rotation Sensor readings by using Timer blocks to record the time before taking each measurement and then taking the difference between the two timer readings. For the purposes of this program, the simple approach is sufficient.
This data tells us that setting the Power parameter of a Large Motor block to 10 will turn the motor at a rate of 100 degrees per second, and a setting of 50 will turn the motor at a rate of 500 degrees per second. This relationship holds until the Power parameter is about 75; at this point, higher Power values don’t move the motor any faster—a condition known as saturation. So in practice there’s no difference between setting the Power parameter to 80 or 100—both settings make the motor go about 750 degrees per second.
So why doesn’t the motor go as fast as you tell it to? The EV3 was actually designed to act this way, which I think is a good decision. Let’s say that with the motor used by the EV3 and the expected battery power, the LEGO engineers could guarantee that every motor could move at 700 degrees per second. They could design the system so that the Power parameter of 100 translated to a speed of 700 degrees per second, effectively making the relationship between the Power parameter and the speed a factor of 7 instead of 10.
This would preserve the relationship between the Power parameter and the motor’s speed throughout the Power parameter’s range, but you wouldn’t be able to make some motors go as fast as possible. The maximum speed you could specify would be 700 degrees per second, and we know that the motors can actually go a little faster. The system’s actual design allows us to get all the speed we can out of a motor, at the expense of losing the relationship between the Power parameter and the motor speed at the higher end of the spectrum.
CHALLENGE 17-1
Run the CurrentPowerTest2 program using the Medium motor to see how the Power parameter, Current Power reading, and actual motor speed are related for that motor. Replace the program’s Large Motor blocks with Medium Motor blocks, and change the Port setting on the three Motor Rotation blocks to match. You’ll also need to remove the motor from the Lift Arm, or at least disengage the gears.

Figure 17-5. The CurrentPowerTest2 program
TESTING THE CURRENT POWER WITH THE MOVE STEERING BLOCK
The CurrentPowerTest program used the Large Motor block to determine the relationship between the Power parameter and the Current Power reading, which revealed how the Power parameter relates to the actual speed of the motor. But in most programs, we actually use the Move Steering block. Does that block hold to the same relationship?
Testing this is just a matter of replacing the two Large Motor blocks with Move Steering blocks and running the program again. Figure 17-6 shows the graph of the data from my test. Below a Power value of 70, the graph shows the same relationship we saw using the Large Motor block. Above 70, there is more variation than the previous tests showed. This happens because the EV3 is trying to keep the two motors moving at the same speed, which is difficult at the top end of a motor’s maximum speed.

Figure 17-6. Power parameter versus Current Power reading with the Move Steering block
the SteeringTest program
The next program, SteeringTest (Figure 17-7), examines the relationship between the Move Steering block’s Steering parameter and the speed of the two motors. SteeringTest first deletes the SteeringTestData file and then re-creates it, writing “Steering, Motor B, Motor C” on the first line as column headings. The program then starts the motors moving with the Steering parameter set to 0. Inside the Loop block, the Steering parameter is stepped up from 0 to 100 for a total of 101 steps because we want to include the values at both ends. At each step, the LogData My block records the Steering value and the Current Power readings from the two motors. The Power parameter for the Move Steering blocks is set to 50, so we are well within the range where the Power parameter should map directly to the Current Power reading.
Run this program, and both motors will spin for about 15 seconds. After the program completes, you should be able to upload the SteeringTestData file from the EV3 to your computer.
Figure 17-8 shows a graph of the data. The Current Power for motor B essentially stays constant at about 50 (the measurements vary between 49 and 51). The Current Power for motor C starts at 50 and decreases to -50 as the Steering parameter increases from 0 to 100.
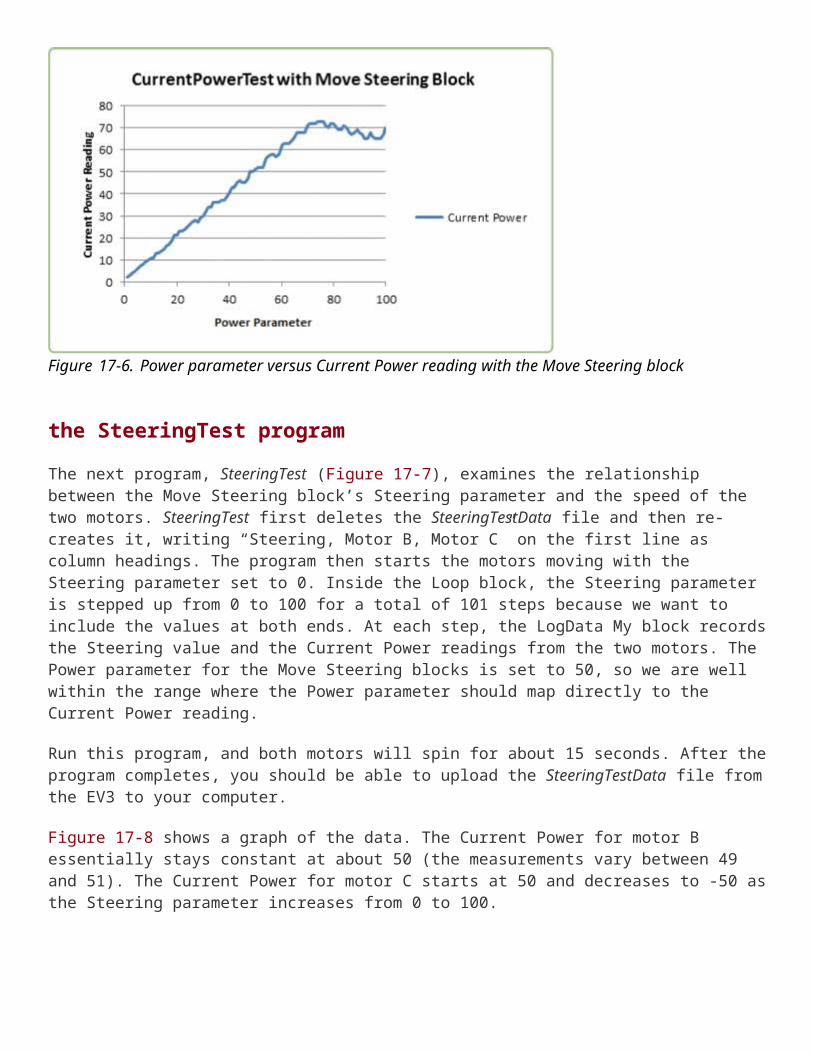
Figure 17-7. The SteeringTest program
Figure 17-8. The Current Power readings versus the Steering parameter
When the Steering parameter is 0, both motors have a Current Power reading of 50, which makes sense because this Steering value should make the robot move in a straight line. As the Steering parameter increases, motor C slows down, which causes the robot to turn.
When the Steering parameter is at 50, the Current Power of motor C is 0, which means it’s not moving at all. With this Steering value, the motor C wheel stays still, but the motor B wheel keeps moving forward, which spins the robot in place around a point centered on the motor C wheel. With the Steering parameter at 100, motor C has a Current Power of -50, so it moves just as fast as motor B but in the opposite direction. This makes the robot spin around a point centered between the two wheels. Any Steering parameter between 50 and 100 causes the robot to spin; the only difference is the point the robot spins around.

Figure 17-9. The VerifyLightPointer program
If you want your robot to keep moving forward as it turns, the Steering value should always be less than 50. Although the range of one side of the Steering parameter is 0 to 100, the useful range when moving forward is really between 0 and about 40. When turning in the other direction, use values between 0 and -40. A value above 40 (or below -40) will make the robot spin or move in a very small circle.
the VerifyLightpointer program
The LightPointer program presented in Chapter 11 uses the Color Sensor to point the TriBot toward a light source. The TriBot spins in a circle and remembers the position where it detected the brightest light level. After completing a full circle, the TriBot returns to the stored position, which should point it toward the light source.
The LightPointer program assumes that the sensor can actually detect the brightest light level while the TriBot is spinning. If this assumption is wrong, the program won’t work. For example, the program fails if the robot spins too fast to accurately read the light level or if there is too much ambient light in the room for it to locate the direction of the light source. You can verify this assumption by collecting and analyzing the data from the sensor in an experiment. The VerifyLightPointer program shown in Figure 17-9 collects the data.
This program is a combination of the LightPointer program and the data-logging programs. First the VerifyLightPointerData file is deleted, and then the LogData block is used to write the column headings for the .csv file: “Motor C” and “Light.” The Rotation Sensor for motor C is reset and then the TriBot starts spinning slowly. Inside the loop, the ambient light reading from the Color Sensor and the position of motor C are written to the file. The loop repeats until the position of motor C reaches a position of 900 degrees (set this value to 700 degrees for the Education Edition). The last block closes the VerfiyLightPointer-Data file.
Position the TriBot and a light as shown in Figure 17-10, with the light 90 degrees to the left of the robot, and run the program. The TriBot should slowly spin in a circle and then stop. After the program completes, you should be able to upload the VerifyLightPointerData file to your computer and examine the Color Sensor and Rotation Sensor readings.

Figure 17-10. The starting position for the VerifyLightPointer program
Figure 17-11 shows a graph of the measurements taken during my test run. The light level increases significantly as the robot turns toward the flashlight and forms a single large peak. The numerical data (Table 17-4) shows that motor C only moves about 1 degree between each Color Sensor reading. Because the motor has to move about 840 degrees to complete a full circle, the TriBot actually rotates very little between each reading, so the chance of the sensor moving past the light without seeing it is very small.
Figure 17-11. The ambient light detected at motor C positionsTable 17-4. rotation sensor readingMotor C Light
2 6

Motor C Light
3 6
3 4
4 6
5 6
5 5
6 5
7 5
7 5
9 6
9 6
10 6
Based on this data, it seems that the LightPointer program should be able to correctly identify the direction of the light source. If the data had shown only small variations as the robot moved, or showed several peaks, then I’d be less confident that the LightPointer program would work correctly.
controlling the amount of data
The VerifyLightPointer program collects and records data as fast as possible, creating a large data file in a short amount of time, but for most data-logging programs, you’ll want more control over how often the program records data.
Many data-logging programs will be structured like the VerifyLightPointer program. After some blocks perform the initial setup, a Loop block will contain the code to collect the data and write it to a file. You can control how often the data is recorded by adding a Wait block at the end of the body of the Loop block.
How long should the Wait block pause? That depends on how long you expect the experiment to take and how often the data you’re collecting changes. You need to record the data often enough that you don’t miss any important changes, but not so often that you end up with huge data files or run out of memory. Finding the right balance often involves some trial and error, so don’t be surprised if you need to change the settings a few times to get them just right.
For example, say you decide to change the VerifyLightPoint program so that it takes 20 measurements per second. To do this, you’d add a pause at the end of the Loop block to wait for one twentieth of a second, or 0.05 seconds. Figure 17-12 shows the Wait block added to the program’s main loop.

Now the program will pause for 0.05 seconds each time through the loop, which means that the data will be recorded at a rate of approximately 20 readings per second. There may not be exactly 20 readings per second because it takes time to control the motors, collect the readings from the sensors, and write the data.
CHALLENGE 17-2
The VerifyLightProgram collects sufficient data to identify the direction of the light, represented in the graph by the large peak, because the TriBot is rotating very slowly. Change the Power parameter on the Move Steering block from 20 to 40, and rerun the test to see how much difference that makes. How fast can you make the TriBot spin and still have the graph show a discernable peak?
Figure 17-12. Waiting for 0.05 seconds
further exploration
Here are some more activities involving data logging:
1. Create an experiment to show how the Infrared Sensor Proximity reading (from the Home Edition) or Ultrasonic Sensor distance reading (from the Education Edition) changes as the TriBot moves away from an object. Use the position of one of the motors to gauge the true distance from the object. Start very close and have the TriBot slowly back away. Try this with objects of varying colors and textures (for example, a solid wall and a hanging towel may give different results).
The reading from the Ultrasonic Sensor is a true measurement of distance, so it should track directly with the motor rotation until the point where the sensor stops detecting the object.
2. Write a program that determines how the Ultrasonic Remote’s Beacon Heading measurement changes as the angle between the TriBot and the Remote changes. Start with the Remote in front of the robot, and record the Beacon Heading as the robot spins in a circle (this is similar to the VerifyLightPointer program).
3. Using the Gyro Sensor’s Measure Rate mode, which measures rotation in degrees per second, write a program that helps you to determine how the Power parameter of a Move Steering block relates to the TriBot’s rotational speed when spinning (with the Steering parameter set to 100). First, collect data at a slow speed. Then increase the speed to see if the relationship holds and if there’s a point at which the TriBot moves too fast to get reliable data from the Gyro Sensor.
conclusion

The EV3 can collect, format, and record data from a variety of sensors, making it a great data logger, and the examples presented in this chapter contain all the steps you’ll need in a typical data-logging program. These include creating the data file, collecting sensor data, writing the data to the file with a timestamp, and even controlling the rate of the data collection.
Data logging can help you learn more about the EV3 motors and sensors. For example, the CurrentPowerTest program helped uncover the mystery of the Motor Rotation block’s Current Power reading and helped you learn what the Move block’s Power parameter really does. The closely related MoveSteeringTest program collected data that showed how the Steering parameter affects the robot’s motion and what range of values is most useful. The VerifyLightPoint program used data logging to prove, based on experimental data, that the LightPointer program will work as expected.
You can also use your EV3 sensors at home or in a science class for experiments that have nothing to do with robotics! You could use the Color Sensor to compare the brightness of different brands of light bulbs or use the Rotation Sensor to measure area and volume.
For even more experimentation possibilities, get the Temperature Sensor from LEGO Education (http://www.legoeducation.com/) or one of the many EV3-compatible sensors from HiTechnic (http://www.hitechnic.com/), Mindsensors (http://www.mindsensors.com/), or Vernier (http://www.vernier.com/).