· Web viewAssociation of Pennsylvania University Business and Economics Faculties 2003 Fall...
118
APUBEF Proceedings (October 2003) APUBEF Association of Pennsylvania University Business and Economics Faculties 2003 Fall Proceedings Edited by: 1
-
Upload
truongnhan -
Category
Documents
-
view
217 -
download
2
Transcript of · Web viewAssociation of Pennsylvania University Business and Economics Faculties 2003 Fall...

APUBEF Proceedings (October 2003)
APUBEFAssociation of Pennsylvania University
Business and Economics Faculties
2003 Fall Proceedings
Edited by:
Jerry BelloitClarion University of Pennsylvania
1

APUBEF Proceedings (October 2003)
Association ofPennsylvania UniversityBusiness & Economics
Faculties(APUBEF)
Twenty-Sixth Annual ConferenceOctober 9-10, 2003
Days Inn240 South Pugh Street
State College, PA
Editor
Jerry BelloitClarion University
Program Chair
Jonathan Peters City University of New York – Staten Island
The in-kind and financial contributions of Clarion University of Pennsylvania in the publication of this document are gratefully acknowledged.
2

APUBEF Proceedings (October 2003)
Association of Pennsylvania UniversityBusiness & Economics Faculties
Officers
PresidentNorman C. SigmondKutztown University
Vice-President Membership Vice-President Programs Nora Palugod Jonathan Peters
Secretary Treasurer Able Ghods Arshad Chawdhry
APUBEF has been formed for the purpose of:
(1) Fostering economic and business scholarship and fellowship among business and economic faculties in the State System of Higher Education in Pennsylvania and other colleges of business throughout Pennsylvania.
(2) Speaking publicly and objectively on behalf of the economic and business conditions in Pennsylvania and acting as a spokesperson for the condition of economic and business education in Pennsylvania.
(3) Encouraging freedom of economic and business discussion.
(4) Fostering professional development of faculties, by encouraging them to engage in research and submitting papers for presentation to the annual meetings of the Association. Selected referred papers will be published in the Pennsylvania Journal of Business and Economics, which is a broad-based forum to present scholarly research and views on a variety of business and economic topics.
3

APUBEF Proceedings (October 2003)
Associationof
PennsylvaniaUniversityBusiness
AndEconomicFaculty
(APUBEF)
26th Annual MeetingOctober 9-10, 2003
Days Inn240 South Pugh St.
State College, PA 16801
4

APUBEF Proceedings (October 2003)
(814) 238 - 8454
TABLE OF CONTENTS
Personality: What It Takes To Be An AccountantWilliam E. Bealing, Jr., Richard L. Baker and Charles J. Russo.........................................1
Distance Education-Fad or Paradigm Shift?Jerry Belloit..........................................................................................................................7
How Immaterial is Immaterial? A Pilot StudyGregory P. Cermignano, Joseph M. Hargadon and David Contarino...............................12
History Repeating Itself: The Debate Over Accounting For Stock OptionsMichael P. Coyne...............................................................................................................22
AWARDED THE APUBEF 2003 BEST PAPER
Housing The Elderly: Prospects and ChallengesAbbas Mamoozadeh and Jerry Belloit...............................................................................36
Crazy Eddie (Revised)Duane Ponko, Germain P. Kline and Jerry Joseph............................................................41
Pennsylvania Journal of Business and Economics: Developments and DirectionKevin J. Roth.....................................................................................................................45
Transformation of Supply Chain Management Challenges Into Business OpportunitiesGermaine H. Saad..............................................................................................................54
Implementation Of A Paralegal Distance Education Program: Opportunities and ChallengesFrank Shepard and Jerry Belloit........................................................................................63
Active Teaching/Active Learning in EconomicsEdward J. Sullivan.............................................................................................................70
Environmental Insurance BasicsStephen D. Willits..............................................................................................................74
5
APUBEF Proceedings (October 2003) 6

APUBEF Proceedings (October 2003)
PERSONALITY: WHAT IT TAKES TO BE AN ACCOUNTANT
William E. Bealing, Jr.Bloomsburg University
andRichard L. Baker
Bloomsburg Universityand
Charles J. RussoBloomsburg University
ABSTRACT
It is widely accepted that individuals may possess inherent abilities such as musical talent or artistic ability. These innate qualities, although not a guarantee of success, provide individuals who possess such natural abilities with a unique advantage to succeed within the related discipline. Why should such natural skills be limited to "right brain" types of activities? This study examines the issues surrounding the possible existence of an "accounting ability". It then presents the results of an on-going research program being conducted at one medium sized, state university in Pennsylvania.
7

APUBEF Proceedings (October 2003)
INTRODUCTION
Educators have long acknowledged the existence of a multitude of learning styles among students. Researchers, such as Jackson and Lawty-Jones (1996) and Honey and Mumford (1992) have also linked learning styles to a student's personality. However, Loo (2002) points out that learning styles and personality are not the same constructs. While a large body of research exists on the subject of student learning styles and academic performance, a lesser body of knowledge exists in the area of a student's personality type and their classroom performance. This study extends the body of knowledge by specifically examining the issue of student personality type and its relationship to performance in accounting courses. Implications for student recruiting and retention in the discipline of accounting are also presented.
BACKGROUND AND LITERATURE REVIEW
Research into the area of learning styles has been ongoing for many years which has resulted in the development of over twenty different currently available models (Curry, 1983, Riding and Cheema, 1991, Hayes and Allinson, 1996). One model that has attracted the interest of researchers and has been applied in a number of settings is Kolb's (1984) experiential learning model (ELM). The ELM model, based on Jung's earlier work on learning types, categorizes individuals by placing individuals along two independent dimensions: the "Active Experimentation-Reflective Observation" processing dimension and the "Concrete Experience-Abstract Conceptualization" perceiving dimension. As seen in Figure 1, the two dimensions result in four quadrants
Figure 1
Kolb’s two-dimensional learning model and four learning styles (Loo, 2002)
that contain the four learning styles of: Accommodator, Diverger, Assimilator, and Converger.
According to Loo (2002), the four learning styles are associated with the extremes of the dimensions. The "Feeling" type is associated with concrete experience, while the "Thinking" type associates with the abstract conceptualization end of the perceiving dimension. A "Doing" type corresponds with active experimentation, while a "Watching" type corresponds with the reflective observation end of the processing dimension.
Several researchers have applied Kolb's model with mixed findings. Baker, et al. (1986) examined Accounting majors and found that the most common learning style was that of a converger. However, in a larger study involving 267 Accounting majors, Brown and Burke (1987) found that Accounting majors exhibited no distinct preference in learning style and tended to fall in the middle of the grid. Holley and Jenkins (1993) looked at the grades of intermediate accounting students and their learning styles. They found that a majority of the students could be characterized as assimilators. Loo (2002) examined a sub-sample of 109 Accounting majors and also found a significant number of assimilators.
8

APUBEF Proceedings (October 2003)
However, as demonstrated by Kolb (1984), factors other than learning style, such as intellectual ability and the aptitude of the students, also impact the learning process and Jackson and Lawty-Jones (1996) indicate that, while not the same construct as learning style, personality shares some common underlying characteristics.
This study attempts to link personality type with academic performance in an individual academic discipline; specifically, accounting. Personality types have historically been associated with certain aptitudes. Musical or artistic aptitudes are almost universally acknowledged to exist. One often hears the statement, "oh, that person is just naturally musically inclined". If there are individuals who are musically inclined, why shouldn't there be individuals who are "accounting inclined"?
The AICPA Core Competency Framework for Entry into the Accounting Profession (1999) promotes a list of "personal competencies" as one of three major categories of competencies required for students to successfully enter the accounting profession. Apparently, even the oversight organization for the accounting profession acknowledges that certain personality types should be attracted to and/or do well in the field of accounting.
Much of the previous research into the link between personality type and accounting has been based on the Myers-Briggs Type Indicator (MBTI). This is a formal preferences based survey instrument consisting of over 120 questions designed to access an individual's personality preferences in four primary areas: introvert/extrovert, sensing/intuitive, thinking/feeling, and judging/perceiving. The theory is that every individual has a predisposed preference to one of each of the above pairs. Thus, there is a potential of sixteen (four squared) individual personality types and, theoretically, each individual can be categorized as one of those types.
Wheeler (2001) found 16 published accounting research articles using the MBTI. Of the 16 articles, four examined the issue of performance of accounting students and their indicated MBTI personality type. Specifically, Ott, et al. (1990) found that S-preferred (sensing) and T-preferred (thinking) individuals performed better (in terms of course grade) in courses using the lecture method.
Nourayi and Cherry (1993) examined student performance in seven accounting courses in their MBTI research. The only significant relationship found was that S-preferred (sensing) students outperformed I-Preferred (intuitive) in three (Tax, Auditing and Intermediate II) of the seven courses analyzed in their study.
While not examining the linkage between personality type and course grade, Landry et al. (1996) focused on computer usage and MBTI personality. They found that the STJ-preference (sensing, thinking, judging) personality type was over represented, comprising 42% of the entire sample, with ISTJ (introverted STJ's) comprising 17% and ESTJ (extroverted STJ's) comprising 25% of the accounting students, respectively.
Oswick and Barber (1998) examined the MBTI personality preferences of undergraduate non-accounting majors and contrasted them to their performance in an introductory accounting course, as measured by course grades. They found that there were no statistically significant correlations between indicated personality preference and performance.
Keirsey and Bates (1978) developed an independent personality preferences test that categorizes individuals into the same 16 personality types as the MBTI. Since its inception, the Keirsey Temperament Sorter (KTS) has grown to become the most widely used personality inventory measuring tool in the world surpassing even the MBTI instrument.
The authors have chosen to use the KTS instrument in their research for several reasons. First, the 16 resulting personality classifications used by the KTS instrument correspond directly to those of the MBTI used in previous studies conducted in the field. Second, it can easily be administered and scored by the average accounting faculty member in approximately twenty minutes. In addition, the authors have access to the individual responses to each question, not just the overall personality type score which facilitates more detailed analysis of the results. Finally, the cost of administering the MBTI to several hundred students proved to be prohibitive while the cost of administering the KTS falls within the researchers budget constraints.
METHODOLOGY
9

APUBEF Proceedings (October 2003)
In their initial research, the authors administered the KTS instrument to 56 freshmen accounting majors enrolled in the initial Principles of Accounting course at their university, 54 business majors enrolled in the basic financial accounting course for non-accounting majors, as well as 27 sophomore accounting majors enrolled in Intermediate Accounting I. In order to motivate the students to conscientiously complete the survey, it was administered during a normal class period. In addition, the students were informed that they could have access to their individual personality profiles, as well as a copy of a common careers list for each personality type, by contacting the faculty member who administered the survey instrument.
The research was pre-approved by the University's Institutional Review Board and the students were informed that, although their individual results would remain strictly confidential, aggregated results of the research would be included in various future research findings made public by the authors.
RESULTS
A quick tabulation of the responses shown in Table 1, revealed that the ESTJ profile is the dominant "accounting type" (26.23%) for the accounting majors tested. This mirrors the results of Landry, et al. (1996) who reported that 25% of the accounting majors in their sample displayed an ESTJ profile. This is remarkable when you consider that if the sixteen personality profiles were randomly distributed, each type should occur only approximately 6% of the time.
It appears that one of three things is happening:
1) There is a self selection bias at work2) There is a "survival characteristic" at work3) A combination of 1) and 2) above
The idea of a self selection bias is appealing. It could be a case of students with the ESTJ profile having a natural interest in subjects, such as accounting. In fact, a U.S. Department of the Interior (2002) website provides a list of "...careers and jobs people of various types enjoy doing." Listed under ESTJ are jobs such as, auditor, credit analyst and budget analyst.
TABLE 1PERSONALITY TYPES
OF ACCOUNTING MAJORS
TYPE FREQ PERCENT CUMULATIVE PERCENT
ENFJ 5 8.20 8.20ENFP 2 3.28 11.48ENTH 1 1.64 13.11ESFJ 9 14.75 27.87ESFP 3 4.92 32.79ESTJ 16 26.23 59.02INFJ 3 4.92 63.93INFP 1 1.64 65.57INTJ 1 1.64 67.21INTP 2 3.28 70.49ISFJ 9 14.75 85.25ISFP 2 3.28 88.52ISTJ 7 11.48 100.00
10

APUBEF Proceedings (October 2003)
A second possible explanation is that the ESTJ profile provides the student with some sort of "Darwinian survival characteristic". The person with this profile may have some sort of advantage when doing the tasks required of a student who maj ors in the field of accounting. This may take the form of a special insight into analyzing problems or simply an "accounting mindset". This could be a predisposition to quantitative study on the part of the student, a characteristic which they already bring with them to college. Or, a second possibility is that this profile may be the result of "imprinting" by the faculty who the students are initially exposed to; thus, a learned survival trait.
In order to explore this possibility, the data for accounting majors was broken down by their class standing. (See Table 2) It appears that the incoming freshman accounting majors already possess the ESTJ profile and that it is not a learned characteristic.
TABLE 2ACCOUNTING MAJOR TYPE
BY CLASS STANDING
CLASS RANK TOTALNUMBER
ESTJ PERCENT
FRESHMAN 32 8 25%SOPHOMORE 3 0 0%
JUNIOR 19 8 42%SENIOR 7 0 0%TOTAL 61 16 26%
NON-ACCOUNTING MAJOR TYPEBY CLASS STANDING
CLASS RANK TOTAL NUMBER
ESTJ PERCENT
FRESHMAN 14 3 21 %SOPHOMORE 38 9 24%
JUNIOR 21 5 24%SENIOR 3 0 0%TOTAL 76 17 22%
Further analysis of Table 2 reveals that 16 out of 61 accounting majors are ESTJs (26.3%) while 17 out of 76 (22.4%) of the non-accounting majors possess the same personality type. In fact, the ESTJ profile was the dominant personality profile for all business majors, with 34 (24.8%) out of the 137 students who completed the KTS instrument identifying with it.
This finding is consistent with Brightman (2002) who reports that the most common personality type for undergraduate business majors is ESTJ. While not providing the specific percentage of business students in his studies who are ESTJs, Brightman does report the following breakdown for the four dimensions of personality:
1) Over 65% of business students are extraverts (E)2) Over 65% of business students are sensing (S)3) Over 70% of business students are thinking (T)4) Over 70% of business students are judging (J)
11

APUBEF Proceedings (October 2003)
These results mirror the findings of Shackleton (1980) who reported that the "...STJ personality is the most common in the world of business and commerce, not just in accounting."
However, several studies have reported that the dominant characteristic of practicing CPAs is ISTJ (Kreiser, et al., 1990; Shackleton, 1980; Jacoby, 1981). It could be that the ISTJ student is most likely to graduate with a degree in Accounting, enter the field of public accounting, and pass the CPA Exam. This, as well as the classroom performance of ISTJ's, in relation to other personality types, in various accounting courses, are issues for future research.
Wolk and Nikolai (1997) went on to compare the personality types of undergraduate accounting students, graduate accounting students, and accounting faculty. They found that undergraduates were significantly different from either graduates or faculty and were more likely to be ESTJs.
Prompted by these findings, the authors conducted an informal survey of the full-time, tenure track, faculty at their university. Six out of eight eligible faculty participated. The results indicated that all six were STJs.
Because the authors had access to the individual answers to each specific question on the KYS instrument, they were able to do a detailed analysis of the faculty responses. Not only were all the faculty surveyed STJs, five out of six registered "extremely strong" STJ characteristics as evidenced by the fact that 90-100% of all the individual responses to questions about a particular type indicated a preference for that profile.
IMPLICATIONS
It appears that the faculty, in this instance, possess the same profile as the largest concentration within the group of undergraduate business students examined. This could be due to the fact that the emphasis at the university is on teaching. The vast majority of the faculty spent time as practicing CPAs before obtaining their Ph.D.'s and therefore, would be expected to have a profile similar to a practicing accountant.
This finding may not hold true for a large, research oriented university. Many of their faculty may not have spent time in public accounting and may, in fact, not be CPAs or even have an undergraduate degree in accounting. The fact that, in this instance, the dominant personality type of the accounting faculty and the undergraduate students examined is the same may enable the students to more easily grasp the material that is presented in class. The issue of the impact of the relationship between faculty and student personality types on student classroom performance needs to be examined in future research.
SUMMARY AND FUTURE RESEARCH
The idea of an "accounting ability" was examined. It was determined that the dominant type for an undergraduate accounting student was ESTJ. However, it was also noted that the dominant type for all business students was also ESTJ. The STJ profile of accounting students is very robust across numerous studies and leads to the issue of whether the profile is linked to superior performance in accounting classes. The similarities of personality types between undergraduate students and accounting faculty was also noted in this study. However, future research is needed to explore the impact of the relationship between faculty and student personality types on student classroom performance in accounting courses.
REFERENCES
American Institute of Certified Public Accountants (AICPA). The AICPA Core Competency Framework for Entry into the Accounting Profession, 1999. Available at: http://www.aicpa.org/edu/corecomp. htm.
Baker, R.E., J.R. Simon, and F.P. Bazeli, "An Assessment of the Learning Style Preferences of Accounting Majors," Issues in Accounting Education, Spring, 1986, pp. 1-12.
Brightman, H.J., "GSU Master Teacher Program: On Learning Styles", Online, Internet. January 15, 2002. Available:http://www.gsu.edu/–dschjb/wwwmbti.html.
12
APUBEF Proceedings (October 2003)
Brown, H.D. and R.C. Burke, "Accounting Education: A Learning-Styles Study of Professional-Technical and Future Adaptation Issues," Journal of Accounting Education, Vol. 3, 1987, pp. 187-206.
Curry, L., "A Critique of the Research on Learning Styles," Educational Leadership, Vol. 48, 1983, pp. 50-56.
Hayes, J., & C.W. Allinson, "The Implications of Learning Styles for Training and Development: A Discussion of the Matching Hypothesis," British Journal of Management, Vol. 7, 1996, pp. 63-73.
Holley, J.H., & E.K. Jenkins, "The Relationship Between Student Learning Style and Performance on Various Test Question Formats," Journal of Education for Business, Vol. 68, 1993, pp. 301-308.
Honey, P., & A. Mumford, The Manual of Learning Styles, 1992, Peter Honey, Maidenhead.
Jackson, C., & M. Lawty-Jones, "Explaining the Overlap Between personality and Learning Style," Personality and Individual Differences, Vol. 20, 1996, pp. 293-300.
Jacoby, P.F., "Psychological Types and Career Success in the Accounting Profession", Research in Psychological Type, Vol. 4, 1981, pp. 24-37.
Keirsey, D and M. Bates, Please Understand Me: Character &Temperament Types, Gnosology Books, Ltd., 1978.
Kolb, D.A., Experience as the Source of Learning and Development, Prentice-Hall, Englewood Cliffs, NJ, 1984.
Kreiser, L., McKeon, J.M., and Post, A., "A Personality Profile of CPAs in Public Practice", The Ohio CPA Journal, Winter, 1990. Landry, Jr. R.M., R.L. Rogers, and H.W. Harrell, "Computer Usage and Psychological Type Characteristics in Accounting Students," Journal of Accounting and Computers, 1996.
Loo, R., "The Distribution of Learning Styles and Types for Hard and Soft Business Majors," Educational Psychology, Vol. 22, No. 3, 2002, pp. 349-360.
Nourayi, M.M., and A.C. Cherry, "Accounting, Students" Performance and Personality Types," Journal of Education for Business, November/December, 1993, pp. 111-115.
Oswick, C. and P. Barber, "Personality Type and Performance in an Introductory Level Accounting Course: A Research Note," Accounting Education, Vol. 7 (3), 1998, pp. 249-254.
Ott, R.L., M.H. Mann, and C.T. Moores, "An Empirical Investigation into the Interactive Effects of Students Personality Traits and Method of Instruction (Lecture or CAI) on Student Performance in Elementary Accounting," Journal of Accounting Education, Vol. 8, 1990, pp. 17-35.
Riding, R., & I. Cheema, "Cognitive Styles-An Overview and Integration," Educational Psychology, Vol. 11, 1991, pp. 193-215.
Shackleton, "The Accountant Stereotype: Myth or Reality?", Accountancy, November 1980, pp. 122-123.
U.S. Department of the Interior, "Connecting Personality Types with Careers and Jobs", Online, Internet. November 27, 2002. Available: http://www.doi.gov/octc/typescar.html.
Wheeler, P., "The Myers-Briggs Type Indicator and Applications to Accounting Education and Research," Issues in Accounting Education, Vol. 16, No. 1, 2001, 125-150.
Wolk, C. and Nikolai, L.A., "Personality Types of Accounting Students and Faculty: Comparisons and Implications", Journal of Accounting Education, Vol. 15, No. 1, 1997, pp. 1-1
13

APUBEF Proceedings (October 2003)
DISTANCE EDUCATION—FAD OR PARADIGM SHIFT?
Jerry BelloitClarion University
ABSTRACT
This paper discusses the movement toward distance education and the impact of various technologies on the ability to deliver distance education. Political and economic pressures have also increased the implementation of distance educational opportunities by universities. In spite of the pressure to increase distance delivery of university coursework, distance education has some significant difficulties.
Within many of the Pennsylvania State System of Higher Education institutions, there has been a substantial, almost exponential, increase in the number of offerings of distance education opportunities either through Web based courses or Interactive Television. The system has also created a state-wide E-University, perhaps, in part, as competition with the explosive emergence of other web-based higher education institutions such as the University of Phoenix.
During the last two collective bargaining contract initiatives in the Pennsylvania State System of Higher Education, the topic of distance education has been and currently is a matter of lively discussion between management and labor. From the State System perspective, distance education offers opportunities for more efficient allocation of scare faculty resources (and thereby lowering costs). From the labor perspective, distance education presents a danger of increasing faculty load and reducing faculty positions at a given educational institution due to the ability to replace through attrition faculty members at one institution with distance delivery from faculty at other institutions. Beginning fall semester 2003, all State System institutions were required to adopt common calendars. The adoption of the common calendar removed a major obstacle from cross-institution distance education delivery since the classes will start and end at the same time. From the State System perspective, more distance delivery is expected.
With these prospects of increased distance educational opportunities, this paper will explore some of the issues surrounding distance education with a discussion of whether the trend is a fad or a paradigm shift. Some have even warned that distance education will ultimately lead to the demise of the traditional bricks and mortar educational institutions
as the cost effectiveness of distance delivery presses its comparative economic advantage.The Movement Toward Increased Distance Education Delivery
The delivery of quality education in America is a challenging enterprise. Taxpayers are increasingly concerned about the cost of a quality education at all levels, including secondary and post-secondary education levels. Distance education, the delivery of education where the instructor and the student are separated by space outside the classroom, and connected using computer-mediated means, has the potential for more efficient allocation of educational resources from one location to another. Distance education technologies including digital compressed video delivered over ISDN, Internet, or the ATM (Asynchronous Transmission Mode) lines, satellite, microwave, Internet web sites, e-mail, fax, videotape and traditional “snail” mail. These technologies offer exciting possibilities for increasing the quality and reducing the cost of distance education. Particularly exciting is the improved technology and access to the Internet, especially advances in the delivery of “live” audio and video that may be delivered over standard telephone lines with relatively inexpensive equipment.i
At a conference on distance education by the Pennsylvania Association of colleges and Universities, Dr. Thomas Head, of Virginia Tech suggested the following paradigm for classifying educational instructional delivery on the basis of time and location.
LOCATION
Same DifferentSame Traditional
ClassroomDistance Learning (synchronous)
14

APUBEF Proceedings (October 2003)
TIMEDifferent Computer Assisted
Instruction (asynchronous)
Virtual Classroom (asynchronous)
Same-time-same-location traditional classroom education has been the delivery system of choice at all levels of education. Different-time-different-location education has historically been in the form of correspondence courses delivered through mail services. Although asynchronous means of distance education have been used since the invention of the radio, it is only recently that computer technology has been used. Different - time - same - location, asynchronous delivery, has been limited primarily to a video tape media, used since the 1970's. Computer assisted instruction in elementary and secondary schools has been more recently used to augment traditional classroom instruction for the student. Same-time-different-location or synchronous delivery has primarily focused upon interactive systems using satellite, ISDN, ATM, microwave, or cable transmission of either two-way video or one-way video/two-way audio. Some institutions, like Oklahoma State University, have used some inexpensive Internet delivery systems. In recent years, there has been some interest in computer-directed virtual classrooms. Web based course software such as Blackboard has integrated the virtual classroom into its core application.
The bulk of the research on educational delivery systems suggests that the mode of delivery is not a critical element of quality educational outcomes.ii
Rather, the critical elements seem to be effective instructional design and instructional techniques. The traditional advantage of classroom delivery has been face-to-face contact with the student that allowed the student and teacher to establish a rapport that encouraged learning. Other modes of delivery generally were unable to establish this kind of rapport. With technologies now available, face-to-face contact can now be offered at a distance.
Studies of students of other delivery methods have suggested three critical needs for those who do not in the same location as the originating site:
1. Distance learners want and need rapid feedback.2. Distance learners need easy access to library resources3. Distance learners need local support.
All educational delivery systems to remote locations should consider these three needs.
A driving concern in alternative delivery systems of quality higher education is the interest in providing universal access. Traditionally, the question of access was focused more narrowly upon the economic ability of the parent to pay for tuition, books, housing, and board. Government programs and higher education institutional initiatives were directed primarily toward the residential, traditional student who was just out of high school. With the development of the community college system, more non-traditional students were attracted. However, the focus remained with in-class instruction at fixed times and locations, still not fully meeting the needs of their students. Some adjustment to evening and weekend classes was given. While the community college system did increase access, recent trends in higher education funding have made access more difficult. In addition, structural changes in the national economy have increased need for lifelong education. For those whose professions have become obsolete, retraining and re-education is needed. However, for those same people, the opportunity cost of returning to a campus setting is exceedingly high with family considerations being paramount. While one worker in the family may be occupationally displaced, the other worker is even less free to move to a different location to access educational services. In addition, increased child-care burdens increase with the loss in family income.
Although educational institutions, especially K-12 schools were early adopters of computer technology, they have failed to keep pace with individual personal computer users, and the corporate community. The fact that you can still find decrepit Apple II computers in classrooms is a pathetic indictment of an education system that needs drastic overhauling. Even more disturbing in this day and age is some classrooms have no computers. Much of this may and can change, though, because of one critical development: the Internet. Surfing the Web can become a common activity in schools, and should get the attention of those in the education establishment. If you browse the literature on computers in education, you will see a definite trend emerging; long-distance learning using computers. A 1993 nationwide survey of 550 elementary and secondary education teachers indicated a need for improved financial support for technology and access local area networks and dial-up services. iii
In the late 1990’s, Governor Tom Ridge of Pennsylvania unveiled a bold plan to bring all of Pennsylvania’s K-12 public schools into the computer age by allocating substantial budgetary resources for those schools. In addition, in a Project
15

APUBEF Proceedings (October 2003)
known as Link-to-Learn,iv substantial budgetary resources were allocated to universities, K-12 schools, libraries, and business to develop networks and infrastructure that would allow those participants to connect together through a network of networks called the Pennsylvania Educational Network (PEN).
As a result of the Link-to-Learn initiative, there has begun to be a paradigm shift in re-thinking of the role of technology in the classroom. Increasingly educational opportunities are becoming more accessible to not only K-12 programs but also to higher education and life-long learning programs.v
Consequently, there should be an increase in the demand for distance education programs.
The long-distance learning concept can be applied to bring education opportunities to the people in a widely spread geographic area such as northwestern Pennsylvania. Adult learners have increased difficulties accessing higher education resources due to family, job, and financial constraints. Financial issues include not only costs for books and tuition, but also costs of the commute (gas, and vehicle depreciation) and the opportunity costs associated with the commute. For example, a student who is forced to drive an hour each way to class forgoes the opportunity to spend those hours at work.
Finally, the last pressure on increasing the use of distance delivery of educational services is the economic costs associated with bricks and mortar. Distance delivery, especially web based distance delivery, allows substantial growth of the student population without incurring significant costs of additional property. Most of the costs associated with web-based distance education are sunken costs. The only marginal capital costs are those associated with providing additional servers or bandwidth. Even these are usually insignificant since most institutions operate with surplus band width and computer capacity.
The Case Against Increased Distance Education Delivery
As compelling as some of the reasons for the growth of distance education, there are also some potential problems. These problems may be generally classified as student-centered, technologically-centered, and/or instructionally-centered.
Among the student-oriented difficulties with distance education is that most distance delivery is heavily dependant upon technology. Some students are uncomfortable with the technology. In web based
courses, the student must be competent with the use of personal computers and the use of the Internet. While this is less of a problem with students of traditional college age, it is much more of a problem with returning adult students who may have little personal computer skills and have little experience with navigating the Internet. With the use of Interactive Television (ITV), some students are uncomfortable with talking on television or with using the “See me” buttons. For distance education to be effective with students with technology usage deficiencies, remedial training is important. This remedial training needs to be face-to-face.
Another student-oriented problem is that students in web course delivery or at distance sites in ITV delivery is the need for the student to be more motivated to assist in the own education than students in traditionally delivery. Since web courses are generally asynchronous, the students must discipline themselves by setting aside a time to work on the course. Unmotivated students are more likely to procrastinate and put off or never complete the course. For students on far-end ITV, there is a tendency for them to believe that they will not be noticed if they fail to come to class. Ironically, this perception is actually opposite of reality. Because the far-end site is often many fewer students, an absence is much more noticeable by the instructor. However, regardless of the delivery mode, the instructor needs to be much more intentional about motivating reluctant students. This is often more difficult unless the instructor is willing to make personal phone calls to the students.
In distance delivery courses, it is generally more difficult to develop relationships. Certainly, distance delivery makes instructor-student relationship building a challenge. While the same is also true of large section traditional delivery classes, it is much more difficult for the student to seek out the professor after class or during office hours for the distant student. Student-to-student peer relationships are also much more difficult to develop. Again, the distant student had more of a challenge to interact socially with the other classmates. Consequently, it is more difficult for them to development cooperative working relationships with each other. However, as business decentralize and telecommuting becomes more commonplace, the need for peer-to-peer relationship building across distances will become more important and distance education environments might be more useful in teaching those skills.
Finally the last student-oriented difficulty with distance education occurs when all of the student’s
16
APUBEF Proceedings (October 2003)
college education is distance delivered. When all of a student’s education is delivered by distance off campus several important sociological functions of college may not be experienced. For the high school student going away to college, a college education provides a semi-structured place for the student to gain independence and self reliance. The college atmosphere provides a safe place for the free exchange of ideas. The college atmosphere also provides ample opportunities for recreational sports and intramural activities. Distance educated students often do not have these advantages. In addition, the amount and variety of coursework is more limited for the distant educated student relative to the on-campus offerings.
Because of the substantial dependence upon technology for distance delivery of education, growth in distance education requires that the technology must be stable and reliable. Students and faculty alike can become quickly disillusioned in distance education when the technology fails. Among common technological problems are the failures of computer hardware such as a server failing and failed transmission lines in the case of ITV courses. Particularly disruptive in a distance education course is a loss of data in a computer failure such as lost exams and/or homework submissions. For distance education computers, frequent (daily) backups and the use of RAID storage systems are very important. As the demand for distance education grows, redundant, fault tolerant servers will gain in importance.
Another technologically-centered difficulty is that the current technology is insufficient for some courses. Consequently they are not appropriate for distance delivery. These types of courses include lab courses and physical education skills courses. The problems for lab courses include safety issues and development of the appropriate hands on technique that may be required. While it is somewhat difficult to imagine, these difficulties could be overcome through future advances in technology.
One area where technologically-centered challenges have made progress is in the area of library access. While technology has not yet completely been successful in exporting the library to the student’s distance location, online journal databases and CD book collections have made great strides. For example, services such as Westlaw allow virtual access to almost an entire law library.
Instructionally-centered problems are primarily of three types—instructional resource problems,
instructor limitations, and instructor motivation problems. Few educational institutions provide enough technical resources for optimal delivery of distance education. Distance educators often need assistance with Web design, acting and camera techniques, production services, far-end academic support, and far-end technical support. Because distance courses require much more extensive preparations, institutions that wish to promote distance education must consider what institutional resources they are willing to commit in the above areas. Few faculty members are willing to invest the time and energy necessary to deliver quality distance courses without significant assistance from their institution.
A related problem is that because of the higher initial cost of development of a distance course and the higher cost of updating a distance delivery course, courses may go longer periods of time between updating the course content. This is an even more significant problem when the university does not provide adequate technical assistance for instructional development.
Another problem with the growth in distance education is perversely its own success in web delivery. Several institutions have found a significant student preference for on-line courses, especially in the summer program. The challenge for the institution is to grow distance education without shrinking traditional education.
Finally, the last problem constraining the growth of distance education is the reluctance of faculty, union, and institutional to “buy-in” to distance education. Distance education does, in fact, require additional effort on the faculty’s part relative to conventional delivery. In addition to the normal development of course content, the faculty member is required to make extra efforts to overcome the constraints with distance delivery. For example, student group project work must be designed such that the students are able to collaborate electronically. Many faculty members believe that distance education is of lesser quality than conventional delivery. As mentioned early in this paper, the research does not support their lesser quality conclusion. However, their feelings and perceptions are real and do negatively impact their willingness to participate in distance education. Consequently, the faculty union parrots their concern regarding the quality of a distance delivered education. Many provisions of the Collective Bargaining Agreement tend to stifle growth. Finally, institutional barriers make it more difficult for institutions to collaborate with each other through
17
APUBEF Proceedings (October 2003)
distance education. Issues regarding tuition sharing, student fee billing, and faculty course load often present such significant obstacles that courses are simply not offered.A Look Toward the Future
Despite the constraints on distance education, economic and social pressure on educational institutions will continue to fuel growth. Every semester, the numbers of courses offered through distance education increases. State-wide initiates such as the Keystone Network foster additional growth. Clearly, not every course is currently appropriate for distance delivery given our current state of technology. Also clear is that not all faculty will be interested nor will all faculty have the requisite skills to succeed with distance delivery of their courses. Nevertheless, demand is increasing and supply will eventually adjust. Otherwise, educational institutions such as the University of Phoenix will soon make enough inroads within the State to measurably affect enrollments.i One-way live audio can be delivered using RealAudio and other software that requires only an addition of a sound card and speakers for the student and a microphone, sound card, and appropriate server software for the sending location. Two way audio and video can be delivered using NetMeeting or other video conferencing software, and low-cost video
cameras, sound cards, microphones, and speakers. The only additional requirement is an Internet connection. The Internet connection may be direct using an ISP (Internet Service Provider) and a telephone modem. Digital Subscriber Lines (DSL), cable modems, and satellite now offer the bandwidth to offer much higher quality, high-speed Internet connections.ii Miller, John W., McKenna, Michael C., and Ramsey, Pamela, “An Evaluation of Student Content Learning and Affective Perceptions of a Two-Way Interactive Video Learning Experience,” Educational Technology, June 1993, p. 51. “Our review of the available research identified no study that has shown distance learning to be disadvantageous in terms of content learning, while some have even documented advantages over conventional, face-to-face instruction (e.g. Barron, 1987, Weingand, 1984).”iii Honey and Hengrequez, “Telecommunications and K-12 Educator: Finds from National Survey,” Center for Technology in Education, Bank Street College of Education, New York, New York, 1993.)iv The Link-to-Learn initiative has been funded at $40,000,000 for each of the last two years and anticipates another $40,000,000 this year.v Additional information about the latest Pennsylvania educational technological initiatives can be found at the web site located at http://www.pde.state.pa.us/ed_tech/site/default.asp.
18
APUBEF Proceedings October 2003)
HOW IMMATERIAL IS IMMATERIAL?
A PILOT STUDY
Gregory P. CermignanoWidener University
andJoseph M. HargadonWidener University
andDavid Contarino
Widener University 2003 Graduate
ABSTRACT
Attempting to define and evaluate "materiality" is not a new concept. Regularly accountants and auditors need to arrive at a working definition to determine the nature and extent of audit tests to be performed and to assess the degree of disclosure needed in the financial statements.
The recent wave of accounting scandals has brought the materiality concept to the forefront once again. Is it possible that companies like Enron, WorldCom, ICN, Global Crossings, and Mirant hid behind some nebulous definition of materiality?
The purpose of this paper is to first review the accounting literature to determine common approaches found in practice for assessing materiality. This analysis includes an examination of quantitative considerations found in official pronouncements such as SAS 47, SAS 99 and SEC regulations. We also address some qualitative considerations pertaining to materiality. Secondly, we report the results of a survey conducted in January 2003 where CPAs in Pennsylvania were asked to identify the specific factors they used to evaluate materiality.
It is our hope that the descriptive results of this survey will allow us to better understand the key factors associated with materiality determination in financial reporting and identify the warning signals that the users of financial statements should look for.
INTRODUCTION
The beginning of the 21st century has taught society many lessons about corporate and auditing ethics. Accounting scandals such as Enron, Adelphia, WorldCom, and the subsequent involvement of Arthur Andersen have impacted many innocent investors causing some to lose a majority of their 401k retirement savings, their jobs and other aspects of their financial security. An adverse impact on the capital markets was felt as investors lost confidence in the credibility of the financial reporting process and in the role of the external auditor. As these scandals were investigated and analyzed, the activities of the auditors came under a great deal of scrutiny.
Some experts say the SEC, AICPA, and FASB have rules and mechanisms that already exist to sufficiently to address the reporting and auditing
issues found in these scandals. They just need to be better enforced. Others say legislation like Sarbanes-Oxley was just waiting to happen. One thing is certain--the effects of these accounting scandals were heavily felt as markets plunged. Our research is designed to analyze one of the issues that has been raised by these scandals. Specifically, we attempt to examine the concept of "materiality" and its effect on the ultimate financial statements and on financial decision-makers. The idea is to try and determine how auditors determine and apply the measurement of materiality. When they say something is immaterial, what do they mean?
12

APUBEF Proceedings October 2003)
The first section of the paper briefly discusses two of the major accounting scandals, when materiality may have come into question. We are not suggesting that these are the only two cases impacted by the problem of materiality. We are merely saying that these are probably the most publicized and famous. This is not a paper on accounting scandals. Our reason for presenting this information is to provide background and framework for you to consider the question - "How immaterial is `immaterial'?"
ENRON AND WORLDCOM – THE BIG TWO
Enron/Arthur Andersen
The facts of the Enron case (at lease those that we know) have been highly documented in the press and in the literature. In short, Enron went from a natural-gas company to a utility "wheeler-dealer" in a very short time. To avoid the appearance of losses, Enron, with the help of its auditor, Arthur Andersen, created thousands of offbalance-sheet entities (i.e., special purpose entities – SPEs) where losses were hidden. These SPEs probably should have been consolidated, but were not due to a questionable application of the rules. Among other things, Enron secured stock acquisition of outsiders in some of these entities with guarantees of their own stock; they hid debt and poor investments in some of these off-balance-sheet entities; they engaged in the production of financial statements that were in part the result of at least questionable entries; they treated their investments in derivatives in a highly unorthodox manner; and the executives engaged in almost illegal stock transactions.
Arthur Andersen, although not technically accused, basically looked the other way. Prompted by their clear lack of independence, they also engaged in document shredding as a form of cover up that eventually brought this "Big Five" firm down.
Although many of the individual accounting treatments may not have been material by themselves, when taken as a whole that changed. Our concern is whether the apparent attempt to avoid material disclosures may have been misleading to financial statement users, and thus were, in part, responsible for job loss as well as loss of financial security. How immaterial was immaterial?
WorldCom
According to a July, 2002 article in Global Agenda, WorldCom, which was audited by Arthur Andersen,
capitalized close to $4 billion dollars of what were actually operating expenses. Whether by mistake or done intentionally, this accounting misclassification turned what would have been an operating loss into a profit. The method of handling these costs was a definite violation of GAAP and was allowed in part by Andersen's audit in which it stated that the statements were fairly presented "in all material aspects." How immaterial was immaterial?
Others
The brief description of Enron and WoldCom, two of the more famous accounting scandals, shows their pseudo-relationship to materiality. A short list of others might include a discussion of Dynegy, Global Crossings, Adelphia and Waste Management. In many of these situations, parties also hid behind the materiality veil. In any of these cases, whether the definition being used by the companies and their auditors was appropriate is questionable. One thing, however, is clear — the meaning of materiality and how it is operationalized is definitely unclear. So how immaterial is immaterial? We don't know. However, in the next section we attempt to catalog approaches to "defining" and assessing materiality cited in the accounting literature.
CURRENT APPROACHES IN DETERMINING MATERIALITY
The method most frequently used in determining a definition of materiality includes a concept often referred to as the "User Perspective". Looking at the effects on the financial information user has been an established principle of the FASB, the SEC and the AICPA. Even with the user orientation, these sources make constant reference to a "magnitude" of materiality coupled with the use of professional judgment. Clearly this process, should incorporate two distinctive approaches — one qualitative and the other quantitative. Obviously the quantitative approaches involve the setting and application of numerical benchmarks. There are many of these such benchmarks found in practice as well as organizations involved in recommending them. This section will review just a few of the approaches typically cited.
SAB 99 was the ultimate product of Arthur Levitt according to Fang and Jacobs (May, 2000). Levitt believed that "defined percentages" were needed for management to be able to keep earnings and the amount of recorded errors under control. Levitt apparently thought that the old "rule of thumb" method was outdated and that materiality should be a
13

APUBEF Proceedings October 2003)
product of both quantitative and qualitative factors. In proposing SAB 99, however, the SEC staff made it clear that they thought the definition should move away from numerical thresholds. By doing so, however, they indirectly promoted earnings as a part of the definition.
Fang and Jacobs also cited one court case, Kidder Peabody SEC Litig., 10 E. Supp. 2d 398 (S.D.N.Y. 1998), This case made reference to a "low" earnings materiality misstatement threshold as resulting in large errors. While chastising the method, they seemed to reinforce the base used -- percentage of earnings. According to a July 2002 article in Investor Relations Business, the SEC, with the issuance of its new disclosure rule (Regulation FD) has listed "new triggers" for materiality analysis. They include "an unusual material agreement; loss of business with a significant customer; new or accelerated debt; write-offs; changes in ratings, listing arrangements; employee benefit plans; and audit report withdrawal." While shifting the focus slightly away from totally quantitative considerations, one can see a few additional benchmarks for typical high risk transactions such as debt, write-offs and business losses.
In a piece describing the non-quantitative requirement of SAS No. 47, "Audit Risk and Materiality in Conducting an Audit", Carmichael, et al., suggest that common benchmarks for materiality determination have been: "5% - 10% of income before tax, or owners equity" and ".5% - 1% of total revenue or total assets."
Tuttle, et al., in Auditing: A Journal of Practice and Theory (March, 2002) cite a number of sources that identify and describe various benchmarks. They include Friedberg (1989) who prescribes income before taxes, income from continuing operations and total assets. Cerman and Hollison (1991), Boatsmen and Robertson (1991), Ward (1976), Firth (1979), Bates et al., (1982), Messier (1983). Fugstad, et al. (1984), and Carpenter and Dirsmith (1992) also point primarily to income measures. Michael and Ricketts (1992), Pany and Wheeler (1992) and Pevess (1986), suggest using assets or revenues when income is close to zero.
In a brief article in Mergers and Acquisition Journal (Jan. 2000), the editors indicate that whenever a benchmark is used, 10% or more seems to be treated as material. In a March 1999 note in Financial Modernization Report, the editors state that "the idea
of what is material to shareholders has been loosely understood as anything that would affect earnings between 3% and 5%."
According to Price and Wallace in Accounting Today (Dec. 1996), materiality criteria "established by management and operationalized by CPA's" ... "could include income, normal pretax income, gross revenues, sales revenues, income before extraordinary items, balance sheet categories including percentage of current assets, working capital, total assets, total liabilities and owners' equity." They state that as many as 52 factors have been mentioned.
In a study published in The CPA Journal (March, 1993) Thompson and Fowler identify a number of rules-of-thumb that had been proposed. They include 5% of normal pre-tax income if less than $2 million; 5% to 10% of normal pre-tax in excess of $2 million; and 1% of gross revenue. They also describe a study by the FASB which identifies a number of quantitative guidelines noted in a variety of official pronouncements. For example, there are specific materiality percentages with respect to stock dividends percentages, EPS dilution tests, voting stock ownership, the pension expense corridor, lease term, segment reporting requirements and others.
Thompson, Hodge and Worthington (July 1990) in an article in The CPA Journal, mention that comparative benchmarks could include income before extraordinary items, net income or trends of earnings. They suggest that "a majority of materiality percentages are investment-related". The rest "relate to specialized accounting practices".
Finally in Accounting, Organizations and Society, (1992) Carpenter and Dirsmith indicate "that most of the predictive power of the isolated modes is produced by a single, dominate cue – the size of the item relative to current year net income – while such other quantitative size measures as percent of net assets or total assets play secondary roles".
After reviewing the literature, it seems that so-called predictive benchmarks could include anything from income to assets, to debt to owners' equity, all with varied percentages. However, as noted in the discussion by Fang and Jacobs (2000) of SAB 99, many seem to feel that qualitative considerations would be a better approach to handle potential problems. Proponents of a qualitative approach constantly refer to the necessity to know when something matters to the ultimate financial information user. The SEC, through a discussion of
14
APUBEF Proceedings October 2003)
the shortcomings of quantitative considerations, implies a few qualitative concepts. They could include earnings trends, compliance with regulations, contractual covenants, concealment of unlawful actions and management compensation. Harvey Pitt in a July 2002 article in Investors Relations Business, indicated that companies should decide materiality based on their knowledge of their own business.
Price and Wallace (1996), reported that the Accounting Standards Executive Committee asks for disclosures of items such as nature of operations, health of cash flows, vulnerabilities of the industry or business and use of estimates.
In the July 1995 Journal of Accountancy, Jordan, Clark and Pate as well as Carpenter and Dirsmith in the 1992 Accountings, Organizations and Society indicated that the size and nature of a company transaction might affect materiality. They stress that professional judgment and overall client knowledge have been deemed as important measures. Thompson and Fowler (March 1963) and Pany and Wheeler (June 1992) also identify the need for professional judgment. Pany and Wheeler (June 1989) indicated that the FASB needed to develop improved quantitative guidelines. They implied that there is an inherent weakness in the use of certain quantitative considerations. While reviewing such measures as 5% of average pre-tax income, gross profit, '/2 % of total assets, 1% of total equity and '/2 % of total revenues, they present an implied need for non-quantitative measures. They also identify specific knowledge of industry, client and firm as major non-quantitative inputs in the determination of materiality.
Another major qualitative consideration in determining materiality focuses on the user of the materiality definition. Audit experience is a major factor in determining materiality as explained by Messier in a 1983 article in the Journal of Accounting Research. Coupling years of experience with the type of experience seems to indicate a level of stability which can be used in the process of determining a materiality definition.
One major area of qualitative measurement involves a study of the economic environment. Ward in a 1976 article in the Journal of Accounting Research refers to its importance in the determination of materiality. The economic environment that the company operates in along with the nature of its contractual relationships affects the overall level of business risk for the organization. Materiality and risk assessment are intertwined.
In this section we have superficially identified several factors of a qualitative nature that could be used by an auditor in the determination of materiality. They could include company size, professional judgment, (which is inherent in all of the approaches to some degree) industry knowledge, client/firm knowledge, audit experience, economic environment and the level of business risk. Adding these items to the list of quantitative approaches makes it a daunting task to determine the "best" approach to assessing materiality. This section has been an attempt to identify the materiality determination process as described by the literature. In the following section we identify the specific approaches used by CPAs based on their responses to a 2003 survey.
The Survey – Background
The purpose of the survey was to attempt to gather some empirical evidence as to how CPAs assess and evaluate materiality decision in practice. Specifically, we wanted to determine (1) if some of the approaches cited in the literature were actually being used, (2) if other quantitative and/or qualitative techniques not commonly found in the literature were being used, and (3) how comfortable the CPA respondent was in assessing materiality during an audit. We also requested certain limited demographic information from the respondents to gain a better understanding of their business experience – both audit and non-audit related.
This study was not intended to test any hypotheses. It was purely an attempt to gather some descriptive information on how a select group of CPAs evaluate and assess materiality. In effect, it represents a pilot study which we hope will lead to a more comprehensive survey and a more extensive sample population in the future.
The Survey – Who was Sampled?
In order to expedite the survey process, we elected to do the following:
(1) Select a convenience sample of CPAs listed in the Pennsylvania Institute of CPAs (PICPA) data base of Career Recruiting and Opportunities Program (CROP).(2) Limit the survey to eight key, but basic, questions (Tables 1-8).
We recognized that the timing of this study (i.e., January) coincided with the start of the "traditional" busy season for CPAs, thus we wanted the survey to
15

APUBEF Proceedings October 2003)
require very little time to complete. The survey was also part of an independent research study requirement for an undergraduate senior business student.
The Survey – Results
A total of 135 surveys were mailed to Pennsylvania CPAs and we received 41 responses, yielding a 30% response rate.
Table 1 indicates the vast majority (76%) of the respondents were at the partner level in their firms. Consistent with partner status, Table 2 shows that 90% of the respondents have over 10 years of auditing experience. Table 3 reports that the majority of the respondents (76%) also have over 10 years of non-auditing accounting experience. Consequently, it is clear that the participants in this study have a substantial amount of accounting and auditing work experience and thus are knowledgeable about business issues.
Based on the experience level of the CPAs in this study, it is not surprising that Table 4 shows over 65% indicated that they were very comfortable with assessing materiality during the audit and 29% stated they were somewhat comfortable. Finally, all 41 respondents reported that they were directly involved in materiality decisions. (Table 5)
From the responses received and information reported in Tables 1 through 5, the overwhelming majority of the CPAs in this study have over 10 years of auditing and non-auditing accounting experience, they are all directly involved in materiality decisions and are either very comfortable or somewhat comfortable in assessing materiality during the audit. With this established, we feel more confident about the approaches they indicate they use to assess materiality.
Table 6 reports the authoritative references and/or factors the CPAs used to determine materiality. Most of the respondents selected multiple approaches with official pronouncements (e.g. AICPA, FASB), industry practices and internal policies being the most heavily cited.
Table 7 also indicates that the majority of the CPAs in the study selected multiple financial statement items as quantitative materiality benchmarks, with sales, net income and total assets being the most common. This finding is consistent with the benchmarks cited in the literature.
Finally, Table 8 reports other elements that affect the materiality decision. Although this question was intended to identify qualitative (non-quantitative) factors, some of the respondents indicated factors that are quantitative in nature. The nature of the industry (39%) and years the company was their audit client (15%) were cited as factors. Surprisingly, however, the risk of audit failure (5%) and professional judgment were very low in their consideration (4%). The CPAs also identified company size (58%) and the magnitude of accounts (59%) as the other key elements that influence their materiality decisions.
SUMMARY AND CONCLUSION
Recent accounting scandals such as Enron and WorldCom have heightened the public's concern about the role of the external audit in the financial reporting process. One of the issues that has always caused great concern for auditors and financial statement users is the concept of materiality. There has been an extensive body of recommended authoritative and academic literature citing approaches to assessing financial statement materiality.
The purpose of this study was to survey CPAs to determine what, if any, of the recommended approaches they are actually using to evaluate materiality, to identify other approaches (both quantitative and qualitative) they incorporate into their materiality assessment during an audit, and to ascertain how comfortable they were in determining materiality thresholds.
The pilot study reveals that 41 practicing CPAs in Pennsylvania with substantial audit and other accounting related experience, are generally comfortable making a materiality determination for their clients. The vast majority use the traditional sources for assessing materiality cited in the literature (e.g. official pronouncement guidelines and industry practice) and the recommended benchmarks (e.g. sales, net income and total assets). They also identify company size, magnitude of the accounts and the years the client has been an audit client as factors that influence materiality decisions.
Based on our findings in this survey, it appears that CPAs are comfortable with this somewhat nebulous concept of materiality. They currently use the benchmarks commonly cited and they factor in selected qualitative measures as well. However, if
16

APUBEF Proceedings October 2003)
financial reporting problems result and "material" disclosures are the underlying cause, perhaps what is being done needs to be re-examined.
Although this was a convenience sample and very limited in geographic scope, the results warrant a more exhaustive evaluation of the materiality concept and how this determination should be disclosed to financial statement users.
REFERENCES
"A Guide to Who Did What" Global Agenda, July 11, 2002.
"Materiality Guidance May Jack Up Auditing Costs," Financial Modernization Report, March 15, 1999, v.1, p.1.
"Materiality Stance Is Welcomed", Mergers & Acquisitions Journal, January, 2000, v. 35, p. 17.
"SEC Moves to Expand 8-K Triggers: Regulators Attempt to Pin Down Materiality, But at What Cost?" Investor Relations Business, July 1, 2002, p. Item 02182009.
Carmichael, D.R. (Editor) "Auditing" The CPA Journal.
Carpenter, Brian W. and Dirsmith, Mark W., "Early Debt Extinguishment Transactions and Auditor Materiality Judgments: A Bounded Rationality Perspective," Accounting Organizations and Society, vol. 17, No. 8, pp. 709-739, 1992.
Fang, Kenneth C. and Jacobs, Brad, "Clarifying and Protecting Materiality Standards in Financial Statements: A Review of SEC Staff Accounting Bulletin 99," Business Lawyer, May, 2000, V. 55, p. 1039
Jordan, Charles E. and Clark, Stanley J. and Pate, Gwen R., "Materiality Guidelines for Modifying Audit Reports," Journal of Accountancy, July 1995, v. 180, p. 89 (4).
Messier, William F., Jr., "The Effect of Experience and Firm Type on Materiality/Disclosure Judgments," Journal of Accounting Research, vol. 21, NoI 2, Autumn, 1983, pgs. 611-618.
Pany, Kurt and Wheeler, Stephen, "Auditing: A comparison of Various Materiality Rules of Thumb," The CPA Journal, June, 1989, v. 59, p. 62
(2).
Pany, Kurt and Wheeler, Steve, "A Test of Analytical Procedure Effectiveness," The CPA Journal, June 1992.
Price, Renee and Wallace, Wanda A., "Too Many Shades of Materiality Only Serve to Confuse," Accounting Today, December 16, 1996, v. 10, p. 61 (1)
Thompson, Hodge and Worthington (July 1990) "An Inventory of Materiality Guidelines in Accounting Literature" The CPA Journal. New York: Jul 1990. Vol. 60, Iss. 7; p. 50 (4 pages)
Thompson, James H. and Fowler, Kenneth J., "Quantitative Guidelines: Guidance Based on Professional Pronouncements," The CPA Journal, March 1993, v. 63, p. 48 (4)
Tuttle, Brad and Coller, Maribeth and Plumlee, R. David, "The Effect of Misstatements on Decisions of Financial Statements Users: An Experimental Investigation of Auditor Materiality Thresholds", Auditing: A Journal of Practice and Theory, March 2002, V. 21, p. 11 (18)
Ward, Bart H., "An Investigation of the Materiality Construct in Auditing," Journal of Accounting Research. Spring 1976, pgs. 1976, pgs. 138-15
17

APUBEF Proceedings (October 2003)
HISTORY REPEATING ITSELF:THE DEBATE OVER ACCOUNTING FOR STOCK OPTIONS
Michael P. CoyneBucknell University
ABSTRACT
This paper discusses the similarities between a debate that occurred in Congress in 2002 over classifying stock options as a form of compensation expense and debates that occurred almost 10 years ago in Congress on the same topic. This recent Congressional debate was initiated as a partial response to the various financial reporting scandals that have come to light during the past two years. t accounting rules do not require the cost of stock options to be recognized as expenses in a company’s income statement. While many members of the U.S Congress and some leaders in Corporate America are proposing that stock options be treated as expenses, a significant faction of the U.S Congress and many corporate leaders oppose treating stock options as expenses. To date, no formal legislation has been passed, though many companies have voluntarily chosen to expense stock options.
This paper examines the role that political lobbying and campaign contributions have had on various bills that have been proposed in the U.S Senate on the topic of accounting for stock options. This study reviews who were the key sponsors and co-sponsors of the various bills proposed and what industry groups strongly supported the sponsors and co-sponsors of the bills.
INTRODUCTION
This paper examines the role that political lobbying and campaign contributions have had on the congressional debates of 2002 and the early 1990’s over financial accounting rules for stock options. While the role of campaign contributions and political lobbying in the setting of tax policy has been recognized and examined extensively in both the popular press (Alter, 1997) and academic research (Begay et al., 1993), the role that politics and campaign contributions plays in the setting of financial accounting standards has not received as much public scrutiny and discussion.
This paper focuses on a series of bills introduced in the U.S. Senate in the last 10 years related to the issue. However, before we discuss the role that political lobbying has had on this debate, it is important to explain where the Financial Accounting Standards Board (FASB) currently stands on this issue. In December 2002, the FASB issued Statement 148, “Accounting for Stock-Based Compensation-Transition and Disclosure,” which provides alternative methods of transition for a voluntary change to expensing stock options using the fair value based method of accounting for stock-based employee compensation. In addition, Statement 148 amended the disclosure requirements of Statement 123, “Accounting for Stock-Based Compensation,” to
require more prominent and more frequent disclosures in financial statements about the effects of stock-based compensation (FASB, 2002). Under the provisions of Statement 123 that remain unaffected by Statement 148, companies may either recognize expenses on a fair value based method in the income statement or disclose the pro forma effects of that method in the footnotes to the financial statements (FASB, 1995).
In March 2003, the FASB announced that they would begin a project on stock-based compensation that will address whether to require that the cost of employee stock options be treated as an expense. As part of this project, the Board agreed to revisit its 1994 decision permitting companies to disclose the pro forma effects of the fair value based method rather than requiring all companies to recognize the fair value of employee stock options as an expense in the income statement (FASB, 2002). vi
A final standard was initially expected to be issued by the FASB before the end of 2003, but is not expected to be issued until the first quarter of 2004. However, in April of 2003, the Board tentatively decided that the cost of stock options should be treated as an expense. In 2002 well before the FASB tentative decision, the idea of expensing stock options was already being met with significant
22

APUBEF Proceedings (October 2003)
opposition from numerous political and business leaders. While a number of major companies had voluntarily decided to reflect stock option costs as an expense in reporting their earnings before the FASB tentative decision, more companies have chosen to simply disclose the potential cost of these expenses in the footnotes to their financial statements. At the end of 2002, the FASB invited comment from industry leaders on the issue. Eighty-eight percent of the industry respondents to the FASB opposed mandatory expensing of stock options (FASB, 2003).
As noted above, the focus of this paper is on the role of political lobbying and campaign contributions on the debate on accounting for stock options. Consequently, it does not advocate one accounting method over another. Accounting for stock options is a complicated accounting issue without a clear cut answer. Strong arguments can be made for recognizing expenses at the grant date of an option and equally strong arguments can be made that because of various factors it is not possible to reasonably determine the cost of an option at grant date (Gleckman, 2002). While this paper does not take a position, a summary of the pros and cons for accounting for stock options as expenses can be found in Appendix A.
The Politics of Stock Options
With regard to the politics of the issue, this debate began to take shape in June 1993 when the FASB issued its original exposure draft on accounting for stock optionsvii. The 1993 exposure draft concluded that the value of stock options issued to employees should be considered compensation and recognized in the financial statements. The exposure draft recommended that option pricing models be used to estimate the value of stock options. In addition, the FASB recommended that disclosures related to stock option plans be enhanced.
The exposure draft met with significant opposition from the business community and the Congress, particularly the U.S Senate. Various industrial sectors (i.e., financial services, electronics/high tech and general business/retail) opposed the new accounting rules. Some of the arguments against the new rules were related to the technical complexity of the issue (i.e., that it was impossible to develop appropriate option pricing models). However, the primary argument made by political leaders and the business community was based on economic terms (Jacobson, 1995). At the time of this debate, numerous studies were quickly conducted to support the position that
recognizing stock options as expenses in the financial statements would have dire economic consequences. For example, a Merrill Lynch study at the time stated that expensing stock options would have slashed profits among leading high-tech companies by 60 percent on average (McNamee, 2000).
In the words of Jim Leisenring, the vice chairman of FASB from 1988 to 2000, “It wasn't an accounting debate….We switched from talking about, 'Have we accurately measured the option?' or, 'Have we expensed the option on the proper date?' to things like, 'Western civilization will not exist without stock options,' or, 'There won't be jobs anymore for people without stock options.' ... People tried to take the argument away from the accounting to be just plainly a political argument." viii
Two specific pieces of legislation, the “Equity Expansion Act of 1993” and the “Accounting Standards Reform Act of 1994” were introduced in the U.S. Senate to prevent the FASB from changing the accounting rules for stock options. This represented somewhat of a departure from the general policy of allowing the FASB to independently set accounting standards. Ultimately the FASB decided to encourage rather than require the use of a method that would have companies recognize stock options as compensation expense at the grant date. This decision was largely believed to be a result of the unprecedented political pressure that was placed on the FASB. The FASB’s decision to revise the accounting standard represented a shift from its general policy that financial standard setting should be based solely on determining the proper accounting treatment, rather than also considering some perceived economic cost to changing an accounting standard. In the words of James Hooton, who was then chief of Arthur Andersen's worldwide auditing, "It was the first time that accounting principles had become very, very much influenced by commercial interest and political interest."ix Whether this was the first time the FASB revised an accounting policy due to political pressure is a debatable point. However, it did demonstrate the effect that campaign contributions and political lobbying by various industry sectors had on the development of an accounting standard.
In the years since 1994, the amount of campaign contributions by various industrial groups has increased dramatically. As noted on Table 1, between 1994 and 2000, four major business sectors (Financial Services, Electronics/High Tech, Lobbyist/Lawyers and General Business/Retail) all had more than 100% increases in their political
23
APUBEF Proceedings (October 2003)
campaign contributions. Most notably, the financial services sector increased over 200% and the Electronic/High Tech Industry increased almost 400%.
As noted above, the events of 1993 and 1994 may have been the beginning of politics/lobbying playing a significant role in the development of accounting standards. However, events in 2002 have shown that they were not the end of political lobbying. For example, at the beginning of 2002, as a result of the various financial reporting scandals during the previous year, the U.S Congress began to draft legislation related to reform in the accounting industry. This legislation ultimately resulted in the passage of the Sarbanes-Oxley “Accounting Industry Reform Act” on July 30, 2002. This legislation mandated various reforms to the accounting industry including the prohibition of auditors engaging in consulting services for their auditing clients and independent funding of the FASB.
However, the bill did not address the issue of accounting for stock options. Legislation related to the stock option issue, “Ending the Double Standard for Stock Options Act,” was introduced as an amendment to the Accounting Industry Reform Bill. This amendment was vigorously opposed by the same business sectors, as well as many of the same senators, that opposed changes in rules for accounting for stock options in 1993 and 1994.
METHODOLOGY
This study reviewed the three bills discussed above and identified the sponsors and co-sponsors of the three bills. Data was then gathered related to the campaign contributions made by four business sectors (Financial Services, Electronics/High Tech, Energy and General Business/Retailers) to members of the U.S Senate. A comparison was made between the Senate sponsors and co-sponsors of the applicable legislation to a list of the “Top Twenty” Senate recipients of campaign contributions from each of the four business sectors.
In addition, within the financial services sector, the campaign contributions given by the accounting industry was examined separately. The accounting industry was examined separately because it was one of the strongest opponents to the proposed new rules. It was opposed by the accounting industry in general and the Big Six (now Big Four) accounting firms in particular.
The rationale for identifying the sponsors and co-sponsors of the legislation was that these senators were arguably the strongest supporters for those particular pieces of legislation. By comparing the sponsors to a list of the top 20 senators who received the most campaign contributions, we could identify possible relationships between the campaign contributions and the positions taken by various politicians.
The source for who sponsored and co-sponsored particular pieces of legislation was provided by THOMAS. THOMAS is an Internet site established by the Library of Congress.x It stores a series of government databases including the Congressional Record Text and the Congressional Record Index. The source for which senators received the most financial support in particular business sectors was the Center for Responsive Politics. The Center for Responsive Politics is a non-partisan, non-profit research group based in Washington, D.C. that tracks money in politics and its effect on elections and public policy. The Center conducts computer-based research on campaign finance issues for the news media, academics, activists and the public at large.
In addition, to the three specific pieces of legislation noted above, a similar analysis was conducted of a 1994 Senate non-binding resolution condemning the FASB proposed changes for accounting for stock options, and a 2002 bill introduced as a response to the bill mandating significant changes in accounting for stock options. For the 1993-1994 legislative season (the 103rd Congress), campaign contributions received for 1994 election cycle were examined. For the 2002 legislative season (the 107th Congress), campaign contributions for the 2000 election cycle were examined since full 2002 campaign contribution data was not available.
RESULTS
Legislation in the Early 1990’s
The first piece of legislation examined was the “Equity Expansions Act of 1993” (S. 1175).xi This legislation was sponsored by Senator Joseph Lieberman from Connecticut and was co-sponsored by 14 other senators from both political parties. This bill, if it had been enacted into law, would have mandated that no compensation expense be reported on a company’s income statement for stock option plans.
Table 2 identifies the sponsors and co-sponsors of this legislation that also were in the “Top Twenty”
24

APUBEF Proceedings (October 2003)
list of senators who received financial contributions from the four business sectors and the accounting industry. A review of the support received by the senators who sponsored or co-sponsored this legislation indicates that many of these senators received strong support from the aforementioned business sectors and the accounting industry.
Specifically in the finance, law and retail sectors, 50% of the senators who sponsored or co-sponsored the bill were classified as being on the “Top Twenty” list of senators who received support from that particular business sector (See Panel A of Table 2). In the electronics/high tech sector, 42.9% of the senators were part of the “Top Twenty” group. With regard to the accounting industry, a review of Panel B indicates that the senators also received strong support from the accounting industry (42.9%). In addition, it should be noted that many individual senators received strong support from 75% or 100% of the sectors examined.
The second piece of legislation examined was the “Accounting Standards Reform Act of 1994” (S. 2525). This legislation was also sponsored by Senator Joseph Lieberman and was co-sponsored by seven other senators from both political parties. This act, if it had been enacted into law, would have amended the SEC Act of 1934 to require that any change in an accounting principle or standard would require an affirmative vote of the majority of the Senate in order to be enacted. This law would have hindered the independence of the FASB, which has historically been responsible for developing accounting standards.xii
In the same manner as Table 2, Table 3 identifies the sponsors and co-sponsors of this legislation that also were in the “Top Twenty” list of senators who received financial contributions from particular business sectors and the accounting industryxiii. A review of Panel A of this table indicates that many of the senators who sponsored or co-sponsored this legislation also received strong support from the various business sectors.
Like the “Equity Expansion Act” discussed above, in the finance, lobbyist/lawyers and general business/retail sectors, 50% of the senators who sponsored or co-sponsored the bill were classified as being among the “Top Twenty” group of senators. In the electronics/high tech sector, 37.5% of the senators were part of the “Top Twenty” group.
With regard to the accounting industry, the support received by supporters of the Accounting Standards
Reform Act was also very strong. Specifically, 37.5% of senators were in the “Top Twenty” category. In addition many individual senators also received strong support from 75% or 100% of the sectors examined.
The final piece of legislation from the early 1990’s that was examined was a concurrent resolution expressing the sense of the Senate on the stock option accounting standard proposed (S.CON. RES. 34). Unlike the two other acts discussed above, this act was not a formal bill, but rather a non-binding concurrent resolution and was passed by the Senate.
This legislation was sponsored by Senator Bill Bradley from New Jersey and was co-sponsored by 16 other senators from both political parties. This act stated that the accounting standards proposed by the FASB would have grave economic consequences particularly for businesses which rely heavily on entrepreneurship. It also stated the Board should not change the current accounting rules to require that businesses deduct the value of stock options from income.
A review of the support received by the senators who sponsored or co-sponsored the bill indicates that for each business sector roughly a third of the senators were in the “Top Twenty” category (See Table 4). While this is not as high a percentage as the other two bills, it still represents a significant number of the senators sponsoring the bill. With regard to the accounting industry 31% of the senators were in the “Top Twenty” category.
2002 Legislation
The first legislation from the 2002 session examined was the “Ending the Double Standard for Stock Options Act” (S. 1940). This legislation was sponsored by Senator Carl Levin from Michigan and Senator John McCain from Arizona and was co-sponsored by five other senators from both political parties. This bill, if it had been enacted into law, would have limited the amount of the deduction for stock option costs corporations are allowed to take for tax purposes to the amount of expense they reported for financial reporting purposes. As most corporations do not recognize significant expenses for financial reporting purposes, this legislation would have, in effect, largely eliminated the tax deduction for most corporations.
A review of Table 5 indicates that, unlike the other bills, only Senator McCain had received significant support from the four aforementioned business
25

APUBEF Proceedings (October 2003)
sectors. In addition, it should be noted that Senator McCain’s strong support from these business sector groups may have been largely related to his 2000 presidential campaign.xiv Unlike the earlier bills, this bill was not supported by any of the business sectors that have been examined in this study. Rather, this legislation was strongly opposed by all these business sectors. Although Senators Levin and McCain wanted to get a vote on the Senate floor to have this bill added as an amendment to the Sarbanes-Oxley Accounting Industry Reform Act, this legislation was not brought up for a vote in the Senate.
The final legislation examined in this study was drafted in response to the Levin-McCain legislation. This legislation was the “Stock Option Fairness and Accountability Act” (S. 2760). It was sponsored by Senator Enzi of Wyoming and co-sponsored by nine other senators. Rather than mandating a specific method for accounting for stock options, this legislation instead basically called for further study on the stock option issue. It instructed the SEC to analyze and report recommendations to certain Congressional committees on the accounting treatment of stock options.
A review of the support received by the senators who sponsored or co-sponsored this legislation indicates that, in some respects, the senators received stronger support for this bill than any of the other bills discussed. While only 20% of the senators were in the ”Top Twenty” list for lobbyists/lawyers, in the financial services and high tech sectors, 50% of the Senators who sponsored or co-sponsored the bill were classified as being in the “Top Twenty” category. In the general business/retail sector, 60% of the senators were in the “Top Twenty” category which was the highest percentage for any bill. With regard to the accounting industry groups, 50% of the senators who strongly supported the bill were in the “Top Twenty” category. The 50% support level for the accounting industry also represents the strongest level of support of all the pieces of legislation examined.
DISCUSSION
Five pieces of legislation were examined in this study, three from the early 1990’s and two from 2002. An examination of the financial support received by the senators who strongly supported each of these bills provides evidence for the continuing significant role that politics and campaign contributions play in the setting of accounting standards.
The three pieces of legislation from the early 1990’s and the 2002 Stock Option Fairness and Accountability Act were designed to either directly or indirectly prevent stock option costs from being recognized as expenses in a company’s financial statements. As noted above, a series of business sectors/industries strongly opposed any changes that would require stock option costs being reported as expenses. Many of the senators who strongly supported these pieces of legislation were strongly supported financially by the aforementioned business sectors that vigorously opposed the expensing of stock options.
In contrast, the “Ending the Double Standard for Stock Options Act” which was proposed in 2002 was designed to encourage companies to recognize stock options as expenses. This was strongly opposed by the business sectors examined in this study, and the senators that strongly supported this legislation were almost completely absent from any of the “Top Twenty” business sector/accounting industry lists examined.xv
While the three pieces of legislation from the 1990’s provide strong support for the role that politics played in setting accounting standards at that time, the two pieces of legislation from 2002 seem to indicate that the role of lobbying/campaign contributions in the accounting standard setting process continues to be significant. The level of support for politicians who supported the 2002 “Stock Option Fairness and Accountability Act” was in many respects greater than any of the early 1990’s bills that were also supportive of the business sectors position. In addition, the virtual lack of support by the business sectors for senators who strongly supported the 2002 “Ending the Double Standard for Stock Options Act” also indicates the financial consequences of taking positions on accounting standards contrary to the view of powerful business sectors.
While this paper concludes that an analysis of the data provides strong support for the continuing role that politics plays in the setting of accounting standards, it should be noted that a number of senators not on any “Top Twenty” lists also co-sponsored bills that were supportive of the various business sectors interests. Also the paper is definitely not implying that any individual senator or senators supported a bill solely as a result of campaign contributions received from a particular group.
As noted at the outset of the paper, accounting for stock options is a complicated technical accounting
26

APUBEF Proceedings (October 2003)
issue without a clear answer. Rather than implying that a senator’s position was based solely on campaign contributions from a particular business sector, it is this study’s position that it is reasonable to assume that strong financial support by particular business sectors may have played a role in some senators’ positions on various pieces of legislation.
It is also important to note that the only piece of legislation discussed above that was passed by the full Senate was the 1994 non-binding resolution that stated the FASB should not change the current accounting rules to require that businesses deduct the value of stock options from income. However, various sources cited above stated that just the introduction of this legislation in the early 1990’s had a significant role in the FASB changing its position at that time. Given what happened in the 1990’s, it is reasonable to conclude that these earlier bills and the introduction of bills taking a position against stock options in 2002 may have also had a significant impact on the FASB decision making process.
CONCLUSION
The importance of political lobbying and campaign contributions on the legislative process is certainly not a new story or one relevant only to the setting of financial accounting standards. However, given all the recent problems of the accounting profession, the role of politics in the accounting profession has particular importance at this time.
While this study focused on legislation introduced in the early 1990’s and in 2002, the pattern of government leaders taking a strong role in the setting of accounting standards appears to be continuing. In May 2003, Senator Ensign of Nevada and Senator Boxer of Californian co-sponsored S. 979 the “Broad-Based Stock Option Plan Transparency Act of 2003.”
This bill was a reaction to the tentative decision of the Financial Accounting Standards Board in April to mandate the expensing of stock options. This bill would place a three year moratorium on the mandatory expensing of stock options. It would temporarily prevent the Securities and Exchange Commission from recognizing any accounting standard related to the treatment of stock options. The bill would further require the SEC to adopt rules requiring companies to report information regarding their stock option plans and, after three years, the SEC would be required to issue a report. Commenting on the bill, Senator Ensign stated, “This
issue was brought to my attention by a couple of hundred chief executive officers and leader in the high tech world. This is their No.1 issue because when they are properly structured stock options are valuable incentives for productivity and growth” (Carney, 2003).
Whether Senator Ensign and Senator Boxer’s bill should become law is a debatable issue. What appears more certain is that, for the foreseeable future, politics, political lobbying and campaign contributions will continue to play an important role in the setting of accounting standards and the accounting profession in general. Consequently, business professionals and academic researchers may want to continue to monitor the positions political leaders take on particular accounting issues and what groups provide financial support to these political leaders.
REFERENCES Alter, J. (1997, October 6). The beltway bank shot. Newsweek. Page 33.
Begay, M. E., Traynor, M., & Glantz, S. A., (1993). The tobacco industry, state politics, and tobacco education in California. The American Journal of Public Health, 83:1214-18.
Carney, D. (2003, May 1). Senator Ensign Introduces Bill to impose Moratorium on Mandatory Stock option Expensing. Tech Law Journal, Page 1
Center for Responsive Politics. Washington, D.C
Financial Accounting Standards Board. (2002, October 4). Accounting for Stock-Based Compensation for Financial Reporting Purposes-Transition and Disclosure- an amendment of FASB Statement No. 123 FASB Emerging Issue Task Force No. 1101-001. Norwalk, CT.
Financial Accounting Standards Board. (2002, December 31). FASB Amends Transition Guidance for Stock Options and provides Improved Disclosure. FASB Press Release. Norwalk, CT.
Financial Accounting Standards Board. (2003, March 12). FASB Adds Projects to Its Agenda on Employee Stock Options and Pensions. FASB Press Release. Norwalk, CT.
Financial Accounting Standards Board. (2002, December ). FASB Statement No. 148 Accounting
27

APUBEF Proceedings (October 2003)
for Stock Based Compensation --Transition and Disclosure. Norwalk, CT.
Financial Accounting Standards Board. (1995, October ). FASB Statement No. 123 Accounting for Stock Based Compensation. Norwalk, CT.
Frontline. (2002, June 20). Bigger than Enron. Public Broadcasting Service. WGBH Educational Foundation. Boston, MA.
Gleckman, H. (2002, October 28). The Imperfect Science of Valuing Options. Business Week, p.122.
Jacobson, L. (1995, January 7 ) Dropping a hot potato. National Journal, 27:28.
McNamee, M., Dwyer, P., Schnitt, C., & Lavelle, L. (2000, September 25 ) Accounting Wars. Business Week, pp.64-72.
THOMAS. 2002. The Library of Congress. Washington, D.C.
vi The International Accounting Standards Board (IASB) is also currently examining the issue of accounting for stock options. The FASB has said it will work with the IASB toward a converged standard that would reduce or possibly eliminate any differences between those that use the IASB standard and those that follow United States’ generally accepted accounting principles.vii The lack of political interest in this issue before 1993 is likely related to the fact that historically no significant stock-based employee compensation has been recognized under APB 25 "Auditing for stock issued to employees.”
viii Transcript of “Bigger than Enron” a Frontline Public Broadcasting Service television special (June 20, 2002).
ix Transcript of “Bigger than Enron” a Frontline Public Broadcasting Service television special (June 20, 2002).
x The THOMAS website can be found at http://thomas.loc.gov.
xi S. stands for a Senate bill as opposed to H.R. which would be a House of Representatives bill.
xii The SEC has historically had the right to reject accounting standards promulgated by the FASB. However, before this legislation being proposed, the SEC did not have to formally approve each standard developed by the FASB. In addition, while the FASB has traditionally solicited opinions from the public (i.e., corporations, public accounting firms, government officials) through the use of exposure drafts, the FASB has always acted as an independent entity.
xiii Tables 4-6 analyze particular bills in the same manner as Tables 2 and 3.
28

APUBEF Proceedings (October 2003)
xiv In the 2000 election cycle, the politicians that received the overall highest contributions were George W. Bush, Al Gore and John McCain, who were all presidential candidates (Center for Responsive Politics).
xv As noted above, of the seven senators who strongly supported the bill only Senator McCain was on some
of the “Top Twenty” lists and this may have been largely due to his 2000 Presidential campaign.
29

APUBEF Proceedings (October 2003)
HOUSING THE ELDERLY: PROSPECTS AND CHALLENGES
Abbas MamoozadehSlippery Rock University
andJerry Belloit
Clarion University of Pennsylvania
ABSTRACT
Over the past half century several sociological factors have changed that have created significant difficulties in housing the elderly. Since World War II, women have increasing been an active part of the workforce thus leaving less time for them to be caregivers for the elderly. American families have become much more mobile separating the average family from the area of origin. Consequently, there is less family in an area available to share the care-giving responsibilities as the parents and other close relatives age. Demographic issues have also exacerbated the problem. The average expected lifespan has increased significantly thus contributing to both the number of elderly as well as the numbers of persons of advanced age that need help beyond self care. In addition, family formation has been substantially postponed during the same period thus reducing the number of children in a family. Consequently, there are less children to spread the care-giving.
This paper will explore the problems our country faces in housing its elderly population. It will examine the current and future demand for such housing as well as some of the challenges in providing adequate housing product.
INTRODUCTION
One of the most aspired dreams of people across the globe is to have a place of their own that they can call "home". To varying degree this is accomplished by people of different walks of life. The dream of home ownership is also a very basic and a cherished goal among the American people. Due to a number of factors such as Federal assistance, type of construction, mortgage financing, secondary mortgage markets, existence and development of innovative financial techniques, and mortgage insurance about 68 percent of all Americans have been able to achieve this dream. However, the distribution of home ownership is not uniform across different race, age, and income groups. The rest of people reside in rental properties with unique attributes of its own. A vast majority of the renters have been out of the home ownership phenomenon that we have seen in the decade of the 1990s and the prospect of them having home of their own is not so bright in the future. The primary reason for this is the relationship between the income of these people and home prices. There is a significant mismatch between the income of some renters and the home prices. This mismatch is exacerbated by the rapidly rising rents enabling these people from accumulating enough capital to afford a home. These factors combined with income growth that has not kept pace with the
home prices over time is going to make it especially harder for this group of people in achieving their American dream of home ownership.. Moreover, the policies pursued by many municipalities are detrimental to lower income people and their ability to change their home ownership status. Such factors as zoning laws, impact fees, property lot size restrictions, combined with the developers' square footage restrictions make it doubly hard for lower income people from achieving their goal of home ownership.
In the past we have seen population movement from central and urban areas to rural areas and this trend is to continue in the future. Many people are leaving the city life and moving to the rural areas. The reasons are varied but this phenomenon is common to people of different ethnic, income and age groups. This trend will have significant implications for the rural area in terms of affordable and adequate amount of housing, infrastructure to accommodate the new arrivals, transportation and health care. These combined with the fact that people are getting older will make it imperative for the local municipalities to have a coordinated plan to deal with these issues over time. A fragmented approach to dealing with these three problems, housing, transportation, and healthcare, will have significant implications for people and the municipalities in question.
36

APUBEF Proceedings (October 2003)
The emphasis of this paper is an adequate and affordable amount of housing for the elderly population in the rural areas since the rural areas are the least prepared for the significant increase in this segment of the population. This housing problem is not limited to homeownership but rather deals with where these people will be placed. Where and how these people will live are significant issues in light of the fact that elderly population is growing. Today there are 35 million people of 65 years older and this population is expected to reach about 53 million by the year 2020 and then jump to 70 million strong by the 2030 according to the Administration on Aging.(1). One of the greatest challenges facing municipalities it properly housing the 85+ population as their size is expected to grow form the current level of 4.2 million to 8.9 million by 2030.
DISCUSSION
The population of the U.S. has increased over time and today is close to 300 million people. With the increase in population, the population of the people 65+ is also on the rise and is expected to significantly increase overtime as baby boomers will approach the retirement age. In 1900, 65+ accounted for less than 5 percent of total population, Today they account for 12.4 percent and this number is expected to increase to 20 percent by the 2030. One of the goals of people from different income and age groups is to have a place to live, a place that they can call home. Hence one of the concerns is obtaining affordable housing for both the working population and that of the elderly. Affordable housing has become one of the main national issues. Although home ownership stands at about 68 percent and the stock of homes is 120 million, there is a large segment of population that do not have their own home and have to rent a place(2). One would think that there is an adequate of amount housing which are available at reasonable prices, but the reality is different. The lack of affordable housing is wide spread across the nation. It is extremely difficult to rent a place on minimum wage income in any metropolitan area. About 20 million households earn less than $30,000 a year and many renters and the elderly whom are or fixed income pay more than fifty percent of their income toward rent.(3) The problem is not confined to minimum wage earners, but rather it impacts a larger segment of the working population. Lately, the concept of "workforce housing" is assuming greater importance. That is to say people who do the "vital works" in a community ought to be able to afford a home. In "Paycheck to Paycheck: Working families and the Cost of Housing in America", the National
Housing Conference studied the availability of affordable housing in five "Vital occupations". The vital occupations were identified to be janitorial workers, elementary school teachers, police officers, licensed practical nurses, and retail salespeople. The study found that only a very small percentage of these people could afford a small place housing units for no more than 30 percent of their income. The study also concluded that a practical nurse or a police officer with one income in their families could not afford a median priced home in the community that they work. Some workforce can only find affordable housing in the surrounding areas and commuting to work which in itself increases the cost to workers. Availability of affordable housing within a reasonable commuting distance has become more of an issue for business location decision.(4) In other word, in many localities as supply of affordable housing lags demand for such housing, essential workers may not be able to afford to live in communities where they work.
Causes:
The problem has been caused by two events:
A-On one had many rental units that were available to low income people, amongst them low income elderly, through various HUD programs are being taken off the market and hence shrinking the supply of available housing units. About 1.5 million of the section 8 housing units are being taken off the program in the next five years.(3) The reason for this is that the private market rent is greater than what the owners will receive through HUD. There are multitudes of factors contributing to this problem. Rising housing production cost, inadequate public subsidies, restrictive zoning practices, adoption of local regulations that discourages housing development, and general rise in home prices are among the factors for the widening gap between the demand for affordable housing and the supply of it. One of the causes can be attributed to higher real estate prices that we have seen in the last few years.
U.S. Housing Market Condition: Home Prices
New Homes Existing Homes
Current Q Previous Q Current Q Previous Q
Median $189,300 $186,000 $168,900 $161,200Average $241,700 $233,000 $215,600 $204,000
37

APUBEF Proceedings (October 2003)
Source: Department of Housing and Urban Development
Given the real estate prices, it would be difficult for the low income people to afford purchasing a home of their own. It forces them to rent. The higher real estate prices have also pushed the rents up with the average rent being about $900.00. Since a large number of people earn less than $30,000 a year, they have to spend more than one third of income toward rent.
The problem is not confined to minimum and low wage earners as about 40 percent of the elderly people's income is less than $30,000 a year.
Income Distribution of Seniors, 2001
Annual household income Percent of households
Less than $10,000 3.6$10,000-14,999 7.1$15,000-24,999 21.2$25,000-34,999 20.0$35,000-49,000 18.3$50,000-74,999 14.2$75,000 and over 15.6
Source: Administration on Aging, Profile of Older Americans
Elderly Population in 2000 By Age
Age Group Number Percent Total Percent Senior (Millions) Population Population
Total Population 281.4 100Total 65 and older 35.0 12.4 10065-74 18.4 6.5 52.675-84 12.4 4.4 35.385 and older 4.2 1.5 12.1
Source: Administration on Aging, Profile of Older Americans
The population of the elderly is expected to reach 70 million by 2030. If one presumes that the states maintain the same ratio of the elderly, then PA will see its elderly population to increase to 4 million people, double the current amount. For the states with large elderly population regardless of their income levels the costs are significant. In the seminal ruling by the U.S. Supreme Court in the case of Olmstead vs. L.C. (527 U.S.581), The ruled that states must provide services appropriate to the needs of qualified people with disabilities. Many senior citizens will
qualify for this since they many will not be able to perform Activities of Daily Living (ADLs) (8). This will have significant implication for Pennsylvania as a good portion of the elderly have disabilities.
Percent with Disabilities, by Age
Age: With any disability With severe disability
65-69 74 5870-74 58 3875-79 47 2880+ 45 31
Source: Administration on Aging Recommendations:
However, there are many steps that localities can take and implement over time that will alleviate some of the problems.1- Maintain the existing stock of public housing.2- Reduce the exclusionary practices of the past.
The renter low-income elderly will find it increasing difficult to afford a home. However the vast majority of elderly will not have a problem with affordable housing. It is the lower income elderly that will have a problem. According to HUD, In 2001, 80 percent of households headed by older persons were owners and 20 percent were renters. In 2001, the median family income of an elderly homeowner was $23,400 which may not seem significant until one takes into consideration that 73% of older homeowners owned their homes free and clear of any debt. The median value of a home owned by an elderly was $107,000, giving them significant cushion against protracted expenses. For this group of the elderly the potential problem is if they encounter significant healthcare expenses, forcing them to sell their homes in order to pay for the medical expenses.
A second source of the problem that has caused the rents to go up is gentrification of different localities. As different locations go through extensive modifications, they will command higher rent which reduces the supply of the lower rental units, creating a pent up demand for them and causing the owners to opt out of HUD programs.(5)
B- On the other hand, properties that are run down and require extensive capital expenditures to upgrade, and the rental incomes are low, are allowed to deteriorate further and eventually will be taken off the market. But this is slow death and it takes years to become available for other usage.
What Could Be Done?
38

APUBEF Proceedings (October 2003)
The affordable housing problem can be addressed from three different sources: Federal, State and Municipal, and private market. The role of the Federal government in housing market has been established. Through various projects offered by HUD, the federal government has helped the lower income group being able to have access to affordable housing. Programs such as Section 8 and Section 202 have been helpful to many people over time. The private providers are driven by economic motives and cater to those who have the financial resources to pay for the service. The emphasis of this paper is what the states and municipalities do to address this growing problem.
A good percentage of lower-income elderly live in central cities. A number of factors account for this, such as race, good public transportation, availability of social welfare network, and exclusionary zoning practices in the suburbs. However, as more jobs and housing are increasing located in the fringes of cities, greater number of lower-income people are moving to the suburbs. (6)
The Millennial Housing Commission correctly concluded that housing problem is a local issue and any program that is developed must reflect the variations in different localities.(7) As was noted earlier the elderly population is on the rise and more than fifty percent of them live in nine states. Pennsylvania is currently the home to 2 million of the elderly. 3- Streamlined Permitting: The state will require that a "fair share" of affordable housing to be provided in meeting the needs of the locality and process the application with greater expediency.(9)4- Accessory Dwelling Units: This generally can provide affordable rental housing or accommodates elderly parents with housing while maintaining their independence. Usually can be afforded by the higher income children. It also depends on whether local zoning laws permit a second dowelling on the same property or not. I believe that most local zones will restrict this type of dowelling due to set back requirements. However, basements could be fixed up for rentals.5-Development Agreements Master Planned Communities: the developer may design a whole area consisting of affordable housing or part of thereof6- Relaxed Floor-Size Minimums. This only works in lots that are not part of a housing development as the private investors may impose their own requirements on the floor size.
7- "Proportional" Impact fees. The fees should not be a flat rate as the impact on infrastructure might be different on the locality. However, larger homes do not necessary translate into higher impact on the community. It is plausible that people who have larger homes, and hence larger income, may opt to have smaller number of children. I am not certain that there is a positive correlation between the size of the family and the size of the home.8- Affordable Housing Trust Funds. Certain revenues and fees, such as a portion of real estate transfer tax, and penalties on late payments, could be placed in these funds to finance affordable housing in targeted areas.9- Multifamily apartment housing units. These could be used to support the single-family housing values. One has to pay attention to design and the size of these units.10- Inclusionary Housing Requirements: these will require developers of large units of housing to set aside a certain amount, 10 to 15 percent, for affordable housing. One has to guard against what Matthew Mosk(10) recently reported in the Washington Post that localities are waiving this requirement if the developer is willing to pay certain fees. These fees are supposed to go into Affordable Housing Trust funds that could be applied to targeted area. However, this will defeat another goal of the legislators in steering the lower income people to particular area rather than being mixed in more expensive housing areas.11- Housing Enterprise Zone: Designate a targeted area and offering incentives such tax abatement, low interest loans for homeowner-occupier, and no impact fees on new homes.12- Leveraging the Low-Income Housing Tax Credit: The credit is offered the investor in housing for the federal income tax liabilities. Extending the time that is required to receive this credit, will reduce the number of units that are being pulled out of the program and hence enhances the pool of affordable housing in an area.
Clarion and Clearfield Counties:
Clarion County Clearfield County65+ population 15.2% 16.9%Median Age 36.3 39.3Media Age for Urban areas 37 37Did not move 63% 70%Homeownership rate 72% 79%Average Rent/month $363 $333Assisted Rental Units 452 791Subsidized Units 28% 12%Median Household Income $30,770 $31,357Poverty Rate - 1999 15.4% 12.5%
39

APUBEF Proceedings (October 2003)
Source: Center for Rural Pennsylvania
A cursory analysis of the data indicates that although the median household income is low, the low rentals make the two communities very affordable to low - income families. A factor in favor of the Clearfield County is the higher percentage of homeownership which above that of Clarion and the national average. This helps keeping the rent down to an affordable level. The employment levels are similar in the two counties. All in all , neither one seems to have any special problem with affordable housing . This is due to high rate of homeownership and the lower cost of living.
REFERENCES
Administration on Aging, A Profile of Older Americans: 2002, U.S. Department of Health and Human Services, 2003.
Department of Housing and Urban Development, U.S. Housing Market Condition, National Data, HUD, Huduser, 2003.
Bodaken, Michael, The Increasing Shortage of Affordable Rental Housing in America: Action Item for Preservation. Fanniemae Foundation, Housing Facts and Findings, V4, I4, 2003.
Bell, Carol, Workforce Housing: the New Economic Imperative? Fanniemae Foundation, Housing Facts and Findings V4, I2, 2003.
Rengert, Kristopher, Why is Affordable Rental Housing Being Lost?, Fanniemae Foundation,Housing Facts and Findings V4, I4, 2003.
Belsky, Eric and Matthew Lambert,Where Will They Live: Metropolitan Dimensions of Affordable Housing Problems._ Joint Center for Housing Studies, Harvard University, 2001.
The Millennial Housing Commission,_Meeting Our Nation's Housing Challenges, 2002.
Schuetz, Jenny, "Affordable Assisted Living: Surveying the Possibilities", Joint Center for Housing Studies, Jan. 2003.
Nelson, Arthur, "Top Ten State and Local Strategies to Increase Affordable Housing Supply"' Fanniemae Foundation, V.5, I1, 2003.
Mosk, Matthew, "County Finds Developers Waive Low-Income Housing", Washington Post, Tuesday, July 22,2003, Page B0l.
American Housing Survey for the United States in 2001, Current Housing Report, H150/01.
40

APUBEF Proceedings (October 2003)
CRAZY EDDIE(Revisited)
Duane PonkoIndiana University of Pennsylvania
Germain P. KlineIndiana University of Pennsylvania
Jerry JosephIndiana University of Pennsylvania
ABSTRACT
This paper documents the events surrounding the rise and fall of the “Crazy Eddie” electronics empire and details the circumstances that led to the ultimate conviction of Eddie Antar on fraud and racketeering charges. Based upon court releases and other supporting documents, this paper will identify the significant accounting issues that were violated or ignored, thus resulting in one of the major financial scandals to end the 20 th century. These findings will then be compared to the major financial crises that began the 21st century involving several large corporations. The paper will conclude with an analysis of the attempt to regulate accounting practices designed at reducing further occurrences.
INTRODUCTION
When last visited just prior to the end of the century, Crazy Eddie’s electronics retailing empire was on the verge of financial collapse. Shrouded by a cloak of major fraud and deception, Crazy Eddie was identified as one of the major corporate scandals of the 20th century. While lengthy litigation proceedings were attempting to identify and prosecute the principle conspirators in the scandal, the beginning of the 21st century was mired by the exposure of several other corporate scandals: Enron, WorldCom, and Tyco to mention a few of the more high profile cases. This paper will revisit “Crazy Eddie” and document the events leading to its financial downfall. These situations will then be compared to the more recent scandals and conclude with legislative and professional attempts to reduce the likelihood of further occurrences.
REVISITED
Corporate History
Eddie Antar began his electronic empire in 1969 with one small retail outlet that was given to him by his father, Sam M. Antar. In 1984, Eddie took the company public and at its peak had increased to 43 retail outlets with total annual sales exceeding $350 million. In 1987, the company filed for bankruptcy and the last of the original Eddie stores closed in 1989. This miraculous rise and meteoric fall was the
result of fraudulently raising the value of the stock through falsification of inventory records and manipulation of sales and its ultimate discovery. The Antar’s family greed was satisfied by skimming cash receipts and liquidating artificially inflated stock. A closer retrospect of the companies operations will reveal how the fraud was perpetrated.
Corporate Operations
Eddie Antar’s corporate philosophy was founded on an aggressive sales approach and a frenzied advertising campaign. His business plan was rather basic yet opportunistic:
1. “Never let a customer out the door without selling him something.” This tactic frequently resulted in face to face negotiations.
2. Emphasize the customer’s need to purchase an extended warranty. Promoted to provide the customer with added confidence in their purchases, it added to the company’s profits since much of the service work was covered by the manufacture’s plan.
3. Purchase inventory in larger quantities to take advantage of price concessions. (Crazy Eddie would buy in volume at large discounts and then illegally sell to other wholesalers at slightly above his cost.)
4. Promise “anything” to get the customer in the store. (This would provide the
41

APUBEF Proceedings (October 2003)
opportunity for an aggressive sales force to take over and also create an environment for the infamous (and illegal) “Bait and Switch”.
These strategies created increased sales and presented the opportunity for the first of the Antar family’s greedy activities: skimming cash from the daily receipts. Many of the sales transactions were in cash. The cash was separated into three basic piles:
Pile 1: Deposited as store receipts,Pile 2: Paid employees off the books,
Pile 3: Deposited by family members into Israeli accounts during their many trips abroad.
It was estimated that this would amount to $1 for every $5 reported in company earnings and totaled between 3 and 4 million dollars per year. Once the company went public it was imperative to show strong earnings to sustain an increasing price per share. It was through the liquidation of stock at these inflated prices that the Antars satisfied the second of their greedy intentions: Crazy Eddie was able to accomplish this charade by artificially misstating inventory levels and reporting nonexistent sales.
Inventory
Overstating inventory results in higher assets yielding stronger financial ratios; it reduces cost of goods sold creating higher profit. Crazy Eddie was able to accomplish this shell game by implementing several deceptive practices. The company’s warehouse manager said Eddie approached him near the end of the fiscal year 1985, and “asked me to make changes to the inventory figures to show more inventory than was being counted. He said he wanted to do this to make the company look better and I never questioned that.” He increased total inventory by $2 million in 1985 and $6 million in 1986. When the auditors came to make their counts, he climbed onto the product stacks himself, and called the numbers down to the person below. If the auditor insisted on climbing up, the warehouse manager held the auditor’s notebook and marked the counts himself. He used a range of inflationary strategies: counting empty boxes as merchandise, listing cheap merchandise at premium prices, building tall “dummy” columns at the edge of a large shelf and claiming the containers were stacked three or four deep when the rear area was in fact empty. When Sam E., a CPA and former employee of the company’s external audit firm, was appointed as Chief Financial Officer in 1986, he inherited a $3 million deficit and was instructed by
Eddie that an additional $10 million “bump” would be needed for the coming year. The younger and less experienced auditors did not appear to be a match for the devious and deceptive tactics employed by Crazy Eddie’s top management. The auditors were also placed in the awkward situation of auditing previous members of their firm.
Sales
Eddie boasted of the fact that Crazy Eddie had never recorded a loss, so when sales growth had slowed it was necessary to devise a scheme to artificially inflate sales receipts. The sales growth was achieved by an innovative concept devised by Sam Antar which was referred to as “The Panama Pump”. That is the name prosecutors used to describe Sam’s plan for manipulating the family’s international banking connections. “I was surprised, really, that nobody had thought of doing it before”, Sammy admits. “We had been gradually moving the money we skimmed into Israeli banks. So then I learned how to bring the money back using what’s called a double secrecy jurisdiction transaction. Panama today has one of the strictest bank secrecy laws in the world. The country has no currency of its own. Panama used U.S. currency, and Israelis own some of the biggest banks in Panama. Since the banks are in the same network, you can request that both the withdrawal and the new deposit be kept secret. So, we opened accounts in Panama using false names. Using the secrecy laws we transferred a million and a half-dollars from Bank Leumi Israel to the Leumi bank in Panama. Then we had the alias-owned Panama account write drafts payable to Crazy Eddie. Now we had successfully brought the money into the company. The worst that happens is we have to pay some taxes.” Thanks to these funds from Israel, Crazy Eddie, showed a growth rate of 13-14% instead of 4%. The company stock shot to $22/share. This was really a unique situation in business: Skimmed sales, hidden from the IRS, were later “un-skimmed” to increase sales.
Accounting Issues
The first and most basic question asked whenever a major fraud case has been exposed is “How could this have gone undetected?” In the case of Crazy Eddie, the close relationship between the company accountants and the external auditors brought into question the issue of “independence.” Sammy, the Crazy Eddie CEO, received his required CPA experience with Penn and Hardwood: a local firm who handled the audit function. When the company switched to the accounting firm of Main Hurdman prior to going public, they were paying substantial
42

APUBEF Proceedings (October 2003)
fees for a service contract while paying a lesser amount in audit fees. A common problem and concern is when you traditionally have young and inexperienced auditors confronting oftentimes a more experienced and savvy management team. Table 1 summarizes several of the audit failures identified in the Crazy Eddie fraud:
Table 1Recap of Auditor’s Failures
For one year Main Hurdman’s audit fee was $85,000. At the same time, Main was charging millions of dollars to Crazy Eddie for computerizing Eddie’s inventory system. (Eddie later dropped this computerized system in favor of a manual system because it was easier to manipulate the inventory.)
Many of Eddie’s in-house accountants were recruited from the auditing firm.
When the auditors uncovered an incriminating piece of evidence relating to inventory overstatements, they showed it to Eddie. He claimed that an employee was apparently trying to cause trouble because you would have to be very dumb to “cheat” like that.
Auditors left their work papers open in an obvious place. Sam E. then reviewed their working papers to monitor their work.
Suppliers as large as Sony colluded with Eddie to present false information to the auditors.
Auditors failed to note and/or investigate large “rounded” dollar “sales” such as $116,000 draft in a retail store. (This is how the previously skimmed sales were reported.)
Auditors failed to note and/or investigate bogus debit memos of over $20 million.
Eddie was able to prepare for selected inventory audit sites.
Auditors used Eddie’s warehouse personnel to help them “count”.
Auditors failed to note and/or investigate that competitors (wholesalers) sales were put into retail stores for “same store” sales. (A key ratio that financial analysts follow for retailers is the measure of growth in existing stores versus growth resulting from adding new retail outlets.)
Trusted all vendors and wholesalers to be “unrelated” parties.
A brief summary of some of the litigation findings against the principle players in the Crazy
Eddie fraud and racketeering cases is described in Table 2.
Table 2Litigations
Eddie Antar: a.k.a. Crazy Eddie. Pleaded guilty to one count of insider trading in 1996 and was sentenced to nearly seven years in prison. He has since been released and has returned about $63 million to the court for distribution to investors.1 Sam M. Antar: father. Found guilty of insider trading in 1998 and was liable to the Commission for disgorgement and prejudgment interest totaling $57,510,642.2
Rose Antar: mother. Principal partner in R.A.S. Partnership, L.P., a New Jersey limited partnership, and principal partner in S.T. Partnership, L.P., a New Jersey limited partnership, recipient of fraudulent transfer from her spouse. The Court held that the Commission was entitled to summary judgment with respect to transfers.2
Sam E. Antar: cousin/CEO/CPA. Cooperated with prosecutors and the FBI. Sentenced to 6 months in jail and required to complete 1200 hours of community service.
Allan Antar: brother/cash employee. Found guilty of insider trading and was found liable for disgorgement and prejudgment interest totaling $11,911,045.3
Benjamin Kuszer: bother-in-law. Found guilty of insider trading and was found liable for disgorgement and prejudgment interest totaling $3,306,240. 3
A New Era
The beginning of a new century also brought with it a new era of major fraud cases. It seems that each one was bigger than the last. To site a few: Enron, WorldCom, TYCO, Rite Aid, Adelphia. Although each presented their own unique deceptive practices and techniques, the underlying constant was corporate greed. The second of the basic questions asked when fraud is exposed is: “How can these situations be prevented?” Unlike the previous question which wanted to know how these practices could have gone undetected, foresight is always less certain than hindsight. Once a fraud has been documented, it is easy to find weaknesses within the system and attempt to establish new practices and procedures to eliminate a recurrence. The temptation and tendency is to regulate what is known since we are not clairvoyant and cannot with complete assurance anticipate what is unknown. The most
43

APUBEF Proceedings (October 2003)
significant piece of legislation triggered by these scandals has been the Sarbanes-Oxley Act of 2002. Although some of the techniques might differ, the common denominator for each of the corporate scandals was the result of greed and deception initiated by top executives.
A summary of the key provisions contained in the “Act” are presented in Table 3.
Table 3
Title I - Public Company Accounting Oversight Board
Title II - Auditor IndependenceTitle III - Corporate ResponsibilityTitle IV - Enhanced Financial DisclosuresTitle VII - Studies and ReportsTitle VIII - Corporate Fraud and Criminal Accountability Act of 2002Title IX - White-Collar Crime Penalty EnhancementsTitle XI - Corporate Fraud and
Accountability
Note: This information was taken from H.R. 17463.
A primary objective of this type of legislation is to restore confidence in the use of audited financial statements, and while enactment and implementation can attempt to reduce the level of fraud by creating greater obstacles to overcome; it can not eliminate entirely the potential for future cases. To use an analogy: The creation of a Department of Homeland Security and the expenditure of millions of dollars to consolidate several agencies and to develop heightened policies and procedures has given the public an increased sense of security. However, I am confident that no one believes that the threat of future terrorists’ acts will be eliminated. Just as you cannot legislate political and philosophical differences, you cannot legislate moral and ethical corporate actions. At best, it serves as a deterrent.
ENDNOTES
1The Miami Herald, posted Tuesday, August 6, 2002.2Securities and Exchange Commission: Litigation Release No. 16817/December 4, 2000.3Securities and Exchange Commission: Litigation Release No. 16544/May 9, 2000.
Note: This information is intended to provide a brief summary of some of this litigation findings involving several of the principals in the Crazy Eddie fraud and is not intended to be a complete and final documentation of all the criminal and civil proceedings.
44
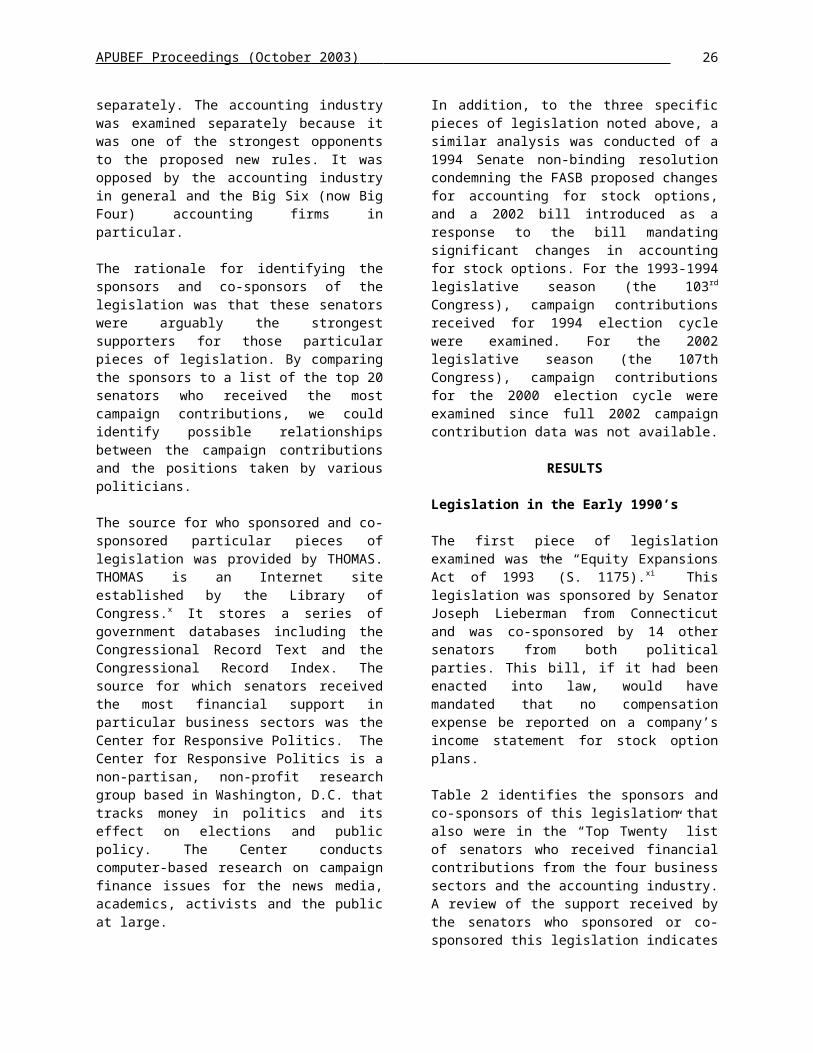
APUBEF Proceedings (October 2003)
PENNSYLVANIA JOURNAL OF BUSINESS AND ECONOMICS: DEVELOPMENTS AND DIRECTION
Kevin J. RothClarion University of Pennsylvania
ABSTRACT
The Pennsylvania Journal of Business and Economics serves a diverse group of faculty and professionals with a common interest in the business discipline. While contributions are encouraged on a regional and national scope, the primary target of the Journal continues to be placed on the business and economics faculty from the fourteen Universities representing the State System of Higher Education in Pennsylvania. In particular our emphasis is towards members of the Association of Pennsylvania University Business and Economics Faculty (APUBEF).
The journal has recently seen a transition in Editors from Carole Anderson of Clarion University of Pennsylvania to Dr. Jonathan Kramer from Kutztown University. Dr. Kevin J. Roth of Clarion University continues to serve as co-editor. This paper describes recent changes and enhancements to the publication process surrounding the journal. It addresses both the initial and final submission guidelines for submission of an article. In addition, the paper highlights editor expectations and identifies several emerging issues related to the Pennsylvania Journal of Business and Economics. In particular, several areas of journal administration are identified and discussed to continue the improvement and quality of manuscript review, facilitate communication flow among participants, and direct efforts towards continuous quality improvement of the journal.
PENNSYLVANIA JOURNAL OFBUSINESS AND ECONOMICS
The Pennsylvania Journal of Business and Economics is published by the Association of Pennsylvania University Business and Economics Faculty (APUBEF). The target audience consists of but is not limited to business or business related faculty and professionals from the fourteen SSHE schools including Bloomsburg, California, Clarion, Cheney, East Stroudsburg, Edinboro, Indiana, Kutztown, Lock Haven, Mansfield, Millersville, Shippenburg, Slippery Rock, and West Chester. The journal seeks articles from a wide diversity of business topics including Pennsylvania issues and pedagogical insights in both conceptual and empirical forms. The current movement is towards expanding submissions and readership beyond the State System of Higher Education in Pennsylvania.
Editor Changes
Dr. Kevin J. Roth, Professor of Administrative Science at Clarion University will continue his role as co-editor. He will coordinate all matters relating to the publication process surrounding the journal. Dr. Jonathan Kramer, Professor of Finance at Kutztown University has assumed the role of co-editor and coordinates the journal submission and review process. The editors would like to thank Dr.
Carole Anderson from Clarion University for her work as past editor supporting the continued development and improvement of our publication. Discussion is under way to add an associate editor who will have responsibility to screen papers both in terms of specific content and presentation style and clarity. It is the hope of the executive board that this individual will be in place for the next publication of the journal.
Continuing the Expansion and Formalization of the Editorial Review Board
The editors will continue the past practice of moving towards inclusion of one participating member from each of the fourteen State System schools to serve on a formal editorial review board. It is the intent to move towards the inclusion of additional Colleges/Universities who are actively participating in APUBEF and our annual conference. The overall objective is to create a diverse review board both in terms of geographic location and interest area.
Review Board responsibilities continue to include receiving a journal submission from the editors and personally reviewing or distributing the paper to an appropriate colleague at that school. The intent is to try to match the journal content with a reviewer that has expertise in that subject area. Members will thus be responsible for coordinating the review process for a given paper and ensuring the process is completed in a timely fashion (4 weeks). Reviewers will
45

APUBEF Proceedings (October 2003)
ultimately be responsible for submitting review materials to the editors. Throughout the review process, all correspondence with the author(s) will be handled directly by the editors.
In addition, at the beginning of each fall term, the editorial board members will provide an updated list of business or business related dean, chair, and faculty listings for that particular school. Each year at the APUBEF conference, members will be able to provide input from their colleagues. Members will also coordinate posting of requests for papers each year. Editorial board members will serve annual terms and be requested each fall to continue or recommend a colleague from their institution to serve. Members will be listed in the journal as the “editorial review board” beginning spring of 2004.
Cabell’s Directory
The journal continues to appear in Cabell’s Directory accenting the commitment to maintaining a journal of the highest possible quality. This directory listing not only helps to ensure such quality but promotes a broader recognition of our publication. Exhibit-A provides specific information on the journal as it that appears in the current edition of Cabell’s. The next edition should reflect changes and enhancements recently made to our publication.
Initial Submission Requirements
Authors interested in submitting an article must provide an original and three copies of their work that include an abstract but does not include author information. A separate page should be submitted with complete information on the author(s). All papers will continue to be subject to a double blind review process and review by the editor(s). The board has approved a twenty dollar submission fee to handle administrative costs associated with the publication.
First Submission Requirements
Authors will be notified directly from the editor(s) upon acceptance or necessary revision of a paper. Any final recommendations made by reviewers/editors shall be incorporated into the final document submission. Final submissions generally will follow APA guidelines and submitted on disk along with a hard copy. The requirements for final submission are shown in Exhibit-B. In addition to the final submission, an author information form shall be submitted. This form is shown in Exhibit-C.
Article Review Process
The PJBE exists due to the voluntary contributions of many individuals. We will continue to rely on volunteers to coordinate a double blind review process for each paper. Because we exist as an instrument specifically dedicated to serving APUBEF members, we suggest that reviews be positive where possible and comments be directed toward producing a publishable product. While comments can be made directly on a submitted paper, we need to continue the use of the completed review forms to provide consistent and sufficient feedback to the authors. Any comments along with the review form will be anonymously sent directly to the author. A copy of the reviewer evaluation form is provided in Exhibit-D.
Outcomes
The editors anticipate several direct benefits from the changes and enhancements identified above. These modifications are specifically designed to facilitate more efficient and effective communication between editors and reviewers, review board members and reviewers, editors and authors, and editors and the general target audience. In terms of the review process with the proposed editorial board structure, we anticipate more concise matching of papers with expertise and improved turn-around time for our authors. The intent is to achieve increased participation in the process and the publication of the journal itself (editors, authors, editorial review board, reviewers, book review authors, invited article authors, etc.). We continue to move towards the consistent publication of one to two journals each year with an emphasis on continuous quality improvement.
46

EXHIBIT – ACABELL’S GUIDELINES
Pennsylvania Journal of Business and Economics
ADDRESS FOR SUBMISSION: Kevin RothCarole AndersonCo-EditorsPennsylvania Journal of Business and EconomicsClarion University of PennsylvaniaClarion, PA 16214-1232USAPhone: 814-393-2055Fax: 814-393-1920E-Mail: [email protected]:Address May Change:
CIRCULATION DATA:Reader: AcademicsFrequency of Issue: 2 Times/YearCopies per Issue: Less than 1,000Sponsor/Publisher: Association of Pennsylvania University Business and Economic FacultiesSubscribe Price: 0.00 US$ No Reply
PUBLICATION GUIDELINES:Manuscript Length: 6-10Copies Required: OneComputer Submission: Yes, if acceptedFormat: Corel WordPerfect 8.0 or WordFees to Review: 0.00 US$Manuscript Style:
American Psychological Association
REVIEW INFORMATION:Type of Review: Blind ReviewNo. of External Reviewers: 2No. of In House Reviewers: 1Acceptance Rate: 50%Time to Review: 2-3 MonthsReviewers Comments: YesInvited Articles: 0-5%Fees to Publish: 0.00 US$
MANUSCRIPT TOPICS:Accounting Theory & Practice; Auditing, Cost Accounting, Econometrics; Finance; Industrial Organization; Insurance
MANUSCRIPT GUIDELINES/COMMENTS:The APUBEF Journal is a refereed journal aimed at publishing the papers of faculty from the business and economics disciplines within the State System of Higher Education Universities in Pennsylvania, or from business and economics faculty at comparable institutions from within Pennsylvania and from surrounding states. While theoretical works are encouraged, most published papers are empirical or pedagogical in nature.
MANUSCRIPT STYLE:1. Papers must be submitted on a 3.5" micro-computer disk using Corel WordPerfect or Microsoft Word. Printer setup should
be HP Laserjet. A high-quality hard copy of the paper must accompany your disk.
2. Use 10 point Times New Roman font for the body of the paper and all headings including the heading for references. Use 1" margins all around.
3. Single space the text. Double space between paragraphs and indent the first line five spaces using the tab key. Use full justification.

4. Spell-check before sending the paper and correct all grammatical errors. Also, edit the paper to address the comments and suggestions of the reviewers and editors.
Specific Requirements1. Start the manuscript with the full title, centered in capitals, bold print. Following a space, each author and university should
be identified, one author per line. No titles (Dr., Mr., Mrs., etc.) are to be used, nor should rank be indicated. Please, no fancy type-styles other than ones specified.
2. After the last author’s name and affiliation, double space, center and type the heading abstract, bold and all caps. All papers must have an abstract of no more than 150 words, which provides a brief synopsis of the paper.
3. The next heading is Introduction, bold and all caps. Double-space before and after. All major headings MUST follow this format. Secondary headings MUST be in bold print, left justified, first letter capitalized then lower case, with a space above and below each heading.
4. Mathematical expressions and notations should be used judiciously and all symbols should be identified.
5. Tables should be arranged sequentially in the order in which the tables are first mentioned in the text and placed at the end of the manuscript. Type the word Table and its arabic numeral flush left at the top of the table, double space, then type the table title flush left above the table. The explanatory notes to a table such as probability tables, explanations of acronyms, etc. should appear below the table. Use the same 10 point Times New Roman font as used in the text and the tab function to construct the tables. If a “camera-ready” table is to be used, send the original and not a reduced copy for incorporations in the journal.
6. Figures (such as graphs, drawings, photographs, and charts) must be consecutively numbered in arabic numerals, with their captions in the order they appear in the text. All illustrations must be camera-ready; photographs must be of professional quality, and drawings must be prepared in ink. Illustrations should be identified on the back in light pencil with the name of the author and the figure number.
7. Footnotes and endnotes are permitted, but not encouraged. In most cases, the material they contain can be incorporated in the text. If footnotes are used, use the automatic footnote function (control F7) and specify Time New Roman 10 point font for their text. Endnotes should be same 10 point Times New Roman font as the text and placed after the references.
References1. When citing references in the text, please use parenthesis, author’s named, comma and data of publication, i.e., (Wilson,
1996. For up to three authors, cite each and use the “&” for ‘and,” i.e., (Dawes, Dowling & Peterson, 1992). For more than three authors, use the surname of the first author followed by “et al.” comma and the year, i.e., (Cravens et al., 1988). Multiple reference citations in a parentheses should be arranged alphabetically and a semicolon used to separate them, i.e., (Cravens et al, 1988; Dawes, Dowling & Peterson, 1992; Wilson, 1996). Text citations must correspond accurately to the references in the reference list.
2. References should be listed alphabetically at the end of the manuscript. References with the same authors in the same order are arranged according to the year of publication, the earliest first.
3. An American Psychological Association format is used for the references.
For a journal article:Buzell, R. D., Gale, B. T., & Sultan, R G. M. (1975). Market share - a key to profitability. Harvard Business Review. 75-1, 97-106.
For a proceedings article:Gronroos, C. (1983). Innovative marketing strategies and organization structures for service firms. Emerging Perspectives on Services Marketing. Berry, L. L., Shostack G. L., & Upah, G. D. eds. Chicago, IL: American Marketing Association. 9-21.
For a book:Czepial, J. A. (1992). Competitive Marketing Strategy. (258-263) Englewood Cliffs, NJ: Prentice-Hall.
For more information and examples please refer to the Publication Manual of The American Psychological Association.

EXHIBIT - BPENNSYLVANIA JOURNAL OF BUSINESS AND ECONOMICS
MANUSCRIPT STYLE
1. Papers MUST be submitted on a 3.5" micro-computer disk using Corel WordPerfect or Microsoft Word. Printer setup should be HP Laserjet. A high-quality hard copy of the paper MUST accompany your disk.
2. Use 10 point Times New Roman font for the body of the paper and all headings including the heading for REFERENCES. Use 1" margins all around.
3. Single space the text. Double space between paragraphs and indent the first line five spaces using the tab key. Use full justification.
4. Spell check before sending the paper and correct all grammatical errors. Also, edit the paper to address the comments and suggestions of the reviewers and editor.
SPECIFIC REQUIREMENTS
1. Start the manuscript with the full title, centered in capitals, bold print. Following a space, each author and university should be identified, one author per line. No titles (Dr., Mr., Mrs. etc.) are to be used, nor should rank be indicated. Please, no fancy type-styles other than ones specified.
2. After the last author's name and affiliation, double space, center and type the heading ABSTRACT, bold and all caps. All papers MUST have an abstract of no more than 150 words, which provides a brief synopsis of the paper.
3. The next heading is INTRODUCTION, bold and all caps. Double space before and after. All major headings MUST follow this format. Secondary headings MUST be in bold print, left justified, first letter capitalized then lower case, with a space above and below each heading.
4. Mathematical expressions and notations should be used judiciously and all symbols should be identified.
5. Tables should be arranged sequentially in the order in which the tables are first mentioned in the text and placed at the end of the manuscript. Type the word Table and its arabic numeral flush left at the top of the table, double space, then type the table title flush left above the table. The explanatory notes to a table such as probability tables, explanations of acronyms, etc. should appear below the table. Use the same 10 point Prestige Elite font as used in the text and the tab function to construct the tables. If a "camera-ready" table is to be used, send the original and not a reduced copy for incorporation in the journal.
6. Figures (such as graphs, drawings, photographs, and charts) must be consecutively numbered in arabic numerals, with their captions in the order they appear in the text. All illustrations must be camera-ready; photographs must be of professional quality, and drawings must be prepared in ink. Illustrations should be identified on the back in light pencil with the name of the author and the figure number.
7. Footnotes and end notes are permitted, but not encouraged. In most cases, the material they contain can be incorporated in the text. If footnotes are used, use the automatic footnote function (control F7) and specify a Times New Roman 10 point font for their text. End notes should be in the same 10 point Times New Roman font as the text and placed after the references.
REFERENCES
1. When citing references in the text please use parenthesis, author's name, comma and date of publication, i.e., (Wilson, 1996). For up to three authors, cite each and use the "&" for "and", i.e., (Dawes, Dowling & Peterson, 1992). For more than three authors, use the surname of the first author followed by "et al." comma and the year, i.e., (Cravens et al., 1988). Multiple reference citations in a parentheses should be arranged alphabetically and a semi-colon used to separate them, i.e., (Cravens et al., 1988; Dawes, Dowling

& Peterson, 1992; Wilson, 1996). Text citations must correspond accurately to the references in the reference list.
2. References should be listed alphabetically at the end of the manuscript. References with the same authors in the same order are arranged according to the year of publication, the earliest first.
3. An American Psychological Association format is used for the references.
For a journal article:
Buzzell, R. D., Gale, B. T., & Sultan, R.G.M. (1975). Market share - a key to profitability. Harvard Business Review, 75-1, 97-106.
For a proceedings article:
Grönroos, C. (1983). Innovative marketing strategies and organization structures for service firms. Emerging Perspectives on Services Marketing, Berry, L.L., Shostack G.L., & Upah, G.D. eds. Chicago, IL: American Marketing Association. 9-21.
For a book:
Czepiel, J.A. (1992). Competitive Marketing Strategy. (258-263) Englewood Cliffs, NJ: Prentice-Hall.
For more information and examples please refer to the Publication Manual of the American Psychological Association.

APUBEF Proceedings (October 2003)
EXHIBIT - CAUTHOR INFORMATION FORM
Information is needed to provide a footnote about each author of the form:
Timothy L. Wilson, Case-WRU, is Professor of Marketing at Clarion University where he teaches Industrial Marketing and Graduate Marketing Courses. His present research interests primarily include the marketing of business services and after-sales services. This work was supported in part by a university sabbatical during the 1996 spring semester.
Thus, please provide for each author:
Author's Name -
Position -
University from which highest degree was obtained -
Present research interests -
Courses commonly taught -
Funding Source for this research (if applicable) -
62

APUBEF Proceedings (October 2003)
EXHIBIT – DREVIEWER EVALUATION FORM
EDITORIAL OFFICE OF THE PENNSYLVANIA JOURNAL OF BUSINESS & ECONOMICS
Paper Number Date Mailed for Review Reviewer Number Date Review Needed
Circle the appropriate number by each evaluation statement that is relevant to this manuscript. Omit the statements that are inappropriate. Please add other items that would be appropriate in evaluating this manuscript. After completing all appropriate statements, calculate the “average” in the space provided.
Strongly Strongly Agree Disagree
With reference to the subject of this manuscript:
1. The subject is conceptually and technically sound. 7 6 5 4 3 2 1
2. The subject of the manuscript is timely. 7 6 5 4 3 2 1
3. The subject of the manuscript is important. 7 6 5 4 3 2 1
4. Treatment of the subject is innovative. 7 6 5 4 3 2 1
5. The subject would be interesting to PJBE readers. 7 6 5 4 3 2 1
With reference to the overall presentation:
6. The manuscript is well written. 7 6 5 4 3 2 1
7. The purpose and objectives of the manuscript are clear. 7 6 5 4 3 2 1
8. The purpose and objectives of the manuscript aresuccessfully achieved. 7 6 5 4 3 2 1
9. The manuscript is well organized. 7 6 5 4 3 2 1
With reference to the presentation of the subject material
10. The manuscript is practically-oriented, or highlytheoretical. It is high quality research. 7 6 5 4 3 2 1
11. The manuscript if appropriate for the PJBE (useful andunderstandable to business and economics). 7 6 5 4 3 2 1
12. The manuscript indicates a thorough understanding ofprevious research and/or publications in this area. 7 6 5 4 3 2 1
13. The manuscript indicates a thorough understanding ofcurrent practices in this area. 7 6 5 4 3 2 1
14. Adequate supporting data and/or examples areproperly presented. 7 6 5 4 3 2 1
61

APUBEF Proceedings (October 2003)
15. The manuscript indicates how findings can be used inbusiness practices. 7 6 5 4 3 2 1
16. The manuscript contributes to the reader’s understandingof the subject as it applies to business. 7 6 5 4 3 2 1
17. The manuscript contributes new information to thebody of knowledge on business or economics. 7 6 5 4 3 2 1
For Quantitative Manuscripts Only
18. Statistics used are appropriate. 7 6 5 4 3 2 1
19. The level of presentation is appropriate to the PJBE,i.e. not overly statistical or complex. 7 6 5 4 3 2 1
20. Sampling methodology is sound. 7 6 5 4 3 2 1
21. The research methodology is conceptually andtechnically sound. 7 6 5 4 3 2 1
22. Findings are appropriate given the research. 7 6 5 4 3 2 1
23. Findings are clearly presented. 7 6 5 4 3 2 1
Other statements (that help with evaluation:
24. 7 6 5 4 3 2 1
25. 7 6 5 4 3 2 1
Sum of all scores from above ratings:
Number of statements evaluated:
Average score (sum of scores/number of statements)
What is your overall evaluation of the paper? (Note: Acceptance with revisions will require further review by editorial board members or editor.)
Accept as it
Accept with minor suggested revisions
Reject in its present form, but note manuscript has potential
Reject
Send your written comments and this form (an original and one copy of each) to me. Your critique should be constructive (civil) and in sufficient detail so that the author can follow your line of reasoning. It would be helpful if the critique were related to specific evaluation statements (where applicable). Your comments should include an overall summary of your evaluation, strengths and weakness of the manuscript, and suggested changes. The intent of the comments is to give the editor a more complete appraisal of the manuscript and to provide useful information to the author for use in revising the manuscript. One copy of the evaluation form and comments will be sent to the
61

APUBEF Proceedings (October 2003)
author without your identity. DO NOT IDENTIFY YOURSELF BY NAME ON THIS FORM OR IN THE COMMENTS. Please return this form with your comments.
61
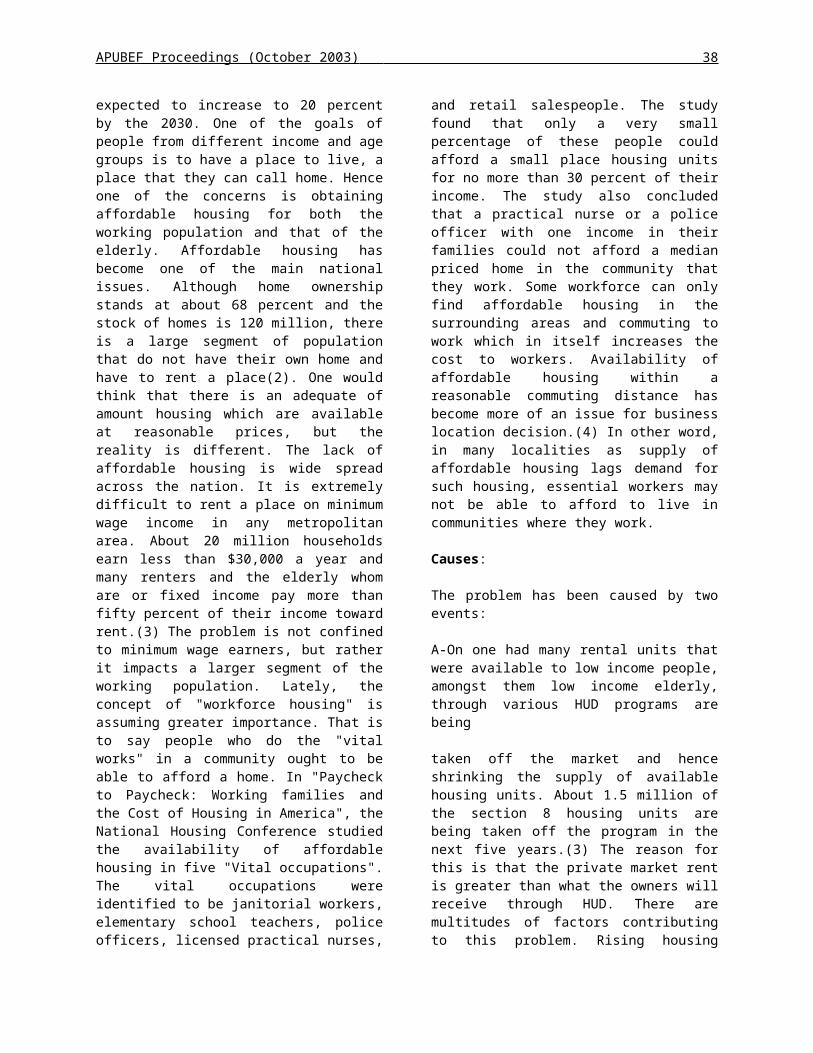
APUBEF Proceedings (October 2003)
TRANSFORMATION OF SUPPLY CHAIN MANAGEMENT CHALLENGES INTO BUSINESS OPPORTUNITIES
Germaine H. SaadWidener University
ABSTRACT
This paper discusses main challenges faced in managing supply chains in general, and those of E-Business environments in particular. Conceptual extensions and a guiding framework are proposed. Based on this framework, solutions are developed which help overcome main challenges faced in practice. Special emphasis has been given to the challenges resulting from uncertainty, complexity, and information systems.The contribution thought is two folds: first, current challenges faced in managing supply chains are analyzed and categorized conceptually, according to their orientation. Secondly, a general framework to guide management practice is developed, and used to generate solutions that help overcome many of those challenges. The solutions proposed comprise both proactive and reactive strategies, and implementation guidelines.
Key Words: Supply Chain Management, Supply Chain Strategies, Management Framework.
61
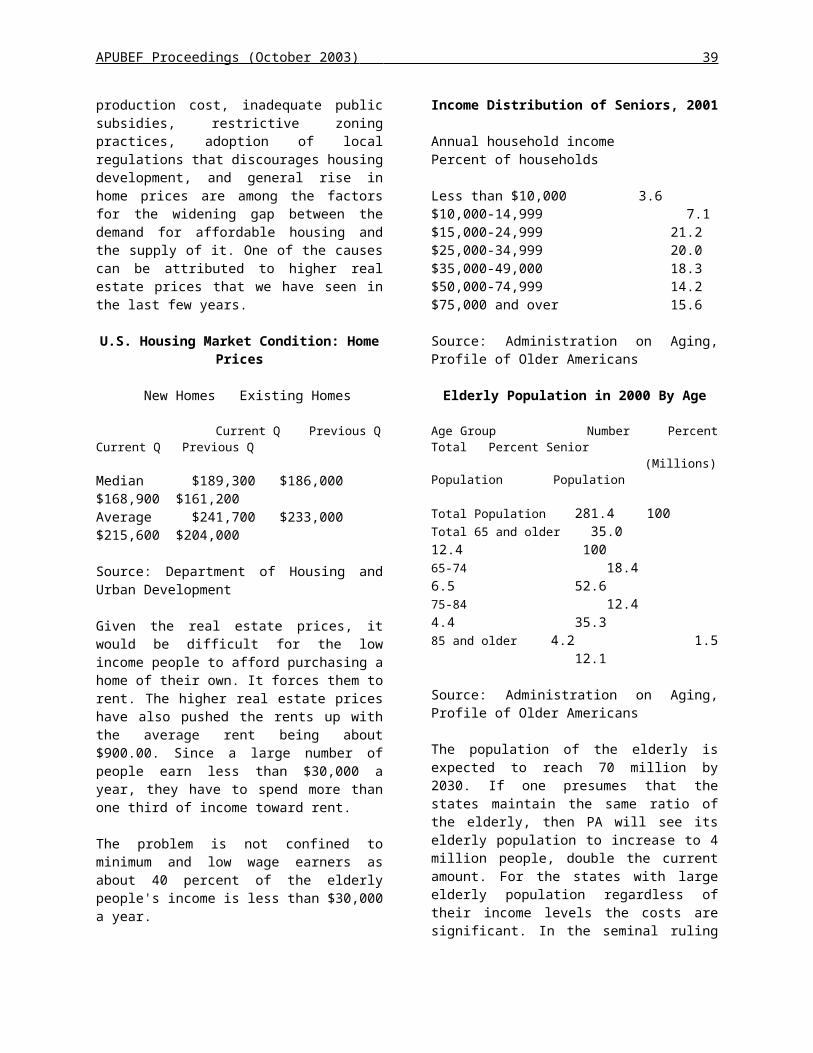
APUBEF Proceedings (October 2003) 62

APUBEF Proceedings (October 2003)
INTRODUCTION
Accelerated competition, continuous change in production and information technologies, pressure to reduce cost and penetrate new markets, are all factors that resulted in manufacturers spreading their operations worldwide, in many cases leaving them with more assets outside their own countries, and stretching further the supply chain (SC). A recent survey by Deloitte & Touche of 500 companies from USA and Europe conducted this summer revealed that despite globalization, most supply chain optimization is local, and focuses only on individual functions, facilities (such as plants and warehouses), services, and countries. Furthermore, this survey revealed that, key priorities as flexibility and customer service are becoming more difficult to achieve. Industries represented in this survey include: aerospace & defense, automotive, medical equipment, consumer products, process & chemicals, high technology, telecommunications, metal fabrication, and others.
This paper addresses the challenges and complexities faced in managing supply chains in general and those of global nature in particular. Our focus will be on how to overcome such challenges in a way that advances total supply chain performance, not just that of a particular firm or activities in the chain. A main premise adopted is that, supply chain success is measured in terms of the whole SC surplus, i.e., the total value added to all partners in the chain.
It should be noted that a focus on the profitability at only individual stages, may lead to reduction in the overall SC profits. SC performance is determined by two main drivers, efficiency and responsiveness, e.g., Shopra and Meindl (2004). Efficiency translates into reduction in cost. Yet, responsiveness is multi-dimensional. It includes satisfying a wide range of qualities required, speed of response to customer needs and demands, providing a wide product varieties to meet different customer’s requirements, using wide range of distribution channels, with increased service levels and rate of innovation. Different customer segments, and market places require different responsiveness and have different needs, and dynamics. This results in increasing the complexity faced in practice.
Our approach to overcome the challenges faced in managing SC and improving its performance, will be guided by the following main principles:
1. The only entity that puts money into a SC is the end customer.
2. Shifting costs and/or transferring problems along the chain will not advance SC performance, nor its firms’ long range competitiveness. Hence, emphasis must be only on win-win solutions and outcomes.
3. The core of SCM is about maximization of the total value-added to all partners in the chain. Relevant measures here include: consumers’ surplus, i.e., the difference between what consumers are willing to pay and the actual price they paid; producer’s surplus, i.e., the difference between what producer’s charge as price and the actual costs of the product; in addition to the intangible values and those hard to quantify attributes, as service before and after sale, quality, speed of delivery, etc…
4. Performance of a SC is determined by the weakest link in that chain. Hence, a focused effort to improve such link will result in improving the whole SC. Every Partner in the chain should contribute to strengthening of the weakest node, as this means a win-win outcome for all.
5. SC performance is governed by both the “intra-firm”, and the “inter-firm” interfaces encountered.
6. Any organization has to put its own house in order first, before trying to fix the others’. Hence, a highest management priority should be placed on the Internal Supply Chain Management (ISCM), followed by SRM and CRM, i.e., Suppliers’ Relationship Management; Customer Relationship Management, respectively.
7. Principle 6 above also implies that effectiveness of ISCM is a necessary condition for advancing SRM, CRM, or both.
Conceptual characterization, and analysis of the main challenges faced in managing supply chains will follow in Part II. A general framework for dealing with these challenges is introduced in Part III. This framework is then used to provide solutions and actions in Part IV. We then conclude in Part V, by a summary and open
questions for future research.
CURRENT CHALLENGES
Supply Chain Management comprises many activities and interfaces, as illustrated in Figures 1 and 2.
Challenges faced in managing supply chains can be classified into four main categories, as illustrated in Figure 3.
62

APUBEF Proceedings (October 2003)
Accumulated Operational Risks and Uncertainty
These include:
a. The “Bullwhip” effect. This results from the fact that demand volatility a company faces increases the further upstream it resides in the SC. For example PC manufacturers face less demand volatility than semiconductor manufacturers, and those in turn face less demand volatility than those faced by the semiconductor Equipment Suppliers. This effect is denoted by some as the first law of supply chain dynamics, Fine (2000).
b. Supply and Demand internal imbalance. This includes inconsistency between demand and supply of the same product at any point in the chain, (e.g. Levi, et..al., 2001; Lee, 2002) as well as, the inconsistency between demand rate of a product and the flow of supply of components and raw materials used for its production.
c. Market- Based risks, as those triggered by competitors’ moves. For example: drastic reduction in price by some competitors, or aggressive advertising campaigns, or innovative customer service offerings.
d. Industry-Based risks, including safety, health, and environmental hazards (SHE), Kleindorfer (2001). Such risks are significant in the process and chemical industries, iron & steel, and other hazard polluting activities.
Behaviorally-Based Challenges
Example of these include, achieving appropriate balance, and/or form of:
a. Command vs. coordination.b. Control vs. cooperation.c. Trust vs. collaboration, see for example (Kumar
1996; Saad 2001; Saboth, et.al. 2002).d. Alliances.e. Creativity.
Continuous Complexity
This is resulting from:
a. “intra-firm” interfaces.These include conflicts among the functional policy areas within a firm, e.g., conflicts between marketing, production, and finance, e.g., Saad (1990).
b. “inter-firm” interfaces.These include goal conflict among different firms who are partners in the chain. For example, conflicts between a manufacturer and its supplier on one hand, and between the manufacturer and its distributors on the other hand.
c. “time-based” challenges; i.e., those associated with balancing both the short range and long range goals and outcomes. It should be noted that in many instances achieving long range growth and sustainable competency require sacrifices in short range profits. Relatively high investments will be dedicated to R&D projects, where profitability is not likely to occur in the short run. Saad, et. al. (2000).d. “information-based” challenges. These include all the difficulty associated with accessing the right information, at the right time, to be used effectively, by all parties along the chain. It should be noted that, while ERP, and computerized DSS contribute significantly in this vain specially in recent years; yet they resulted in negative side effects as well. At least relating to the issues of information incompatibility, and information overload. e.g., (Handfield 2001; Sengupta 2001). These will be addressed later in more detail.
e. The “interaction effects”, i.e., those resulting from the interaction among all affecting factors and parameters involved.
The more decision makers are able to understand this type of effects the better-off they are in terms of designing the appropriate schemes to generate the desired outcomes, both proactively, and reactively.
Dominant Strategic Challenges
Example of these:
a. Technological change and its corresponding diffusion and spin-off effects along the chain. This reflects the amplification of the clock speed of the rate of change in technology as one moves further downstream in the SC. This effect is denoted by some, as the second law of SC dynamics (Fine, 2000, p. 217). For example PC manufacturers experience shorter product life cycle than the semiconductor manufacturers. Those in turn experience faster clock speed than the semiconductor equipment manufacturers.
b. Fragmented and incomplete performance measurements, Saad (2001). This results from conflicting goals among the different partners in the chain, and a focus on only their internal environment. Thus, no coherence exists in their adopted measures of
61

APUBEF Proceedings (October 2003)
performance. This represents a key challenge and a real stumbling block in practice which must be removed to be able to cooperate, align, and collaborate effectively among all SC partners for the betterment of the total SC surplus.
c. Globalization. The main challenge here is how to achieve the right balance between global coordination on the one hand, and local decentralization, on the other hand.
d. Supply Chain design. This constitutes a main determinant, if not the most important one, for competitiveness, and sustainable growth. It relates to what capabilities along the value chain to invest in, and develop internally, and, which should be provided by external sources. This includes make vs. buy decisions, logistics, and transportation policies, and modes.
A GENERAL FRAMEWORK
In order to overcome the challenges discussed above, a general framework to guide this effort is now developed.
The framework we propose consists of two main dimensions, each of which will be used as a basis for generating pertinent solutions and action guidelines.
The first dimension is ‘proactive’. It emphasizes preventive schemes of what can be done to avoid specific challenges or prevent their occurrence, as possible. For those unavoidable challenges, the focus here would be on mitigating their negative consequence, and transforming them into business opportunities and/or increased value to customer. The second dimension is ‘reactive’, i.e., it emphasizes readiness of the supply chain. The focus here is on how to increase the capacity of a Supply Chain to respond to the challenges faced individually, and collectively. This involves building strong Supply Chain enablers to absorb, overcome, or, transform the challenges faced to more benefits and higher value-added to Supply Chain partners. This dimension in turn is driven by two main factors, namely, the ability and the willingness, of all parties involved to contribute to such realization.
This dual dimensional framework is now used to develop appropriate strategic directions, and action guidelines to deal with the challenges faced.
SOLUTIONS AND GUIDELINES
Drawing from the main challenges faced identified in Figure 3, and making use of the framework proposed above, specific solutions are now discussed. We shall focus our attention on three main challenges, those related to: operational uncertainty, complexity, and information.
First: Operational Risk and Uncertainty To overcome operational problems resulting from uncertainty and volatility of demand which increase moving upward in a SC, and those resulting from unbalanced supply and demand at the firm level, and across the chain, solutions here may include:
1) Preemptive Schemes, as
a. Postponment . This is particularly effective to overcome uncertainty of demand. Producing first the relatively certain demand items, and the certain components of the uncertain demand items. Hence, postponing the production of those uncertain parts as possible to minimize the risks of overproduction and overproduction of those items. Thus, reducing the costs of both inventory, and lost sales, simultaneously.
b. Risk pooling. This can be realized by using central warehousing. This would result in areas experiencing overproduction will compensate for the underestimate of demand forecasts of other areas for the same product. Thus increasing the accuracy of total demand forecast, as well as the responsiveness level to the different market needs.
c. Dynamic Pricing. This can be practiced in different forms, e.g., i. Charging different price per unit for the same item, in different markets, and/or for different customer segments. ii. Peak load pricing by different seasons. iii. Charging a higher price, or a premium over the regular price to fulfill higher responsiveness requirements from customers (for speed, special packaging, and the like).iv. Offering quantity discounts.
d. Encourage forward buying, and other mutually beneficial contractual agreements. These include contracts between the producer and distributors on one hand, and, between the producer and its suppliers on the other hand. For more detail, see Cachon (2002).
61

APUBEF Proceedings (October 2003)
e. Adoption of ERP systems. This would reduce lead time, and increase speed and responsiveness to market needs.
f. Making use of ERP, and IT capabilities to increase flexibility of both products and processes. Thus, transform the uncertainty challenge to more system’s agility and power, in terms of ability to capture more market share, and respond to wider market needs.
2) Responsive Solutions. These include:
a. Information sharing & coordination mechanisms. These would reduce the bullwhip effect, and goal conflict ‘s impact, and increase the overall SC sinergy, and adaptation to change.
b. Increase product modularity and commonality. This would maximize speed and scope of responsiveness to customer demand, as well as the agility to counter uncertainty effect. Shopra, et.al. (2004).
c. Increase product differentiation at minimum costs. Commonality, of products’ components helps tremendously in achieving this goal.
d. Mass customization. This can be achieved by combining b and c above.
It should be noted that this strategy results in minimizing risk, and maximizing both economies of scale and economies of scope, simultaneously. Example of such effective solution is practiced at Dell corporation.
e. Cross docking. By making use of IT and E-Business in coordinating the schedule of suppliers’ deliveries to coincide with pick-ups of the retailer’s trucks for distribution to the different stores. This strategy has been initiated at Wall-Mart corporation, and proved great success in not only minimizing inventory costs, and transportation costs - by making use of full truck loads – but also in maximizing the speed of response to customer needs at the different store locations, and increased customer service simultaneously.
Second: Complexity Challenges
Effective use of IT to achieve SC visibility is essential to overcome many complexity challenges. Full and timely information exchange, within a firm, and among the SC partners is a powerful tool that can be leveraged to using welfare economics principles, both proactively and reactively as follows:
1) Proactively; apply the 80/20 Pareto rule, where a few significant factors determine the majority of the outcome achieved. By focusing only on these significant few factors, management can maximize the total SC surplus realized, with least effort.
2) Reactively; seek the most efficient frontier. This is realized when no party can be better off any more without other(s), being worse-off. It must be noted here that, SC visibility facilitates goal alignment, build trust, and other necessary conditions for reaching this equilibrium frontier.
It should be noted that IT and E-Business are very useful enablers in practice. Yet, they result in other related challenges that deserve special attention in their own right. This is addressed next.
Third: Information Challenges
While the use of IT and ERP systems constitute effective decision support systems, yet they create other challenges as well. Two main problems associated with IT and ERP usage cannot be overlooked. Namely, information overload, and incompatibility. We suggest ways to overcome these problems proactively, and reactively as follows.
1) Proactively. Reduce the need for more information as possible, both intra-firm, and inter-firm wise.
This can be achieved by:a. Creating a healthy slack.
b. Simplifying forms and documents used.
c. Assure compatibility of information systems and software packages used.
d. Create autonomous groups and/or self directed teams for decision making and for problem solving; both intra-firm, and inter- firm wise.
2) Reactively; i.e., Increase the capacity of the SC to process more information. This can be accomplished through:
a. SC visibility; i.e., transparency of information along the chain, for all parties.
b. Provide the right incentives for win-win solutions. Different contracting options are useful mechanisms to achieve such outcome.
61

APUBEF Proceedings (October 2003)
c. Increase coordination and collaboration among all SC partners.
d. Use both formal and informal channels of communication to maximize SC surplus.
It should be noted that a, c, and d above relate to increasing the ability of the chain, yet b relate to increasing the willingness needed from supply chain partners to overcome the underlying problems.
SUMMARY AND CONCLUSIONS
This paper provided a general classification of the main challenges currently faced in managing supply chains. Four types have been discussed. These comprise: Operational risks & uncertainty, Behavioral challenges, Continuous and increasing complexity, and dominant Strategic challenges.
A conceptual framework has been developed, and used to overcome these challenges. It comprises two main dimensions: First; Proactive schemes that focus on preemption, avoidance, and mitigation of each of the risks faced and their negative consequences. Secondly; Responsive schemes that focus on the readiness of each firm in the chain to absorb, solve, and solve each challenge, once faced. The main theme here is, how to increase the capacity of a SC to overcome each challenge once encountered.
The framework proposed have been used to provide solutions and action guidelines to main challenges faced, with emphasis on those relating to uncertainty, complexity, and information.
Empirical testing of the framework, and solution proposed in real operating environments are logical next steps to follow, and pursue as future research issues.
61

APUBEF Proceedings (October 2003)
SUPPLIERSUPPLIERNETWORKNETWORK
ENTERPRISEENTERPRISE
EngineeringEngineering
OperationsOperations
SourcingSourcing LogisticsLogistics
DISTRIBUTIVEDISTRIBUTIVENETWORKNETWORK
EENNDD
CCOONNSSUUMMEERRSS
SRM ISCM CRM
Source: Adopted with some modification from Monczka, R., R. Trent, and R. Handfield ( 2002). Purchasing and Supply Chain Managhement, 2nd ed., Cincinnati: South Western College Publishing-ITP Publishing Company.
Figure 1 - An Integrated Supply Chain
62

APUBEF Proceedings (October 2003)
Figure 2 – Supply Chain Management Activities
Supplier Firm CustomerSupplier Firm Customer
SRMSRM
SourceSource
NegotiateNegotiate
BuyBuy
Design Design CollaborationCollaboration
Supply Supply CollaborationCollaboration
ISCMISCM
Strategic PlanningStrategic Planning
Demand PlanningDemand Planning
Supply PlanningSupply Planning
FulfillmentFulfillment
Field ServiceField Service
CRMCRM
MarketMarket
SellSell
Call CenterCall Center
Order Order ManagementManagement
62

APUBEF Proceedings (October 2003)
Figure 3 - A General “ABCD” Classification of Challenges Faced in Managing Supply Chains
1. Accumulated 2. Behavioral 3. Continuous Complexity 4. Strategic Uncertainty Challenges Challenges
e.g. a. ‘Bullwhip’ effect a. Command vs. a. ‘Intra-firm’ interfaces a. Technological Control Innovations
b. Supply & Demand b. Control vs b. ‘Inter-firm’ interfaces b. Performance measurement imbalance Cooperation
c. Market-Based c. Trust and c. ‘Time-Based’ c. Globalization Risks collaboration challenges
d. Industry- Based d. Alliances d. ‘Information-Based’ d. SC Design Risks challenges implications
e. Creativity e. ‘Interaction-Based’ challenges
61

APUBEF Proceedings (October 2003)
REFERENCES
Baird, I. S. and H. Thomas. 1985. Toward a Contingency Model of Strategic Risk Taking. Academy of Management Review, 10, 230-243.
Cachon, G. 2002. Supply Chain Coordination with Contracts,” in Handbooks in Operations Research and Management Science: Supply Chain Management, S. Graves, Editor; (forthcoming).
Chopra, S. and P. Meindl. 2004. Supply Chain Management: Strategy, Planning, and Operations. 2nd ed,, Upper Saddle River, NJ: Prentice Hall.
Fine, C. H. 2000. Clock Speed-Based Strategies for Supply Chain Design. Production and Operations Management (POM), . 89, March 2000: 213-221.
Fisher, M. L. 1997. What is the Right Supply Chain for Your Product? Harvard Business Review, March-April 1997: 83-93.
Handfield, R. B. 2001. Before Your B2B Network Redesign Your Supply Chain. Supply Chain Management Review, July-August, 2001: 18-26.
Kleindorfer, P. R. 2001. Industrial Ecology and Risk Analysis,” in R.U. Ayres and L. W. Ayres, A Handbook of Industrial Ecology. Cheltenham, U.K.: Edward Elgar Publishers, 467-475.
Kumar, N. 1996. The Power of Trust in Manufacturer-Retailer Relationships. Harvard Business Review, November-December 1996: 92-106.
Lee, H. C. 2002. Aligning Supply Chain Strategies with Product Uncertainty, California Management Review, 44, March 2002: 105-119.
Levi, D. S. and E. S. Levi. 2001. Trends in the Internet-Based Supply Chain Management, in Supply Chain Management Practice and Research: Status and Future Directions, S. Gass, Editor, Rockville, MD: National Institute of Science and Technology (NIST), April 2001: 12.1-12.19.
Marien, E. J. 2000. The Four Supply Chain Enablers. Supply Chain Management Review, March-April 2000: 60-68.
Monczka, R., R. Trent, and R. Handfield. 2002. Purchasing and Supply Chain Management, 2nd. Edition; Cincinnati: South Western College Publishing- ITP Publishing Company.
Oviatt, B. M. and A. D. Bauer-Schmidt. 1991. Business Risk and Return: A Test of Simultaneous Relationships. Management Science. 37, 1991: 1405-1423.
Saad, G. H. and S. Siha 2000. Managing Quality: Critical Links and a Contingency Model. International Journal of operations and Production Management, 20, September- October 2000: 1146-1163.
Saad, G. H. 2001. Supply Chain Performance Measurement: An Analytical Approach. APICS E&R Foundation Proceedings. San Antonio, TX, October 2001: 609-624.
Saad, G. H. 1990. “Hierarchical Production Planning Systems: Extensions and Modifications. Journal of Operational Research Society, 41, July 1990: 609-624.
Saboth, R.E. and J. Fontanella. 2002. The unfulfilled Promise of Supply Chain Collaboration. Supply Chain Management Review. July-August 2002: 24-29.
63
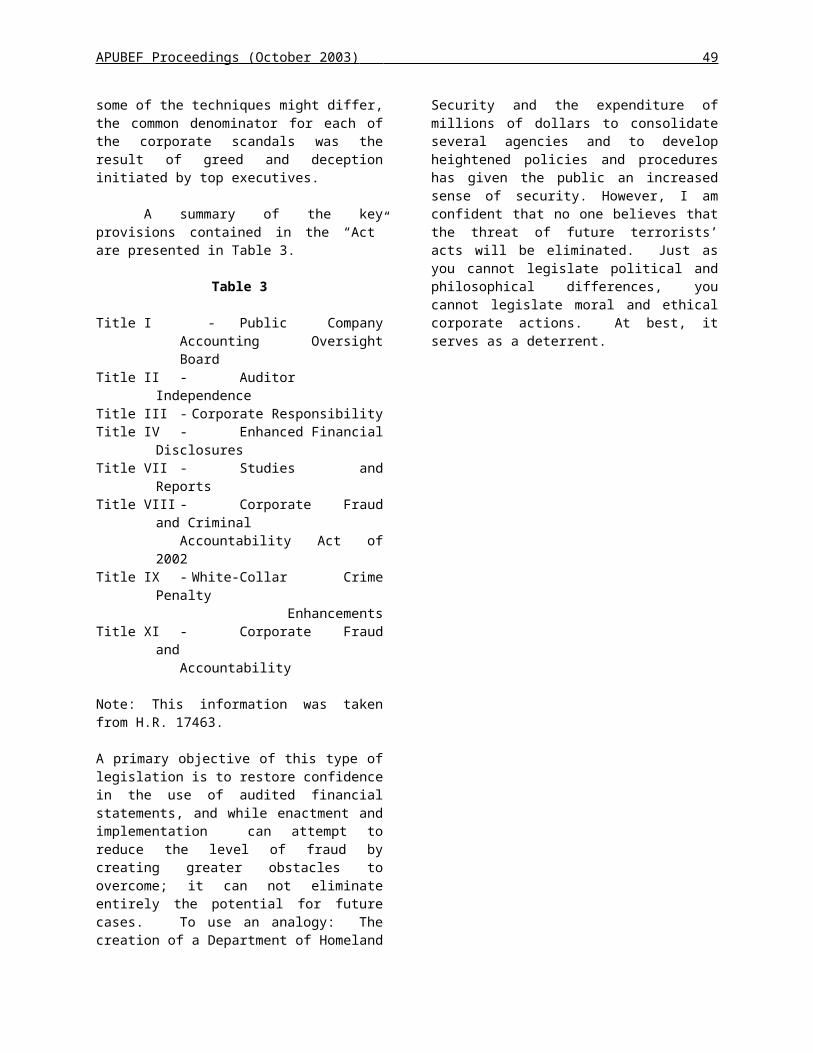
APUBEF Proceedings (October 2003)
Sengupta, S. 2001. B2B Exchanges Anyone? New Path to Success. Supply Chain Management Review, November-December 2001: 68-73.
64

APUBEF Proceedings (October 2003)
IMPLEMENTATION OF A PARALEGAL DISTANCE EDUCATION PROGRAM: OPPORTUNITIES AND CHALLENGES
Frank ShepardClarion University
andJerry Belloit
Clarion University
ABSTRACT
This paper discusses the challenges and opportunities of implementing a distance education program for paralegal instruction. Some reasons for venturing into distance delivery of college classes are explored. Among the particular challenges addressed are law library access, encouraging interaction and discussion among students from different locations, computer training from a distant site, and the expense of distance education.
We at Clarion University have had a decade of delivering ABA approved paralegal education to students. Our paralegal program is located on a rural remote campus without dormitory facilities. Knowing that we have an exceptional program and also knowing that our location will continue to prevent students from partaking of this educational opportunity, the only available solution was to go to them.Through the use of advanced technology we are beginning to expand the classroom to locations away from our rural location. An approved paralegal education requires that extensive practical skills must be learned and practiced. Proficiency as a paralegal requires that these skills become second nature. The problem with distance education, until now, was that the technology did not allow the necessary interaction between student and teacher.Interactive Video allows us to deliver lectures and answer questions in real time. This allows for the interaction that is necessary for a legal education. The technology is now so good that active and vibrant discussions take place at the remote and the life site simultaneously.
By using a Smart Board any number of remote locations can see PowerPoint presentations that replace the traditional chalk and blackboard. The PowerPoint presentations are much livelier and more memorable than any traditional lecture could be. By using Blackboard these presentations are always available as a perfectly prepared notebook for the students. Through Blackboard and of course ITV we are able to continually interact in all of the ways necessary for a quality education.
All of the advanced legal courses require the extensive use of a law library. The costs of a law library are astronomical. Purchasing one for each location is not economically feasible. However, the online law libraries, such as WestLaw and Lexus-Nexus provide a more then adequate replacement. By using Smart Board technology each student can access more research materials then would be available in all but the most elite law libraries in the nation. There is no waiting for available texts or concerns about library availability. The research materials are instantaneous and are presented in a manner superior to traditional library based education.
Through the available technology we are not only able to provide our remote location students with a quality education; we are able to provide all of our students a better education then was ever possible before.
This paper is a case study of the process and issues confronting offering an entire paralegal program through the distance education ITV modality. It will document the challenges in distance delivery of the program and the plans to overcome them.
The Movement Toward Increased Distance Education Delivery
The delivery of quality education in America is a challenging enterprise. Taxpayers are increasingly concerned about the cost of a quality education at all levels, including secondary and post-secondary education levels. Distance education, the delivery of education where the instructor and the student are separated by space outside the classroom, and
65

APUBEF Proceedings (October 2003)
connected using computer-mediated means, has the potential for more efficient allocation of educational resources from one location to another. Distance education technologies including digital compressed video delivered over ISDN, Internet, or the ATM (Asynchronous Transmission Mode) lines, satellite, microwave, Internet web sites, e-mail, fax, videotape and traditional “snail” mail. These technologies offer exciting possibilities for increasing the quality and reducing the cost of distance education. Particularly exciting is the improved technology and access to the Internet, especially advances in the delivery of “live” audio and video that may be delivered over standard telephone lines with relatively inexpensive equipment.xvi At a conference on distance education by the Pennsylvania Association of colleges and Universities, Dr. Thomas Head, of Virginia Tech suggested the following paradigm for classifying educational instructional delivery on the basis of time and location.
LOCATION
Same DifferentSame Traditional
ClassroomDistance Learning (synchronous)
TIMEDifferent Computer Assisted
Instruction (asynchronous)
Virtual Classroom (asynchronous)
Same-time-same-location traditional classroom education has been the delivery system of choice at all levels of education. Different-time-different-location education has historically been in the form of correspondence courses delivered through mail services. Although asynchronous means of distance education have been used since the invention of the radio, it is only recently that computer technology has been used. Different-time-same-location, asynchronous delivery, has been limited primarily to a video tape media, used since the 1970's. Computer assisted instruction in elementary and secondary schools has been more recently used to augment traditional classroom instruction for the student. Same-time-different-location or synchronous delivery has primarily focused upon interactive systems using satellite, ISDN, ATM, microwave, or cable transmission of either two-way video or one-way video/two-way audio. Some institutions, like Oklahoma State University, have used some inexpensive Internet delivery systems. In recent years, there has been some interest in computer-
directed virtual classrooms. Web based course software such as Blackboard have integrated the virtual classroom into its core application.The bulk of the research on educational delivery systems suggests that the mode of delivery is not a critical element of quality educational outcomes.xvii
Rather, the critical elements seem to be effective instructional design and instructional techniques. The traditional advantage of classroom delivery has been face-to-face contact with the student that allowed the student and teacher to establish a rapport that encouraged learning. Other modes of delivery generally were unable to establish this kind of rapport. With technologies now available, face-to-face contact can now be offered at a distance.
Studies of students of other delivery methods have suggested three critical needs for those who do not in the same location as the originating site:
1. Distance learners want and need rapid feedback.2. Distance learners need easy access to library resources3. Distance learners need local support.
All educational delivery systems to remote locations should consider these three needs.
A driving concern in alternative delivery systems of quality higher education is the interest in providing universal access. Traditionally, the question of access was focused more narrowly upon the economic ability of the parent to pay for tuition, books, housing, and board. Government programs and higher education institutional initiatives were directed primarily toward the residential, traditional student who was just out of high school. With the development of the community college system, more non-traditional students were attracted. However, the focus remained with in-class instruction at fixed times and locations, still not fully meeting the needs of their students. Some adjustment to evening and weekend classes was given. While the community college system did increase access, recent trends in higher education funding have made access more difficult. In addition, structural changes in the national economy have increased need for lifelong education. For those whose professions have become obsolete, retraining and re-education is needed. However, for those same people, the opportunity cost of returning to a campus setting is exceedingly high with family considerations being paramount. While one worker in the family may be occupationally displaced, the other worker is even less free to move to a different location to access educational services.
66

APUBEF Proceedings (October 2003)
In addition, increased child-care burdens increase with the loss in family income.
Although educational institutions, especially K-12 schools were early adopters of computer technology, they have failed to keep pace with individual personal computer users, and the corporate community. The fact that you can still find decrepit Apple II computers in classrooms is a pathetic indictment of an education system that needs drastic overhauling. Even more disturbing in this day and age is some classrooms have no computers. Much of this may and can change, though, because of one critical development: the Internet. Surfing the Web can become a common activity in schools, and should get the attention of those in the education establishment. If you browse the literature on computers in education, you will see a definite trend emerging; long-distance learning using computers. A 1993 nationwide survey of 550 elementary and secondary education teachers indicated a need for improved financial support for technology and access local area networks and dial-up services.xviii
In the late 1990’s, Governor Tom Ridge of Pennsylvania unveiled a bold plan to bring all of Pennsylvania’s K-12 public schools into the computer age by allocating substantial budgetary resources for those schools. In addition, in a Project known as Link-to-Learn,xix substantial budgetary resources were allocated to universities, K-12 schools, libraries, and business to develop networks and infrastructure that would allow those participants to connect together through a network of networks called the Pennsylvania Educational Network (PEN).
As a result of the Link-to-Learn initiative, there has begun to be a paradigm shift in re-thinking of the role of technology in the classroom. Increasingly educational opportunities are becoming more accessible to not only K-12 programs but also to higher education and life-long learning programs.xx
Consequently, there should be an increase in the demand for distance education programs.
The long-distance learning concept can be applied to bring education opportunities to the people in a widely spread geographic area such as northwestern Pennsylvania. Adult learners have increased difficulties accessing higher education resources due to family, job, and financial constraints. Financial issues include not only costs for books and tuition, but also costs of the commute (gas, and vehicle depreciation) and the opportunity costs associated with the commute. For example, a student who is
forced to drive an hour each way to class forgoes the opportunity to spend those hours at work.
Finally, the last pressure on increasing the use of distance delivery of educational services is the economic costs associated with bricks and mortar. Distance delivery, especially web based distance delivery, allows substantial growth of the student population without incurring significant costs of additional property. Most of the costs associated with web-based distance education are sunken costs. The only marginal capital costs are those associated with providing additional servers or bandwidth. Even these are usually insignificant since most institutions operate with surplus bandwidth and computer capacity.
Implementation of a Paralegal Distance Education Program
Law by its nature requires an interactive teaching methodology. We have all seen the interchange of dialogue, at least in movies and TV, of the Socratic Method used in law schools. I have always taught with my own modified version of the Socratic Method. I remain convinced that open discussion and debate remains the best way to teach law at the undergraduate level. As paralegals they are going to be required to think, reason, and apply what they have learned on a daily basis. A pure lecture format does not prepare the student for this type of employment. From a purely practical matter teaching law classes in a lecture format may be the best way to insure that the American Bar Association will never approve your paralegal program.
It would certainly be easier to teach other disciplines through distant education technology. Some courses are more suited to lecture. With a lecture format it is much easier to provide identical educational quality to the distant students and the local students. Therefore, I expected that the use of distance education technology would require a significant compromise in my preferred teaching method. Further, I expected the quality of the distance education to not be as good. With this expectation I only agreed to teach a distance course and experiment with the full expectation of finding the experiment to be a failure. I never expected to be able to teach the distance students as well as I taught the local students. This has not been the case, although it has required more work and adjustments on my part. With the use of additional technology the distance education students are learning every bit as well as the in person students.
67

APUBEF Proceedings (October 2003)
The identical method will not work with all law classes. However, there are some commonalities that are uniform across a law curriculum. My teaching method had been to simply use a chalk board and get every student involved in the discussion. I paced, I walked down the isles, I jumped on the desk, all of which will not work when providing distance education. I replaced the chalk board with Power Point slides. I simply placed what I would have written on the board into a PowerPoint presentation and the distant site and the local site see the identical presentation. This requires either a SMART BOARD or some other means of assuring that the same computer screen is seen at both sites.
Early on I continued to ask the students how I could improve what they were receiving at the distant site. One of the comments was a request that I place my PowerPoint program in Blackboard to enable them to print them for class. This way they could use them as a starting point for note taking. I followed that advice and now when I look out over the classroom I see a classroom full of printed of PowerPoint slides. The slides are used to present basic legal principles and definitions. Cases are then used so the students can determine how the principles and definitions should be applied. Law, by its nature is not going to have cut and dry answers. Therefore, it is easy to get a discussion going on how the principle in question should be applied. It is important to keep the distant site involved in the discussion. We have a system that allows the camera to be focused on the speaker. This makes the discussion more personal for the person viewing this from the opposite site. I have found the discussions and debates to every bit as lively with distant education as they were in a traditional classroom.
The use of PowerPoint is essential to providing good distance education. There are other methods of transferring written chalkboard type information. None of them is as good and all of them are wasteful of class time. Distance Education forced me to modernize by using PowerPoint. The simple truth is this is a better way of delivering information then a chalk board. At one time I would describe the Federal Court structure by listing the types of courts and the districts on the Board and describe how a statute was created by simple lecture. Now I show a map of the districts and the circuits. With a statute I have nice little PowerPoint presentation of a bill working its way through the House and Senate to the President’s desk. The students understand it better on both sites and I spend less time getting the same principles taught.
For all classes it is essential that the professor travel to the distant site on occasion to teach from that location. The conventional wisdom seems to be that this is necessary for the distant student to feel equal. And they do feel somewhat cheated if the faculty member does not switch teaching locations periodically. I am sure all of this is true, but that trip is actually more important for the faculty member then it is for the distant student. It is difficult to read nonverbal communication over the interactive monitor. Being there enables one too gauge each student as to who would be most effective in discussing the class topics. I have found that I cannot make an effective determination of who is most likely to lead a discussion or an argument until I have seen them face to face. This information is carried back to the originating site and the subsequent classes are more effective.
The American Bar Association requires all programs to have a required amount of what they call legal specialty courses. All of these courses present there own unique problems in providing this education via distance technology. The base legal specialty course that all of the others grow out of is legal research. It is impossible to teach someone how to research law without having a decent law library. Law libraries are prohibitively expensive. The cost of providing a full library at the originating site, the distance sight, and then possibly an additional distant site, would make the entire effort of providing paralegal education via distance education self defeating. It would simply be cheaper to have three different schools.
This problem and its solution ended up improving the education and the employability of all of ours student, both on site and distant students. Way back when I was a law student Lexis-Nexis and Westlaw were both providing computerized legal research via their data basis. This predated windows so these original services were dos based and required the downloading of what was then a substantially large software program. In the twenty years since I finished law school these programs have progressed to the point that they are web based. No software is required and therefore they can be accessed from any computer connected to the world wide web. Both of these law services provide access to law materials that only the largest and most prestigious law schools would have in book form. These services have replaced or supplemented the traditional law library in the large law firms throughout the country. Even the smallest counties in Pennsylvania provide one service or the other in their Court House law library.
68

APUBEF Proceedings (October 2003)
Over the years I have tried to provide limited online research services for our students. I made a web page with links to the free statute and case services which exist on line. For a few years I was able to get free Westlaw from a book representative that was limited in time, but did allow the students to at least see how it worked. Realizing that it is the largest firms that employ the most paralegals, it was becoming mandatory that paralegals enter the work force with a working knowledge of either Lexis or Westlaw. The problem was the cost. The University had a large financial commitment in a book based law library and the student numbers did not warrant the further expense of Lexis-Nexis or Westlaw.
The promised increased student body through distant education made the purchase of Lexis-Nexis not only financially palatable, but educationally necessary. With either a Smart Board or some method of viewing the same computer screen at the same location both groups receive an effective legal research education. As a matter of fact, the on site students are receiving a better education then they did prior to distance education. Lexis-Nexis gives each student their own password thus enabling them to complete research assignments from the library, their dorm room, or their home. This course used to be taught in the local law library. The students would be divided up into groups. Each group had to work on a separate project that was created to ensure that each group would need different book volumes. No law library I know of can afford to have multiple duplicates of the books. For example, if I was teaching how to research statutes, each group would by necessity have to have a topic that was completely removed from the other group. This was the only way to effectively teach legal research.
With the online law library services, this is no longer necessary. All of the students are now looking at the same page in the same book, learning the same techniques, and, by the way, it is a lot less work for the faculty member. All the students, regardless of their location, are looking at the same screen. As they do I am explaining how to find the statutes, how to decipher them, and how to determine their treatment by the courts to all of the students at one time. It is a remarkable thing to have the world’s most extensive law library sitting inside a lap top computer. In no other generation has a law student, let alone a paralegal student, had unlimited access to such an extensive library of legal materials. The short of this is that distance education has provided the tools to greatly improve the education of all students, local or distant.
Each of the legal specialty courses created there own specialized problems apart from those confronted in legal research. Civil Litigation is a class where we prepare the student to provide support in trial advocacy. This requires the preparation of all court and discovery documents. Therefore, the course is a writing course with legal research and argument tossed in. Lexis-Nexis again provided the form books, the litigation manuals, and the evidence materials in a manner that only the most extensive law library could have.
Traditionally I had divided the class into two or three groups and assigned each of them a client—one the defendant, one the plaintiff, and one the co-defendant. Each group would then prepare all the documents and all of the discovery necessary to take this case to trial. This was an approach that I didn’t want to abandon since it provided the best method of teaching civil litigation skills. Each student had to be familiar with all documents and each group checked the others group work so they could respond through the pleading process. I played the roles of each groups clients and witnesses during the interview process. This was not difficult to do as I simply found a conference room or an empty class room for two of the groups. They could interview privately and brainstorm collectively for their case strategy.
We handled the document service problems simply by requiring that all documents be served on the other parties and the court (me) via email. This system ended up working better then simply handing them to the other side at the beginning of class. With the email procedure all of the students had the documents often days before class. They were prepared to answer and argue their pleadings in a much timelier manner.
Playing the roles of the witnesses ended up being more problematic. I have handled this in two ways. First, we have done interviews of the distant groups clients by using the chat section of Blackboard. This has its drawbacks, the students can’t judge facial expressions or voice tone. I would often play the role of the less then totally honest client. This is much harder to do in Blackboard. The second solution I have used is to have the other groups in an adjacent classroom and have the distant students interview their client by ITV. The best alternative is to schedule a trip to the distant site at a time when the interview would be appropriate.
The problem that I am still wrestling with in this class is the final. Prior to distance education the final
69

APUBEF Proceedings (October 2003)
was a trial. I would find witnesses among faculty members and students from other majors. Although, some court proceedings currently use video, such as with the intimidated child witness, I do not believe this going to work well for an entire trial. I have considered transporting the distant students and, reluctantly, giving a traditional final.
We teach Legal Writing as a writing intensive extension of Legal Research. Since Legal Writing is learning how to express what was discovered through the legal research process, Lexis-Nexis is instrumental for this class also. It provides us with form books, writing manuals, and legal dictionaries on screen in both the distant and near location.
The course has been made easier to teach and more beneficial to the students as a result of the online library. We are able to immediately access the rules of procedure thus showing the proper format for brief writing or motion practice. Since this is a writing course, writing projects are assigned out of class. The students simply email them to the instructor. They arrive in a more timely manner allowing the instructor to have them critiqued before class starts. This process saves an entire class in lag time and rarely do we hear the excuse that their dog ate the computer.
Our other legal specialty courses: Family Law, Real Estate Law, Wills, Trusts and Estates, and Introduction to Paralegal Studies, have proven to be less problematic. All of these courses benefit from Lexis-Nexis and the application of technology then we learned from our other courses.
Institutional Concerns
Administratively, distance education in the State University System is difficult. Administrative difficulties include logistical concerns, technological concerns, budgetary, and scheduling concerns. Ideally, the distance education profession should teach the class from the distance site as often as possible so that the professor can develop interpersonal relationships with members in the class. Even with ITV, there is a tendency for the faculty member to be seen as nothing more than a “talking head” with no real interpersonal relationship developed. Students are then more reluctant to participate interactively in class and sometimes even more reluctant to attend class at all. When the distance site is relatively close to the originating site, it may be possible for the distance education professor to frequent the distant site and teach backward toward the “originating” site. However,
sometimes this might be difficult if there is insufficient time between scheduled classes in the professor’s load to travel from one site to another. In addition, the travel is time consuming and fatiguing. Technological concerns are always more heightened in distance education due to the more wide use of technology. As if teaching were not difficult enough, the professor must always plan for technological failures. Backup delivery systems are important.Currently, one of the performance indicators for the SSHE is low enrollment programs. Because university resource allocation from the SSHE is, in part, based upon these performance indicators, increasing the number of majors and graduates is an important economic goal. Distance delivery into other markets offers an opportunity to increase class size and the number of graduates.
ITV distance education classrooms must be specially equipped to optimize the distance site experience. Distance education classes must be given priority over other classes when scheduling. Scarce resources and limited classroom availability are often significant challenges. To further complicate matters, distant sites may not be on the same academic calendar, nor on the same daily time schedule. For example, at Clarion, distant education classes must be scheduled on a Tuesday-Thursday Schedule or on a Monday-Wednesday afternoon schedule because one campus has different time slots for the MWF morning than does the other. Until this fall, SSHE universities had different academic calendars making it difficult for a class taught across two member institutions to begin and end within the normal term.
A Look Toward the Future
Despite the constraints on distance education, economic and social pressure on educational institutions will continue to fuel growth. Every semester, the numbers of courses offered through distance education increases. Statewide initiates such as the Keystone Network foster additional growth. Clearly, not every course is currently appropriate for distance delivery given our current state of technology. Also clear is that not all faculty will be interested nor will all faculty have the requisite skills to succeed with distance delivery of their courses. Nevertheless, demand is increasing and supply will eventually adjust. Otherwise, educational institutions such as the University of Phoenix will soon make enough inroads within the State to measurably affect enrollments.
xvi One-way live audio can be delivered using
70

APUBEF Proceedings (October 2003)
RealAudio and other software that requires only an addition of a sound card and speakers for the student and a microphone, sound card, and appropriate server software for the sending location. Two way audio and video can be delivered using NetMeeting or other video conferencing software, and low-cost video cameras, sound cards, microphones, and speakers. The only additional requirement is an Internet connection. The Internet connection may be direct using an ISP (Internet Service Provider) and a telephone modem. Digital Subscriber Lines (DSL), cable modems, and satellite now offer the bandwidth to offer much higher quality, high-speed Internet connections.xvii Miller, John W., McKenna, Michael C., and Ramsey, Pamela, “An Evaluation of Student Content Learning and Affective Perceptions of a Two-Way Interactive Video Learning Experience,” Educational
Technology, June 1993, p. 51. “Our review of the available research identified no study that has shown distance learning to be disadvantageous in terms of content learning, while some have even documented advantages over conventional, face-to-face instruction (e.g. Barron, 1987, Weingand, 1984).”xviii Honey and Hengrequez, “Telecommunications and K-12 Educator: Finds from National Survey,” Center for Technology in Education, Bank Street College of Education, New York, New York, 1993.)xix The Link-to-Learn initiative has been funded at $40,000,000 for each of the last two years and anticipates another $40,000,000 this year.xx Additional information about the latest Pennsylvania educational technological initiatives can be found at the web site located at http://www.pde.state.pa.us/ed_tech/site/default.asp.
71

APUBEF Proceedings (October 2003)
ACTIVE TEACHING/ACTIVE LEARNING IN ECONOMICS
Edward J. SullivanLebanon Valley College
ABSTRACT
This paper provides a framework for using role-playing exercises in the economics classroom. Using two scenarios – one for a course on economic development and the other for an intermediate class in macroeconomics – the author provides step-by-step explanations of how role-playing can be used to provide students with a deeper appreciation of the complexities encountered in formulating economic policies. Finally, this paper demonstrates how these exercises can be augmented with writing assignments that may qualify a course for a writing-across-the-curriculum (WAC) designation.
INTRODUCTION
Although role-playing exercises have found their way into other social sciences, such as history and psychology, this powerful teaching technique is still rare in the economics classroom. As a learning device, role-playing exercises have several advantages. First, students get actively involved in economic issues. In order to do so, they must develop their research skills by learning about the topic at hand. Second, students hone their communication skills by orally presenting a position on the issue at hand. Often, this is followed up with an assignment that requires the presenter to write either a position paper or executive summary. Not surprisingly, these assignments help qualify a course as writing intensive or for a writing-across-the curriculum (WAC) designation. Finally, students walk away from the exercise with a much greater appreciation of the complexities inherent in real-world problems. Students quickly realize that competing political interests, at the very least, temper economic decisions.
THE THEORY BEHIND ROLE-PLAYING
One of the more interesting movements in business and economic education is the development of the case study method. Rather than hope students will be able to apply abstract theories and techniques when they reach the work place, the case study method offers students the immediate opportunity to grapple with actual problems confronted on the job. In a larger scheme, the case study method is just one particular approach to problem-based learning. Another useful technique from the problem-based learning repertoire is role-playing using goal-based scenarios. Underlying this approach is the proposition that students learn more effectively through “cognitive conflict” or disagreement (Savery and Duffy, 1995). Naidu, Ip, and Linser observe:
A Goal-Based Scenario (GBS) is essentially a simulation in which learners assume a main role, which has associated with it a mission. Their “goal” is to accomplish this mission or task associated with their role(s) in the scenario. In order to achieve this goal the learner needs to acquire particular skills and knowledge. This is where and when the learning takes place. Goals in this context refer to the successful pursuit of the task at hand. A GBS therefore serves both, to motivate learners and also give them the opportunity to “learn by doing.” As long as a goal is of inherent interest to learners, and skills needed to accomplish those goals are the targeted learning outcomes, we have a match and a workable GBS (p.2).
By requiring students to explain and defend their positions in a scenario, they are forced to draw upon both theory and supporting data in order to make their case. Brown and Palincsar (1989) contend that cognitive conflict occurs whenever there is disagreement between existing and new information. Indeed, this approach lends itself particularly well to the analysis of economic conditions where policy makers continually deal with incomplete, mismeasured, or erroneous data. Further, in a series of studies, Schank (1982, 1986) argues that memory organization is actually altered when people are required to explain the unanticipated. Role-playing exercises offer students the opportunities to confront conflicting theories and positions in an uncertain environment.
70

APUBEF Proceedings (October 2003)
At its best, a role-playing exercise engages students both cognitively and socially. Cognitively, students must use abstract economic theories and principles to develop a policy position and then articulate that position through oral and written communication. Socially, students encounter the complex interplay of political, cultural, and economic influences on policymaking.
A GENERAL FORMAT
Developing a role-playing exercise involves several steps. They are (1) selecting an issue; (2) developing the cast of characters; (3) selecting the forum; (4) making a decision – or not; and (5) concluding the exercise. The most crucial step is the first one: selecting an issue. In general, the more controversial the topic is, the better. For example, one potential topic in an economic development course is the construction of a chemical processing plant by a foreign corporation in a under-developed country. By carefully selecting a topic, the second step becomes easier and obvious -- identifying the various perspectives in a given issue.
When assigning positions and reports, make sure that a variety of points of view are included. For example, continuing with the chemical plant assignment, the instructor might designate one portion of the class as “government officials” who must assess the costs and benefits associated with such an investment in their country. Another group in the class could represent the corporation seeking to build the plant. Finally, a third group might represent “concerned citizens” who fear the potential of environmental disaster. When developing the cast of characters, three to five groups seem optimal. A two-sided argument invites dualistic thinking and encourages a right or wrong attitude in the class. A well-selected topic insures a diversity of positions, yet inviting too many groups runs the risk of making the exercise less tractable, albeit, potentially more realistic.
In active learning exercises, the instructor must provide a context for examining the topic. Typically, this entails establishing a forum for the debate or discussion – our third step. Following our chemical plant example, this forum could be the country’s central planning board where corporate representatives “pitch” the investment to a group of governmental planners. Here, students present the research and analysis relevant to their positions. For example, the corporate group would be required to address such issues as what constitutes a successful investment from the firm’s point of view and what are the risks inherent to a firm under taking such an enterprise. Notice, the other groups represented would differently define a “successful investment”. The country’s planners might be required to do their own analysis or act as judges. The “concerned citizens” enrich the discussion by identifying the potential political and cultural costs as well as any positive and negative externalities associated with the project.
The key to these exercises is to insure the involvement of the entire class. Everyone must play a role, and some roles may be more explicit than others. For example, behind those presenting a position (one or several students) are those who help research, write, and stage the presentation. Staging the presentation might entail developing graphs, cue cards, or PowerPoint slides. This gives students an opportunity to draw on the skills cultivated in their writing and communication courses. To sustain interest and to give the participants a stake in the outcome, a decision concerning the issue should be made. In our example, this may entail one group making the decision (the central planners) or, perhaps, having the entire class vote on the final outcome. Deadlocks are not necessarily bad outcomes; they often reflect real-world occurrences. In some exercises, a deadlock might be viewed as a “victory”. For example, postponing the construction of a chemical plant might be viewed by some groups as keeping the “polluting capitalists” at bay.
In the last step, following the presentation, students should be required to perform a debriefing. Instructors may require participants to write a report, position paper, executive summary, or news release as the chosen topic allows. Doing so permits students to modify their arguments or provide further factual evidence in support of their positions. Depending on class size, these papers may be individually or team-written. If team-written, the instructor might wish to address the “free rider problem” by having each student evaluate the contributions of other team members and using these assessments to partially determine individual grades. Finally, requiring students to maintain a reflective journal intensifies the experience. Asking them to write about what surprised them, disappointed them, or proved most difficult benefits both them and the instructor. Clearly, for the instructor it provides useful feedback in refining the exercise.
A MACROECONOMIC EXAMPLE
71

APUBEF Proceedings (October 2003)
The previous section outlined in general the various steps involved in developing an economic role-playing exercise. In this section, a more detailed example is provided which is suitable for an intermediate course in macroeconomics or a senior capstone course.
Established with the Employment Act of 1946, the Council of Economic Advisors (CEA) is charged with giving the President analysis and advice on domestic and international economic issues. Because of its broadly defined mission, the CEA is an excellent vehicle for exploring a large array of issues addressed in an intermediate macro course. In this example, tax policy is chosen as the issue for study. Specifically, the CEA is charged with analyzing an income tax cut in order to promote economic growth.
Having selected an issue, step two necessitates identifying the cast of characters. The CEA is composed of three members, with one designated by the President to be Chairperson. Supporting the three members is a staff of economists. When establishing this scenario, the instructor should point out that while informal discussions occur among the three members, no votes are taken. This stems from an executive order dating back to the Eisenhower administration giving all executive authority for the Council to the chairperson.
When picking a forum for discussing the issue (step three), the instructor has a variety of choices. One possibility is a meeting with the President, the Secretary of the Treasury, and the Director of the Office of Management of the Budget. (Of course, this would expand the purview of the exercise.) Another possibility is having the CEA chairman testify before a congressional committee. Here, some students can assume the roles of congressmen/women representing various constituents along the political spectrum. (Such a scenario is particularly appealing in a course emphasizing political economy.) In the exercise at hand, however, let us assume that the forum is a Council meeting with the three council members and its staff of economists.
The fourth step -- and where the actual simulation takes place-- involves analyzing data and making a recommendation concerning the tax cut. In shaping the discussion, the instructor might divide the “staff economists” into three groups and assign each group the task of arguing one of the following courses of action: (1) maintaining the status quo (i.e., not cutting taxes); (2) initiating a tax cut; or (3) raising taxes. In order to analyze these positions, the staff must account for the current and expected state of the economy. At a minimum, I would recommend the staff considers (i) the current and likely course of monetary policy (accommodative or not); and (ii) key economic variables like real gross domestic product, the consumer/producer price indexes, an unemployment measure, an industrial output measure, and, possibly, exchange rates, and a trade balance measure. If students have studied econometrics (which is likely in a capstone course), then the staff may be asked to generate forecasts of some or all of these variables.
Once each group has presented its position, a roundtable discussion should ensue. Initiated by the three Council members, but also including the staff economists, questions directed to the presenters might include several areas. First, what does economic theory indicate about the efficacy of fiscal policy? When is it most likely to be effective or not? Responses to these concerns should be framed within a macro model. Usually in this discussion phase, a simple aggregate supply and demand analysis suffices. After a firm theoretical analysis of fiscal policy is established, the CEA members can turn to questioning what the data indicate. For example, where is the economy in the business cycle? Which data are lag or lead indicators? How were the forecasts generated? What is the future of interest rates? In addition, political considerations should be admitted to the discussion. For example, where is the country in the election cycle? Will the Congress support a tax cut initiative? Should it be across-the-board or skewed in favor of certain income groups? At the conclusion of the discussion, a policy recommendation should be forged. Hopefully, a consensus will emerge from the discussion. For example, the CEA members may “poll” the staff regarding the appropriate policy action. If this is done, then let each team know they can abandon the position they were assigned to defend initially. Another way to conclude this portion of the exercise is to let the Council decide the best policy response based upon the quality of the arguments offered by the three teams. Whatever way is decided, a recommendation brings resolution to the exercise.
72

APUBEF Proceedings (October 2003)
Finally, each team should be required to submit a position paper based upon their respective assignments. Likewise, members of the Council (if they are students) could be given the task of writing an executive summary of this meeting that includes support for their policy recommendation. Again, as part of the debriefing process, reflective journaling is recommended. The instructor might offer some guide questions such as: What are the limitations of forecasting? Do they believe their recommendations would be adopted by current administration and implemented by the Congress?
CONCLUSIONS
The purpose of this paper is to demonstrate how role-playing can be used as an effective teaching technique in the economics classroom. Five key steps are identified in the process, and they can be adapted for use in most economics courses. By directly involving classmates in a role-playing scenario, students are required to work individually and, often, in teams in order to realize some learning-based goal. In the process, students achieve a more realistic vision of how economic policies are formulated, and how the political process may modify economic analysis.
REFERENCES
Brown, A.L. and A.S. Palinscar. 1989. Guided cooperative learning and individual knowledge acquisition. In Knowing, learning, and instruction: Essays in honor of Robert Glaser, ed. L.B. Resnick. NJ: Lawrence Erlbaum Associates.
Naidu, Som , A. Ip, and R. Linser. 2003. Dynamic goal-based role-play simulation on the web: A case study. Working paper. The University of Melbourne, Australia.
Savery, J.R. and T.M. Duffy. 1995. Problem based learning: An instructional model and its constructivist framework. Educational Technology. September-October 1995: 31-37.
Schank, R. 1982. Dynamic memory: A theory of reminding and learning in computers and people. NY: Cambridge University Press.
Schank, R. 1997. Virtual learning: A revolutionary approach to building a highly skilled workforce. NY: McGraw-Hill.
73

APUBEF Proceedings (October 2003)
ENVIRONMENTAL INSURANCE BASICS
Stephen D. WillitsBucknell University
ABSTRACT
What do "brownfields," M&A transactions, real estate transactions, pollution remediation, and military base closures have in common? All represent potential environmental liability exposures that may be managed by using various environmental insurance products. Environmental problems are not restricted to big chemical manufacturers or toxic waste haulers. Almost any small business (e.g., dry cleaners, farmers, mini-storage operators, gas stations) as well can have significant environmental risks resulting from its operations or (previous) uses of its site. A business even may be responsible for cleaning up contaminants that migrated to its site if the responsible party cannot be found or is insolvent.
ENVIRONMENTAL INSURANCE BASICS
What do "brownfields," M&A transactions, real estate transactions, pollution remediation, and military base closures have in common? All represent potential environmental liability exposures that may be managed by using various environmental insurance products. Environmental problems are not restricted to big chemical manufacturers or toxic waste haulers. Almost any small business (e.g., dry cleaners, farmers, mini-storage operators, gas stations) as well can have significant environmental risks resulting from its operations or (previous) uses of its site. A business even may be responsible for cleaning up contaminants that migrated to its site if the responsible party cannot be found or is insolvent. CPAs desiring to expand their competencies as "business advisors," auditors trying to assess a client's business risk, and accountants attempting to determine whether an environmental contingency must be reported need a basic understanding of environmental insurance and the types of products that are available.
Expanding Environmental Insurance Market
Insurance agents often mistakenly overlook the environmental risks faced by "main street" businesses, and their clients are unlikely to call attention to these exposures.xxi Many agents think environmental coverage is just for environmental-oriented accounts (e.g., asbestos-abatement contractors, Superfund sites), but any business that regularly deals with materials that insurers consider environmentally hazardous can benefit from environmental coverage.xxii Unfortunately for businesses that forego such coverage, standard general comprehensive liability (CGL) insurance policies written since 1985 contain a pollution
exclusion, and insurance companies have been reluctant to pay for pollution occurring before 1986 under policies then in force.xxiii Businesses that ignore potential environmental exposures are essentially self-insuring environmental liabilities. As typical pollution losses range between $200,000 and $400,000, an uninsured loss may be more than a small business can handle.xxiv The CGL's exclusion bars coverage for bodily injury or property damage resulting from "the actual, alleged or threatened discharge, dispersal, seepage, migration, release or escape of pollutants" from the insured's premises and goes on to exclude any loss, cost, or expense arising out of any request or requirement to clean up any pollutant. It defines pollutants as "any solid, liquid, gaseous or thermal irritant or contaminant, including smoke, vapor, soot, fumes, acids, alkalis, chemicals, and waste. Waste includes materials to be recycled, reconditioned or reclaimed." Every day, many businesses use materials that fit this definition. For example, pesticides are fine on trees in an orchard, but not in ground water supplies.
Environmental liability concerns have derailed numerous business transactions since Congress began enacting "pollution" legislation in the 1970s. A recent study across a range of industries found that (1) 50% had declined to purchase environmentally damaged property, and (2) a significant number of business transactions—including mergers and acquisitions—failed for environmental reasons.xxv Further, corporate planners have been challenged by the magnitude and uncertainty of potential environmental liabilities. For example, even remediated sites receiving "no further action" letters from state environmental officials may be subject to further liabilities as state environmental agencies reopen files in response to advances in science and shrinking levels of "acceptable" contamination. Such risks can be transferred from
74
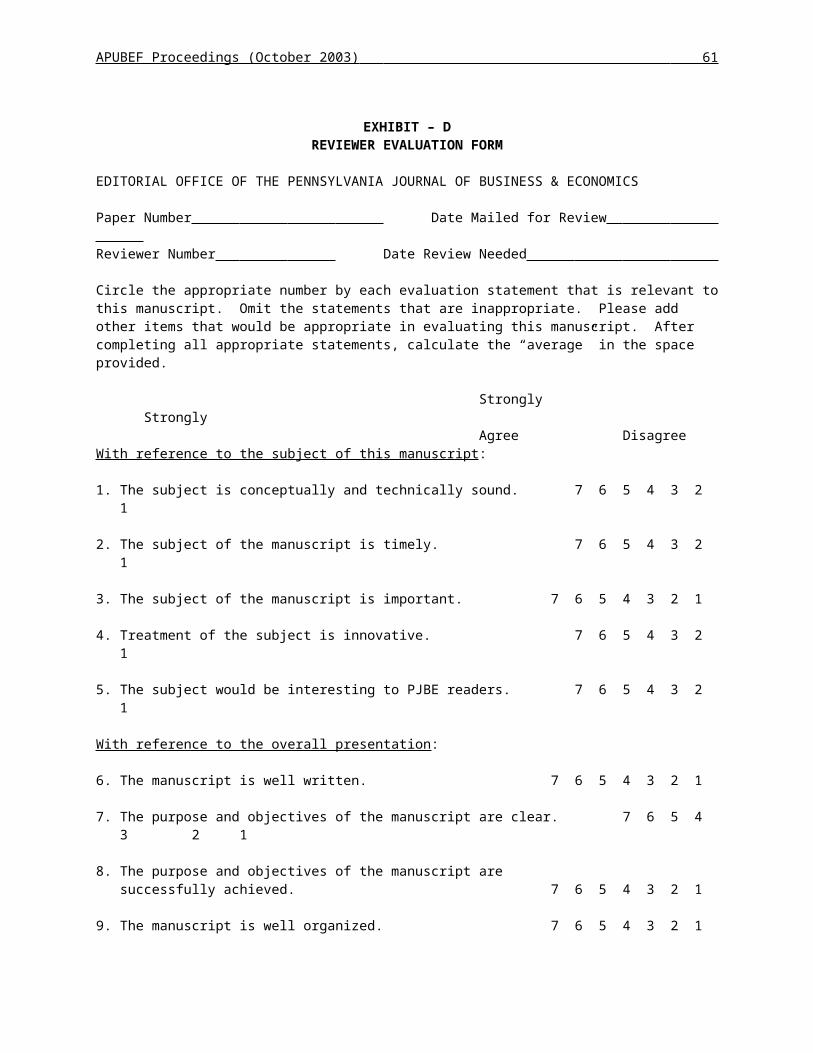
APUBEF Proceedings (October 2003)
property owners to environmental insurance companies.xxvi
In the past decade or so the scope of coverage of environmental insurance products has greatly increased while prices have been kept down by competition among insurers. As these products have evolved since the 1980s, they have become more flexible and can be tailored to fit a specific set of environmental problems.
Various Environmental Insurance Products Offered
Environmental insurance may provide first-party (insured's premises cleaned up) or third-party (liability) coverage. Table 1 lists some of the businesses/professional services and risks that may be covered. Policies may be written on an "occurrence" basis, only covering losses that occurred during the policy period, or on a "claims made" basis, covering any claim presented during the policy period even if the loss occurred in a different policy period.
Environmental insurance policies permit a number to be placed on environmental risk in a real estate or M&A transaction. Rarely today does a commercial real estate transaction take place without addressing possible environmental problems. Property buyers have no desire to inherit legacy environmental liabilities. Sellers want to be "free" from their former properties and not find themselves responsible years later for pollution on these sites. Lenders are concerned that the borrower's cash flows may be seriously impaired due to unforeseen cleanup expenses thus affecting the borrower's ability to service the loan. Worse, the lender may become responsible for the cleanup if they have to foreclose on the property. Traditional Phase 1 site assessments, designed to evaluate a site's history and identify potential environmental problems, do not adequately deal with these transactional risks, but they may be transferred to insurers.
Risk management consultants are increasingly involved in M&A transactions to assist both buyers and sellers to assess—and possibly insure against—environmental risks. Premiums—which can vary widely—are affected by the length/level of coverage, deductible amounts, coinsurance, and site specifics and can easily run between 2% and 10% of the purchased insurance limit.xxvii Policies are available with coverage limits of $75 million (or more) and policy periods of up to 10 years. Here's an overview
of some of the environmental insurance policy types that are now available.
Pollution legal liability covers remediation costs of unknown pre-existing and new pollution conditions. It covers both on- and off-site remediation expenses, contamination-caused bodily injury and property damage—including sick building syndrome, costs that result from project delays due to contamination cleanup, neighboring properties' value declines due to contamination at the insured's site, legal defense expenses, and—with appropriate policy enhancements—underground storage tanks.
Cost cap coverage provides protection against a more expensive than anticipated cleanup of known conditions such as more contamination found than was expected, a different contaminant also discovered that requires remediation, contamination found to have migrated to adjoining properties that also require cleanup, or legal changes during the cleanup that require a more thorough cleanup than originally anticipated.
Secured creditor impaired property coverage encourages lenders to finance projects involving known/suspected contamination by paying the outstanding loan balance in the event of borrower default so that the lender does not need to foreclose on the property and thus become responsible for its cleanup.
Consultant's environmental liability insurance provides coverage for acts, errors, and omissions, as well as pollution conditions arising from the insured's professional services.
Contractor's pollution legal liability covers environmental exposures that would be excluded under a general liability policy. It insures against conditions arising from covered operations performed by, or on behalf of, the named insured. (Because a firm that hires another firm could be held liable for environmental hazards caused by the other firm, contractors should require subcontractors to carry adequate insurance.xxviii)
In addition to writing insurance, many environmental insurance providers offer loss control and claims management services in conjunction with their policies. These services can be quite valuable to the insured's program of risk management, and critical in the event of an environmental loss.
75

APUBEF Proceedings (October 2003)
Shopping for Environmental Insurance and Filing Claims
Understanding environmental insurance can be difficult, thus it's prudent to seek the assistance of a knowledgeable insurance broker or attorney. Keep in mind that not all insurers write environmental coverage,xxix and less than 100 broker/dealers in the U.S. write five or more environmental policies a year.xxx Before seeking environmental insurance, a business should clearly identify the risks it wants to cover. Determining the degree of a site's (potential) contamination is crucial to procuring the appropriate kind and amount of insurance. Doing so requires a decent understanding of technical information about the site and may involve working with contractors and environmental consultants to identify what contaminants are or may be present and what remedies are available and at what costs. Those negotiating the terms of the policy should also be familiar with environmental law—including case law developed in the wake of the Superfund Act.
It's important to review environmental insurance products carefully. The environmental insurance industry is made up of a small group of carriers that do not all take the same approach to pollution issues and exposures; thus, coverage offerings for the same site may differ significantly in both premiums and what is covered. Premiums may be reduced with some insurers by having a sound loss avoidance/control program in place.
Urgency should characterize any environmental claim both to contain the incident and the company's liability and expense. This may mean dispatching consultants and contractors to the scene of an accident or promptly dealing with on-site leaks, etc. It's much easier to mount the necessary response to an environmental incident if "what might go wrong" is foreseen and contingency response plans are in place. Insurers should be promptly notified of an environmental problem. Often, the insured has been involve with an environmental problem long before the insurer is brought in which may be prejudicial to the insurer.xxxi
Financial Reporting When Environmental Insurance Is In Effect
SFAS No. 5, “Accounting for Contingencies,” requires that a loss contingency be accrued by a charge to income if it is probable that a liability has been incurred and the loss amount can be reasonably estimated. In cases of a probable loss that cannot be reasonably estimated, or a loss that is only reasonably possible, disclosure is required. Questions have been raised regarding whether claims for recovery of such losses from insurers (or other parties potentially responsible for the environmental damage) may be offset against the liability in the balance sheet. The EITF (Issue No. 93-5) reached a consensus that an environmental liability should be evaluated independently of any potential claim for recovery and that the reported loss should be reduced only when recovery is probable. The SEC’s staff favors separate disclosure of the gross liability and any related claims, noting that litigation over insurance policies’ coverage of environmental liabilities indicates that significant uncertainties regarding the ultimate realization of insurance claims exist. This guidance was issued in the early 1990s when numerous claims under CGL policies were being challenged in court. There is no reason to believe that this same level of uncertainty exists regarding environmental claims filed against environmental insurance policies of the type previously outlined so accountants should make themselves aware of what coverage is in effect when determining proper reporting of environmental problems.
Conclusion
Most CPAs do not need to become environmental insurance experts to adequately serve their clients. However, as environmental concerns and regulations mount, and insurance markets respond with an increasing array of offerings, CPAs should keep enough abreast of these developments to (1) understand their risk ramifications, and (2) be able to effectively interface with experts in the field when necessary.
Table 1
List of pollution risks accepted by various insurance carriersxxxii
Manufacturers
Underground storage tank owners
Truckers
76

APUBEF Proceedings (October 2003)
Hazardous materials/wastes transporters
Landfills
Municipalities
Financial Institutions
Chemical Plants
Property developers (including “brownfields” redevelopers)
Pollution/professional liability insurance for:
○ Architects and engineers
○ Environmental consultants
○ Emergency response contractors
○ Asbestos/lead abatement contractors
○ Remediation contractors
○ Testing labs
○ Mold remediation
○ General contractors
77

APUBEF Proceedings (October 2003)
xxi Strzewski, Len, “Small Risks Can Have A Large Environmental Exposure,” Rough Notes, Indianapolis, July 2002, pp. 52.55.xxii Pritchard, William G. Jr., “Evaluating Environmental Exposures,” American Agent & Broker, February 2000, pp. 32-41.xxiii The Society of Environmental Insurance Professionals reports that $1 billion a year is spent litigating environmental damage claims on policies that have pollution exclusions.xxiv Wernick, Neil, “Survival With Environmental Insurance,” Pollution Engineering, September 2002, pp. 16-18.xxv Rich, Motoko, “Environmental Risk Is Drawing Closer Scrutiny,” Wall Street Journal, New York,
NY, October 23, 2002, pg. B8.xxvi Keiter, Allen, “No Further Action Letter’s Status Can Change,” The Appraisal Journal, October 2002, p. 374.xxvii Green, Paula A., “Slowing Market for Mergers and Acquisitions Keeps Insurers Busy,” Global Finance, June 2001, p. 64.xxviii Catanese, Joseph, “Insurance: Are Your Business Partners Properly Insured?” Waste Age, April 2001, p. 18.xxix “A Directory of Markets for Pollution Insurance,” American Agent & Broker, February 2002, pp. 57-67.xxx Glover, Lynne, “The Benefits of Environmental Insurance Apply to All Businesses,” Pittsburgh Business Times Journal, October 12, 2001, p. 32.xxxi Jaipaul, Cecil, “Claims Management and the Environment,” Canadian Underwriter, January 1999, pp. 44-48.xxxii “A Directory of Markets for Pollution Insurance,” American Agent & Broker, February 2002, pp. 57-67.
78