VIEA Home | The Vancouver Economic Alliance Official Site
52
STATE OF THE ISLAND ECONOMIC 2015 SOLUTIONS OPPORTUNITIES TRENDS ISLAND
Transcript of VIEA Home | The Vancouver Economic Alliance Official Site

STATE OF THE ISLAND ECONOMIC
2015
SOLUTIONS
OPPORTUNITIES
TREND
S
ISLAND

Table of Contents
Prepared by MNP
Published byVANCOUVER ISLAND ECONOMIC ALLIANCE
PrintingHEMLOCK PRINTERS
Design & LayoutBLACKBERRY CREATIVE
Copyright VIEA 2015
All rights reserved.
HISTORICAL OVERVIEW ................................. 8
A Look Back at the State of the Vancouver Island Region in 2009
Overview of the Economic Performance 2009 to 2014
BC Real GDP
OUTLOOK FOR 2015 ...................................... 14
Macroeconomic IndicatorsBC Real GDP Growth Rate, Exchange Rate, Unemployment Rate
Infrastructure and DevelopmentBuilding Permits, Housing Starts, Infrastructure Investment, Major Infrastructure Projects
BUSINESS ENVIRONMENT & INVESTMENT ATTRACTION ...................... 21
Number of Businesses, Business Formations, Insolvency
Skilled and Entrepreneurial ImmigrationPNP Applications, Skills Immigration, Entrepreneur Immigration
Bright Ideas in Strathcona Feature
POPULATION AND LABOUR FORCE ........... 28
Population Growth, Population Distribution, Employment Rate, Labour Force, Participation by Region and Age, Employment by Industry, Share of Employment by Sector on VI and in BC
INDUSTRY ANALYSIS ..................................... 34
TourismFerry Traffic and Visitor Indicators
Tourism & Exchange Rates Feature
AquacultureShellfish and Finfish Licenses, VI share of Aquaculture & BC Production
ForestryProduct and Log Cargo Volumes, Employment, Timber Processing Facilities, Harvest Volumes
Opening Markets Feature
EducationInternational Enrollments, Employment, Number of Businesses
High Technology
COST OF LIVING & AFFORDABILITY ........... 45
Housing, Living Wages, Average Earnings
FIRST NATIONS ON VANCOUVER ISLAND ...... 49

S T A T E O F T H E I S L A N D E C O N O M I C R E P O R T 3
THE CHAIR’S PERSPECTIVE Vancouver Island Economic Alliance
f you are reading this Economic Report for the first time, well, that’s
because this is the first edition of what we expect will be an annual publication.
Many of you know that the Economic Alliance has been hosting the ‘State of the Island’ Economic Summit every October since 2007. Several times over the last 9 years our Summit programs have featured prominent economists who have shown economic patterns and trends while offering near-term projections for the Vancouver Island economy. These presentations have always been informative, stimulating (as stimulating as statistical data can be!), and cause for reflection amongst the many business and government people participating. However, of necessity, these presentations have used mostly national and provincial data to extrapolate meaning for Vancouver Island. Even the regional data available through BC Stats reflect a conglomeration of information for the Vancouver Island and Coast Development Region. While this coastal area is identified as a provincial region, the day-to-day reality is that Vancouver Island and the Coast region (which includes parts or all of the Central Coast, Mt. Waddington, Strathcona and Powell River Regional Districts) are economically distinct. Thus, the statistical information available for the region has always invited the question “but what does this mean on Vancouver island?”
I

4 O C T O B E R 2 0 1 5 w w w . v i e a . c a
In 2009, the Economic Alliance produced a Regional Economic Analysis for Vancouver Island and Coast Region with funding from the BC Ministry of Community Development, BC Ministry of Housing and Social Development, and the Island Coastal Economic Trust. This has been a popular resource and reference document used by many in the region as background data for developing business cases and community development planning. The challenge, of course, is that the information is now almost seven years old and at 257 pages few people have either the time or inclination to delve into this deep pool of information to find the specific pieces of data they need for their purposes.
So, all along, VIEA has believed that it would be beneficial for Island businesses, government decision-makers and prospective investors to have access to accurate and consistent economic information that is specific to Vancouver Island, succinct, user-friendly, and reliably sourced. We also think that since we host an annual event called ‘The State of the Island’ Economic Summit, that speaking to ‘The State of the Island’ economy in specific, defined terms would fit naturally into our program. Thus, the lead author of the Economic Report, MNP Senior Economist, Susan Mowbray, is presenting highlights of the Report at the 2015 Economic Summit. Each Summit delegate attending her presentation will receive a hard copy of the Report while an electronic copy will live on the VIEA website and be available for anyone wishing to know more about the Island economy.
In land mass, Vancouver Island is approximately the same size as the Country of Taiwan. In North American terms, the Island is considerably larger than states such as Vermont, Connecticut, New Hampshire, Rhode Island, and Massachusetts. With approximately 760,000 residents, Vancouver Island’s population is more than 5 times the 140,000 population of Prince Edward Island, is slightly larger than the 751,000 population of New Brunswick, is about 44% larger than the 527,000 population of Newfoundland and Labrador, and is pushing towards the 922,000 population of Nova Scotia. Even the provinces of Saskatchewan and Manitoba with populations of 1.1 and 1.2 million are not beyond comparisons with Vancouver Island. Measuring where we are, noting trends and
The Chair’s Perspective — VIEA

S T A T E O F T H E I S L A N D E C O N O M I C R E P O R T 5
citing challenges and opportunities, enable us to make timely decisions and collaborate for better outcomes with the benefit of up-to-date and accurate information.
A few topic areas covered in the report caught our attention and warrant further comment.
The importance of transportation in terms of cost, time efficiency and reliability is noted as particularly important to the economic vitality and viability of Vancouver Island purely because we are accessible only by water and air and not by road. This limitation has long been experienced as an economic liability—partly because the cost in time and money is easy to calculate as minutes and hours spent and fees paid to use scheduled transportation services and partly because these costs to move people and goods impact the prices of some goods and services.
During the past two years VIEA has been fostering dialogue amongst transportation stakeholders focused on how to turn this economic liability (our Island location) into a strategic advantage. In March 2015, we produced a video showcasing transportation initiatives on Vancouver Island (see it on our website) and hosted a sold-out forum on the topic in Victoria. In April, VIEA again addressed the topic of transportation with local government representatives at the Association of Vancouver Island and Coastal Communities (AVICC) Conference in Courtenay. During the Summit a panel will report on early progress being realized in some of these initiatives. It is important that this dialogue continues so that the various pieces can be identified, justified and combined to turn our transportation liability into an economic advantage. Many thriving, prosperous Island economies exist in the world. There is no reason why we cannot be counted amongst them.
First Nations’ business and economic development is in the forefront of a significant and unprecedented cultural and economic evolution on Vancouver Island. As several First Nations approach completion of treaty settlements, we are seeing the development of business, community and regional partnerships that are fostering investment and mutual benefit in sectors such as aquaculture, tourism, forestry, energy, transportation, and property development to name a few. This spirit of
6 O C T O B E R 2 0 1 5 w w w . v i e a . c a
partnership and collaboration to build capacity and prosperity benefiting First Nations, Aboriginal entrepreneurs, and all of Vancouver Island is to be applauded.
With 50 First Nations represented by three Tribal Councils as well as numerous Aboriginal organizations on Vancouver Island, the economic success of First Nation and Aboriginal enterprises will have critical importance for everyone. After decades of separation, we will find that our lives and our work, Aboriginal and non-Aboriginal, will be increasingly inter-twined. What is good for any part of Vancouver Island will be good for all of Vancouver Island.
Report data make it clear that forestry and wood industries on Vancouver Island remain as driving forces in our economy although the full potential of this renewable resource is not being realized. There is clearly much work to be done to first share an inspiring vision for the future and then overcome the tangle of historic limitations and systemic barriers to progressive change. The practices of exporting logs and using our wood fibre to produce pulp and dimensional lumber should be at the most basic end of the value chain in this industry—not the full extent of our capacity. The will must exist amongst industry leaders and senior government officials to solve persistent problems en route to a thorough evolution of the forest and wood industries with an over-arching goal to diversify for stability, create family jobs, and build prosperity throughout the region. This is obviously not a small task that will yield immediate tangible results. But it is a task that warrants our full attention and our best collaborative efforts.
VIEA continues the complex task of bringing industry stakeholders together to seek ways to bridge the gap between the industry that is and the industry that could be. There is no shortage of potential for a broadly diversified and sustainable industry focused on value-added manufacturing from veneers and laminates to cosmetics and pharmaceuticals, but persistent barriers such as inconsistent access to fibre, outdated regulations, and lack of investment must be addressed to enable a new generation of prosperity. We’re working on it!
Ron Cantelon, ChairVANCOUVER ISLAND ECONOMIC ALLIANCE
The Chair’s Perspective — VIEA

S T A T E O F T H E I S L A N D E C O N O M I C R E P O R T 7
This report is provided for information purposes and is intended for general guidance only. It should not be regarded as comprehensive or a substitute for personalized, professional advice.
We have relied upon the completeness, accuracy and fair presentation of all information and data obtained from public sources, believed to be reliable. The accuracy and reliability of the findings and opinions expressed in the presentation are conditional upon the completeness, accuracy and fair presentation of the information underlying them. As a result, we caution readers not to rely upon any findings or opinions expressed as complete and disclaim any liability to any party who relies upon them as such.
The findings and opinions expressed in the presentation constitute judgments as of the date of the presentation, and are subject to change without notice. MNP is under no obligation to advise of any change brought to its attention which would alter those findings or opinions. The reader must understand that our analysis is based upon projections, founded on past events giving an expectation of certain future events. Future events are not guaranteed to follow past patterns and results may vary, even significantly. Accordingly, we express no assurance as to whether the projections underlying the economic and financial analysis will be achieved.
Before taking any particular course of action, readers should consult their professional advisor to discuss matters in the context of their particular situation.
MNP
LIMITA
TIO
NS

8 O C T O B E R 2 0 1 5 w w w . v i e a . c a
In 2009 the Vancouver Island Economic Alliance commissioned
a study to examine the economy of Vancouver Island and the Sunshine Coast. This study included an assess-ment of the outlook, opportunities and challenges facing the region’s economy going forward. At the time the study was prepared, the world was in the midst of the 2008 financial crisis and the near-term outlook was uncertain. Key industries in the region such as Forestry, Construction and Tourism were expected to be negatively affected by the economic downturn in the near term but the long-term trends that were identified were not expected to fundamentally change. The southern urban areas of the region had enjoyed a period of economic prosperity brought on by population growth while the more remote and resource dependent regions were struggling. Businesses in the region were facing a number of challenges that were independent of the prevailing macroeconomic conditions.1 While many of those challenges were related to the long-term trends, others were the result of policy and geographic considerations.
I
HISTORICAL OVERVIEW
1 Vann Struth Consulting Group “Regional Economic Analysis. Vancouver and Central/Sunshine Coast: Final Report,” February 2009.
8 O C T O B E R 2 0 1 5 w w w . v i e a . c a

S T A T E O F T H E I S L A N D E C O N O M I C R E P O R T 9
A Look Back AT THE STATE oF THE VANCoUVER ISLAND REGIoN IN 2009
2 Creative Employment Access Society, “Comox Valley Labour Futures Project: Addressing the Skilled Worker Shortages,” 2006.
The 2009 study cited a number of long-term trends that were affecting Vancouver Island’s economy. Those trends included a movement away from goods production to service production which, combined with declining competitiveness of BC’s forest sector, meant fewer opportunities in traditional sectors and outside of urban areas. At the same time an aging population and an inflow of retirees from other regions was changing the infrastructure requirements of communities and the composition of the labour force.
These trends were creating challenges for businesses in terms of:
A Shortage of qualified labour due in part to the out-migration of young adults from the region. The report cited several studies that suggested that the region was perceived to have few local post-secondary education opportunities, limited career opportunities, and lower wages. Young adults were attracted to better employment opportunities in the Lower Mainland and Alberta.2
Succession planning. Changing demographics due to an aging local population and an influx of retirees from other regions in BC and Canada were making it difficult for business owners seeking to exit their businesses to find someone to replace them.
In addition businesses were dealing with persistent issues related to:
The high cost of transportation. Increases in fuel prices were increasing gasoline prices, ferry fares, and air fares. The region’s geographic separation from the mainland means that sea travel and air travel are the only options for businesses to move goods and workers and for visitors to come to the region. As a result increases in transportation costs can have a significant effect on overall business costs.
The scale of businesses limiting growth. Most businesses were too small to achieve economies of scale, access export markets, or improve their productivity by accessing capital for investment in equipment and technology.

1 0 O C T O B E R 2 0 1 5 w w w . v i e a . c a
Independent power generation projects.
Long time horizon.
Expanded production and processing due to trend in customer demand for high quality and local products.
Dependent on government regulation and environmental concerns.
Residential and commercial construction.
Economic downturn and declines in housing market.
Performance Below expectations due in part to mora-torium on issuing new finfish aquaculture licenses.
Performance
Declined as expected due to slow popula-tion growth and the economic downturn.
Has been relatively stable since 2012.
PerformanceModest growth. Since 2009 there have been six Independent Power Projects begin opera-tion with a total capac-ity of 206 MW.
AqUACULTURE, FISHING, FooD & AGRICULTURE
CoNSTRUCTIoN
UTILIITES
A Look Back AT THE STATE oF THE VANCoUVER ISLAND REGIoN IN 2009
ToURISM, ARTS & CULTURE
PerformanceBelow expectations due to economic downturn and strong Canadian dollar.
High-end resorts, cruise ship visits, and tourism events and attractions.
Filming activity.
Cultural events and attractions.
Dependent on prevailing macro-economic conditions.
Appreciation of the Canadian dollar.
Increasing transporta-tion costs.
Opportunities Challenges
Opportunities Challenges
Opportunities Challenges
Opportunities Challenges
FoRESTRY
Performance Modest improvements since 2012 due to strengthening global economy.
Manufacture of high-value products and non-timber forest products by small businesses.
Manufacture of commodity products such as logs and pulp by a few large, integrated forest companies.
Acquiring a secure supply of wood fibre.
Acquiring the significant level of capital investment needed to refurbish mills with new equipment and technology.
Opportunities Challenges
Outlook Uncertain
Outlook Slow growth
Outlook Decline
Outlook Uncertain
Outlook Slow Growth
The following table provides a high level summary of the outlook, opportunities and challenges by industry that were identified in the 2009 study, and includes a brief statement on how each sector performed between 2009 and 2014.

S T A T E O F T H E I S L A N D E C O N O M I C R E P O R T 1 1
oPPoRTUNITIES, CHALLENGES & oUTLook FoR ECoNoMIC DEVELoPMENT 2009
Performance
Growing quickly in the Capital region but below expectations in other regions.
Opportunities
Technology services.
Independent professionals.
Challenges
Dependent on attracting a population of skilled professionals.
TRANSPoRTATIoN & WAREHoUSING Outlook Slow Growth
RETAIL AND WHoLESALE TRADE Outlook Slow Growth
BUSINESS & PRoFESSIoNAL SERVICES Outlook Slow Growth
PUBLIC SECToR Outlook Slow Growth
Performance
Declined as expected due to slow popula-tion growth and the economic downturn
Opportunities
Services to meet needs of local population and tourists.
Challenges
Real estate industry is likely to be negatively im-pacted by housing market downturn.
Dependent on population growth.
Performance
Mixed with govern-ment services declin-ing while education services grew.
Opportunities
Expansion of public and private health and related services due to aging and retiree population.
Expansion of post-secondary educational institutions.
Expansion of government services.
Challenges
Dependent on public budgets.
General economic downturn may see workers upgrade their education.
Performance
As expected, no growth.
MINING
Opportunities
off-shore oil and gas exploration.
Development of mines.Aggregates production.
Challenges
Acquiring environmental approvals.
Slowdown in global demand.
Outlook No growth
HIGH TECH & PRoFESSIoNAL, SCIENTIFIC & TECHNICAL SERVICES
Outlook Fast growth
Opportunities
Development and ex-pansion of airports, har-bours, and rail service.
Challenges
Dependent on growth in other sectors of the economy.
Performance
Slow growth due to poor economic condi-tions.
Opportunities
Services to meet needs of local population and tourists.
Challenges
Dependent on population growth.
Performance
Below expectations due to slowing of popultation growth and poor economic conditions.

1 2 O C T O B E R 2 0 1 5 w w w . v i e a . c a
BC Real GDP (MILLIoNS oF 2007 CHAINED DoLLARS)
$160,000
$140,000
$120,000
$100,000
$80,000
$60,000
$40,000
$20,000
2009 2014
Goods-producing industries
Service-producing industries
—
Average Annual Growth Rate BC 2.6%
ive years after the 2009 study was completed, the global financial crisis is now considered by many economists
to be the worst financial crisis since the Great Depression. While Canada and BC fared relatively well, economic growth has been modest, averaging around 2% annually.3
For Vancouver Island, the period 2009 to 2014 has not been one of significant economic growth. Forestry, once the backbone of the region’s economy, has been in decline since the mid-1990s but has had modest gains in employment and output since 2012.Modest declines in the commercial fishing fleet in BC and lower catch levels on the South Coast suggest that fishing has declined. While there is not data available specific to agriculture production on Vancouver Island, employment trends suggest that production has not grown significantly.
Within the service producing industries there has been growth in educational services and high technology related sectors while employment trends suggest that real estate and wholesale and retail trade have declined.
F
Overview of the Economic Performance 2009 to 2014
Source: BC Stats, BC GDP by Industry NAICS Aggregations, 1997-2014
3 Statistics Canada, Gross Domestic Product, Expenditure-Based, Provincial and Territorial (CANSIM Table 384-0038)

S T A T E O F T H E I S L A N D E C O N O M I C R E P O R T 1 3
This is consistent with the outlook in the 2009 study which suggested that growth would be slow in most sectors and largely dependent on population growth. As expected, growth in Construction, Real Estate, Retail, and Business and Professional Services was affected by slow population growth and the economic downturn. The slow recovery of the US economy and the relatively high value of the Canadian dollar meant tourism performed somewhat below expectations. Growth in the high technology sector has been slower than expected while expansion of the aquaculture sector was halted in 2010 by a government moratorium on the issuing of additional licenses and tenures.
Historically Vancouver Island has consistently
had one of the highest population growth
rates among regions in BC outside of the
Lower Mainland.
A growing population means increases in
the number of households and increased
demand for services and housing which
benefits local businesses. Population growth
also tends to be associated with increases in
the size of the labour force, an important
factor in creating sustained economic growth.
Even when many of the people moving to a
region are not working and are supported
by pensions or other sources of non-
employment income, the increase in the
demand for services and housing will tend to
create job opportunities. This may encourage
people to remain in the region or attract
more people to the region.
DID
YOU
KNO
W?

1 4 O C T O B E R 2 0 1 5 w w w . v i e a . c a
OUTLOOK FOR 2015
lobal economic growth slowed in the first half of 2015, negatively impacting
economic conditions in Canada. In its July 2015 Monetary Policy Update the Bank of Canada downgraded its economic growth forecast for Canada from 1.9% to 1% in 2015. The lower forecast was due to lower business investment in the energy sector and weaker than expected exports. Growth was expected to be driven by non-resource sectors of the economy.
BC is expected to experience stronger economic growth than other regions in Canada in 2015.4 This is expected to come from increased exports to the US of forestry products and continued strength in the housing market. There are strong indications that the depreciation of the Canadian dollar is also having a positive impact on the province’s tourism industry.
Overall trends suggest that Vancouver Island will experience modest but sustained growth through 2015 and into 2016.
G
4 TD Economics, Provincial Economic Forecast, July 9, 2015
1 4 O C T O B E R 2 0 1 5 w w w . v i e a . c a

S T A T E O F T H E I S L A N D E C O N O M I C R E P O R T 1 5
In the first half of the year, indicators suggest that 2015 will be a strong year for tourism on Vancouver Island and that the housing market is improving due to migration from other regions of Canada and improvements in the local economy. Continued migration to the region and weakness in the Canadian dollar is expected through 2016 and this is expected to have a positive impact on the local economy through increased consumer expenditure and continued strong performance of the tourism sector. Migration patterns suggest that most of those benefits will be in the southern urban areas of the region. Key export sectors such as aquaculture and forestry are expected to benefit from continued strength in the US economy and this may provide a boost to rural areas and communities in the northern part of the region. Low oil prices are also expected to benefit the Vancouver Island economy through relatively lower transportation costs. For consumers, lower transportation costs are expected to somewhat offset increases in the price of imported food and consumer goods. For producers, lower transportation costs are expected to reduce the cost of moving goods to market.Longer term, recent changes to Aquaculture tenure rules and the granting of additional tenures for salmon aquaculture are expected to lead to modest increases in employment in the industry which may benefit communities in the northern and western regions of Vancouver Island.
BC Real GDP Growth Rate
2012 2013 2014 2015F 2016F
3.5
3
2.5
2
1.5
1
0.5
0
Gro
wth
Rat
e (%
)
BC Real GDP Growth Rate5
RBC Economics Forecast7
TD Economics Forecast6
Source: BC Stats, TD Economics and RBC Economics
5 BC Stats, BC GDP by Industry - NAICS Aggregations, 1997-20146 TD Economics, Provincial Economic Forecast, July 9, 20157 RBC Economics, Provincial Outlook June 2015
Overall trends suggest
that Vancouver Island
will experience modest
but sustained growth
through 2015 and
into 2016 due to
population growth,
strong performance of
the tourism sector and
increases in forestry
product exports to the
US.
Macroeconomic Indicators

1 6 O C T O B E R 2 0 1 5 w w w . v i e a . c a
2014
-01
2014
-02
2014
-03
2014
-04
2014
-05
2014
-06
2014
-07
2014
-08
2014
-09
2014
-10
2014
-11
2014
-12
2015
-01
2015
-02
2015
-03
2015
-04
2015
-05
2015
Q2
2015
Q3
2015
Q4
2016
Q1
2016
Q2
2016
Q3
2016
Q4
Exchange Rate
Bank of Canada8 RBC Economics Forecast10
TD EconomicsForecast9
Source: Bank of Canada, TD Economics and RBC Economics
1.35
1.30
1.25
1.20
1.15
1.10
1.05
1.00CA
D :
USD
ince 2014, the Canadian dollar has depre-ciated relative to the US dollar and, to a lesser extent, relative to the UK Pound
and the Chinese Yuan.8 This is expected to lead to increased competitiveness of BC exports and an increase in the price of imports. However, the effect of the increase in the price of imports on consumption is likely to be somewhat offset by increased purchasing power due to relative-ly lower fuel prices.
For Vancouver Island, the depreciation of the Canadian dollar is expected to positively impact tourism (see p. 35) and may provide a small boost to exports from the forestry sector (see p. 39). It may also partially offset the expected moderation in growth in the number of international students studying on Vancouver Island (see p.43). Aquaculture, another key export sector on Vancouver Island, is not expected to benefit significantly from the lower value of the Canadian dollar in the near term as production is constrained by tenure and licensing rules.
Analysts expect the Canadian dollar to depre-ciate further through the end of 2015 but to experience a modest recovery in value by the end of 2016.9
SContinued weakness
in the Canadian
dollar is expected to
benefit key sectors
on Vancouver
Island including
Tourism, Forestry
and International
Education.
Macroeconomic Indicators
8 Bank of Canada, Exchange Rates available here (http://www.bankofcanada.ca/rates/exchange/10-year-lookup/)9 TD Economics Quarterly Economic Forecast, June 201510 RBC Economics, Economic and Financial Market Outlook, June 2015

S T A T E O F T H E I S L A N D E C O N O M I C R E P O R T 1 7
Unemployment Rate by Region 2014
BRITISH COLUMBIA 6.1%
NORTHEAST 4.9
CARIBOO 6.0
LOWER MAINLAND- SOUTHWEST 6.0
NORTH COAST & NECHAKO 8.0
THOMPSON-OKANAGAN 6.3
KOOTENAY 6.9
VANCOUVER ISLAND & COAST 6.1
7 86543210%
Source: Statistics Canada Labour Force Survey Estimates (CANSIM Table 282-0123)
he positive economic outlook for Vancouver Island suggests that the unemployment rate is likely to decline modestly due to
increased employment opportunities in the hospitality sector, retail trade, construction and continued gains in forestry.
While the overall employment rate is expected to decline, the effects are not expected to be uniform. The southern regions of Vancouver Island where the population is growing is where most of the declines in unemployment are expected. Campbell River is also expected to have lower unemployment due to infrastructure projects currently underway (see p. 26) and strengthening of the forest sector. In other regions, unemployment rates are expected to be relatively stable.
For communities that are home to a significant number of people who commute to work in the oil industry in Alberta and northern BC, the recent layoffs in the industry are expected to impact the number of people seeking employment. The potential impact of this is not clear as there is no data on the number or distribution of people who are commuting to other regions to work and the improvements in forestry and construction may provide alternative employment for those who lose their jobs in the oil industry.
11 Statistics Canada, Labour Force Estimates (CANSIM Table 282-0123)
TThe general
improvement in
economic conditions
since 2012 has led
to declines in the
unemployment
rate in BC. On
Vancouver Island the
unemployment rate
has been relatively
stable at between
6.1% and 6.3%.11

1 8 O C T O B E R 2 0 1 5 w w w . v i e a . c a
Infrastructure and Development
Building Permit Values VANCoUVER ISLAND—JANUARY To JUNE (IN 000s)
he value of building permits on Vancouver Island has been trending upward since 2013. The growth has been driven by increases in residential permits in the Capital region, the Cowichan Valley, the Comox Valley and Nanaimo. Non-residential permit values have been declining since 2013 but remain slightly above the five year average.
Building permits indicate construction intentions, while housing starts indicate construction activity. Housing starts on Vancouver Island were relatively stable between 2013 and 2014 but have shown a significant increase in the first six months of 2015.12
While the above noted trends indicate an overall positive outlook for 2015 into 2016, regional differences do exist. The Alberni-Clayoquot region has been experiencing year over year declines in the value of building permits since 2011. This appears to be due to declines in residential construction in Ucluelet and rural areas and volatility in non-residential construction. The value of permits for residential construction in other municipalities in the Alberni-Clayoquot region has been relatively stable.
Positive growth in
building permits and
housing starts suggest
a positive economic
outlook for the region
in the near term.
$600,000
$500,000
$400,000
$300,000
$200,000
$100,000
$
Source: Statistics Canada, Produced by BC Stats (www.bcstats.gov.bc.ca)
Residential
2014 2015
Commercial Industrial InstitutionalGovernment
12 CMHC (Starts and Completions Survey) for centres with population 10,000+
T

S T A T E O F T H E I S L A N D E C O N O M I C R E P O R T 1 9
Housing StartsFIRST SIx MoNTHS oF 2015
54%
Building Permits BY REGIoNAL DISTRICT—JANUARY To JUNE 2015 (IN 000s)
Mt. Waddington
ComoxValley
Strathcona
AlberniClayoquot
Nanaimo
CowichanValley
Capital
$9,313
$362,712
$56,401
$154,183
$103,898
$277
$23,255
Source: Statistics Canada, Produced by BC Stats (www.bcstats.gov.bc.ca)
In the Strathcona region, development in Campbell River has been a significant factor in growth in the overall value of building permits. Outside of Campbell River the value of building permits has been relatively stable.
In the Nanaimo, Capital and Cowichan Valley regions both the value and number of units for residential construction have been increasing while non-residential values are below the five year average.
In the Comox Valley both residential and non-residential building permits have increased.
In Mount Waddington residential permit values have been increasing but are down slightly in the first six months of 2015. It should be noted that building permit values in this region can be highly volatile due to low levels of development and a relatively small population which can result in a single project doubling the overall level of activity.
Source: CMHC (Starts and Completions Survey) for centres with population 10,000+

2 0 O C T O B E R 2 0 1 5 w w w . v i e a . c a
Major Infrastructure Projects Under ConstructionVANCoUVER ISLAND
Infrastructure Investment
C
13 Province of British Columbia, “New Highway 4 fibre – expanded, better internet service” http://www2.news.gov.bc.ca/news_releases_2013-2017/2014MTICS0026-001904.htm (accessed August 30, 2015)14 BC Hydro, “B.C. Utilities Commission approves John Hart generating station replacement” accessed at https://www.bchydro.com/news/press_centre/news_releases/2013/john-hart-replacement.html
Utilities
1,338 Transportation
109 Hospitals
605
Value of Investment ($MILLIoNS)
urrent infrastructure investment on Vancouver Island is primarily focused on maintenance; however, there is investment in expansion of power generating capacity and hospitals.
The major power projects underway include:
Replacement of the John Hart Generating Station in Campbell River. The existing facility has been in operation since 1947, its electrical output is below capacity and it requires seismic upgrading. The new facility will have a higher capacity and will be able to provide power to approximately 80,000 more homes.14 Construction of new power substations. Power substations are being built in Nanaimo and Courtenay and a substation at Long Beach is being expanded to meet increased demand for electricity.
Investments in improving access to health care are being made through the North Island Hospitals Project. This involves the replacement and expansion of hospitals in Comox and Campbell River to provide improved access to acute care services in the North Island region.
Investments in infrastructure maintenance currently underway include the replacement and expansion of schools in Nanaimo, Oak Bay and Langford, the construction of a cable ferry to provide service between Denman Island and Buckley Bay, and the replacement of the Johnson Street bridge in Victoria.
Investments are being made in powergenerating capacity, hospitals, and broadband and wireless capacity.
Source: British Columbia MajorProjects Inventory, March 2015
Fibre optic capacity
is being increased
in the western and
northern areas of
Vancouver Island.13
While this will bring
improved connectivity
to businesses and
consumers in these
regions it is unlikely
to provide sufficient
capacity to support
significant expansion
of Vancouver Island’s
high tech sector
outside of the
southern regions.

S T A T E O F T H E I S L A N D E C O N O M I C R E P O R T 2 1
BUSINESS ENVIRONMENT AND INVESTMENT ATTRACTION
ancouver Island’s business community is growing and there
is some indication that foreign investment is taking place through the immigration of entrepreneurs. However, the scale of businesses remains small and there appears to be growth in the number of self-employed people. This suggests that businesses continue to face challenges with respect to developing new markets beyond the local area, achieving economies of scale and accessing capital for investment in equipment and technology.
V
S T A T E O F T H E I S L A N D E C O N O M I C R E P O R T 2 1

2 2 O C T O B E R 2 0 1 5 w w w . v i e a . c a
Number of Businesses with Employees
Educational Services
407Health Care & Social Assistance
3,276
Utilities
37Construction
3,509
Retail Trade
3,809Transportation & Warehousing
921
Finance & Insurance
1,017Information & Cultural Industries
304
Mining & oil & Gas Extraction
69Agriculture, Forestry, Fishing & Hunting
1,285
Manufacturing
960Wholesale Trade
927
other Services (excl. Public Admin.)
2,395Public Administration
371
Arts, Entertainment & Recreation
501Accommodation & Food Services
2,049
Real Estate & Rental & Leasing
1,371Professional, Scientific & Technical Services
3,232
Management of Companies & Enterprises
299
Admin. & Support, Waste Management & Remediation
1,223
Growing Stable Declining
Source: Statistics Canada Business Register
S T A T E O F T H E I S L A N D E C O N O M I C R E P O R T 2 3
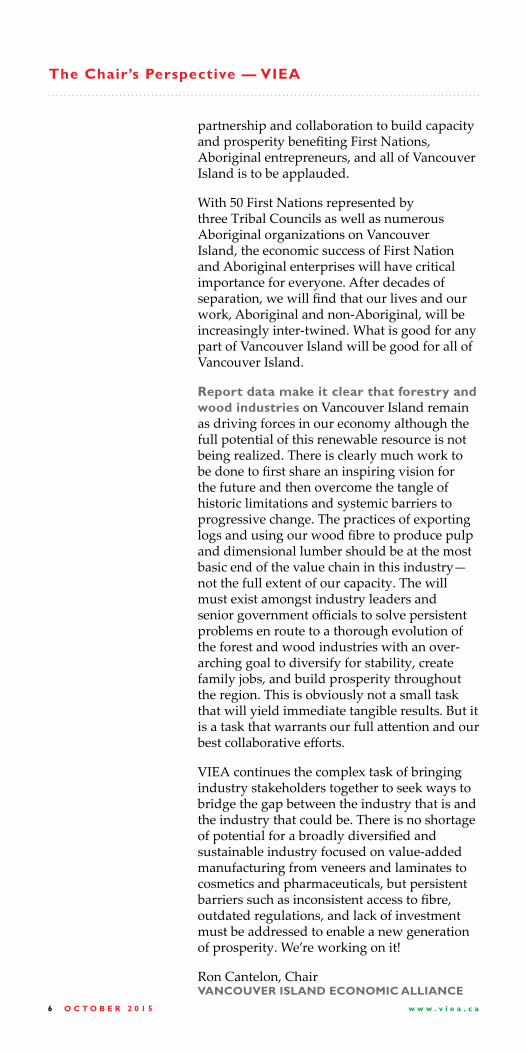
Business Formations—Incorporations BY REGIoNAL DISTRICT
rowth in the number of busi-nesses on Vancouver Island is
consistent with improving economic conditions in the region. Among the key sectors, the number of businesses classified as Agriculture, Forestry, Fishing & Hunting has increased since 2010 as have the number of businesses in Education Services, Professional Scientific and Technical Services, and Health Care and Social Assistance. Some expansion has also occurred in Information and Culture Industries.
The expansion of key sectors has occurred in all regions on Vancouver Island with the exception of the Mt. Waddington and Alberni-Clayoquot Regional Districts. The number of businesses in Mt. Waddington did not grow significantly between 2010 and 2014 and in Alberni-Clayoquot, the modest growth that occurred was confined to Agriculture, Forestry, Fishing & Hunting and Professional, Scientific and Technical Services.
While there has been growth in the number of businesses with employees, the scale of businesses remains small. According to location counts from Statistics Canada’s Business Register, most businesses on Vancouver Island have fewer than 20 employees and the number
GThere has been
expansion of the
number of businesses
in key sectors but the
scale of businesses
remains small and
there is some indica-
tion that there is an
increasing number of
people who are self-
employed.
1,974
87
210151
614
244
24
Strathcona
ComoxValley
Nanaimo
Capital CowichanValley
Alberni- Clayoquot
MountWaddington
Source: Statistics Canada Business Register
2010-2013(ANNUAL AVERAGE)
1,987
90
201156
722
283
342014

2 4 O C T O B E R 2 0 1 5 w w w . v i e a . c a
Insolvency
British Columbia
8,102Vancouver Islandand Coast
1,794
BusinessBankruptcies AVERAGE ANNUAL2010-2013
British Columbia
201Vancouver Islandand Coast
34
British Columbia
6,345
Vancouver Islandand Coast
1,499
BusinessBankruptcies 2014
British Columbia
200Vancouver Islandand Coast
39
Consumer BankruptciesAVERAGE ANNUAL2010-2013
Consumer Bankruptcies2014
Source: Office of the Superintendent of Bankruptcy Canada
of businesses identified as having no employees has grown. The latter suggests that there may have been growth in the number of people who are self-employed or increased usage of contract workers or unpaid family members.
Further evidence of strength in the local economy is found in bankruptcy statistics. The number of consumer bankruptcies has been declining since 2010 and in 2014 was well below the annual average for the period 2010-2013. The number of business bankruptcies has been relatively stable.

S T A T E O F T H E I S L A N D E C O N O M I C R E P O R T 2 5
he British Columbia Provincial Nominee Program (BC PNP) facilitates the immigr-
tion of skilled foreign workers, international students, and entrepreneurs. Prospective applicants are nominated for permanent residency through either the Skills Immigration stream or through the Entrepreneur Immigration stream.
Nominees under the Skills Immigration stream are selected based on the skills, education and/or experience required for high-demand occupations in the province. The number of applicants under this program on Vancouver Island has been increasing, albeit gradually. Between 2010 and 2014, there were 1,425applicants for skills immigration on Vancouver Island, of which 75% received nominations for permanent residency.
Nominees under the Entrepreneur Immigration stream are required to meet a determined financial investment amount, and demonstrate the ability to create job opportunities. Between 2010 and 2014 applications to the program have increased; however, the proportion of applicants that receive nominations is relatively low. Of the 1,310 applicants for the Entrepreneur Immigration stream on Vancouver Island during the period, about 17% received work permits and, only 5% received a nomination.
Nominations 1,075
Skills Immigration2010-2014
Source: PNP data provided by BC Ministry of Jobs, Tourism and Skills Training
*includes Strategic Projects invest-ment of $235 million
Approximately 200
skilled immigrants
receive nominations
for residency on
Vancouver Island
annually based on their
ability to fill gaps in the
local labour force.Skills ImmigrationApplications
Entrepreneur ImmigrationApplications
700
600
500
400
300
200
100
2010 2011 2012 2013 2014
Applications to the Provincial Nominee Program
0
T
Skilled and Entrepreneur Immigration
Data provided by the Ministry of Jobs, Tourism and Skills Training
Entrepreneur Immigration 2010-2014
Work Permits
224Nominations
65Jobs Created
154Investment
$356 MILLIoN*

2 6 O C T O B E R 2 0 1 5 w w w . v i e a . c a
I
Airport Passenger Volumes 2014
Jan to May 2015
Source: Destination BC
he Strathcona Regional District is one of the less populated, more rural regions on Van-couver Island and has historically been
dependent on resource industries such as min-ing, forestry and fishing to provide jobs. Since 2008 the region has lost a number of major employers in the forest industry, and more recently, the Myra Falls zinc and copper mine scaled back its workforce. Despite the ensuing job losses, the region’s largest city, Campbell River, is enjoying a period of growth due to a combination of infrastructure investment and economic development incentives aimed at diversifying the economy.
The replacement of the John Hart Generating Station started a construction boom that the City successfully leveraged into additional investments in infrastructure. According to Mayor Andy Adams, the infrastructure investment combined with tax incentives to encourage the revitalization of the downtown core has created a thriving construction sector that is attracting workers and businesses to the region.
Bright IDEASIN STRATHCoNA
Population Growth 2013-2014
Source: BC Stats
John Hart Replacement Project
$1,093North Island Hospital Project
$605Sequoia Springs / Kingfisher Residential Project
$80Total
$1,778Source: BC Major Projects Inventory, March 2015
Infrastructure Investment ($ MILLIONS)
1.4%
12.8%
4.6%
T

S T A T E O F T H E I S L A N D E C O N O M I C R E P O R T 2 7
I
By providing five-
year tax exemptions
for developments
in the downtown
core, Campbell River
has been able to
expand its tax base
and encourage the
revitalization of the
downtown area.
Construction is expected to provide a continued boost to the local economy through 2019. In an effort to sustain growth beyond the end of the construction period the City has been actively pursuing a number of diversification opportunities including the development of aircraft maintenance facilities, the attraction of film productions, and the addition of tourist activities and attractions .
Amid all this activity, the region’s traditional economic drivers are poised to expand. The outlook for the local forest industry is improving which is leading to the evaluation of investment in new capacity and new manufacturing facilities. Due to the issuance of new salmon farming licenses, local salmon aquaculture operators will be working with First Nations on the development of four new salmon farming sites in northern and western regions of Vancouver Island.

2 8 O C T O B E R 2 0 1 5 w w w . v i e a . c a
ince 2010, Vancouver Island’spopulation has been growing
at an average annual rate of approxi-mately 0.5%.15 This growth is being driven by migration from other regions of Canada and to a lesser extent from other regions of BC.16 International immigration has not been a significant contributor to growth.
Vancouver Island’s population growth rate tends to be comparable to other regions in BC that are outside of the Lower Mainland.
Of particular interest is why population growth is occurring and how the labour force and the local economy are affected. Since 2010, the working age population has declined by approximately 1.5%, while the population 65 and older has increased by approximately 17%.17
S
15 BC Stats, Population Estimates 2010-201416 BC Stats, British Columbia Development Region Migration Components, February 2015 17 BC Stats, population estimates 2001-2014
POPULATION AND LABOUR FORCE
2 8 O C T O B E R 2 0 1 5 w w w . v i e a . c a

S T A T E O F T H E I S L A N D E C O N O M I C R E P O R T 2 9
Population Growth BY REGIoN 2013 To 2014
1,7121.1%
7480.9%
1,1980.3%
6261.4%
2110.3%
(-67)(-0.6%)
Source: BC Stats, Population Estimates by Regional Districts and Development Regions
Population Distribution VANCoUVER ISLAND AND CoAST
70
60
50
40
30
20
10
015 and under 15 - 64 65 and over
%
Source: BC Stats, Population by Age and Sex
BY AGE GRoUP
Strathcona
Mt. Waddington
Comox Valley
Cowichan Valley
Capital
AlberniClayoquot
Nanaimo
Vancouver Island’s
population continues
to age. Between 2010
and 2014 the share of
the population aged
65 and over grew by
4%.
2005 2010 2014
stable

3 0 O C T O B E R 2 0 1 5 w w w . v i e a . c a
A growing number
of retirees with
pension income is
expected to generate
opportunities for
businesses providing
community and
personal services and
retailers.
Between 2010 and 2014 the employment rate* declined from 59.4% to 54.2%, the unemploy-ment rate declined and employment levels fell.18 This is consistent with a growing number of retirees and a shrinking labour force which suggests that population growth is being influenced by factors other than economic opportunities.
Further evidence that population growth is not related to economic opportunities is provided by trends in employment. Overall employment levels have fallen by approximately 7% since 2010 and the employment rate has fallen by 5% during the same period.19 While other regions of the province have also experienced declines in employment rates, the decline on Vancouver Island has been the greatest.
It should be noted that while the overall trends suggest most migration to the region is by those 55 and over, this may not be the case in all areas. The recent growth in the population of the Strathcona regional district is likely related to infrastructure projects in Campbell River (see p. 26) and is not expected to include a significant number of retirees. Similarly, some of the growth in the Comox Valley is likely related to the construction of a new hospital and infrastructure upgrades at CFB Comox.
Employment Rate BY REGIoN 2014
BRITISH COLUMBIA 59.5%
NORTHEAST
CARIBOO
NORTH COAST & NECHAKO
THOMPSON-OKANAGAN
KOOTENAY
VANCOUVER ISLAND & COAST
LOWER MAINLAND- SOUTHWEST
70.1
67.2
60.8
58.7
58.0
55.2
54.2
70 806050403020100%
Source: Statistics Canada, Labour Force Survey Estimates (CANSIM table 282-0123)
Vancouver Island,
like many other
regions of BC,
is experiencing
declines in overall
employment levels.
* Employment rate is the share of the population aged 15 and over that are employed. 18 Statistics Canada Labour Force Survey Estimates (CANSIM Table 282-0123)19 Ibid

S T A T E O F T H E I S L A N D E C O N O M I C R E P O R T 3 1
he changes in the age structure of the population are affecting the labour force. Between 2010 and 2014, the number of
people in the labour force on Vancouver Island declined by approximately 28,000 (7.0%).20
Most regions of the province outside the Lower Mainland also experienced labour force declines, but of a smaller magnitude.
Participation rates are falling for both men and women, particularly among those aged 50 and over. Among those aged 25 to 49, labour force participation rates are stable. In this age group, men’s participation rate is approximately 89% and women’s participation rate is approximately 82%.21 This suggests that most of the decline in labour force participation rates are due to changes in the age composition of the population, not people in their prime working years dropping out of the labour force.
Among youth (aged 15 to 24) participation rates have fallen marginally. This is likely the result of fewer opportunities for unskilled labour leading to increasing levels of post-secondary attendance.
Labour ForceParticipation Rate BY REGIoN 2014
Labour Force Participation Rate Trends oVERALL BY AGE 2010 To 2014
BRITISH COLUMBIA 63.3%
NORTHEAST
CARIBOO
NORTH COAST & NECHAKO
THOMPSON-OKANAGAN
KOOTENAY
VANCOUVER ISLAND & COAST
LOWER MAINLAND-SOUTHWEST
74.0
71.5
64.7
63.8
61.9
59.3
57.7
70 806050403020100%
Vancouver Island’s
labour force is
declining due to
a combination of
declining participation
rates among older
workers and an aging
population.
T
20 Statistics Canada, Labour Force Survey Estimates (CANSIM Table 282-0123)21 Statistics Canada, Labour Force Survey (2010-2013)
Source: Statistics Canada, Labour Force Survey Estimates (CANSIM Table 282-0123)
Source: Statistics Canada’s Labour Force Survey (2010-13)
15-24
25-49
50-64
65+
overall

3 2 O C T O B E R 2 0 1 5 w w w . v i e a . c a
GO
OD
S-PR
OD
UC
ING
SEC
TO
R 6
2SE
RV
ICE
-PR
OD
UC
ING
SEC
TO
R 2
90
Construction 29.5
Manufacturing17.6
Forestry, Fishing, Mining, oil and Gas
9.4
Agriculture3.8
Utilities1.7
Wholesale and Retail Trade
54.0
Professional Scientific and Technical Services
28.4
Educational Services26.4
Public Administration23.5
Finance, Insurance Real Estate and Leasing
15.9
Information, Culture and Recreation
15.2
Business, Building and other Support Services
11.3
Employment By Industry 2014 (IN 000S)
Health Care and Social Assistance
54.1
Accommodation and Food Services
29.8
other Services16.7
Transportation and Warehousing
14.7
Source: Statistics Canada, Labour Force Survey, Custom Tabulation. Prepared by BC Stats, March 2015.
S T A T E O F T H E I S L A N D E C O N O M I C R E P O R T 3 3
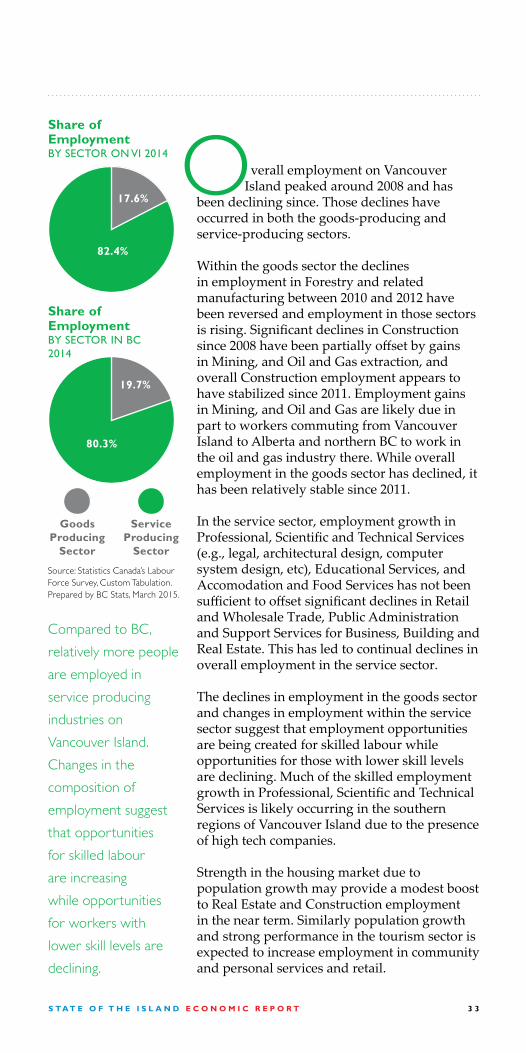
verall employment on VancouverIsland peaked around 2008 and has
been declining since. Those declines have occurred in both the goods-producing and service-producing sectors.
Within the goods sector the declines in employment in Forestry and related manufacturing between 2010 and 2012 have been reversed and employment in those sectors is rising. Significant declines in Construction since 2008 have been partially offset by gains in Mining, and Oil and Gas extraction, and overall Construction employment appears to have stabilized since 2011. Employment gains in Mining, and Oil and Gas are likely due in part to workers commuting from Vancouver Island to Alberta and northern BC to work in the oil and gas industry there. While overall employment in the goods sector has declined, it has been relatively stable since 2011.
In the service sector, employment growth in Professional, Scientific and Technical Services (e.g., legal, architectural design, computer system design, etc), Educational Services, and Accomodation and Food Services has not been sufficient to offset significant declines in Retail and Wholesale Trade, Public Administration and Support Services for Business, Building and Real Estate. This has led to continual declines in overall employment in the service sector.
The declines in employment in the goods sector and changes in employment within the service sector suggest that employment opportunities are being created for skilled labour while opportunities for those with lower skill levels are declining. Much of the skilled employment growth in Professional, Scientific and Technical Services is likely occurring in the southern regions of Vancouver Island due to the presence of high tech companies.
Strength in the housing market due to population growth may provide a modest boost to Real Estate and Construction employment in the near term. Similarly population growth and strong performance in the tourism sector is expected to increase employment in community and personal services and retail.
OShare of Employment BY SECToR oN VI 2014
Share of Employment BY SECToR IN BC 2014
Goods Producing
Sector
Service Producing
Sector
17.6%
82.4%
19.7%
80.3%
Compared to BC,
relatively more people
are employed in
service producing
industries on
Vancouver Island.
Changes in the
composition of
employment suggest
that opportunities
for skilled labour
are increasing
while opportunities
for workers with
lower skill levels are
declining.
Source: Statistics Canada’s Labour Force Survey, Custom Tabulation. Prepared by BC Stats, March 2015.

3 4 O C T O B E R 2 0 1 5 w w w . v i e a . c a
he decline of the forest industry and demographic changes has
encouraged a somewhat more diverse economy on Vancouver Island. Key sectors such as Tourism, Forestry and Aquaculture remain important, particularly in the northern communities, but new sectors are emerging and smaller sectors are growing.
Since 2009, International Education has emerged as an important export industry for BC and more and more international students are choosing to study on Vancouver Island. In the southern regions, high tech is growing in importance and Vancouver Island is home to some of BC’s larger high tech manufacturing businesses.22
T
INDUSTRY ANALYSIS
22 BC Stats, “Profile of the British Columbia High Technology Sector: 2014 Edition,” June 2015.
3 4 O C T O B E R 2 0 1 5 w w w . v i e a . c a

S T A T E O F T H E I S L A N D E C O N O M I C R E P O R T 3 5
Tourism
fter a period of modest performance, all indicators suggest that Tourism on Vancouver Island is up by between 5% and 7% in 2015.
Year over year passenger volumes on BC Ferries are up approximately 4% while vehicle traffic is up by approximately 5% in the first six months of 2015. Similarily, passenger volumes at the region’s airports are up around 6%. The increases in traffic appear to be translating into higher occupancy rates and increased revenues for the region’s hotels. Similar impacts are expected for restaurants and other Tourism related businesses.
Tourism’s strong performance is likely related to declines in the value of the Canadian dollar, the weakness in the Canadian economy and strengthening in the US economy. Those factors are likely encouraging Canadians to stay in Canada and American visitors to travel to Canada.
A
Ferry Traffic YEAR oVER YEAR CHANGE
2014-2015 JAN - JUN
Source: BC Ferries
98,777 - 101,143
-0.004%
2.4%
8.6%
5.1%
4.3%
73,417 - 79,766
9,878 - 9,836
2013-14JAN - DEC
2014-15 JAN - JUN
Source: Destination BC, Provincial Tourism Indicators
Visitor Indicators YEAR oVER YEAR CHANGE
1.8% 5.4%
3.8% 5.3%$
7.0% 6.9%
0.6% 8.2%Visitor Centre
1,353,042 - 1,421,414
4,402,591 - 4,592,864

3 6 O C T O B E R 2 0 1 5 w w w . v i e a . c a
-
C
TourismIndex of Exchange Rates Relative to the Canadian Dollar
SEPTEMBER 2014 - AUGUST 2015
hanges in the value of the Canadian dollar can have a significant influence on travel decisions. As the Canadian dollar rises in value relative to the US dollar, travel to the US becomes relatively less expensive for Canadians and cross-border trips increase. When the Canadian dollar falls relative to the US dollar, travel to the US becomes relatively more expensive for Canadians and cross-border trips decrease.
A study in the mid-2000s by the Canadian Travel Commission found that each 10% gain in the value of the Canadian dollar relative to the US dollar led to an increase of between 15% and 16% in overnight trips to the US by Canadians.23 The relationship between exchange rate fluctuations and travel decisions was not found to be as strong for American visitors to Canada. For Americans, a 10% increase in the value of the US dollar increased overnight trips by between 3% and 4%.
This suggests that the declining Canadian dollar is encouraging Canadians to vacation at home and much of the observed increase in tourism activity on Vancouver Island in 2015 is expected to be due to this. At the same time the
AUDGBP EURUSD CNY
120
115
110
105
100
95
90Inde
x (S
ept
2014
=100
)
2014-09 2015-02 2015-08
23 Statistics Canada, “The exchange rate and tourism”, http://www41.stat-can.gc.ca/2006/4007/ceb4007_001-eng.htm (accessed August 29, 2015)
Source: Bank of Canada, Monthly Average Exchange Rate
ExCHANGE RATE$&
Exchange Rate SEPT 2015
Change in Value 2014/09-2015/09
CAD:USD 1.32CAD:AUD 0.94CAD:CNY 0.21CAD:EUR 1.49CAD:GBP 2.04
CAD:USD -20%CAD:AUD 6%CAD:CNY -16%CAD:EUR -5%CAD:GBP -14%
S T A T E O F T H E I S L A N D E C O N O M I C R E P O R T 3 7
I
strengthening US economy is likely encouraging more travel to Canada by Americans which suggests that some of the increase is also due to increased visits by Americans.
International trips tend to be planned further in advance so there tends to be a lag between changes in the exchange rate and changes in international travel behaviour. The value of the Canadian dollar has fallen relative to the Chinese Yuan and the UK Pound but has been relatively stable compared with the Euro and Australian Dollar while the US dollar has appreciated relative to all currencies (see graph—opposite). This means that travel to the US has become relatively more expensive while travel to Canada has become relatively cheaper for visitors from China and the United Kingdom. For European and Australian visitors to Canada the cost of a vacation to Canada is about the same while the cost of visiting the US has gone up. Consequently, there is also likely to have been increases in international visitors from key markets to Vancouver Island in 2015 but the full effect of the exchange rate on international visits may not yet be being realized due to the lag between travel planning and exchange rate changes.
Depreciation in the
value of the Canadian
dollar encourages
more Canadians to
vacation at home and
this is likely among the
most significant factors
behind the recent
improvements in the
Tourism sector.
3 8 O C T O B E R 2 0 1 5 w w w . v i e a . c a
27
26
2514
13
18
23
24
20
131
4832
4
4
10
21
9
36
13
9
6
3
1
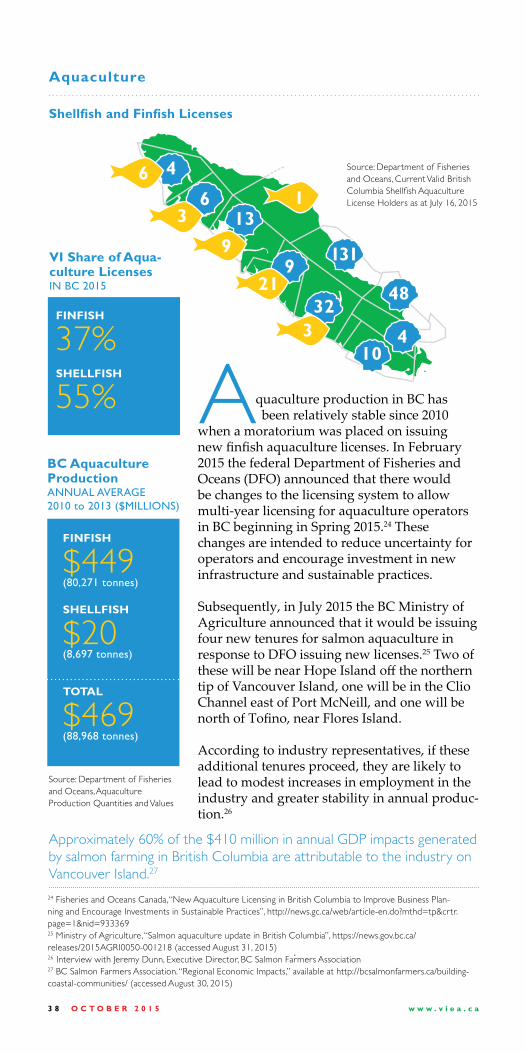
Source: Department of Fisheries and Oceans, Current Valid British Columbia Shellfish Aquaculture License Holders as at July 16, 2015
24 Fisheries and Oceans Canada, “New Aquaculture Licensing in British Columbia to Improve Business Plan-ning and Encourage Investments in Sustainable Practices”, http://news.gc.ca/web/article-en.do?mthd=tp&crtr.page=1&nid=93336925 Ministry of Agriculture, “Salmon aquaculture update in British Columbia”, https://news.gov.bc.ca/releases/2015AGRI0050-001218 (accessed August 31, 2015)26 Interview with Jeremy Dunn, Executive Director, BC Salmon Farmers Association27 BC Salmon Farmers Association. “Regional Economic Impacts,” available at http://bcsalmonfarmers.ca/building-coastal-communities/ (accessed August 30, 2015)
BC Aquaculture Production ANNUAL AVERAGE 2010 to 2013 ($MILLIoNS)
quaculture production in BC hasbeen relatively stable since 2010
when a moratorium was placed on issuing new finfish aquaculture licenses. In February 2015 the federal Department of Fisheries and Oceans (DFO) announced that there would be changes to the licensing system to allow multi-year licensing for aquaculture operators in BC beginning in Spring 2015.24 These changes are intended to reduce uncertainty for operators and encourage investment in new infrastructure and sustainable practices.
Subsequently, in July 2015 the BC Ministry of Agriculture announced that it would be issuing four new tenures for salmon aquaculture in response to DFO issuing new licenses.25 Two of these will be near Hope Island off the northern tip of Vancouver Island, one will be in the Clio Channel east of Port McNeill, and one will be north of Tofino, near Flores Island.
According to industry representatives, if these additional tenures proceed, they are likely to lead to modest increases in employment in the industry and greater stability in annual produc-tion.26
Source: Department of Fisheries and Oceans, Aquaculture Production Quantities and Values
FINFISH
$449(80,271 tonnes)
SHELLFISH
$20 (8,697 tonnes)
TOTAL
$469(88,968 tonnes)
FINFISH
37%SHELLFISH
55%
Shellfish and Finfish Licenses
Approximately 60% of the $410 million in annual GDP impacts generated by salmon farming in British Columbia are attributable to the industry on Vancouver Island.27
A
Aquaculture
VI Share of Aqua-culture Licenses IN BC 2015

S T A T E O F T H E I S L A N D E C O N O M I C R E P O R T 3 9
Employment2014
11,000Primary Timber Processing Facilities on VI 2013
9% of log input capacity in BC
Forestry
Source: Nanaimo Port Authority Cargo Statistics, Port Alberni Port Authority
Source: Statistics Canada Labour Force Survey. Custom Tabulation, Prepared by BC Stats, March 2015
4,000,000
4,500,000
3,500,0003,000,0002,500,0002,000,0001,500,0001,000,000
500,0000
2010 2011 2012 2013 2014
LOGS
FOREST PRODUCTS
Forest Product and Log Cargo Volumes THRoUGH PoRT ALBERNI AND PoRT oF NANAIMo IN METRIC ToNNES
Distribution of Forest Sector Employment VANCoUVER ISLAND 2014
Pulp and Paper*
Manufacturing 30.9%
Forestry and Logging
40.9%
Wood Product Manufacturing
28.2%
LUMBER MILLS
23PULP & PAPER
4POLE & POST
4OTHER
2TOTAL
331 Source: Ministry of Forests, Lands and Natural Resource Operations, 2013
hile the economic contributionof the forest sector has declined
on Vancouver Island, forestryis still an important part of the economy. Since 2010 the sector has been slowly recovering from the production declines that resulted from the collapse of the US housing market. This recovery has been aided by increased demand from China for commodity products including pulp, logs and lumber and more recently improvements in the US housing market.
W
* Values are for Paper Manufacturing Industry which includes Pulp.

4 0 O C T O B E R 2 0 1 5 w w w . v i e a . c a
Source: Ministry of Forests, Lands and Natural Resources Harvest Billing System
The outlook for the
forest industry is
for slow and steady
growth driven by con-
tinued improvements
in the US housing
market.
Employment in Forestry has risen approximately 8% since 2010,28 with most of the increases being in Forestry and Logging while employment in Wood Product Manufacturing has increased marginally and employment in Pulp and Paper* production is down slightly. This is consistent with higher levels of harvesting and modest increases in lumber production.
The increase in activity suggested by employment trends is reflected in increases in the cargo volumes of forestry related goods through Vancouver Island ports. Between 2010 and 2014 total cargo volumes of logs and forest products increased by approximately 78%.29 The volumes of logs has more than doubled over the period, while the volume of forest products has increased by about 32%.30
Overall capital investment in the sector in BC has been trending upwards since 201331 and new investments are being made in manufacturing capacity.
Harvest Volumes on Crown Land by Natural Resource District (m3)
16,000,000
14,000,000
12,000,000
10,000,000
8,000,000
6,000,000
4,000,000
2,000,000
―2012 2013 2014
Campbell River Natural Resource District
North Island - Central Coast Natural Resource District
South Island Natural Resource District
* Based on changes in paper manufacturing employment which includes pulp.28 Statistics Canada, Labour Force Survey. Custom Tabulation, Prepared by BC Stats, March 2015.29 Nanaimo Port Authority cargo statistics. Available here (http://deepsea.npa.ca/files/9414/2307/8362/Nanaimo_Port_Authority_Cargo_Sta-tistics___2010_to_2014.pdf) (Accessed September 1, 2015) and data provided by Port Alberni Port Authority30 Ibid.31 Statistics Canada, Capital and Repair Expenditures, by sector and prov-ince (CANSIM Table 029-0045)

S T A T E O F T H E I S L A N D E C O N O M I C R E P O R T 4 1
On Vancouver Island, significant investments in upgrades to power generation capabilities have been made to the Harmac Pacific pulp mill in Nanaimo and the Saltair Sawmill in Ladysmith is currently undergoing an expansion that will increase its production capacity.
Between January and July of 2015 the value of forest product exports from BC increased approximately 4%.32 The share of the value of exports attributable to the US market increased slightly while the share attributable to Japan and other markets declined. While year-to- date the value of exports to China is up, in July Chinese exports declined which may indicate softening demand due to weakening in the Chinese economy. This, combined with declines in the value of exports to Japan, suggests that growth in Vancouver Island’s forest industry will slow in the second half of the year unless supply can be redirected to the US market.
China is the second largest export market
for BC forestry companies and currently
accounts for approximately 30% of sector
exports. Since 2009, increases in exports to
China have been an important factor in the
forest sector’s recovery.33
BC wood is being used in reconstruction
efforts following the 2011 tsunami in Japan.34
DID
YOU
KNO
W?
32 Ministry of Forests, Lands and Natural Resource Opera-tions, “July 2015 Exports Report” 33 BC Ministry of Forests, Lands and Natural Resources, “2013 Economic State of the B.C. Forest Sector”, August 2014.34 Vancouver Sun, “Canadian wood, expertise aids Japan’s tsu-nami reconstruction” available here: http://www.vancouver-sun.com/business/canadian+wood+expertise+aids+japan+tsunami+reconstruction/8336296/story.html?__lsa=b14c-1704 (accessed September 15, 2015)

4 2 O C T O B E R 2 0 1 5 w w w . v i e a . c a
MARkETSoPENING
oPPoRTUNITIESFree trade agreements are providing improved market access for BC forestry product producers. In 2014, BC exported over $200 million of lumber and manufactured wood products to South Korea.
The value of exports to Korea is expected to increase as a result of the Canada-South Korea Free Trade Agreement which went into effect January 1, 2015. Under this agreement, tariffs on forestry and value-added wood products will be removed. Prior to the agreement, lumber was subject to 5% duty and this will be eliminated by 2018.35 Of particular relevance to Vancouver Island producers is the removal of tariffs on western hemlock lumber and cedar lumber.
CHALLENGESAmong the ongoing challenges faced by coastal forest producers are relatively high fibre, labour and energy costs compared to global competitors. This means that coastal producers are not cost-competitive in producing commodity grade products and the volumes of specialty products for niche markets are not sufficient to offset the higher cost of production for the commodity grade products.
In addition, policy changes in Japan to encourage the use of domestic wood products, the threat of tariffs on paper products exported to China and the expiry of the Canada-US Softwood Lumber Agreement October 12 are all creating uncertainty.
35 Foreign Affairs, Trade and Development Canada, “Canada-Korea Free Trade Agreement (CKFTA) –Overview”; available here: http://international.gc.ca/trade-agreements-accords-commerciaux/agr-acc/korea-coree/overview-apercu.aspx?lang=eng#1
WO
OD
4 2 O C T O B E R 2 0 1 5 w w w . v i e a . c a

S T A T E O F T H E I S L A N D E C O N O M I C R E P O R T 4 3
Education
ancouver Island’s education sector hasbeen expanding due in part to growth
in the number of international studentschoosing to attend institutions in the region. Between 2010 and 2013, the number of international students enrolled in publicly funded post-secondary institutions and K-12 schools on Vancouver Island increased by approximately 32% from 6,144 students to 8,133. During the same period, employment in the Educational Services sector increased by about 15%36 and the number of businesses in Educational Services rose.37 While growth in international students studying in BC is expected to continue, the rate of growth has been slowing and this trend is likely to continue.38 The slowing of growth will likely affect institutions in the Lower Mainland more than those on Vancouver Island due to differences in the cost of living. In addition, the decline in the value of the Canadian dollar relative to the US and Great Britain may give
K-12 International Enrollments* BY REGIoNAL DISTRICT 2014/15
International Enrollments on VI BY TYPE 2013
Post-Secondary International Enrollments BY REGIoNAL DISTRICT 2013
Capital
Nanaimo
Strathcona
Alberni- Clayoquot
ComoxValley
CowichanValley
K-12
Post Secondary
Source: BC Ministry of Advanced Education, October 2014 Data Submission and BC HEADset
Source: BC Ministry of Education* Includes private schools that follow BC Ministry of Education Curriculum
Source: BC Ministry of Advanced Education, October 2014 Data Submission, BC HEADset and BC Ministry of Education
The majority of
international stu-
dents attend post-
secondary institutions
and this segment
has been growing by
approximately 13%
annually while K-12
enrollments have
been increasing by
approximately 10%
annually.36 Statistics Canada. Table 282-0125 - Labour force survey estimates (LFS), employment by economic region based on 2011 Census boundar-ies and North American Industry Classification System (NAICS), annual (persons), CANSIM (database). (accessed August 28, 2015) 37 Statistics Canada, Business Register38 Illuminate Consulting, “2014 British Columbia International Education Intelligence Report,” June 2014.
V
4,084
1,375
140
28
1,946449
187
282 34
2,53431%
5,59969%

4 4 O C T O B E R 2 0 1 5 w w w . v i e a . c a
Canadian schools a cost advantage. As a result of these factors, international student enrollment on Vancouver Island is expected to continue to grow but at a somewhat lower rate.
Source: Statistics Canada, Business Register December 2014
Businesses in Educational Services 2014
407
Employment in Educational Services YEAR oVER YEAR CHANGE
2011-12 16%
2012-13 13%
39 BC Stats, “Profile of the British Columbia High Technology Sector: 2014 Edition”, June 201540 Ibid, p 27.41 Statistics Canada, Labour Force Survey Estimates, CANSIM Table 029-012342 Economic Impact of the Greater Victoria Technology Sector, September 2014 Available here
2013-14 STABLE
High TechnologyVancouver Island’s high tech sector is primarily located in the southern urban areas of the region. Approximately 87% of businesses in the sector are located in the Capital, Nanaimo, and Cowichan Valley Regional districts.39
The sector includes both service producers and manufacturers. Products include broadband hardware, solar technologies, environmental applications, IT consulting, and web development and software services.In 2013, the latest period for which data is available, the number of businesses in the sector on Vancouver Island grew by 105 (7.4%).40 During the same period employment in high technology related services grew by between 12% and 15%.41 Data from Statistics Canada’s Business Register suggests that there is a significant number of self-employed individuals working in high technology services on Vancouver Island and that this number is growing.According to a survey conducted for the Victoria Advanced Technology Council (VIATEC) as part of a 2014 economic impact study, exports account for a significant portion of the sector’s revenues.42 The primary export market is the US.
International stu-
dents are important
contributors to BC’s
economy and Interna-
tional Education has
been identified as a
priority sector in the
BC Jobs Plan. Students
living in BC generate
positive economic
impacts in the com-
munities in which they
study through their
expenditure on goods
and services and they
develop ties to Canada
which may foster fu-
ture opportunities.
International students
also represent a po-
tential pool of skilled
labour from which to
fill labour market gaps.

S T A T E O F T H E I S L A N D E C O N O M I C R E P O R T 4 5
ollowing a general decline since 2010, housing prices on Vancouver Island have been increasing in 2015. In most communities single family home prices have surpassed their 2010 levels.
In the rental market, rents have been increasing in all regions since 2011 and vacancy rates have been dropping since 2013. These trends are consistent with the observed increases in population and suggest that economic conditions are improving in most regions of Vancouver Island.
Housing prices on Vancouver Island tend to be significantly lower than those in the Lower Mainland, and with the exception of Victoria, are comparable to urban areas outside the Lower Mainland.
F
COST OF LIVING & AFFORDABILITY
S T A T E O F T H E I S L A N D E C O N O M I C R E P O R T 4 5

4 6 O C T O B E R 2 0 1 5 w w w . v i e a . c a
The Benchmark
Housing Price on
Vancouver Island
was up 4.2% in June
2015 and remains
comparable to urban
areas outside the
Lower Mainland.
Housing―Benchmark* Single Family Home Prices IN JUNE 2015 (GRoWTH CoMPARED To 1 YEAR AGo)
$350,200 +3.5%
$508,900 +4.6%
$283,300 +6.5%
$334,000 +2.9%
$369,800 +4.1%
$298,300 +6.4%
Campbell River
ComoxValley
Duncan
Qualicum Parksville
Nanaimo
VictoriaREB**
Port Alberni
Vancouver Island – $335,400 (+4.2%)
*The benchmark for single family home is a composite of one-storey homes (where the bedrooms, kitchen and dining rooms are on the same floor and the utility room and laundry room are generally located below ground) and two-storey single family homes (characterized by distribution of bedrooms on the upper floor(s) and a kitchen, living room and other day-to-day rooms on the main floor). This benchmark does not differentiate between attached and detached home. (source: MLS Home Price Index Methodology – Benchmark Descriptions)
**Victoria REB includes : Victoria, Victoria West, Oak Bay, Esquimalt, View Royal, Saanich East, Saanich West, Sooke, Langford, Metchosin, Colwood, Highlands, North Saanich, Sidney, Central Saanich, Malahat and Area, Gulf Islands.
$190,600-6.3%
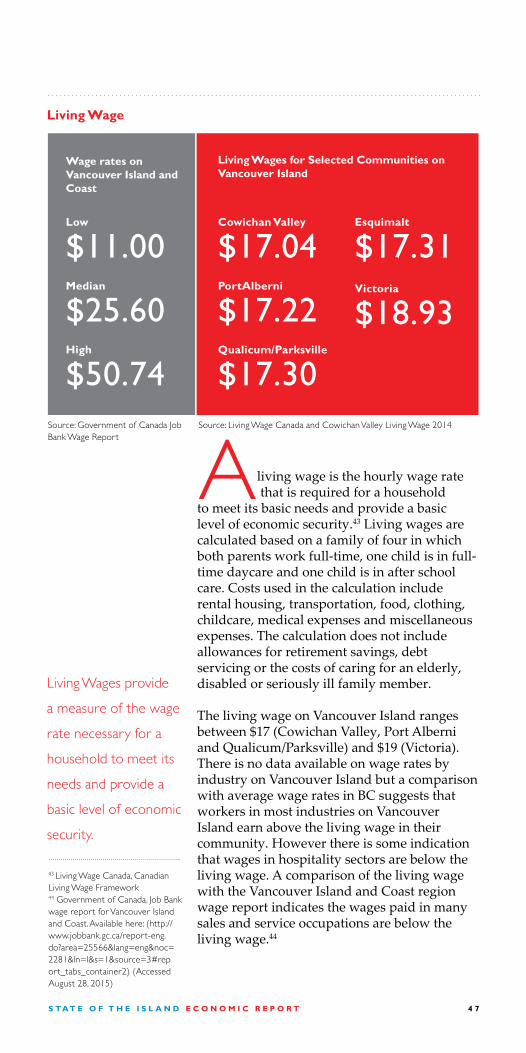
S T A T E O F T H E I S L A N D E C O N O M I C R E P O R T 4 7
living wage is the hourly wage rate that is required for a household to meet its basic needs and provide a basic level of economic security.43 Living wages are calculated based on a family of four in which both parents work full-time, one child is in full-time daycare and one child is in after school care. Costs used in the calculation include rental housing, transportation, food, clothing, childcare, medical expenses and miscellaneous expenses. The calculation does not include allowances for retirement savings, debt servicing or the costs of caring for an elderly, disabled or seriously ill family member.
The living wage on Vancouver Island ranges between $17 (Cowichan Valley, Port Alberni and Qualicum/Parksville) and $19 (Victoria). There is no data available on wage rates by industry on Vancouver Island but a comparison with average wage rates in BC suggests that workers in most industries on Vancouver Island earn above the living wage in their community. However there is some indication that wages in hospitality sectors are below the living wage. A comparison of the living wage with the Vancouver Island and Coast region wage report indicates the wages paid in many sales and service occupations are below the living wage.44
A
Living Wage
Cowichan Valley
$17.04 PortAlberni
$17.22Qualicum/Parksville
$17.30
Living Wages for Selected Communities on Vancouver Island
Wage rates on Vancouver Island and Coast
Low
$11.00 Median
$25.60High
$50.74
Esquimalt
$17.31Victoria
$18.93
Living Wages provide
a measure of the wage
rate necessary for a
household to meet its
needs and provide a
basic level of economic
security.
Source: Government of Canada Job Bank Wage Report
Source: Living Wage Canada and Cowichan Valley Living Wage 2014
43 Living Wage Canada, Canadian Living Wage Framework44 Government of Canada, Job Bank wage report for Vancouver Island and Coast. Available here: (http://www.jobbank.gc.ca/report-eng.do?area=25566&lang=eng&noc=2281&ln=l&s=1&source=3#report_tabs_container2) (Accessed August 28, 2015)

4 8 O C T O B E R 2 0 1 5 w w w . v i e a . c a
Source: Statistics Canada. Table 281-0027 - Survey of Employment, Payrolls and Hours (SEPH), average weekly earnings by type of employee, overtime status and detailed North American Industry Classification System (NAICS), annual (current dollars), CANSIM (database). (accessed August 28, 2015)* The conversion of average weekly earnings to hourly earnings assumes a 35hrs work week, which is the same used to calculate the living wage (Working for a living wage 2015 calculation guide)
Average Hourly Earnings IN BC* 2014
$28.67Manufacturing
Forestry and Logging with support activities $32.65
Mining and oil and Gas Extraction $54.34
Utilities$49.52
Health Care and Social Assistance $24.00
Wholesale and Retail Trade $19.56
Professional Scientific and Technical Services
$36.60
Educational Services$27.27
Public Administration$34.38
Finance and Insurance
Real Estate and Leasing
$33.22
$27.54
Information and Culture$35.39
Arts, Entertainment and Recreation $15.92
Transportation and Warehousing $28.79
Management of Companies and Enterprises $36.82
Accommodation and Food Services $10.69
other Services (Except Public Admin.)
$21.40
67¢
SE
RV
ICE
S-P
RO
DU
CIN
G S
EC
TO
R
Construction $32.32 32¢
34¢
52¢
56¢
69¢
60¢
82¢
39¢
27¢
GO
OD
S-PRO
DU
CIN
G SEC
TOR
38¢
22¢
54¢
79¢
72¢
92¢
40¢
65¢
Administrative and Support, Waste Management and Re-mediation Services $24.72

S T A T E O F T H E I S L A N D E C O N O M I C R E P O R T 4 9
ancouver Island is home to50 First Nations communities
representing about 25% of thecommunities registered with the province. The registered population of First Nations community members living on Vancouver Island is estimated at 32,903.45
First Nations are active participants in the economy of Vancouver Island. Of the six independent power projects that have come into operation since 2010, two were developed through partnerships with First Nations. Similarly, two of the four proposed new finfish aquaculture sites will be operated by the Tlatlasikwala First Nation in partnership with Marine Harvest Canada.
First Nations are also working in cooperation with local governments on economic development initiatives. This type of cooperation is illustrated by the creation of a joint economic development strategy by the Village of Alert Bay and the Namgis First Nation.46
V
FIRST NATIONS oN VANCOUVER ISLAND
45 Aboriginal Affairs and Northern Development Canada (AANDC) Aboriginal Profiles Statistics < http://fnp-ppn.aandc-aadnc.gc.ca/fnp/Main/Index.aspx?lang=eng>46 Village of Alert Bay Economic Development; available here (http://www.alertbay.ca/new-page/) (Accessed August 28, 2015)
S T A T E O F T H E I S L A N D E C O N O M I C R E P O R T 4 9

5 0 O C T O B E R 2 0 1 5 w w w . v i e a . c a
Treaty Negotiation Stages
Stage 1... Statement of Intent to Negotiate
Stage 2... Readiness to Negotiate
Stage 3... Negotiations of Framework of Agreement
Stage 4... Agreement-in-Principle
Stage 5... Final Agreement
Stage 6... Treaty Implemen-tation
The economic development strategy is intended to guide long-term planning around the development of Cormorant Island.
Eighty percent (40) of Vancouver Island First Nations are participating in the BC treaty negotiations process. Of the First Nations communities on Vancouver Island participating in the treaty process, the majority are at Stage 4 of the negotiations process, one is at Stage 5, and five have completed the process and are in Stage 6 Treaty Implementation.47
47 BC Treaty Commission Negotiation Update. Available here: (http://www.bctreaty.net/files/updates.php) (Accessed August 28, 2015)48 Maa-nulth First Nations Final Implementation Report 2011- 2012 < http://www.maanulth.ca/downloads/maanulth2011-2012-online.pdf> 49 HFN group of businesses Economic Update, Winter 2015.50 Steelhead LNG, “Huu-ay-aht First Nations Citizens Vote to Continue Exploring Proposed LNG Project at Sarita Bay.”, November 29, 2014; available at: http://www.steelheadlng.com/huu-ay-aht-first-nations-citizens-vote-to-continue-exploring-proposed-lng-project-at-sarita-bay/ (accessed August 30, 2105)
DID
YO
U K
NO
W?
The Maa-nulth First Nations Treaty which
came into effect April 1, 2011 provides
24,550 hectares of land and approximately
$96.7 million in capital transfers to the
member First Nations.48
As a result of the Treaty, member nation
Huu-ay-aht First Nation (HFN) has
undertaken a number of economic
development initiatives that are intended
to benefit both the community and the
surrounding region. These include the
expansion of HFN forestry from a small
silviculture contracts and salvage harvesting
operation to a profitable “full-fledged
forestry company with its own tenures
and scaling and sorting capacity”49 and the
signing of an agreement to explore the
development of a liquified natural gas
(LNG) facility at Sarita Bay.50

S T A T E O F T H E I S L A N D E C O N O M I C R E P O R T 5 1
In Closing...
We hope you have found, and will continue to find this report valuable to your decision making. A challenge in developing such a publication is determining how much information is too much and how little is too little. In this first edition, we needed to be sure to not bite off too much while providing sufficient scope for an adequately rounded picture of the Island economy. We also identified that to provide ‘apples to apples’ statistical comparisons in future years, our sources needed to only include those that consistently use the same methods to measure the same data at the same intervals. Our primary objective is to provide a user-friendly, visually engaging document that is accessible and, by extension, more broadly used than a report that provides more depth but to a narrower audience.
We invite your comments and suggestions. If you think an important sector is missing and you know of reliable information sources, please let us know. If you think that a section is insufficient or under-representative, please offer your thoughts for improvement. And if you find certain sections particularly useful, please let us know to continue in our present direction.
The Economic Alliance, perhaps more than anything, is a meeting place for ideas. Our annual Economic Summit is purpose-built to facilitate consideration of matters important to a vital and sustainable Island economy. Anyone interested in sharing ideas, learning about trends, exploring opportunities, and networking across sectors is welcomed. The Summit is not the last word on anything. Rather, it is an annual re-initiation of an Island-wide conversation.
Similarly, this Economic Report is not the ultimate assessment of our Island economy. It is simply a benchmark—a ‘stake in the ground’ if you wish—from which we may chart our various courses with better awareness of present conditions. It can also provide a point of year-to-year comparison—where we are improving and where we need impetus for positive change.
George HansonPresident & CEO, VIEA
We are grateful
to MNP for their
sponsorship and for
the financial support
of Nanaimo Airport,
Coastal Community
Credit Union, BC
Hydro, BC Ferries,
and the Ministry of
Jobs, Tourism and
Skills Training. We
are indebted to our
Report Committee –
Po Wan of Blackberry
Creative, Frank
Bourree of Chemistry
Consulting, and Giles
Newman of BDO – all
VIEA board members.

Thanks...to the generosity of our supporters and the expertise of researchers and staff at MNP, VIEA is proud to present the first edition of this report, an annual reading of the state of the Island economy and the key issues, trends and events that shape the way we live, work and do business on Vancouver Island.
The next edition of the report is planned to be released at VIEA’S 2016 State of the Island Economic Summit...
you would like to explore oppor-tunities for strong, sustainable eco-nomic growth by engaging with an expanding community of forward thinkers, policy makers and risk takers across all sectors on Vancouver Island, then
join VIEA.
viea.ca
If...
Prepared by: