
VICTORIAN MARINE HABITAT DATABASE GIPPSLAND LAKES SEAGRASS ... · Marine and Freshwater Resources...
44
Marine and Freshwater Resources Institute VICTORIAN MARINE HABITAT DATABASE GIPPSLAND LAKES SEAGRASS MAPPING Ralph Roob and David Ball November 1997
Transcript of VICTORIAN MARINE HABITAT DATABASE GIPPSLAND LAKES SEAGRASS ... · Marine and Freshwater Resources...

Marine and Freshwater Resources Institute
VICTORIAN MARINE HABITAT DATABASE
GIPPSLAND LAKES SEAGRASS MAPPING
Ralph Roob and David Ball
November 1997

Marine and Freshwater Resources Institute
VICTORIAN MARINE HABITAT DATABASE
GIPPSLAND LAKES SEAGRASS MAPPING
A Report for
FISHERIES VICTORIADEPARTMENT OF NATURAL RESOURCES AND ENVIRONMENT
Ralph Roob and David Ball
November 1997
Marine and Freshwater Resources InstitutePO Box 114
Queenscliff 3225

Copyright © The State of Victoria, Department of Natural Resources andEnvironment, 1997
This work is copyright. Apart from any use under the Copyright Act 1968, no partmay be reproduced by any process without written permission.
ISSN: 1328-5548
ISBN: 0 7311 3194 0
Copies available from:LibrarianMarine and Freshwater Resources InstitutePO Box 114Queenscliff VIC 3225
Phone: (03) 5258 0259Fax: (03) 5258 0270Email: [email protected]
Preferred way to cite this publication:Roob, R. and Ball, D. (1997) Victorian Marine Habitat Database: Gippsland LakesSeagrass Mapping. Marine and Freshwater Resources Institute. (Marine andFreshwater Resources Institute: Queenscliff), November 1997.
General disclaimer:This publication may be of assistance to you but the State of Victoria and itsemployees do not guarantee that the publication is without flaw of any kind or iswholly appropriate for your particular purposes and therefore disclaims all liabilityfor any error, loss or other consequence which may arise from you relying on anyinformation in this publication.

Victorian Habitat Database : Seagrass Assessment - Gippsland Lakes
Marine and Freshwater Resources Institute - Page i
SUMMARY
The Gippsland Lakes are situated in South Eastern Australia and are one of the largestestuarine systems in Australia. The Lakes cover an area of approximately 366 km2. TheLakes feature extensive seagrass meadows which are an ecologically significant marinehabitat, serving as a nursery area for juvenile marine fauna as well as providing food andshelter. Four species of seagrass have been identified within the Lakes, they are Zosteramuelleri, Heterozostera tasmanica, Ruppia spiralis, and Lepilaena cylindrocarpa. Thedepth at which seagrass grows is limited by the availability of light penetrating the watercolumn and reaching the lake floor.
The objectives of the project were addressed in two parts:
• PART A - An assessment of Seagrass Changes in the Gippsland Lakes through a reviewof historic aerial photographs.
The pattern of change that emerged from the assessment of historical aerial photographs isone of continual fluctuations in the level of seagrass cover. An overall peak in seagrasscover for the Gippsland Lakes occurred in the late 60’s as well as when this survey wasconducted, 1997. In the mid 80’s seagrass cover was at its lowest for the years examined.
There is evidence to suggest that fluctuations in seagrass distribution occurred between thehighs and lows. The pattern of change in seagrass is not entirely consistent across theLakes with some notable variations. The assessment of aerial photography highlightsfactors which need to be considered if seagrass sampling points are selected to berepresentative of seagrass changes throughout the Lakes. While it appears that an overallpattern of seagrass variation can be observed for the Lakes, this pattern appears to displaysome regional differences.
• PART B - An assessment of the spatial distribution of seagrass in the Gippsland Lakes.
Aerial photography was chosen as the most effective method of remotely sensing the spatialextent of seagrass meadows at the pre-determined scale of 1:10,000. It was essential thatthe photography was taken when optimum conditions existed to maximise light penetration.Cloud free days following a period of calm weather with low rainfall were the primaryconsiderations. In order to gain a further insight into the environment and to verify theaerial photograph interpretation a semi-submersible survey vessel was employed toundertake an extensive field survey the Gippsland Lakes.
All data collected in this survey was entered into a Geographic Information System where,the total area of individual species of seagrass was quantified and the precision of accuracycalculated.
The depth distribution of seagrass within the Lakes system seems to be within the 0 to 2.5metre depth range, but generally seagrass is only encountered in water less than 2 metresdeep.
The distribution of epiphytic algae within the seagrass meadows seem to be confined toareas with low energy and relatively little tidal flow. High energy marine environments havea flushing effect on vegetation keeping them clean and limiting the settlement of epiphyticalgae.

Victorian Habitat Database : Seagrass Assessment - Gippsland Lakes
Marine and Freshwater Resources Institute - Page ii
The distribution, density, length, and condition of seagrass within the Gippsland Lakesseems to be highly variable. There appears to be a number of contributing factors to thesevariations most of which change seasonally. Daylight hours, sunlight intensity, input fromadjacent catchments and the species which feed and live amongst the seagrass are just someof these factors.
At the time of the survey approximately 8.5% of the total area of the Gippsland Lakessubstrata was vegetated with seagrass. Most of the seagrass within the Gippsland Lakesexists east of Sperm Whale Head. With the vast majority occurring along the nearshoreareas of Lake King. While 78% of the seagrass was devoid of excessive epiphyte growth,28% had filamentous algae adhering to the leaf fronds. Of the main species of seagrassgrowing in the Gippsland Lakes Heterozostera tasmanica and Zostera muelleri account for66%, while Ruppia spiralis accounts for less than 1%, 31% of seagrass meadows arecomprised of a mixture of these species, while the remaining 2% was unidentified.
Further monitoring along with continuing research into the status of other environmentalvariables within the Gippsland Lakes will provide a broader understanding of changesoccurring within this significant marine ecosystem. This will assist in providing informationrelating to the variations in health and changes in the spatial distribution of seagrassmeadows so that management advice can be provided.
Important Note on Seagrass Species Definition
The two species of Zosteraceae observed in Western Port; Heterozostera tasmanicaand Zostera muelleri, cannot be differentiated by the remote sensing techniquesemployed in this study and have been grouped into a single generic category of“Zostera”. As a result, all references to “Zostera” in this report include bothHeterozostera tasmanica and Zostera muelleri.

Victorian Habitat Database : Seagrass Assessment - Gippsland Lakes
Marine and Freshwater Resources Institute - Page iii
CONTENTS
List of Figures - Introduction ............................................................................ v
List of Tables Part A.......................................................................................... v
List of Figures Part A ........................................................................................ v
List of Tables Part B ..........................................................................................vi
List of Figures Part B ........................................................................................vi
List of Maps Part B ...........................................................................................vi
1. INTRODUCTION ........................................................................................ 11.1 The Gippsland Lakes............................................................................ 1
2. SEAGRASS IN THE GIPPSLAND LAKES ............................................... 22.1 Seagrass as a Marine Habitat................................................................ 42.2 Changes in Seagrass Distribution.......................................................... 42.3 Eutrophication ..................................................................................... 42.4 Light Climate ....................................................................................... 52.5 Salinity Levels...................................................................................... 52.6 Pollution .............................................................................................. 52.7 Boating ................................................................................................ 5
3. PREVIOUS STUDIES .................................................................................. 5
PART A: AN ASSESSMENT OF SEAGRASS CHANGES IN THE GIPPSLANDLAKES THROUGH A REVIEW OF HISTORIC AERIAL PHOTOGRAPHS
1. INTRODUCTION ........................................................................................ 8
2. STUDY OBJECTIVES ................................................................................. 8
3. METHODOLOGY ....................................................................................... 8
4. SELECTION OF STUDY SITES................................................................. 8
5. HISTORICAL AERIAL PHOTOGRAPHS .............................................. 10
6. STUDY SITES ............................................................................................ 116.1 Fraser Island ...................................................................................... 126.2 Point Fullerton, Lake King ................................................................. 176.3 Point King, Raymond Island, Lake King............................................. 216.4 Gorcrow Point - Steel Bay, Lake Victoria .......................................... 256.5 Waddy Island, Lake Victoria .............................................................. 29

Victorian Habitat Database : Seagrass Assessment - Gippsland Lakes
Marine and Freshwater Resources Institute - Page iv
7. CONCLUSIONS ......................................................................................... 337.1 Assessment of Historic Photographs................................................... 337.2 Limitations of Historic Aerial Photographs for Assessing Seagrass Changes ......................................................... 34
PART B: AN ASSESSMENT OF THE SPATIAL DISTRIBUTION OF SEAGRASSIN 1997 WITHIN THE GIPPSLAND LAKES
1. INTRODUCTION ...................................................................................... 36
2. STUDY OBJECTIVES ............................................................................... 362.1 Baseline Survey.................................................................................. 36
3. METHODOLOGY ..................................................................................... 363.1 Remote Sensing of the Estuarine Environment ................................... 363.2 Aerial Survey Technique .................................................................... 373.3 Photography Specifications ................................................................ 373.4 Habitat Classifications ........................................................................ 373.5 Semi Submersible ............................................................................... 383.6 Video Transecting.............................................................................. 38
4. DATA PROCESSING ................................................................................ 394.1 Geographic Information Systems........................................................ 394.2 Air Photo Interpretation..................................................................... 394.3 Field Verification Data Processing...................................................... 39
5. RESULTS.................................................................................................... 40
6. DISCUSSION.............................................................................................. 43
ACKNOWLEDGMENTS ............................................................................... 44
REFERENCES ................................................................................................ 44
Attachment 1: Gippsland Lakes Aerial Photography ................................... 46
Attachment 2: Seagrass25 Layer Documentation ......................................... 50
Attachment 3: Maps ....................................................................................... 53Map 1A : Transects of the survey vessel “Koorong” in the Gippsland Lakes.Map 1B : Transects of the survey vessel “Koorong” in the Gippsland Lakes.Map 2 : Transects of the survey vessel “Koorong” in Lake Tyers.Map 3 : Series of 10 maps of seagrass distribution - Gippsland Lakes.

Victorian Habitat Database : Seagrass Assessment - Gippsland Lakes
Marine and Freshwater Resources Institute - Page v
LIST OF FIGURES - INTRODUCTION
Figure 1.1: Locality MapFigure 2.1: Seagrasses of the Gippsland Lakes
LIST OF TABLES - PART A
Table 6.1: Aerial photographs presented for the study sites.Table 7.1: Summary of changes, peaks and lows in seagrass at the study sites.
LIST OF FIGURES - PART A
Figure 4.1 Location of study sites.Figure 6.1a Fraser Island October, 1959 (approx. scale 1:15,000).Figure 6.1b Fraser Island 12 December, 1968 (approx. scale 1:15,000).Figure 6.1c Fraser Island 26 December, 1969 (approx. scale 1:15,000).Figure 6.1d Fraser Island 24 November, 1975 (approx. scale 1:15,000).Figure 6.1e Fraser Island 26 August, 1976 (approx. scale 1:15,000).Figure 6.1f Fraser Island 2 April, 1984 (approx. scale 1:15,000).Figure 6.1g Fraser Island 25 November, 1986 (approx. scale 1:15,000).Figure 6.1h Fraser Island 21 June, 1997 (approx. scale 1:15,000).Figure 6.2a Point Fullerton 24 June, 1966 (approx. scale 1:10,000).Figure 6.2b Point Fullerton 25 August, 1969 (approx. scale 1:10,000).Figure 6.2c Point Fullerton 26 August, 1976 (approx. scale 1:10,000).Figure 6.2d Point Fullerton 2 April, 1984 (approx. scale 1:10,000).Figure 6.2e Point Fullerton 21 June, 1997 (approx. scale 1:10,000).Figure 6.3a Point King 25 August, 1969 (approx. scale 1:15,000).Figure 6.3b Point King 26 August, 1976 (approx. scale 1:15,000).Figure 6.3c Point King 20 February, 1979 (approx. scale 1:15,000).Figure 6.3d Point King 2 April, 1984 (approx. scale 1:15,000).Figure 6.3e Point King 25 April, 1989 (approx. scale 1:15,000).Figure 6.3f Point King 21 June, 1997 (approx. scale 1:15,000).Figure 6.4a Gorcrow Point - Steel Bay 25 August, 1969 (approx. scale 1:10,000).Figure 6.4b Gorcrow Point - Steel Bay 14 March, 1976 (approx. scale 1:10,000).Figure 6.4c Gorcrow Point - Steel Bay 18 January, 1979 (approx. scale 1:10,000).Figure 6.4d Gorcrow Point - Steel Bay 30 March, 1984 (approx. scale 1:10,000).Figure 6.4e Gorcrow Point - Steel Bay 21 June, 1997 (approx. scale 1:10,000).Figure 6.5a Waddy Island 25 August, 1969 (approx. scale 1:15,000).Figure 6.5b Waddy Island 14 March, 1976 (approx. scale 1:15,000).Figure 6.5c Waddy Island 18 January, 1979 (approx. scale 1:15,000).Figure 6.5d Waddy Island 30 March, 1984 (approx. scale 1:15,000).Figure 6.5e Waddy Island 30 December, 1986 (approx. scale 1:15,000).Figure 6.5f Waddy Island 21 June, 1997 (approx. scale 1:15,000).

Victorian Habitat Database : Seagrass Assessment - Gippsland Lakes
Marine and Freshwater Resources Institute - Page vi
LIST OF TABLES - PART B
Table 3.1: Habitat categories recorded during the survey.
Table 5.1: Summary Area Statement of Seagrass Communities in the Gippsland Lakesand Lake Tyers.
LIST OF FIGURES - PART B
Figure 3.1: Semi submersible survey vessel with pod lowered.

Victorian Habitat Database : Seagrass Assessment - Gippsland Lakes
Marine and Freshwater Resources Institute - Page 1
1. INTRODUCTION
This project was undertaken by the Marine and Freshwater Resources Institute (MAFRI)for Fisheries Victoria, Department of Natural Resources and Environment (NRE). Theproject has two parts:
Part A: An Assessment of Seagrass Changes in the Gippsland Lakes Through aReview of Historic Aerial Photographs
Part B: An Assessment of the Spatial Distribution of Seagrass in the Gippsland Lakes
1.1 The Gippsland Lakes
The Gippsland Lakes are one of the largest inland waterways in Australia. They aresituated in south eastern Australia, in the state of Victoria and cover approximately 366 km2
(Figure 1.1). They are an estuarine system that were separated from the sea by thedeposition of successive sandy barriers in stages during the Pleistocene and Holocene,interspersed with enclosed lagoons and swamps.
##
#
#
#Bairnsdale
Paynesville
MetungLakes
Entrance
Loch SportLakeWellington
LakeKing
L akeTyers
N
EW
S
Victoria
5 0 5 10 Kilom etres
Figure 1.1: Locality Map
The Lakes are quite shallow, maximum depths being 6 m in Lake Wellington, 9 m LakeVictoria, 10 m in Lake King and 7 m in Reeve Channel (Bird, 1978). Five major riverssystems drain into the lakes from a combined catchment area of approximately 20,000 km2
(Bird, 1993). The outer barrier is bordered by the Ninety Mile Beach, which consists ofsandy sediment having been derived from the continental shelf (Thom, 1984).

Victorian Habitat Database : Seagrass Assessment - Gippsland Lakes
Marine and Freshwater Resources Institute - Page 2
During the past 6000 years the Gippsland Lakes have been re-shaped by the growth ofdeltas around the mouths of inflowing rivers, by erosion of lake shore embayments,accretion on intervening spits and by the encroachment of reed swamp vegetation.Originally a natural entrance existed, this varied in position, width and depth and was attimes completely sealed off by sand deposition. An artificial entrance was completed in1889 and as a consequence considerable changes to the ecology of the Lakes haveoccurred. Changes in salinity, oxygen and temperature levels have resulted in a change offaunal species composition and in the presence and distribution of aquatic flora, includingseagrass and reeds (Bird, 1993).
2. SEAGRASS IN THE GIPPSLAND LAKES
Seagrasses are not true grasses, nor are they algae. Seagrasses are flowering plants, theirinternal structures, pollination mechanisms and fruit dispersal tactics all show particularadaptations to a completely aquatic existence. Seagrasses have extensive horizontalunderground stems (rhizomes) and strong roots that anchor the plant to the soft bottom.The roots absorb nutrients, but do not take up water. To cope with living in oxygen-poormud, seagrasses have evolved air canals that carry oxygen from the leaves to the buriedrhizomes and roots. Erect branches and leaves grow off the buried stem. The leaves have athin skin that allows efficient nutrient and gas uptake from the water (Lloyd, 1997).
Seagrasses are photosynthetic plants that require sunlight to provide energy for theirgrowth. Absorbing light is a major function of the leaf blade. The leaf has a thin layer ofgreen pigment cells specially adapted to capture light. Typically, seagrass meadows arefound in water depths of 2-12 metres, where sunlight intensity is greatest and thereforeseagrass growth is highest. The photosynthetic activity of seagrass beds is so great it cancause significant changes in oxygen, carbon dioxide and acidity levels of the surroundingwater (Lloyd, 1997).
Seagrasses are the colonisers of unstable mud, silt and sand substrates in estuaries, wherethey can withstand the movement of the water and waves as they are anchored firmly byrhizomes and true roots (Ducker et al., 1977).
There are 55 species of Seagrasses in the world, 25 occurring in Australia and four specieshave been identified within the Gippsland Lakes: Zostera muelleri, Heterozosteratasmanica, Ruppia spiralis, (see Figure 2.1) and Lepilaena cylindrocarpa. From time totime a filamentous algae adheres and grows on seagrass, especially in areas where waveaction or exposure to prevailing south westerly winds is negligible. Epifauna growing onthe two species of Zostera are invertebrate tube worms.
The distribution of seagrass within the Gippsland Lakes has varied significantly throughoutthis century. Natural events have caused either an increase or decrease in the abundanceand distribution of the species of seagrass meadows.

Victorian Habitat Database : Seagrass Assessment - Gippsland Lakes
Marine and Freshwater Resources Institute - Page 3
Figure 2.1Seagrasses of the Gippsland Lakes
Heterozostera tasmanica
Heterozostera tasmanica is widely distributedthroughout the Gippsland Lakes and grows insheltered and moderately exposed sand and silt toa depth of 2.5 metres. Leaf lengths of up to 1.5metres were recorded. Heterozostera tasmanicahas an almost identical leaf shape to Zosteramuelleri, which is also found in the GippslandLakes. It can sometimes be separated from otherspecies on the basis of its branching pattern, withthe leaves having dark wiry bases that arisevertically from the rhizomes, whereas the leavesof Zostera species are often curved parallel withsediment near their bases (Edgar, 1997).
Zostera muelleri
Zostera muelleri is widely distributed throughoutthe Gippsland Lakes and grows in sheltered andmoderately exposed sand and silt to a depth of2.5 metres. Leaf lengths of up to 600 mm wererecorded. Zostera muelleri has at least two rootsat each node: the leaf apex is usually notched inthe center, and the leaf blade has threelongitudinal veins. The only reliable way toseparate these two species of Zostera is to observea cross-section of the rhizome with a hand-lensor microscope. Heterozostera tasmanica has fourto twelve vein like vascular bundles arranged in acircle, whereas Zostera species have only two(Edgar, 1997).
Ruppia spiralis
Ruppia spiralis is widely distributed throughoutthe Gippland Lakes but is usually found inamongst the Zostera meadows, it grows to adepth of 2.5 metres. Ruppia spiralis is a robustperennial species that tolerates a wide range ofsalinities and can occur in both freshwater-dominated estuaries and coastal lagoons wheresalinities greatly exceed marine conditions. Thespecies has erect stems that are very long, narrow(0.5-2 mm in diameter) and branched. The leafblades arise from short sheaths at the end of thebranches and are 50-200 mm long with anindented tip (Edgar, 1997).
Heterozostera tasmanica (source G. Edgar)
Zostera muelleri (source G. Edgar)
Ruppia spiralis (source G. Edgar)

Victorian Habitat Database : Seagrass Assessment - Gippsland Lakes
Marine and Freshwater Resources Institute - Page 4
2.1 Seagrass as a Marine Habitat
Seagrass is an ecologically significant marine habitat, it serves as a nursery area for juvenilemarine fauna as well as providing food and shelter. Seagrasses are highly productive andprovide substratum for algae and small animals, which also provide significant food sourcesfor other organisms. The seagrass canopy reduces wave current velocities, therebyreducing erosion and enhancing sedimentation on the sea bed (Hastings, 1995).
The density of animals in the Gippsland Lakes diverges widely from that reported for otherAustralian estuaries. On three sites surveyed by Poore in 1982, the density average was20,000 - 25,000 individuals per square metre. The species recorded exhibited a wide rangeof feeding habits (filter feeders, grazers, detritivores) for which the seagrasses and itsepiphytes provide habitats in the leaves and sediments (Poore, 1982). Seagrass alsoprovides food for swans and some vegetarian fish species while actively producing smallamounts of nutrients required by other coastal plants and animals. Decaying seagrass leavesprovide food for bacteria, worms and crabs. (Lloyd, 1997).
Small animals and plants shelter in the seagrass leaves, receiving protection from predators,and from excessive sunlight, or temporal changes in salinity and temperature. Fast watermovement is also reduced considerably within seagrass meadows, creating a well-protectedhome for its inhabitants.
Seagrass meadows provide breeding areas for many fish as well as food and protection.Juvenile fish dependent on seagrass within the Gippsland Lakes include mullet, tailor, breamand flathead.
2.2 Changes in Seagrass Distribution
The distribution of seagrass meadows in the Gippsland Lakes is extremely dynamic. Thereare many environmental parameters, some human induced others natural, that may influencethe health and consequently the coverage of seagrass. Eutrophication, suspendedsediments, chemical outfall, oil spills, sewerage effluent, salinity levels and epiphytes aremajor causes for the continuing change in the distribution of seagrass meadows. Swans andsome fish species, such as carp can also influence the distribution and density of seagrass.
2.3 Eutrophication
Eutrophication is the product of high nutrient loads entering the marine environment,usually from waste water discharged from sewerage treatment works and run off fromphosphate-fertilised agricultural land. High concentrations of nutrients cause blooms ofalgae. Seagrass plants are shaded by these algal blooms, which may be opportunisticphytoplankton or macroalgae attached to the seagrass plants (epiphytes).
The seagrass can also be shaded by high sediment loads in the water column, usually causedby run off from newly cleared land or from dredge-spoil. This shading reduces the growthrate of seagrass. Eventually the shading becomes so heavy that the plant cannotphotosynthesise as rapidly as respire. At this stage, the plant’s metabolism is belowcompensation and it uses its reserves of storage products. Once these have gone, the plantwill die (Kirkman, 1995).

Victorian Habitat Database : Seagrass Assessment - Gippsland Lakes
Marine and Freshwater Resources Institute - Page 5
2.4 Light Climate
The absorption of photosynthetically active radiation in natural waters influences aquaticplant growth. The attenuation coefficient of vertical light diffusion can be calculated for anydepth (assuming exponential attenuation) and the effect of each light-attenuatingcomponents, Chlorophyll a, concentration of suspended solids, and concentration of Gilvin(dissolved organic material), can be assessed. The absorption of light in the water column isa standard coefficient calculated for pure water (Morel and Prieur, 1977).
A study by Hickman et al. (1984) in the Gippsland Lakes determined that variation in lightclimate within the Gippsland Lakes occurred spatially and temporarily. Data collectedindicates that waters relatively far from the sea attenuate light more strongly than watersclose to the sea. Significant variation of light attenuation also occurred seasonally(Hickman et al., 1984). Increased turbidity and sedimentation, phytoplankton blooms andenhanced nutrient input from the land reduces the depth of seagrass growth (Abal &Dennison, 1996).
2.5 Salinity Levels
Salinity levels are not independent of position or depth. Results of a study conducted byAllardice et al. (1974), concluded that salinity levels are higher close to the entrance of BassStrait and are lower further west. Salinity levels are higher at depth due to any freshwaterrun off lying on top of the denser saline water. In the Lakes, seagrass biomass is greatestwhere salinity rarely falls below 25%, which is generally east of Loch Sport, (Poore, 1982).
2.6 Pollution
Seagrass roots can concentrate heavy metals then pass them up the food chain, leading tomany animals being poisoned (Lloyd 1997). Oil spills can damage seagrass by directlypoisoning or smothering the plants. Oil droplets can attach themselves to sediments whichmakes them buoyant and induces erosion of the substrata that the seagrass is growing on(Lloyd, 1997).
2.7 Boating
Damage to seagrass meadows by boats is also common, anchors and anchor chains fromboats pull up seagrass, and boat propellers tear out plants (Lloyd, 1997).
3. PREVIOUS STUDIES
The existing literature and research on aquatic vegetation in the Gippsland Lakes is limitedwith the main studies having been undertaken by Ducker et al. (1977) and Rigby (1984).Other relevant studies have been undertaken by Axelrad and Bulthuis (1977), Arnott(1983), Ramm (1986) and Poore (1982), while Strong and Malcolm (1996) present anoverview of the aquatic environment in the Lakes. The literature search failed to find anyprevious studies or reports that had attempted to map or quantify historic seagrass changesin the Gippsland Lakes.
The study undertaken by Ducker et al. (1977) was the first to systematically sample theLakes and record its benthic and planktonic flora. Ducker et al. (1977) sampled aquaticvegetation at 138 sites across the Gippsland Lakes between mid-September and mid-December in 1976 as part of a Ministry for Conservation environment studies program forthe region. Spermatophyta (seagrasses) and larger benthic algae were found to be the most

Victorian Habitat Database : Seagrass Assessment - Gippsland Lakes
Marine and Freshwater Resources Institute - Page 6
conspicuous aquatic plants in the Gippsland Lakes. It is this range of plants which can beobserved to varying degrees in aerial photography.
Ducker et al. (1977) found three genera and four species of seagrass in the Gippsland Lakes(including Lake Tyers) consisting of Ruppia spiralis, Lepilaena cylindrocarpa, Zosteramucronata and Zostera muelleri. The Zostera species were the most widespread beingfound in 38% of the sampling points, while Ruppia and Lepilaena which thrive in lowersalinity water than Zostera were found in 22% and 9% of the sites respectively. At allsampling points where seagrass was found it formed extensive underwater meadows. Noseagrass species were recorded in Lake Wellington.
While the distribution of the seagrass species was not mapped by Ducker et al. (1977) therelative distribution of each of the species is noted. Zostera muelleri was found across mostof the Lakes system and mostly in Jones Bay, Lake King, Bunga Arm and Lake Tyers whileZostera mucronata was mainly found in the western end of Lake Victoria. Ruppia wasfound across the Lakes, but mostly in Lake Reeve, western Lake King, Bunga Arm andLake Tyers. Lepilaena was only found in western Lake Reeve and Lake Tyers.
As well as the seagrasses, two phyla of algal macrobenthos, Chlorophyta (green algae) andRhodophyta (red algae) were also identified in the Lakes by Ducker et al. (1977).Chlorophyta was the major algal macrobenthos both in terms of abundance and diversity inthe Lakes. The genus Cladophora was particularly plentiful in the Lakes being found atover 30% of the sampling points and across many different conditions. The species ofCladophora are green algae with the young plants attached to the substrate, while older ormature plants are frequently free-floating or entangled on the surrounding vegetation.
The most widespread red algae species found in the Lakes was Gracilaria verrucosa, whichoccurred in 48% of the sampling points. It was particularly common in Lake Victoria andLake King where it formed a large percentage of the biomass. Gracilaria is epilithic oranchored in the sand; when it is dislodged it becomes intertwined amongst other algae andseagrasses (Ducker et al., 1977). Other algae including the genus Polysiphonia andEctocarpales were also present in the Lakes but these other genera only represent a smallproportion of total biomass or cover.
Rigby (1984) utilised 1:20,000 colour aerial photography from 1976 in conjunction withgroundtruthing to produce the first detailed map of the distribution and density ofmacrophytes in the Gippsland Lakes. Rigby (1984) found that seagrass occurred in mostparts of the Gippsland Lakes east of McLennans Strait in water depths less than 3 metres.The macrophyte biomass consisted almost entirely of the seagrasses Zostera muelleri andRuppia spiralis.
The Gippsland Lakes support the second most important commercial estuarine fishery inVictoria, after Port Phillip Bay and the role of the seagrass meadows as fishery habitat isoutlined by Strong and Malcolm (1996).
A major contributing factor to the food web in the Gippsland Lakes is composting seagrass,which consists of shed fronds that are broken down by micro organisms. The accumulationof this organic material and the large surface area provided by the seagrass fronds supportsthe growth of epiphytic diatoms, algae and sessile invertebrates, which in turn support thegrowth of large numbers of polychaetes, crustaceans and molluscs (Strong and Malcolm,1996). The abundance of these prey species in the seagrass meadows of the GippslandLakes are amongst the highest in the world - 20,000 to 25,000 individuals per m2 (Poore,

Victorian Habitat Database : Seagrass Assessment - Gippsland Lakes
Marine and Freshwater Resources Institute - Page 7
1982). These species make up a large part of the diet of many fish in the Gippsland Lakesand are particularly important in the diet of larval fish (Strong and Malcolm, 1996).
At least 29 species of estuarine resident fish use the Gippsland Lakes as spawning andnursery grounds, including five species of economic significance (black bream, yellow-eyemullet, dusky flathead, southern sea garfish and luderick). Two marine resident species ofcommercial significance; sandy sprat and southern anchovy, also use the estuary as anursery ground. Most species utilise the seagrass as both a source of prey species for theiryoung and also for shelter. Seagrass meadows provide a suitable substrate for thedeposition of eggs and a habitat for larvae immediately after hatching. They provide arelatively stable environment for larval fish as the fronds lessen water turbulence and reducethe strength of currents as well as provide cover from excessive solar radiation (Strong andMalcolm, 1996).
The dependence of black bream on seagrass in the Gippsland Lakes was dramaticallyillustrated between the 1920s and 1950s when seagrass almost completely disappeared fromthe entire Lakes system (Strong and Malcolm, 1996). The loss of seagrass was matchedwith a decline in the commercial catch of black bream from a high of 352 tonnes in 1919 toan all time low of 12 tonnes in 1958 (Strong and Malcolm, 1996). The loss of seagrasswould have undoubtedly have had an impact on the number of bream surviving toadulthood as young bream depend on the grass for shelter and the abundant food itharbours (Malcolm, 1995).
The cause of the seagrass decline between the 1920's and 1950's is not clear. Onesuggestion is that excessive numbers of crabs, during this period, contributed to the declineof seagrass due to their habit of snipping off fronds while feeding on the small epiphyticanimals (Malcolm, 1995). This theory has not been proven and it is unclear whetherexcessive numbers of crabs were a symptom of the underlying causes of the seagrass loss.

Victorian Habitat Database : Seagrass Assessment - Gippsland Lakes
Marine and Freshwater Resources Institute - Page 8
PART A: AN ASSESSMENT OF SEAGRASS CHANGES IN THE GIPPSLANDLAKES THROUGH A REVIEW OF HISTORIC AERIAL PHOTOGRAPHS
1. INTRODUCTION
This report presents the results of an assessment of seagrass changes in the Gippsland Lakesfrom a review of historic aerial photographs.
2. STUDY OBJECTIVES
The aims of this stage of the study are to:
• attempt to detect historical changes in seagrass meadows in the Gippsland Lakesthrough an examination of historic aerial photography, and,
• to provide information to assist in identifying potential representative sampling sitesfor ongoing monitoring of the status of seagrass in the Gippsland Lakes.
The study also provides an indication of the state of the seagrass mapped in detail during1997 relative to other years.
3. METHODOLOGY
The study involved completing the following tasks:
• Review of existing literature and research on seagrass in the Gippsland Lakes.• Identification of potential monitoring sites.• Identification and acquisition of historic aerial photographs.• Qualitative assessment and comparison of historic aerial photographs for each site.• Assessment and review of study techniques.
4. SELECTION OF STUDY SITES
The selection of potential sites for this study was undertaken through an assessment ofexisting reports (particularly the macrophyte mapping undertaken by Rigby (1984)), anexamination of 1:10,000 colour aerial photography from 1984, consultation with regionalstaff of NRE and through qualitative field observations. On the basis of this assessment 12sites were selected representing all the likely seagrass environments found within the Lakes.The selected sites are listed below and their location is shown in Figure 4.1:
• Toorloo Arm, Lake Tyers• Fraser Island• Baxter Island• Swan Reach Bay, Lake King• North West Jones Bay• Point Fullerton, Lake King• Point King, Raymond Island, Lake King• Banksia Peninsula, Lake Victoria

Victorian Habitat Database : Seagrass Assessment - Gippsland Lakes
Marine and Freshwater Resources Institute - Page 9
• Gorcrow Point - Steel Bay, Lake Victoria• Thalia Point, Lake Victoria• Loch Sport, Lake Victoria• Waddy Island, Lake Victoria
The above sites extend across the Lake system from Reeve Channel to the western end ofLake Victoria. The Toorloo Arm site in Lake Tyers was selected to provide a usefulcomparison with the Lakes as Lake Tyers has a relatively undisturbed forested catchment.
#
Ñ#
##
Ñ Ñ
#
Ñ
#
#
Ñ
Jones BayPointKing
Loch S port
Toorloo Arm
ThaliaPoint
Wa ddyIsland
Fra serIsland
Baxter Island
Gorcrow Po int
Sw an ReachB ay
Point Fu llerton
Banksia Penins ula
Historic a erial pho togr aph y s ite s# Site s n ot se lecte d for s tud yÑ Site s s elec ted fo r s tud y
N
EW
S
5 0 5 10 Kilometres
Figure 4.1: Historic Aerial Photography Study Sites

Victorian Habitat Database : Seagrass Assessment - Gippsland Lakes
Marine and Freshwater Resources Institute - Page 10
5. HISTORICAL AERIAL PHOTOGRAPHS
In order to identify the available historic aerial photographs for the Gippsland Lakes asearch was undertaken utilising the aerial photograph database maintained by the CentralPlan Office (CPO) of the Office of the Surveyor General. Aerial photograph run map indexsheets for the region were also checked to ensure that all the available photographs hadbeen identified.
The search of the CPO database found that the earliest aerial photographs for the GippslandLakes were flown in the Lakes Entrance area in 1959. The earliest series of photographswhich gave an almost complete coverage of the Lakes were flown in 1969 and since thistime photographs covering most of the Lakes have been flown in 1976, 1979, 1984 and1988-89. Other photograph runs covering only sections of the Lakes have also been flownin different years since 1959. Colour aerial photography flown on 21/6/97 at a scale of1:20,000 specifically for Stage 2 of the Gippsland Lakes Seagrass study was also available.Photography at scales of greater than 1:25,000 flown in 1977 and 1986 (1:50,000) and1990 (1:40,000) for various regions of the lakes are also available but the resolution ofthese photographs were considered to be too low for interpreting seagrass.
Having identified the relevant historic aerial photography for the Lakes, specificphotographs for each of the study sites listed above were identified and assessed in terms oftheir quality and clarity for interpreting seagrass. A summary of the available aerialphotography for each of the selected study sites is given in Table 6.1. Full details of each ofthese photographs and an assessment of the quality of the photographs for interpretingseagrass distribution is given in Attachment 1.
Following an assessment of the aerial photographs available for the initial 12 study sitesonly 5 of these sites were found to have photographs of suitable quality, at appropriate timeintervals and over a sufficient time period to assess changes in seagrass. These sites are(Figure 4.1):
• Fraser Island• Point Fullerton, Lake King• Point King, Raymond Island, Lake King• Gorcrow Point - Steel Bay, Lake Victoria• Waddy Island, Lake Victoria
While the Swan Reach Bay site had suitable photographs it was ruled out as there was littleactual seagrass at the site and field assessments revealed that it typically features areas ofdrift seagrass that accumulates in sand ridges on the bed of the Lake. This drift seagrasscan be deceptive as it appears to be dense beds of healthy seagrass on the aerialphotographs.

Victorian Habitat Database : Seagrass Assessment - Gippsland Lakes
Marine and Freshwater Resources Institute - Page 11
6. STUDY SITES
Historic aerial photographs for the five sites outlined in the previous section were acquiredfrom QASCO-VicImage and are listed in Table 6.1. The photographs are presented for eachsite in the following sections and have been changed to a common scale of eitherapproximately 1:10,000 or 1:15,000. A qualitative comparison of the historic photographsis also presented in the following section.
Table 6.1: Aerial photographs presented for the study sites (photographs are indicated byshaded cells).
AerialPhotograph
Fraser Island PointFullerton
Point King GorcrowPoint
WaddyIsland
1959 B/W1:12,0001966 B/W1:12,0001968 Colour1:79201969 Colour1:15,8401975 B/W1:13,0001976 Colour1:25,0001979 B/W1:10,0001984 Colour1:10,0001986 B/W1:12,8001989 Colour1:25,0001997 Colour1:20,000
It can be seen from Table 6.1 that aerial photographs are available for each of the final fivestudy sites for the years 1969, 1976, 1984 as well as those recently flown in 1997.Photographs for most of the sites are also available for 1979. Photographs from the otheryears have been included to highlight seagrass changes evident at specific sites and toprovide a more complete record.
All aerial photographs reproduced in this report prior to 1997 are Crown (State of Victoria)Copyright. Reproduced with permission of Land Victoria, Department of NaturalResources and Environment. Aerial photographs from 1997 are copyright of QASCO PtyLtd and have been reproduced with their permission.

Victorian Habitat Database : Seagrass Assessment - Gippsland Lakes
Marine and Freshwater Resources Institute - Page 12
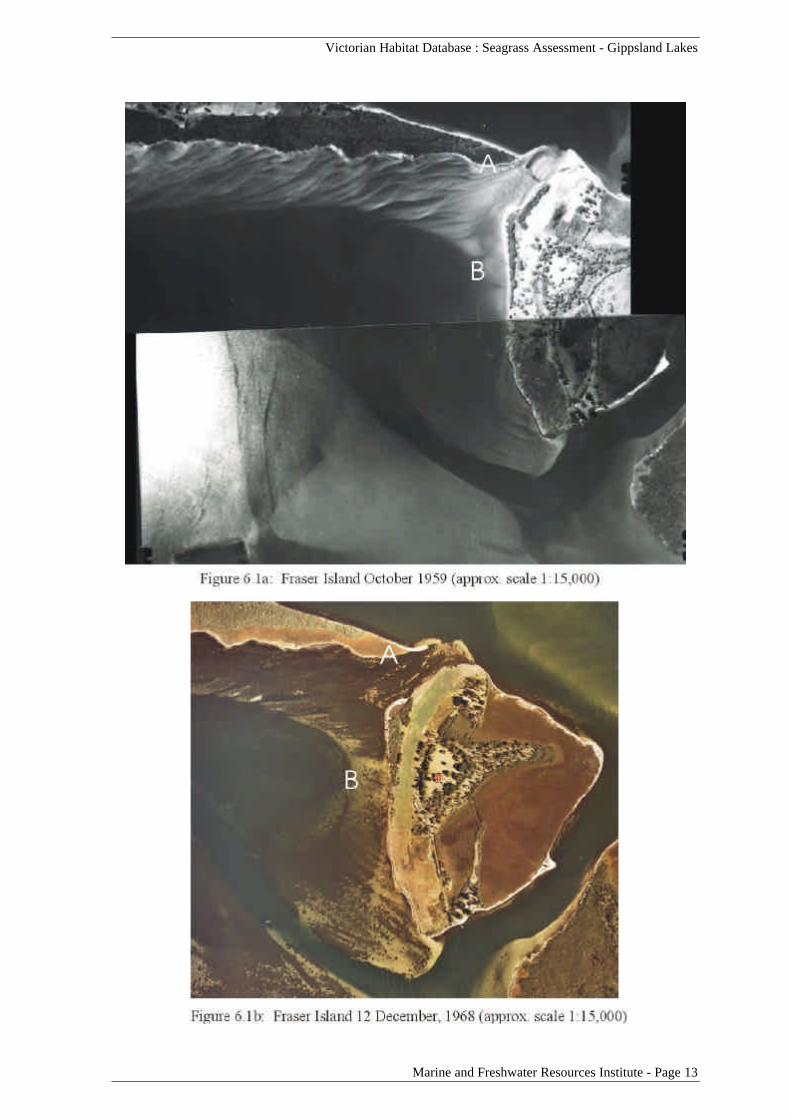
6.1 Fraser Island
Fraser Island is located south of Reeve Channel between Flannagan Island and Rigby Island.The area around Fraser Island features a channel separating it from Rigby Island whileshallow sand banks extend from its western shore and continue along the southern shore ofFlannagan Island. Of all the sites selected for this study, the historic aerial photographsavailable for Fraser Island span the greatest period of time. The available photographswhich are suitable for interpreting seagrass were flown in 1959, 1968, 1969, 1975, 1976,1984, 1986 as well as those flown in 1997 (Figures 6.1a-6.1h respectively).
The initial photograph for Fraser Island was flown in 1959 (Figure 6.1a) and is significant asno seagrass can be observed in any of the subtidal or intertidal areas around the Island. Thisis consistent with the reports of an almost total loss of seagrass in the Lakes between the1920s and 1950s (Strong and Malcolm, 1996). By 1968 (Figure 6.1b) an almost completerecovery of the seagrass beds around Fraser Island can be observed. A dense coverage ofseagrass can be observed at Point A (Figure 6.1b), while patchy seagrass is evident at PointB on the western shore of Fraser Island.
Figure 6.1c shows a photograph flown in 1969 almost exactly one year after Figure 6.1b. Anoticeable increase in the density of seagrass over the year can be observed at Point B onthe western side of Fraser Island while an increase to a lesser extent can also be seen atPoint A in the area between Fraser Island and Flannagan Island. In 1975 (Figure 6.1d) theseagrass around both Points A and B has declined considerably since 1969 (Figure 6.1a).
By contrast, the changes that can be observed in the year between 1968-69 (Figures 6.1b &6.1c respectively), the changes between 1975 (Figure 6.1d) and 1976 (Figure 6.1e) are lessobvious and both photographs appear to have a similar level of seagrass coverage. Thephotograph flown in 1984 (Figure 6.1f) shows that all the areas around Fraser Island, withthe exception of the southern tip, have a dense coverage of seagrass and is similar to thecoverage observed in 1969 (Figure 6.1c). The areas at Point A & B have a particularlydense coverage by comparison to 1975 and 1976 (Figures 6.1d & 6.1f respectively).
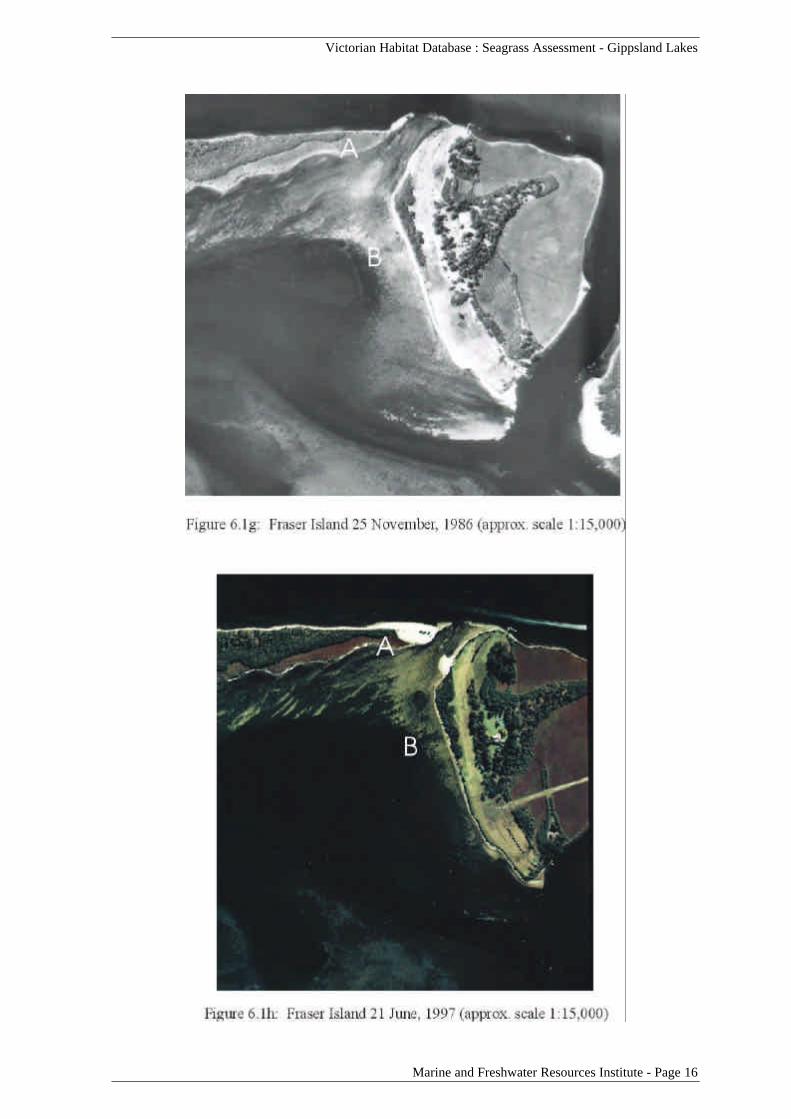
The 1986 photograph (Figure 6.1g) is not as clear as the other photographs, but a decline inthe amount of seagrass cover at Points A & B since 1984 (Figure 6.1f) can be observed.The seagrass coverage in 1986 is similar to that observed in 1975 (Figure 6.1d) and 1976(Figure 6.1e). The photograph for 1997 (Figure 6.1h) has a similar seagrass cover to 1986(Figure 6.1g) at Point A, but appears to have increased in density at Point B. Bycomparison to previous years, less seagrass can be observed in 1997 than in the years 1969and 1984, but it is similar to the other years.
If an overall comparison of the aerial photography for Fraser Island is undertaken the leastamount of seagrass cover, not including 1959 when the site was devoid of all seagrass, canbe observed in 1976 (Figure 6.1e) and 1986 (Figure 6.1g). The greatest level of seagrasscover can be observed in 1969 (Figure 6.1c), although good covers can also be seen in theyears 1984 and 1997 (Figures 6.1f and 6.1h respectively).
Victorian Habitat Database : Seagrass Assessment - Gippsland Lakes
Marine and Freshwater Resources Institute - Page 13

Victorian Habitat Database : Seagrass Assessment - Gippsland Lakes
Marine and Freshwater Resources Institute - Page 14

Victorian Habitat Database : Seagrass Assessment - Gippsland Lakes
Marine and Freshwater Resources Institute - Page 15
Victorian Habitat Database : Seagrass Assessment - Gippsland Lakes
Marine and Freshwater Resources Institute - Page 16

Victorian Habitat Database : Seagrass Assessment - Gippsland Lakes
Marine and Freshwater Resources Institute - Page 17
6.2 Point Fullerton, Lake King
Point Fullerton is located at the eastern end of Eagle Point Bay on the south west shore ofLake King. This site features a narrow headland extending northward from the shore with adense seagrass bed extending from the tip of the headland and narrow bands of seagrasslocated on the eastern and western shores of the headland. The available photographswhich are suitable for interpreting seagrass at Point Fullerton were flown in 1966, 1969,1976, 1984, as well as those flown in 1997 (Figures 6.2a-e).
In the initial photograph for Point Fullerton flown in 1966 (Figure 6.2a) the seagrasscoverage is patchy to the north of the Point (Point A) and a patchy coverage extends alongthe western shore towards Point B. Bare areas of sand can be observed near the shore onthe eastern side of the Point with denser areas further offshore (Point C). An increase inseagrass coverage can be observed at all points in the 1969 photograph (Figure 6.2b) and isparticularly noticeable on the western and eastern shores (Points B & C respectively).
The seagrass to the north of Point Fullerton (Point A) in 1976 (Figure 6.2c) appears to besimilar to that observed in 1969. However a noticeable decline in the seagrass since 1969can be observed in the nearshore area along the western shore (Point B) and a decline to alesser extent can also be seen in the nearshore area along the eastern shore (Point C). Thesmall area of bare sand on the eastern shore of Point Fullerton (Point C) has increasedsignificantly in size in the 1984 photograph (Figure 6.2d) by comparison to 1976 (Figure6.2c). The bare sand areas on the western shore (Point B) in 1984 appear to be very similarto those in 1976 with a possible small decrease in seagrass along the outer edge of the sandbank. The seagrass to the north of Point Fullerton (Point A) is difficult to interpret due tothe presence of wind ripples, but appears similar to the coverage in the previous photographin 1976.
In the 1997 photograph (Figure 6.2e) the seagrass to the north of Point Fullerton (Point A)is difficult to interpret but appears to have a similar distribution and density to previousyears. An increase in the seagrass cover since 1984 (Figure 6.2d) in the nearshore areas onthe western and eastern shores (Point A & B respectively) can be observed in 1997.
When an overall comparison of the available aerial photography for Point Fullerton isundertaken the greatest level of seagrass cover can be observed in 1969 (Figure 6.2a) andthe least cover can be observed in 1984 (Figure 6.2d).

Victorian Habitat Database : Seagrass Assessment - Gippsland Lakes
Marine and Freshwater Resources Institute - Page 18

Victorian Habitat Database : Seagrass Assessment - Gippsland Lakes
Marine and Freshwater Resources Institute - Page 19

Victorian Habitat Database : Seagrass Assessment - Gippsland Lakes
Marine and Freshwater Resources Institute - Page 20

Victorian Habitat Database : Seagrass Assessment - Gippsland Lakes
Marine and Freshwater Resources Institute - Page 21
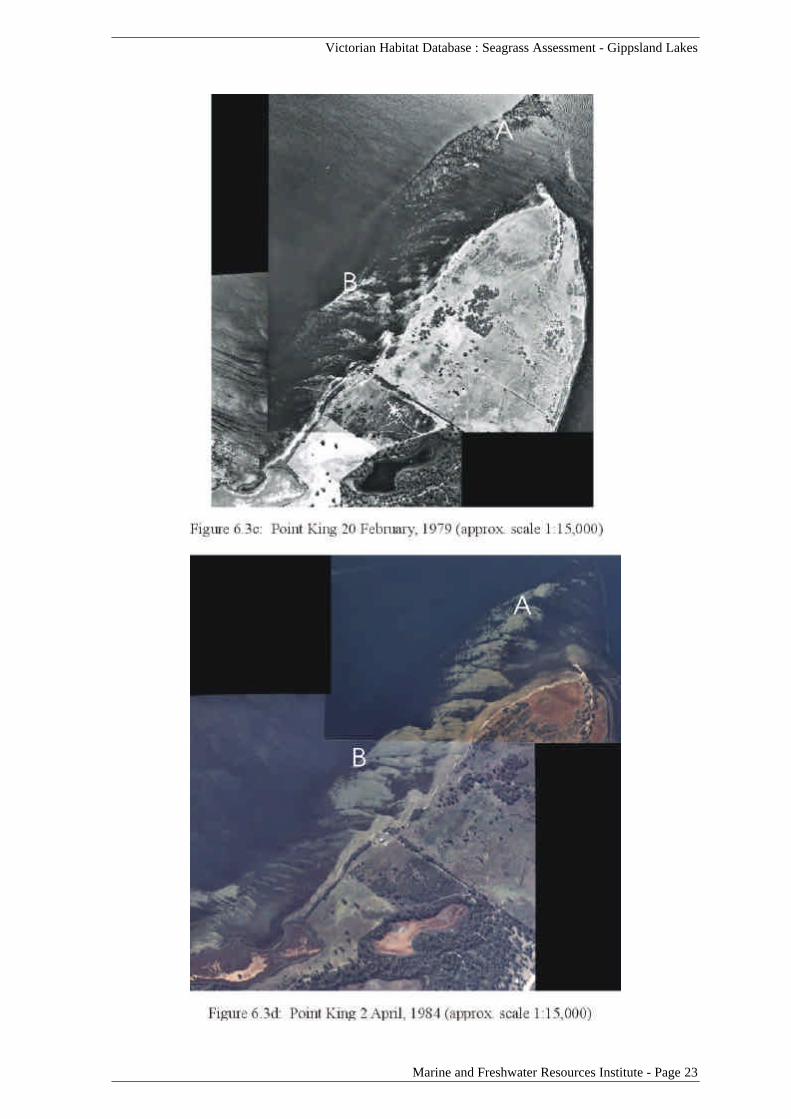
6.3 Point King - Raymond Island, Lake King
Point King is located on the north eastern tip of Raymond Island in Lake King. The arearepresented by this site features a wide band of seagrass on the western shore of RaymondIsland extending to the south west from Point King. The historic aerial photographsavailable for Point King which are suitable for interpreting seagrass distribution were flownin 1969, 1976, 1979, 1984, 1989 and 1997 (Figures 6.3a-f).
The initial photograph for the site flown in 1969 (Figure 6.3a) shows a wide band of denseseagrass extending from the tip of Point King (Point A) to the south west with some baresand areas near the area marked as Point B. A significant loss of seagrass can be observedin the next available photograph flown in 1976 (Figure 6.3b). Bare areas of sand areevident stretching from Point A through to Point B.
The photograph for 1979 (Figure 6.3c) is difficult to interpret due to wind ripples on thesurface and a sun sheen, but an increase in seagrass since 1976 can be observed in the areaaround Point B. By 1984 (Figure 6.3d) a significant decrease in seagrass is evident andlarge areas of bare sand can be observed stretching between Point A and Point B. The levelof seagrass loss in 1984 was greater than that observed in the 1976 photograph (Figure6.3b).
Much of the seagrass loss evident in 1984 (Figure 6.3d) appears to have been revegetated inthe 1989 photograph (Figure 6.3e), although large areas of bare sand can still be observednear Point B. In the most recent photograph flown in 1997 (Figure 6.3f) dense seagrass canbe observed across all the area from Point A to Point B and to the south west of Point B.The seagrass cover that can be observed in the 1997 photograph is the most extensive forthe available photographs.
When an overall comparison of the available aerial photography for Point King isundertaken the greatest level of seagrass cover can be observed in the years 1969 (Figure6.3a) and 1997 (Figure 6.3f) while the least cover can be observed in the years 1976 (Figure6.3b) and 1984 (Figure 6.3d).

Victorian Habitat Database : Seagrass Assessment - Gippsland Lakes
Marine and Freshwater Resources Institute - Page 22
Victorian Habitat Database : Seagrass Assessment - Gippsland Lakes
Marine and Freshwater Resources Institute - Page 23

Victorian Habitat Database : Seagrass Assessment - Gippsland Lakes
Marine and Freshwater Resources Institute - Page 24

Victorian Habitat Database : Seagrass Assessment - Gippsland Lakes
Marine and Freshwater Resources Institute - Page 25
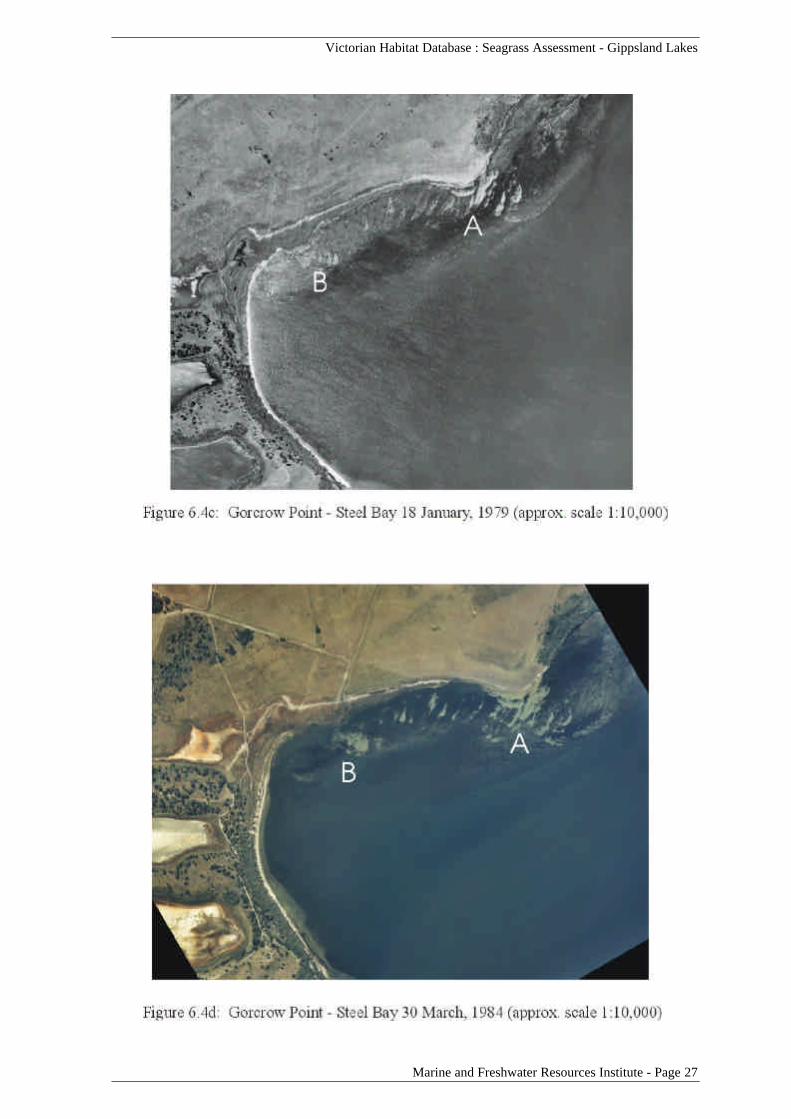
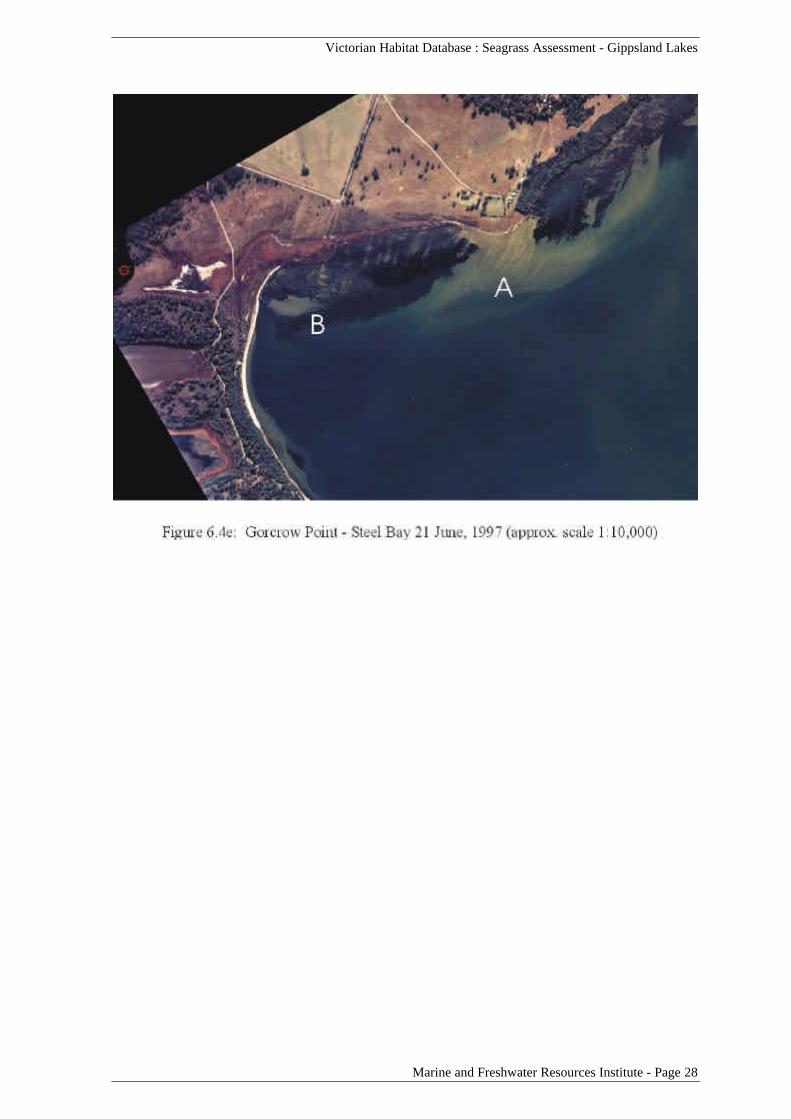
6.4 Gorcrow Point - Steel Bay, Lake Victoria
Gorcrow Point forms the eastern end of Steel Bay and is located on the north side of thecentral region of Lake Victoria. Steel Bay is a small embayment which is partially protectedfrom south westerly winds by Waddy Point. A relatively wide band of seagrass typicallyextends along the northern shore of Steel Bay extending eastwards parallel to the coast.The aerial photographs available for Gorcrow Point - Steel Bay which are suitable forinterpreting seagrass distribution were flown in 1969, 1976, 1979, 1984 and 1997 (Figures6.4a-e respectively).
The initial photograph for the site flown in 1969 (Figure 6.4a) shows a wide band of denseseagrass extending to the east and west of Gorcrow Point (Point A). While the photographflown in 1976 (Figure 6.4b) indicates that the seagrass cover is similar to the east and westof Gorcrow Point (Point A) a large area of bare sand has emerged extending from GorcrowPoint itself.
The bare areas at Gorcrow Point (Point A) that can be observed in 1976 (Figure 6.4b)appear to have been mostly revegetated in the photograph flown in 1979 (Figure 6.4c).However, the seagrass at the western end of Steel Bay (Point B) appears to have becomemore sparse. In 1984 (Figure 6.4d) there is again a noticeable decline in seagrass atGorcrow Point (Point A) and also at the western end of Steel Bay (Point B). It wouldappear that overall there was less seagrass in the area in the 1984 photograph (Figure 6.4d)than in photographs for previous years.
A dramatic change in the seagrass beds at Gorcrow Point can be observed in the 1997photograph (Figure 6.4e). A large area offshore from Gorcrow Point (Point A) iscompletely denuded of seagrass which may be associated with the development that can beobserved on the Point itself. The seagrass to the east and west of Gorcrow Point appears tobe still relatively dense, although a large bare area can be observed at the far western end ofSteel Bay (Point B). This bare area extends further westward than the bare area which canbe observed around the same area in the 1984 photograph (Figure 6.4d).
When an overall comparison of the available aerial photography for Gorcrow Point - SteelBay is undertaken, the greatest level of seagrass cover can be observed in 1969 (Figure6.4a). The least amount of seagrass cover can be observed in the 1997 photograph (Figure6.4e) although this may be an anomaly as there appears to be a very localised impactcausing the large loss of seagrass. If the loss of seagrass that is evident in 1997 isdiscounted, then 1984 (Figure 6.4d) is the year with the least seagrass cover for theavailable photographs.

Victorian Habitat Database : Seagrass Assessment - Gippsland Lakes
Marine and Freshwater Resources Institute - Page 26
Victorian Habitat Database : Seagrass Assessment - Gippsland Lakes
Marine and Freshwater Resources Institute - Page 27
Victorian Habitat Database : Seagrass Assessment - Gippsland Lakes
Marine and Freshwater Resources Institute - Page 28

Victorian Habitat Database : Seagrass Assessment - Gippsland Lakes
Marine and Freshwater Resources Institute - Page 29
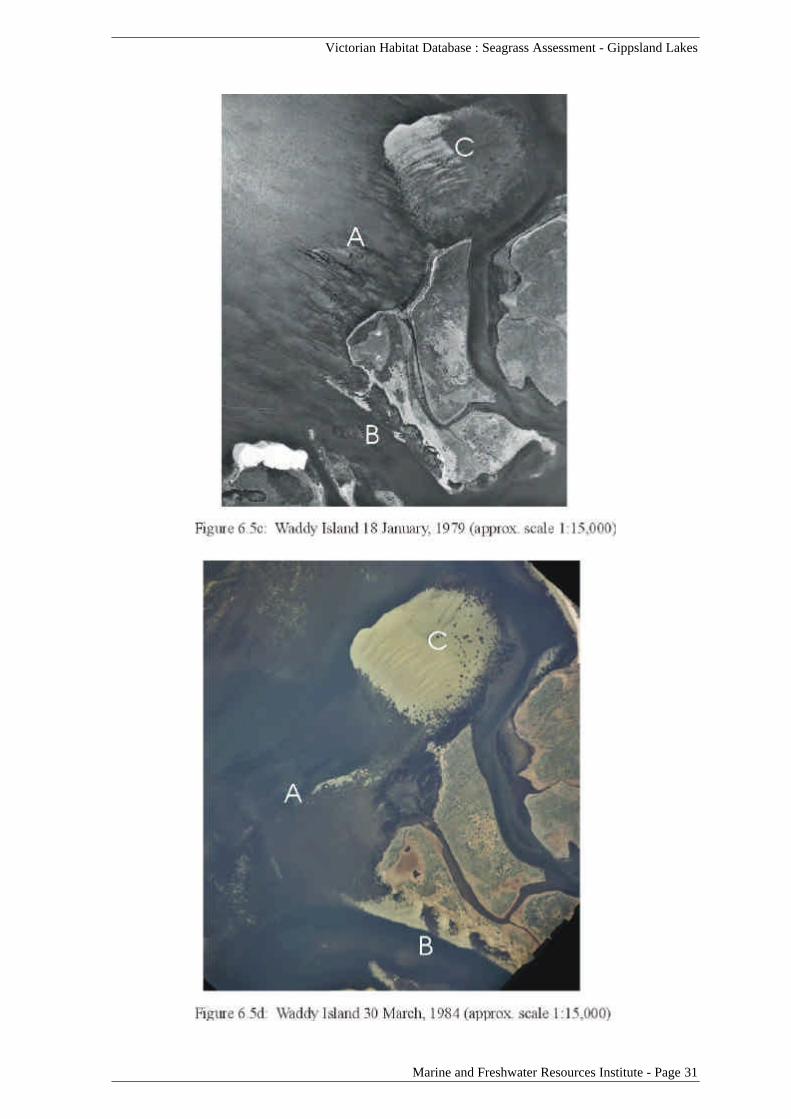
6.5 Waddy Island, Lake Victoria
Waddy Island is located at the eastern end of Lake Victoria near the western tip of theBoole Poole Peninsula. The area around Waddy Island features a complex of island,channels and shallow sand banks. The historic aerial photographs available for the WaddyIsland region which are suitable for interpreting seagrass distribution were flown in 1969,1976, 1979, 1984, 1986 and 1997 (Figures 6.5a-f).
In the initial photograph from 1969 (Figure 6.5a) the areas to the north (Point A) and west(Point B) of Waddy Island appear to only have a relatively sparse coverage of seagrass,although the area to the north west appears densely vegetated. The shallow sand bank tothe north east (Point C) has a good coverage of seagrass around its perimeter but its centreis only sparsely vegetated. By 1976 (Figure 6.5b) an overall increase in the area of seagrassto the north (Point A) of Waddy Island can be observed and the areas to the west of theisland (Point B) are also more densely vegetated. The seagrass on the sand bank at Point Cappears to be relatively unchanged.
The photograph for 1979 (Figure 6.5c) is difficult to interpret due to wind ripples and sunsheen, but the areas to the north and west (Points A & B) appear similar to the previousphotograph in 1976 with some increase in seagrass at Point B. Of note is the heavy shadingcovering the sand bank to the north east of Waddy Island (Point C). While this may beseagrass it is equally likely that it represents a dense cover of algae. By 1984 (Figure 6.5d)the area to the north of Waddy Island (Point A) appears to still have a dense growth ofseagrass, but the area to the west (Point B) has significantly less seagrass than 1979 and1976. The heavy shading which covered the sand bank at Point C has almost disappeared,although the seagrass around the perimeter of the sand bank remains similar to that whichcan be observed in previous years.
The photograph for 1986 (Figure 6.5e) is also difficult to interpret due to sun sheen andwind ripples and the coverage at Point A cannot be clearly seen, but an increase in seagrasssince 1984 (Figure 6.5d) can be observed to the west of Waddy Island at Point B. The sandbank at Point C, which was bare in 1984 (Figure 6.5d), has regained a similar coverage tothat observed in 1979 (Figure 6.5a). The photograph for 1997 (Figure 6.5f) shows thedensity and extent of the seagrass to be greater at all areas around Waddy Island than in anyof the previous photographs.
When an overall comparison of the available aerial photography for Waddy Island isundertaken the least cover of seagrass can be observed in 1969 (Figure 6.5a) with the areasouth west of the Island (Point B) also being very depleted in 1984 (Figure 6.5d) As statedabove, 1997 (Figure 6.5f) appears to be the year with the most seagrass at this site.

Victorian Habitat Database : Seagrass Assessment - Gippsland Lakes
Marine and Freshwater Resources Institute - Page 30
Victorian Habitat Database : Seagrass Assessment - Gippsland Lakes
Marine and Freshwater Resources Institute - Page 31

Victorian Habitat Database : Seagrass Assessment - Gippsland Lakes
Marine and Freshwater Resources Institute - Page 32
Victorian Habitat Database : Seagrass Assessment - Gippsland Lakes
Marine and Freshwater Resources Institute - Page 33
7. CONCLUSIONS
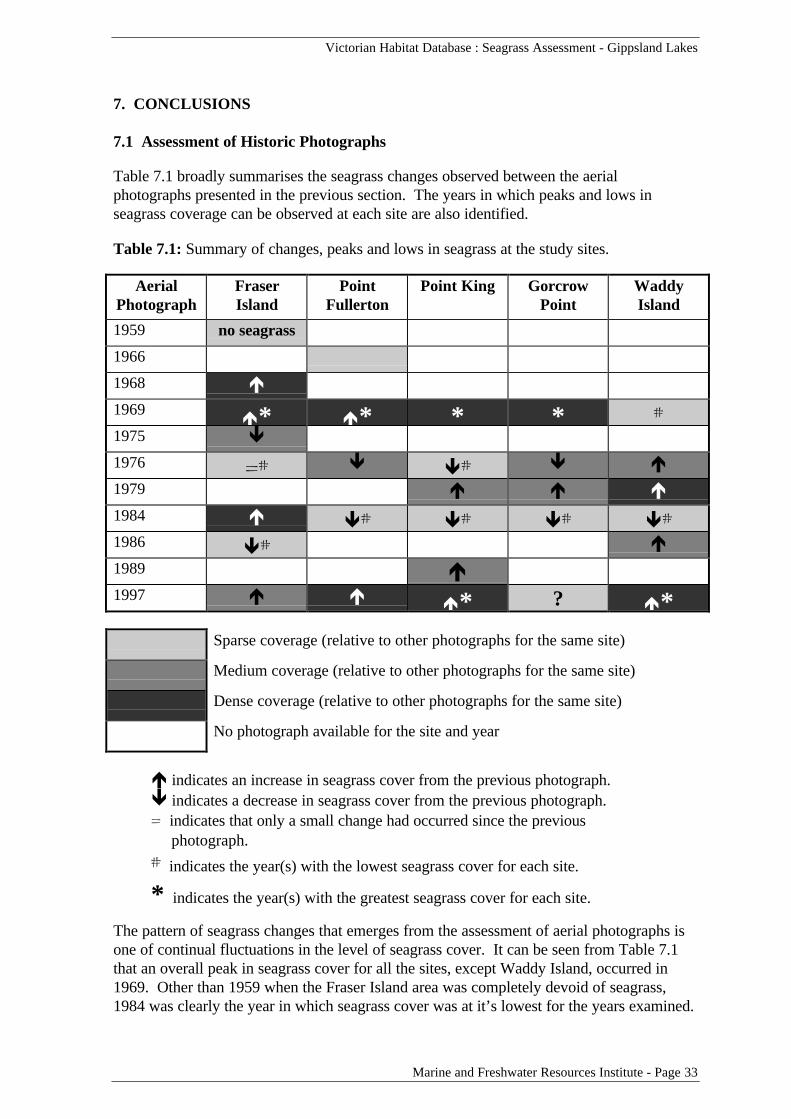
7.1 Assessment of Historic Photographs
Table 7.1 broadly summarises the seagrass changes observed between the aerialphotographs presented in the previous section. The years in which peaks and lows inseagrass coverage can be observed at each site are also identified.
Table 7.1: Summary of changes, peaks and lows in seagrass at the study sites.
AerialPhotograph
FraserIsland
PointFullerton
Point King GorcrowPoint
WaddyIsland
1959 no seagrass
1966
1968 é1969 é* é* * * #1975 ê1976 =# ê ê# ê é1979 é é é1984 é ê# ê# ê# ê#1986 ê# é1989 é1997 é é é* ? é*
Sparse coverage (relative to other photographs for the same site)
Medium coverage (relative to other photographs for the same site)
Dense coverage (relative to other photographs for the same site)
No photograph available for the site and year
é indicates an increase in seagrass cover from the previous photograph.ê indicates a decrease in seagrass cover from the previous photograph.= indicates that only a small change had occurred since the previous
photograph.
# indicates the year(s) with the lowest seagrass cover for each site.
* indicates the year(s) with the greatest seagrass cover for each site.
The pattern of seagrass changes that emerges from the assessment of aerial photographs isone of continual fluctuations in the level of seagrass cover. It can be seen from Table 7.1that an overall peak in seagrass cover for all the sites, except Waddy Island, occurred in1969. Other than 1959 when the Fraser Island area was completely devoid of seagrass,1984 was clearly the year in which seagrass cover was at it’s lowest for the years examined.

Victorian Habitat Database : Seagrass Assessment - Gippsland Lakes
Marine and Freshwater Resources Institute - Page 34
A general decrease in seagrass occurred across the Lakes between the peak year in 1969and the next set of photographs for 1976. This decrease was followed by a general increasein seagrass between the years 1976 and 1979 which was again followed by a decrease inseagrass cover between 1979 and 1984.
Few useable photographs are available for the years from 1984 to 1997 but the seagrasscover in 1997 shows a definite increase from the low coverage observed in 1984. Bycomparison to previous years, the 1997 photographs appear to have been flown at a periodof good seagrass growth and the cover at Waddy Island and Point King in particular isgreater than in any of the previous photographs.
The pattern of change in seagrass is not entirely consistent across the Lakes with somenotable variations. Waddy Island had a low cover of seagrass in 1969 when all of the othersites had dense covers and the pattern of change between years at this site was typicallydifferent to the other sites. The Fraser Island site also varied from the overall pattern ofchange and featured a relatively good cover of seagrass in 1984 when all the other sites hadtheir lowest coverage.
The assessment of aerial photography highlights factors which need to be considered ifseagrass sampling points are to be selected to be representative of seagrass changesthroughout the Lakes. While it appears that an overall pattern of seagrass variation can beobserved for the Lakes, this pattern appears to display some regional differences within theLakes. Periods of seagrass decline in the Lake King and Lake Victoria regions, forexample, may not be indicative of the same rate or extent of decline in the Lakes region eastof Metung. As a result it may be possible to divide the Lakes into 3-4 zones with samplingsites in each zone. The zones could, for example, encompass the eastern Lakes (ReeveChannel area east of Metung), northern central (encompassing most of Lake King),southern central (Sperm Whale Head to Metung) and the western Lakes (Lake Victoriawest of Sperm Whale Head).
7.2 Limitations of Historic Aerial Photographs for Assessing Seagrass Changes
The assessment of historic aerial photography presents a useful method of identifying broadpatterns of seagrass changes in shallow marine environments. However, this study didhighlight some of the restrictions and limitations of this approach.
Historic aerial photography obviously cannot be groundtruthed and this is one of the biggestlimitations in environments such as the Gippsland Lakes where there is a widespreaddistribution of macro-algae. This algae typically becomes entangled and intertwined withthe seagrass and its presence can make accurate interpretations of the density of seagrassdifficult. As a result the interpretation of seagrass cover and density from the photographsmust be undertaken with a degree of caution.
Similarly, the Swan Reach Bay site also revealed the possibility of drift seagrass that hasaccumulated in sand ridges on the bed of the Lakes appearing as dense beds of healthyseagrass on the aerial photographs. This highlights the need for field work to be undertakento provide an understanding of the likely phenomena that may be observed in aerialphotographs.
The historic aerial photographs available for the Gippsland Lakes have been flown atunequal intervals and not all of the Lakes is covered by each photography run. Thephotographs have also been flown at different seasons. As a result the apparent pattern of

Victorian Habitat Database : Seagrass Assessment - Gippsland Lakes
Marine and Freshwater Resources Institute - Page 35
seagrass change noted in the previous section must be considered as being indicative only asthe periods between the photographs differ and years in which significant changes occurredmay have been missed. The changes observed between Fraser Island in 1968 (Figure 6.1b)and 1969 (Figure 6.2a) highlight the changes that can occur in a single year which will bemissed when comparing photographs at five yearly or greater intervals.
The aerial photography used in this study were typically flown for terrestrial mappingprograms and as a result no consideration was given to conditions suitable for mapping theaquatic environment in the selection of the times for the flying this photography. As aresult, many of the historic photographs available for the Lakes could not be used in thisstudy due to the presence of sediment or algae in the water column, wind ripples on thesurface of the water and/or sun sheen on the surface of the water (see Attachment 1). Theimpact of adverse climatic and environmental conditions on aerial photography is a majorlimitation on the use of historic photographs for studies of seagrass and aquatic substrates.


