Vertical Integration with Multiproduct Firms: When ... · PDF fileCoca Cola Company, ... a...
41
Vertical Integration with Multiproduct Firms: When Eliminating Double Marginalization May Hurt Consumers Fernando Luco Guillermo Marshall October 20, 2017 Abstract How do vertical mergers impact prices in multiproduct industries? We ad- dress this question by exploiting vertical mergers that took place in the car- bonated beverage industry in 2010, and eliminated double marginalization for a subset of the products sold by the firms involved. We find that for products with eliminated double margins, vertical integration decreased prices by 1.4 per- cent. However, for all other products, prices increased by 3.9 percent, causing a price increase on average. These results are consistent with theoretical results in the multiproduct pricing literature, and suggest caution when evaluating vertical mergers in multiproduct industries. Keywords: Vertical integration, multiproduct firms, carbonated beverage industry We thank Andrew Eckert, Jason Lindo, Aviv Nevo, Rob Porter, Mar Reguant, Michael Salinger, and Ali Yurukoglu for valuable feedback, as well as seminar and conference participants at Alberta, International Industrial Organization Conference, Searle Center Conference on Antitrust Economics and Competition Policy (Northwestern), and Texas A&M for helpful comments. Julia Gonz´ alez and Trent McNamara provided outstanding research assistance. All estimates and analyses in this paper based on Information Resources Inc. data are by the authors and not by Information Resources Inc. The usual disclaimer applies. Texas A&M University, Department of Economics; fl[email protected] University of Illinois at Urbana-Champaign, Department of Economics; [email protected] 1
Transcript of Vertical Integration with Multiproduct Firms: When ... · PDF fileCoca Cola Company, ... a...

Vertical Integration with Multiproduct Firms:
When Eliminating Double Marginalization May
Hurt Consumers*
Fernando Lucot Guillermo Marshall+
October 20, 2017
Abstract
How do vertical mergers impact prices in multiproduct industries? We ad
dress this question by exploiting vertical mergers that took place in the car
bonated beverage industry in 2010, and eliminated double marginalization for
a subset of the products sold by the firms involved. We find that for products
with eliminated double margins, vertical integration decreased prices by 1.4 per
cent. However, for all other products, prices increased by 3.9 percent, causing a
price increase on average. These results are consistent with theoretical results in
the multiproduct pricing literature, and suggest caution when evaluating vertical
mergers in multiproduct industries.
Keywords: Vertical integration, multiproduct firms, carbonated beverage industry
* We thank Andrew Eckert, Jason Lindo, Aviv Nevo, Rob Porter, Mar Reguant, Michael Salinger,
and Ali Yurukoglu for valuable feedback, as well as seminar and conference participants at Alberta,
International Industrial Organization Conference, Searle Center Conference on Antitrust Economics
and Competition Policy (Northwestern), and Texas A&M for helpful comments. Julia Gonzalez and
Trent McNamara provided outstanding research assistance. All estimates and analyses in this paper
based on Information Resources Inc. data are by the authors and not by Information Resources Inc.
The usual disclaimer applies. t Texas A&M University, Department of Economics; [email protected] + University of Illinois at Urbana-Champaign, Department of Economics; [email protected]
1
1 Introduction
How vertical integration impacts consumer welfare and market efficiency is a long
standing question in competition policy. Vertical mergers are often evaluated based
on whether the efficiency gains of eliminating double marginalization dominate the
welfare consequences of market foreclosure (e.g., Chipty 2001, Hastings and Gilbert
2005, Hortacsu and Syverson 2007).1 In multiproduct industries, however, a third
effect also comes into play when a firm merges with a subset of its suppliers and
double margins are eliminated for only some of its products. This third effect may
create scenarios where consumers are hurt by vertical integration even when market
foreclosure is not a concern (Edgeworth, 1925, Salinger, 1991).
Theoretically, eliminating double margins for a subset of the substitute products offered
by a multiproduct firm has two effects on prices. On the one hand, the products with
eliminated double margins become cheaper to sell, which creates a downward pressure
on the prices of these goods. This is the efficiency effect associated with the elimination
of double marginalization. On the other hand, the products with eliminated double
margins become relatively more profitable to sell. This gives the firm incentives to
divert demand towards these products by increasing the prices of the products for which
double marginalization was not eliminated. We call this second effect the Edgeworth-
Salinger effect, and it may lead to price increases that hurt consumers (Salinger, 1991).
How vertical integration impacts welfare therefore depends on the relative magnitude
of these effects.
In this paper, we ask how vertical integration impacts prices in multiproduct industries.
We address this question in the context of a recent wave of vertical integration in the
carbonated beverage industry in the United States. Upstream firms in this industry
are concentrate producers (e.g., The Coca Cola Company, PepsiCo, and Dr Pepper
Snapple Group). Downstream firms are bottlers who purchase concentrate from one or
more upstream firms, and produce and sell canned and bottled carbonated beverages.
For example, The Coca Cola Company’s main bottler has bottled both The Coca
Cola Company brands (“own brands”) and Dr Pepper Snapple Group brands in many
locations across the United States.
1In practice, vertical mergers are often presumed to cause efficiencies. For this reason, Motta (2004, p.378) calls for clearing vertical mergers that are unlikely to cause market foreclosure. Relatedly, Riordan and Salop (1995) argue that if a vertical merger is unlikely to cause consumer injury (e.g., input foreclosure), gauging efficiency gains is unnecessary when evaluating a proposed merger.
2

A number of vertical transactions took place in 2009 and 2010, which involved The
Coca Cola Company, PepsiCo, and some of their bottlers. After the vertical mergers,
double marginalization was eliminated for the brands owned and bottled by PepsiCo
and The Coca Cola Company (i.e., own brands). However, because Dr Pepper Snapple
Group remained independent in selling inputs to bottlers, double marginalization was
not eliminated for Dr Pepper Snapple Group’s brands bottled by the bottling divisions
of PepsiCo and The Coca Cola Company.2 As a consequence of this partial elimination
of double marginalization, we expect these transactions to have caused a manifestation
of the efficiency and Edgeworth-Salinger effects of vertical integration.
To measure the effects of vertical integration on prices, we use a unique combination
of data sources. First, we use weekly data on retail prices at the product–store level
for 50 markets in the United States from the IRI Marketing Data Set (Bronnenberg
et al., 2008). Second, we use an industry publication and Federal Trade Commission
documents to identify how each store in the scanner data was impacted by vertical
integration. A given store may be in a county unaffected by vertical integration, or in a
county with a vertically-integrated bottler that faced either a partial or full elimination
of double marginalization.
The carbonated beverage industry is ideal for this study for at least two reasons.
First, because PepsiCo and The Coca Cola Company merged with only a subset of
their independent bottlers, vertical integration took place in only some parts of the
country. This geographical variation in vertical integration generates rich longitudinal
and cross-sectional variation in vertical structure that is key for our identification
strategy. Second, market-foreclosure effects after vertical integration are likely absent
in this environment, providing us with a setting where vertical integration impacts
prices only through the elimination of double marginalization. The lack of foreclosure
incentives facilitates the identification of the Edgeworth-Salinger effect.3
Our strategy to identify the effect of vertical integration on prices exploits the rich
longitudinal and cross-sectional variation in vertical structure generated by the vertical
mergers as well as the panel structure of the data. Our analysis is based on comparing
the within-product price changes in places that were affected by the vertical mergers
with the within-product price changes in places unaffected by the vertical mergers. To
2These Dr Pepper Snapple Group brands included Dr Pepper, Canada Dry, Crush, and Schweppes. 3Though the transactions we study in this paper are specific to the carbonated soda industry,
vertical integration between retailers and some of their upstream providers are not rare. For example, Safeway and Meijer have vertically-integrated with dairy producers in the past.
3

quantify the relevance of the Edgeworth-Salinger effect, we distinguish between own
and Dr Pepper Snapple Group brands bottled by a vertically-integrated bottler when
measuring the impact of vertical integration on prices.
We find that vertical integration decreased the prices of own brands bottled by a
vertically-integrated bottler by 1.4 percent (e.g., Diet Pepsi bottled by PepsiCo) and
it increased the prices of Dr Pepper Snapple Group brands bottled by a vertically-
integrated bottler by 3.9 percent (e.g., Dr Pepper bottled by PepsiCo). The over
all impact of vertical integration was to increase the prices of products bottled by
vertically-integrated bottlers by an average of 1.8 percent. Dynamic effects estimates
show that the price increases in products bottled by a vertically-integrated bottler only
started after the vertical transactions took place, and the price increases persisted in
time. Lastly, a heterogeneity analysis shows that vertical integration lead to an increase
in the price of most Dr Pepper Snapple Group brands bottled by vertically-integrated
bottlers.
Our results are consistent with a manifestation of the efficiency and Edgeworth-Salinger
effects of vertical integration. Our findings show that the Edgeworth-Salinger effect
is of the same order of magnitude than the efficiency effect, and suggest that the
vertical integration of multiproduct firms has the potential of harming consumers.
Our analysis has two policy implications. First, multiproduct pricing incentives should
not be ignored when evaluation vertical mergers. Second, merger simulations are as
relevant for the evaluation of vertical mergers in multiproduct industries as they are
for the evaluation of horizontal mergers.
The rest of the paper is organized as follows. Section 2 presents a conceptual discussion
of the impact of vertical integration on the pricing incentives of a multiproduct firm.
Industry background as well as a description of the data are presented in Section
3. Section 4 presents our empirical framework. Our results showing that vertical
integration led to an increase (decrease) in the prices of the goods for which the double
margins were not (were) eliminated after vertical integration are discussed in Section
5. Lastly, in Section 6, we discuss the implications of our findings and conclude.
4

1.1 Literature Review
The question of whether vertical mergers are pro- or anticompetitive has been a mat
ter of debate for decades (see, for example, Salinger 1988, Perry 1989, Ordover et al.
1990, Hart et al. 1990, Bolton and Whinston 1991, Reiffen 1992, Riordan 1998, Choi
and Yi 2000, Chen 2001, Lafontaine and Slade 2007). The main argument suggest
ing that vertical mergers are anticompetitive is that a vertical merger may incentivize
the vertically-integrated firm to exclude a downstream or upstream rival (i.e., market
foreclosure). On the other hand, the procompetitive argument is that vertical integra
tion is likely to create efficiencies that are transaction specific (e.g., the elimination of
double margins).
Whether the pro- or anticompetitive effect dominates has been a matter of empirical
work with mixed findings. Hortacsu and Syverson (2007) show that vertical integration
in the cement and ready-mixed concrete industries led to lower prices, consistent with
efficiency gains dominating potential foreclosure effects. Chipty (2001) and Hastings
and Gilbert (2005) present evidence in favor of the foreclosure effect dominating in both
the U.S. pay television and the wholesale gasoline industries, respectively. Crawford
et al. (2015) provide an empirical framework to study the welfare gains of vertical
integration, and use it to evaluate the vertical integration of regional sports networks
with programming distributors in the U.S. pay television industry. The authors find
that the sign of the welfare effect of vertical integration depends on whether the non-
integrated distributors have access to integrated content.4
A less studied effect of vertical mergers is that they may also result in price increases
that are not caused by foreclosure incentives. Salinger (1991) shows that when a
multiproduct downstream firm vertically integrates with one of its suppliers and double
margins are eliminated for a subset of its products, the firm has greater incentives to
sell the products with eliminated double margins. As a consequence, the firm responds
by increasing the prices of its other products to boost the sales of the products with
eliminated double margins, potentially harming consumers. The economics behind
this effect was originally discussed by Edgeworth (1925) in the context of excise taxes
that are specific to a subset of the goods sold by a multiproduct firm, and Hotelling
(1932) discusses the welfare implications of the effect. We contribute to the literature
by measuring the economic relevance of this effect for vertical merger evaluation.
4Other recent empirical studies on vertical integration include Villas-Boas (2007), Mortimer (2008), Houde (2012), Lee (2013), Atalay et al. (2014), and Asker (2016).
5

2 Multiproduct Pricing and Vertical Integration
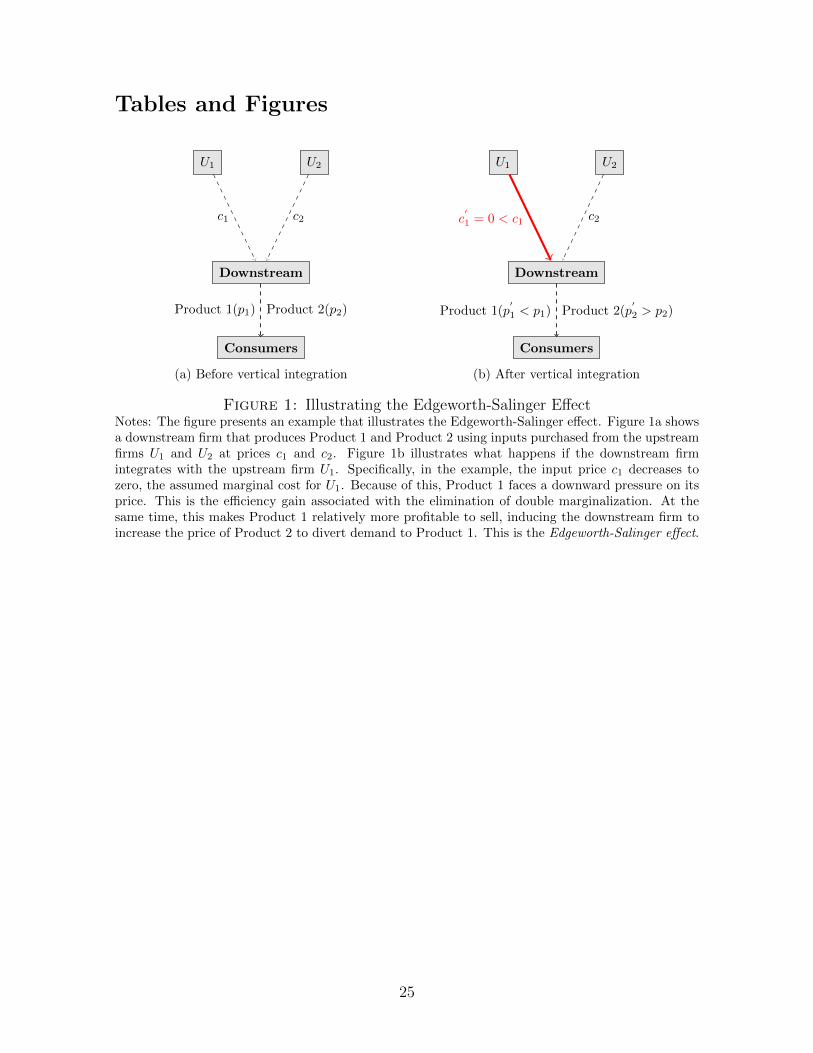
To see how vertical integration impacts the pricing incentives of a multiproduct firm,
consider the example presented in Figure 1. Before vertical integration (Figure 1a),
a downstream monopolist sells two substitute products, product 1 and product 2, at
prices p1 and p2. In the example, the monopolist produces product 1 using inputs it
purchases from the upstream firm U1, and it produces product 2 using inputs it pur
chases from the upstream firm U2. In this setting, the first order necessary conditions
for the equilibrium prices, p1 ∗ and p2
∗, are given by
∂q1 ∂q2∗ ∗ ∗ ∗ q1(p1, p 2) + (p1 − c1) + (p2 − c2) = 0 ∂p1 ∂p1
∂q2 ∂q1∗ ∗ ∗ ∗ q2(p1, p 2) + (p2 − c2)∂p2
+ (p1 − c1)∂p2
= 0,
where c1 and c2 are the input costs of the bottler.
Consider now a vertical merger that eliminates the double margin for product 1, causing
the effective input cost of product 1 to drop to zero (i.e., the assumed marginal cost of
production of the input producer), and leaves c2 at its original value (see Figure 1b).
Then, at the pre-merger prices, p ∗ 1 and p ∗
2, we have that
∂q1 ∂q2∗ ∗ ∗ ∗ q1(p1, p 2) + p1 + (p2 − c2) < 0 ∂p1 ∂p1
∂q2 ∂q1∗ ∗ ∗ ∗ q2(p1, p 2) + (p2 − c2) + p1 > 0 ∂p2 ∂p2
both because demand is downward sloping and the products are substitutes. First,
the elimination of the double margin creates an incentive to decrease the price of
product 1 because of its lower marginal cost. This corresponds to the efficiency effect
of eliminating double marginalization. Second, the elimination of the double margin
in product 1 gives the downstream monopolist greater marginal incentives to sell this
product because it now earns the monopolist a higher margin (i.e., p ∗ 1 versus the pre
merger margin of p ∗ 1 − c1). This creates an incentive to increase the price of product 2
to induce consumers to substitute to product 1. As discussed above, we call this the
Edgeworth-Salinger effect, and it can only arise in the context of multiproduct firms
selling substitute products. This change in incentives due to the merger may result in
an increase in the price of product 2, and even in an increase in the price of both goods
6
(Salinger, 1991).5
Depending on the relative magnitude of each of these effects on prices, consumers may
be hurt by vertical integration. An example where consumers are hurt by vertical
integration is provided in Salinger (1991), who shows that the prices of all goods can
increase after double marginalization is eliminated for good 1. Similarly, but in the
context of taxation, Hotelling (1932) provides examples for when an excise tax on one
good can result in price decreases for all goods.
3 Background and Data
3.1 Vertical Transactions
The U.S. carbonated beverage industry is characterized by upstream companies selling
concentrate or syrup (e.g., The Coca Cola Company, PepsiCo, and Dr Pepper Snapple
Group), and bottlers who purchase the concentrate to produce, market, and distribute
canned and bottled carbonated beverages. Upstream firms grant bottlers exclusive
territories to sell the canned and bottled carbonated beverages that derive from their
concentrates. Most bottler agreements that govern the vertical relationships between
upstream firms and bottlers provide upstream firms with complete flexibility to de
termine the prices of concentrates, and grant bottlers flexibility to choose the prices
at which they sell the canned and bottled carbonated beverages to retailers. Under
these agreements, upstream firms face no obligation to participate with bottlers in the
bottlers’ marketing expenditures, though bottlers still benefit from the upstream firms’
national marketing campaigns.6 Bottlers may transact with more than one upstream
firm (e.g., Pepsi Bottling Group transacted with both PepsiCo and Dr Pepper Snapple
Group prior to 2009).
In 2009 and 2010, a number of vertical transactions took place in the industry involving
upstream companies and bottlers. The Federal Trade Commission (henceforth, FTC)
reviewed the transactions and cleared them in October and November of 2010 subject
5We acknowledge that input transactions along the vertical chain may involve non-linear prices. We note, however, that the Edgeworth-Salinger effect will arise as long as the unit price in the vertical contract has a non-zero markup.
6For more details about the bottler agreements see, for instance, The Coca Cola Company (2009), PepsiAmericas, Inc. (2009), The Pepsi Bottling Group, Inc. (2009).
7
to some behavioral remedies related to information management and compensation
(Federal Trade Commission, 2010a,b).7 First, PepsiCo Inc entered into agreements to
merge with Pepsi Bottling Group Inc (PBG) and Pepsi Americas Inc (PAS) in August
of 2009. Second, The Coca Cola Company (henceforth, Coca-Cola) merged with Coca-
Cola Enterprises Inc (henceforth, CCE), its main bottler, in February of 2010. Lastly,
PepsiCo acquired Pepsi-Cola Bottling Co of Yuba City Inc (PYC) in April of 2010.
Before these vertical mergers, Coca-Cola, PepsiCo, and Dr Pepper Snapple Group
(henceforth, Dr Pepper SG) relied heavily on these and other independent bottlers
to produce and distribute bottled and canned carbonated beverages. According to
the FTC, CCE accounted for about 75 and 14 percent of Coca-Cola’s and Dr Pepper
SG’s sales of bottled and canned soft drinks in 2009, respectively; while PBG and
PAS accounted for about 75 and 20 percent of PepsiCo’s and Dr Pepper SG’s sales of
bottled and canned soft drinks in 2009, respectively.8
After the firms entered into their respective merger agreements, both Coca-Cola and
PepsiCo acquired new exclusive licenses to continue to sell and distribute some of Dr
Pepper SG’s brands in some territories. The new licenses granted Coca-Cola exclusive
rights to continue selling Dr Pepper and Canada Dry in former CCE territories, and
PepsiCo exclusive rights to continue selling Dr Pepper, Crush, and Schweppes in former
PBG and PAS territories.9 These new licenses were acquired because the change in
ownership of the bottlers triggered the termination of the original licenses.
The vertical mergers eliminated the incentive of Coca-Cola and PepsiCo to sell con
centrate to their integrated bottlers at a price greater than marginal cost (i.e., double
marginalization). Double marginalization, however, was not eliminated for Dr Pep
per Snapple Group’s brands bottled by PepsiCo and Coca-Cola because Dr Pepper
SG remained independent in selling inputs to bottlers. As a consequence, the vertical
mergers and the agreements with Dr Pepper SG had an impact on vertical structure
along two dimensions. First, because not all territories were served by CCE in the
case of Coca-Cola, and PBG, PAS, and PYC in the case of PepsiCo, the vertical merg
ers only exposed some territories to vertical integration. Second, neither PepsiCo nor
7We provide a summary of the FTC’s complaints and decision orders of these transactions in the Online Appendix. The complaints can be accessed at https://www.ftc.gov/sites/default/files/documents/cases/2010/11/101105cocacolacmpt.pdf and
https://www.ftc.gov/sites/default/files/documents/cases/2010/09/100928pepscocmpt.pdf. 8See the complaints filed by the FTC for more details about the industry (Federal Trade Com
mission, 2010a,b). 9See points 17 and 24 of the FTC’s complaints of the Coca-Cola and PepsiCo transactions, re
spectively, for details (Federal Trade Commission, 2010a,b).
8

Coca-Cola bottled Dr Pepper SG brands in all of the territories served by a vertically-
integrated bottler, implying that some areas impacted by vertical integration were only
exposed to a partial elimination of double marginalization.
With respect to market foreclosure, two facts suggest that it is unlikely that the vertical
mergers had foreclosure effects. First, the acquisition of the licenses to continue selling
Dr Pepper SG brands suggests that it was in the best interest of Coca-Cola and PepsiCo
to continue selling Dr Pepper SG brands. The vertically-integrated bottlers could have
chosen to drop these Dr Pepper SG brands to potentially increase Dr Pepper SG’s cost
of selling these products, but this did not happen. Second, the bottlers had control
over the prices of own and Dr Pepper SG brands both before and after the mergers,
and Dr Pepper SG remained independent in providing inputs to bottlers throughout.
The pricing problem therefore did not change for the vertically-integrated bottlers after
the vertical mergers other than through the elimination of the double margins for own
brands, suggesting no incentive to increase the prices of the Dr Pepper SG brands
after vertical integration other than the Edgeworth-Salinger effect (see the discussion
in Section 2).
Lastly, regarding the motives behind the vertical mergers, industry observers argue that
Coca-Cola and PepsiCo were seeking to reduce costs and gain control over retail prices
with the mergers.10 Eliminating double marginalization was a way to compensate
for the increase in input costs faced by the firms in the 2000s (e.g., plastic, high-
fructose corn syrup). By both lowering costs and gaining control over downstream
prices, Coca-Cola and PepsiCo could market their products at lower prices, giving the
firms greater flexibility to counter a decline in demand partly driven by substitution
to noncarbonated soft drinks.
3.2 Data
Our data come from three sources: the IRI Marketing Data Set (see Bronnenberg et al.
2008 for details), public documents produced by the FTC’s investigation of the PepsiCo
and Coca-Cola vertical mergers,11 and territory maps of the US bottling system in The
10See https://www.wsj.com/news/articles/SB10001424052748704240004575085871950146304 and https://www.wsj.com/articles/SB10001424052748704131404575117902451065876 for media coverage of the mergers.
11See https://www.ftc.gov/enforcement/cases-proceedings/091-0133/pepsico-inc-matter and https://www.ftc.gov/enforcement/cases-proceedings/101-0107/coca-cola-company-matter.
9
Coke System and The Pepsi System books by Beverage Digest (Stanford, 2016a,b).12
We use price and sales information at the store–week–product level for the years 2007
to 2012 from the IRI Marketing Data Set. We define a product as a brand–size com
bination (e.g., Diet Pepsi 20 oz bottle). In our analysis, we only include carbonated
beverage brands with at least 0.5 percent of the market and restrict attention to three
product sizes: the 20 and 67.6 oz bottles and the 144 oz box of cans. These sample
restrictions leave us with about 37 million store–week–product combinations which
comprise 35 brands and represent 61.4 percent of the total revenue in this time period
(or 60 percent of all units sold).
We use the Beverage Digest territory maps to identify the bottling territories of PBG,
PAS, and PYC in the case of PepsiCo, and CCE in the case of Coca-Cola. This
information is crucial to determine which counties were affected by vertical integration.
Lastly, from the FTC documents, we identify the counties where Dr Pepper, Crush,
and Schweppes were bottled by either PBG, PAS, or PYC (in the case of PepsiCo);
and the counties where Dr Pepper and Canada Dry were bottled by CCE (in the case
of Coca-Cola).
Table 1 presents summary statistics for the prices of the 105 products that are included
in our analysis.13 The table shows that the 20 and 67.6 oz products on average have
similar prices both between brands and within size, although the larger size generally
has greater within-product variance. The average price of the 144 ounce box of cans
is generally about three times larger than the average price of a 67.6 oz bottle, even
though the box of cans has only a little over two times the fluid capacity of the 67.6
oz bottle. This average price difference between the box of cans and the 67.6 oz
bottle likely reflects the extra convenience of the can format as well as potential cost
differences.
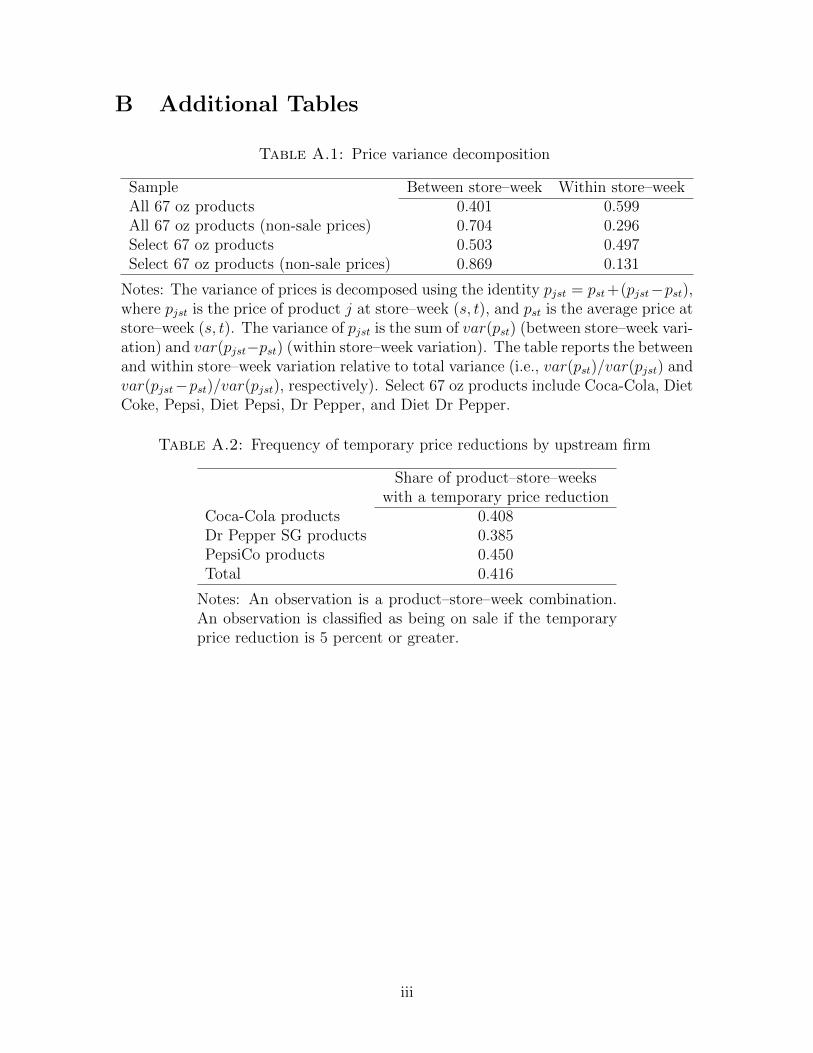
Table A.1 in the Online Appendix presents a decomposition of the variance of price.
The table shows that the within store–week price variation represents a significant
portion of the overall price variation, even when the analysis is restricted to close
substitutes sold at non-sale prices.14 For example, when restricting the analysis to 67
oz bottles of Coca-Cola, Diet Coke, Dr Pepper, Diet Dr Pepper, Pepsi, and Diet Pepsi
12See http://www.beverage-digest.com/systembooks for details. 13Variation in product availability across store–week combinations explains the differences in the
number of observations across products. 14We further discuss sale and non-sale prices in Section 5.2.
10

that were sold at non-sale prices, we find that 13.1 percent of the overall price variation
was within store–week variation.
Table 2 presents information about the territories that were affected by the vertical
integration of both Coca-Cola and PepsiCo. Panel A shows that of the 436 counties in
our data, 359 were served by CCE and 400 by PBG, PAS, or PYC (labeled PBG–PAS–
PYC in the table). That is, a majority of the counties in our sample were somehow
affected by vertical integration in 2010. 339 counties were served both by CCE in the
case of Coca-Cola and by PBG, PAS, or PYC in the case of PepsiCo. 81 were served
by at most one bottler that merged, while 16 counties were served by no bottlers that
merged.15 Panel B of Table 2 shows that about 29 percent of counties that were served
by CCE were counties where CCE also bottled and distributed Dr Pepper or Canada
Dry; whereas in 83 percent of the counties served by PBG, PAS, or PYC, the PepsiCo
bottler distributed Dr Pepper, Crush, or Schweppes.
4 Empirical Framework and Identification
How does vertical integration impact the prices of multiproduct firms? Is the Edgeworth-
Salinger effect economically significant? To answer these questions, we exploit the
within store–product variation in vertical structure that was caused by the vertical
mergers (e.g., product j in store s was bottled by an independent bottler before the
merger and then by a vertically-integrated bottler after the merger). This variation
allows us to compare the within-product price changes in places that were affected by
the vertical mergers with the within-product price changes in places unaffected by the
vertical mergers. Moreover, we exploit variation in whether the vertically-integrated
bottlers distributed Dr Pepper SG brands to measure the differential impact of vertical
integration on own and Dr Pepper SG brands (i.e., efficiency and Edgeworth-Salinger
effects, respectively). We use a generalized differences-in-differences research design
for our baseline analysis, and we conduct the analysis at the product–store–week level
(i.e., we study how the price of product j at store s and week w was impacted by
vertical integration).
To identify the effects of vertical integration on prices, a number of threats must be
15The small number of counties that were not impacted by vertical integration does not affect our ability to measure the Edgeworth-Salinger effect of vertical integration, which is the main focus of this study.
11

addressed. One concern is the existence of time effects that were specific to PepsiCo,
Coca-Cola, or Dr Pepper SG. For instance, some of these upstream firms may have
changed their advertising intensity or rebate policy at the time of the vertical mergers,
or may have experienced differential input cost shocks after the vertical mergers. We
exploit the panel structure of the data to tackle these concerns by allowing for up
stream firm-specific week fixed effects, φfirm(j),w, where firm(j) is the upstream firm
of product j. We also control for the store–product level advertising intensity reported
in the scanner data.16
A second concern is the existence of demand shocks concurrent with vertical mergers
in the counties where there was vertical integration. These shocks may have been
caused by weather changes, local festivities, or other factors. We address this concern
by exploiting the existence of multiple stores selling carbonated beverages in each
county–week combination, and allowing for county–week fixed effects, γw,county(s), where
county(s) is the county of store s.
Another concern is that vertical integration may have happened in markets where
PepsiCo and Coca-Cola enjoyed greater market power. We again exploit the panel
structure of the data to tackle this concern in two ways. First, we allow for product–
county–season-of-year fixed effects, δj,county(s),season(w), where season(w) is the season
of-the-year that corresponds to week w (e.g., fall or summer). These fixed effects
capture that the relative popularity of each product may have varied across markets
and throughout the season of the year. Second, we also control for store fixed effects,
λs, which capture how the local retail configuration affected market power.
A last concern is the existence of time varying factors that are specific to products
that started being bottled by vertically-integrated bottlers after the mergers. While
we address this possibility more formally when presenting estimates for a model that
allows for time-varying effects, we also use summary statistics to examine the existence
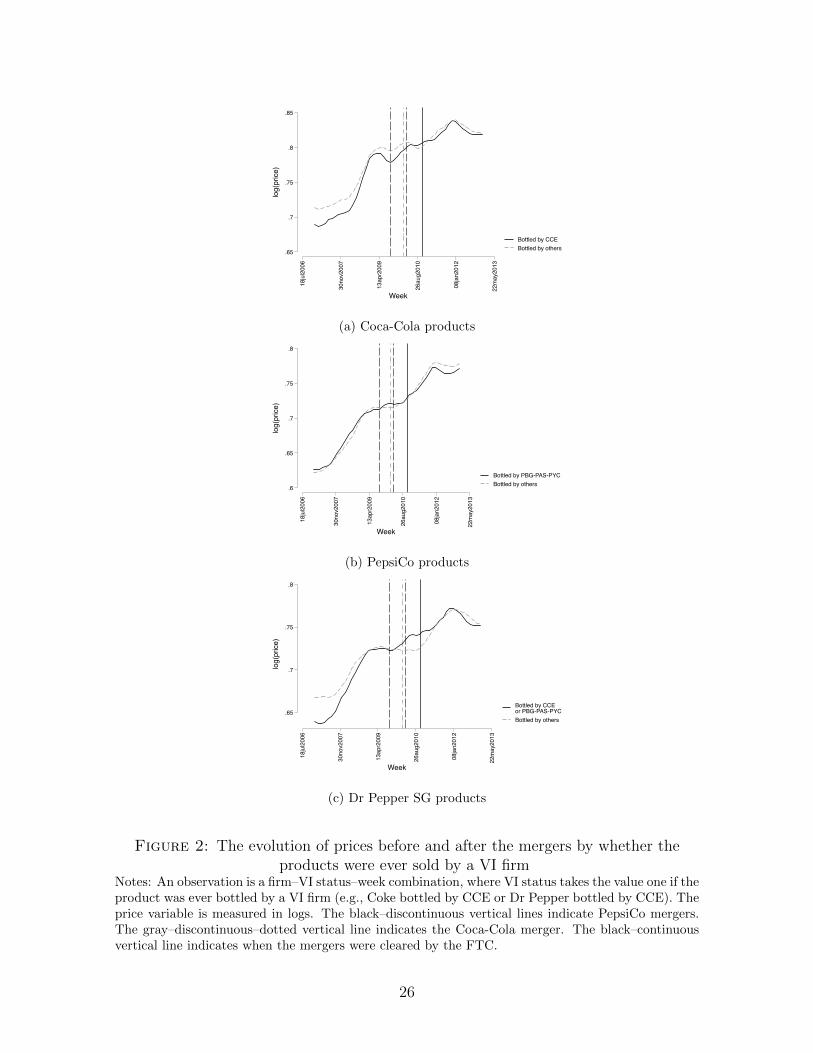
of differential trends before the vertical mergers. Figure 2 shows the evolution of the
average price both before and after the vertical mergers for Coca-Cola, PepsiCo, and
Dr Pepper SG products. The graphs distinguish between products that started being
bottled by vertically-integrated bottler after the mergers from those that were never
bottled by a vertically-integrated bottler. The figure shows no differential trends in
the year prior to the first vertical transaction. As mentioned previously, we reexamine
16The advertising intensity information in the scanner data correspond to the ordinal variables feature and display. We include indicators for the different values that these variables can take.
12

this issue when presenting our estimates.
With respect to possible confounders that we cannot directly address in the estima
tion, we first have that the vertical mergers could have increased the bargaining power
of the vertically-integrated bottlers. We note, however, that an increase in the bar
gaining power of the vertically-integrated firm (if anything) should have decreased the
price at which the vertically-integrated bottlers purchased inputs from Dr Pepper SG.
These lower input prices should have exerted a downward pressure on the prices of
Dr Pepper SG brands bottled by vertically-integrated bottlers, and would thus have
operated in the opposite direction of the Edgeworth-Salinger effect. This implies that
our estimates for the Edgeworth-Salinger effect may be biased downwards. Second, dif
ferential changes in rebate policies between areas with and without vertical integration
that took place at the same time as the vertical transactions would not be captured
by the set of fixed effects described above, and would be a cause of concern. However,
to our knowledge, changes in rebate policy of this type were not implemented.
To measure how vertical integration impacted prices in the carbonated soda industry,
we use a generalized differences-in-differences approach that takes into account the
threats that we just described. Specifically, we estimate
log(pricej,s,w) =V ICocaCola,county(s),w · CocaCola P roductj β1
+ V IP epsiCo,county(s),w · P epsiCo P roductj β2
+ V ICocaCola,county(s),w · DrPepperSGProductBottledBy CocaColaj β3
+ V IP epsiCo,county(s),w · DrPepperSGProductBottledBy PepsiCojβ4
+ λs + γw,county(s) + δj,county(s),season(w) + φfirm(j),w + εj,s,w, (1)
where V ICocaCola,county(s),w and V IP epsiCo,county(s),w are indicators for whether Coca-
Cola and PepsiCo were integrated with their bottlers in county county(s) at week
w; CocaCola P roductj and P epsiCo P roductj are indicators for whether product j is a
Coca-Cola or PepsiCo product, respectively; DrPepperSGProductBottledBy CocaColaj
and DrPepperSGProductBottledBy PepsiCoj are indicators for whether product j
was a Dr Pepper SG product bottled by a Coca-Cola or PepsiCo bottler (e.g., Dr
Pepper or Crush in some counties); and, εjsw is an error term clustered at the county
level.
The coefficients of interest in Equation 1 are β1, β2, β3, and β4. β1 and β2 measure how
the elimination of double margins affects prices of own brands (i.e., efficiency effect),
13

while the coefficients β3 and β4 measure how the elimination of own-brand double
margins affects prices of Dr Pepper SG brands bottled by the vertically-integrated
bottlers (i.e., the Edgeworth-Salinger effect). These effects must be interpreted relative
to products that were not impacted by vertical integration (conditional on a vector of
controls).
We also estimate a version of Equation 1 that allows us to measure the dynamics of
the impact of vertical integration on prices,
0u log(pricejsw) = V Ij×county(s) × 1{k quarters before time of VI}βk
k=−L
Uu + V Ij×county(s) × 1{k quarters after time of VI}βk
k=1
+ λs + γw×county(s) + δj×county(s)×season(w) + φfirm(j)×w + εjsw, (2)
where V Ij×county(s) is an indicator for whether product j in county county(s) was
eventually sold by a vertically-integrated bottler. The coefficients {βk} measure the
evolution of the prices of products that were eventually sold by a vertically-integrated
bottler relative to the prices of products that were never impacted by vertical inte
gration, both before and after vertical integration. Estimates for this model will also
allow us to statistically test for the existence of differential trends before the mergers
between products that started being bottled by a vertically-integrated bottler after the
mergers from those that never were.
5 Measuring the Impact of Vertical Integration on
Prices
To measure the impact of vertical integration on prices, we first present estimates for
several versions of Equation 1 in Table 3. The differences across columns are given
by parameter restrictions that we impose to decompose the price effects of vertical
integration. We then measure the impact of vertical integration on prices over time by
presenting estimates for Equation 2 in Figure 3.
In the first column of Table 3, we impose β = β1 = β2 = β3 = β4. With this restric
tion, β must be interpreted as the average impact of vertical integration on the prices
14

of all brands bottled by a vertically-integrated bottler (i.e., both own and Dr Pepper
SG brands). The estimates in Table 3 (Column 1) show that vertical integration on
average increased the prices of the products bottled by vertically-integrated bottlers by
1.8 percent relative to the prices of products bottled by bottlers that did not vertically
integrate. However, we note that these price effects are not quantity-weighted, which
implies that the average price paid by a consumer may have decreased as a consequence
of vertical integration, even though the average price increased. Regardless, this esti
mate suggests that vertical integration may have hurt some consumers in this industry,
and the Edgeworth-Salinger effect is economically relevant in this setting.
In the second column, we impose β1 = β2 and β3 = β4. These parameter restrictions al
low us to separately measure the impact of vertical integration on own brands (i.e., with
the coefficient β1 = β2) and Dr Pepper SG brands (i.e., with the coefficient β3 = β4).
The restrictions however do not allow for these effects to differ by firm. Table 3 (Col
umn 2) shows that vertical integration decreased the prices of Coca-Cola and PepsiCo
products that started being bottled by vertically-integrated bottlers on average by 1.4
percent after the vertical mergers. This effect is consistent with the downward pressure
on own-brand products caused by the elimination of the upstream margin for those
brands (i.e., efficiency effect). Column 2 also shows that vertical integration increased
the prices of Dr Pepper SG products bottled by either a vertically-integrated Coca-
Cola or PepsiCo bottler by an average of 3.9 percent. This second effect is consistent
with the Edgeworth-Salinger effect, which captures that the vertically-integrated firm
has an incentive to increase the prices of Dr Pepper SG brands to divert demand to the
brands that become more attractive to sell after vertical integration (i.e., own brands).
The results suggest that the Edgeworth-Salinger effect is large relative to the efficiency
effect, and economically relevant.
In the third column, we impose β1 = β3 and β2 = β4, which gives β1 and β3 the same
interpretation as in the first column but with the exception that the effects are allowed
to vary by whether the product is bottled by a Coca-Cola or PepsiCo bottler. That is,
β1 and β3 must be interpreted as the average effect of vertical integration on the prices
of own and Dr Pepper SG brands bottled by Coca-Cola and PepsiCo, respectively.
The decomposition of this effect in Table 3 (Column 3) shows that vertical integration
increased the prices of the products bottled by vertically-integrated Coca-Cola and
PepsiCo bottlers by an average of 1.8 to 1.9 percent, with no significant difference
across firms (p = 0.95).
15

Lastly, in the fourth column we relax all of the parameter restrictions and allow the
price effects to vary both by brand type (i.e., own or Dr Pepper SG brands) and
by upstream company (i.e., Coca-Cola or PepsiCo). The results in Table 3 (Column
4) suggest that vertical integration decreased the prices of Coca-Cola and PepsiCo
products bottled by vertically-integrated bottlers by an average of 1 and 2.1 percent,
respectively. The average increase in the prices of Dr Pepper SG products bottled
by a vertically-integrated Coca-Cola and PepsiCo bottler is measured to be 4.2 and
3.1 percent, respectively.17 These effects are consistent with the change in pricing
incentives caused by the partial vertical integration of multiproduct firms. On the one
hand, prices of own brands faced a downward pressure due to the elimination of double
margins (i.e., efficiency effect). On the other hand, prices of Dr Pepper SG brands
faced an upward pressure due to the incentive to divert demand to own brands (i.e.,
Edgeworth-Salinger effect). The estimates suggest that the Edgeworth-Salinger effect
is larger than the efficiency effect for both upstream firms.
To study both when the changes in the prices of products bottled by vertically-
integrated bottlers took place and whether there were differential trends before the
vertical mergers, we present estimates for Equation 2 in Figure 3, where we allow for
time-varying effects. Figure 3 resembles Table 3 (Column 1) in that the coefficients
must be interpreted as time-specific average price differences between prices of prod
ucts that were eventually sold by a vertically-integrated bottler (i.e., own or Dr Pepper
SG brands) and the prices of products that were never impacted by vertical integra
tion, both before and after vertical integration. The estimates suggest no evidence of
differential trends before the vertical mergers that were specific to products eventually
sold by a vertically-integrated bottler. This evidence suggests that the areas that were
not impacted by vertical integration are a good control group for the areas that were
impacted by vertical integration. The results also show that the price increases only
started after the first vertical transaction. In line with Table 3, the figure suggests
price increases caused by vertical integration of about 1 to 2 percent on average, and
price increases that were lasting.
In Table 4 we repeat the analysis presented in Table 3 but restrict the sample to
neighbor counties that were differentially impacted by vertical integration. That is,
neighbor counties X and Y are included in the subsample if i) they were both impacted
17We cannot reject that the coefficients measuring the effect of vertical integration on own brands are equal across firms (p = 0.13). We do however reject the hypothesis that the coefficients measuring the effect of vertical integration on Dr Pepper SG brands is the same across firms (p = 0.01).
16

by vertical integration but only one was exposed to the Edgeworth-Salinger effect, or
ii) only one was impacted by vertical integration. This restriction limits the sample
to 132 counties (out of 436 counties in the baseline analysis). This subsample analysis
allows us to compare within-product price changes in counties that are very similar
except for that they were differentially impacted by vertical integration. The estimates
remain unchanged, suggesting that our main results are not impacted by unobserved
heterogeneity across counties that is not captured by the set of fixed effects included
in our estimating equations.
In summary, we find that the vertical integration of the carbonated beverage industry
caused price increases for Dr Pepper SG products and price decreases for both Coca-
Cola and PepsiCo products bottled by vertically-integrated bottlers. These results are
consistent with manifestations of the efficiency and Edgeworth-Salinger effects of ver
tical integration, and suggest that the Edgeworth-Salinger effect is large relative to the
efficiency effect. Because the Edgeworth-Salinger effect works against efficiency gains,
these results suggest that the Edgeworth-Salinger effect is relevant for the evaluation
of vertical mergers.
5.1 Product-level Analysis
We repeat the analysis at the product level to study heterogeneous effects of vertical
integration. This exercise allows us to study whether the Edgeworth-Salinger effect
affected equally all of the Dr Pepper brands bottled by a vertically-integrated bottler.
To do this, we restrict the sample to those products that were exposed to vertical
integration in at least one county, and estimate
βjlog(pricej,s,w) = V Ibottler(j,s),w V I + λs + φw + εj,s,w ∀j, (3)
where V Ibottler(j,s),w is an indicator for whether product j at store s was bottled by a
vertically-integrated bottler at week w; and, λs and φw are store and week fixed effects,
respectively.
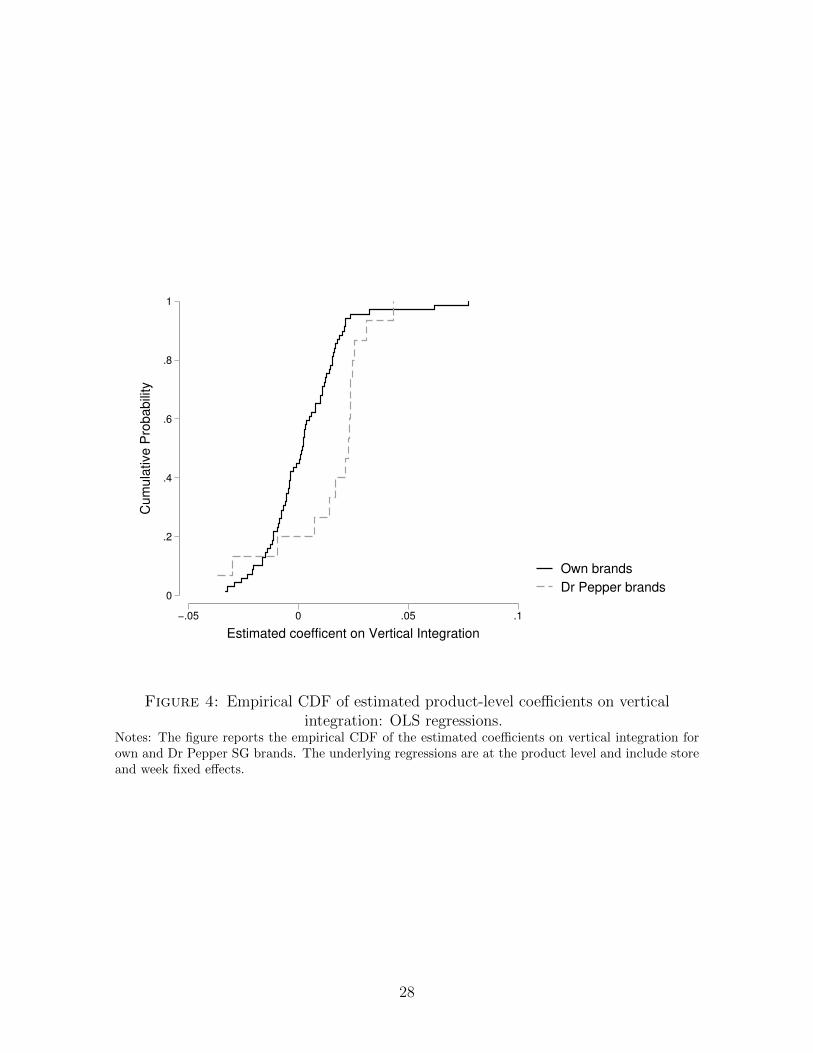
We report the CDF of the estimated coefficients on the vertical integration indicator in
Figure 4, where we categorize the coefficients by whether the product is an own or Dr
Pepper SG brand. The figure shows that the Edgeworth-Salinger effect impacted most
of the Dr Pepper brands bottled by a vertically-integrated bottler, as the distribution
17

is concentrated on positive values. On the other hand, the results for own brands are
mixed, with a distribution concentrated around zero, suggesting that the efficiency
gains of vertical integration were limited to a subset of the products owned by the
vertically-integrated firms.18
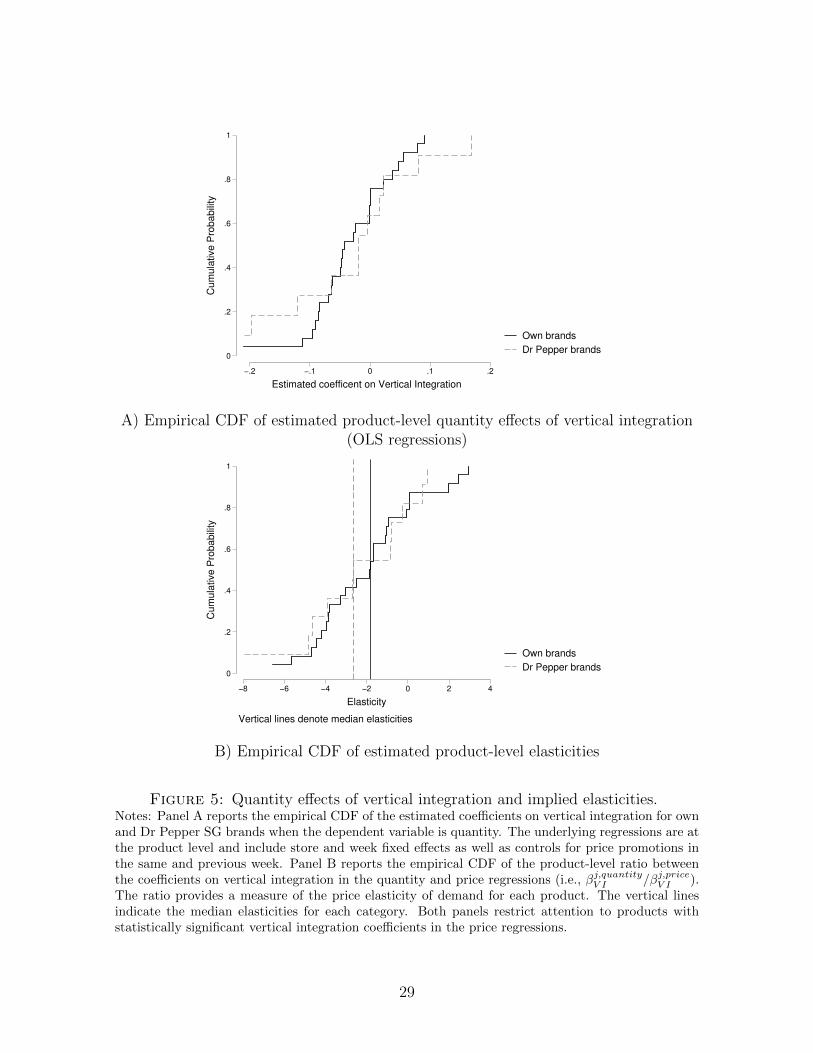
We also estimate a version of Equation 3 but with log(quantityj,s,w) as the dependent
variable, where quantityj,s,w is the number of units of product j sold at store s in
week w. We perform this exercise to assess whether the conjunction of price and
quantity changes caused by vertical integration are in line with elasticity estimates in
the literature. Figure 5 (Panel A) presents the distribution of product-level estimates
of the impact of vertical integration on quantity. These coefficients are more easily
interpreted when expressed as elasticities. That is, when each coefficient is divided by
the corresponding product-level coefficient measuring the impact of vertical integration
on price. Figure 5 (Panel B) presents the empirical distribution of these elasticities,
and shows median product-level price elasticities of -1.82 and -2.66 for brands owned
by vertically-integrated bottlers and Dr Pepper brands bottled by vertically-integrated
bottlers, respectively. These values are similar to the elasticities reported in Dube
(2004), Patel (2012), and Hendel and Nevo (2013).
5.2 Regular and Sale Price Analysis
Previous research has documented the prevalence of temporary price reductions in a
number of categories of consumer packaged goods, with prices alternating between a
“regular” and a “sale” price (see, for instance, Pesendorfer 2002, Hendel and Nevo 2006,
2013). This opens the question of whether the regular and sale price of each product
in our sample were equally impacted by vertical integration. We address this question
by using a variable in our dataset that indicates temporary reductions in the prices of
products of at least 5 percent. This variable is defined at the product–store–week level,
and we use it as our measure of “sale.” Table A.2 in the Online Appendix presents
summary statistics for the sale indicator, and shows that there were temporary price
reductions in 41.6 percent of the product–store–week combinations in our data.
In Table 5 we present estimates of our main estimating equation restricting to the
product–store–week combinations that were not on sale (column 1), and the product–
18The price increases for some of the own brands can be explained by the interaction between price complementarities and the Edgeworth-Salinger effect.
18
store–week combinations that were on sale (column 2). Table 5 (Column 1) shows
that vertical integration caused a 1.8 percent decrease in the regular price of products
owned by a vertically-integrated bottler, and a 5.2 percent increase in the regular price
of Dr Pepper SG products bottled by a vertically-integrated bottler. Table 5 (Column
2) shows similar results for the sale price, although the magnitudes are smaller in
absolute value. We conclude that the Edgeworth-Salinger effect of vertical integration
impacted both the sale and regular prices.
5.3 Additional Exercises
We report the results of additional exercises in the Online Appendix. In the analysis
we have presented so far, we define the post-merger period from the moment when the
transactions took place. In Table A.3, we replicate Table 3 redefining the post-merger
period to start from the moment when the FTC cleared the vertical mergers. The
results remain unchanged. In Table A.4, we progressively vary the set of fixed effects
that we include in Table 3. The table shows that the Edgeworth-Salinger effect remains
larger than the efficiency effect across all of the specifications. In Table A.5, we restrict
the analysis to areas where the Coca-Cola and PepsiCo bottlers did not bottle Dr
Pepper Co brands (i.e., areas not exposed to the Edgeworth-Salinger effect), and we
find that the effect of vertical integration on the prices of own brands was larger than
when using the full sample. These results suggest that even if welfare gains exist, these
are mitigated by the Edgeworth-Salinger effect since prices are strategic complements.
Lastly, we discuss clustering of standard errors in Section C of the Online Appendix.
5.4 Alternative Hypotheses
Though the results that we have presented in this paper are consistent with the effi
ciency and Edgeworth-Salinger effects of vertical integration, there might be alternative
hypotheses able to explain these findings. In what follows we discuss three alternative
hypotheses and argue why these cannot explain our results.
A first alternative hypothesis is that market foreclosure caused the increase in the prices
of Dr Pepper SG brands sold by a vertically-integrated bottler. Two facts rule this
out. First, the pricing incentives of the vertically-integrated bottlers did not change
other than through the elimination of double marginalization. That is, the ability and
19
incentives of the integrated bottlers to limit Dr Pepper SG’s access to consumers did
not change with the vertical mergers (see Section 2). Second, the decision of Coca-Cola
and PepsiCo to acquire licenses to continue selling Dr Pepper SG brands suggests that
the vertically-integrated bottlers had no incentives to limit Dr Pepper SG’s access to
consumers (see Section 3.1).
A second alternative hypothesis is that capacity constraints might have played a role.
The efficiency effect of vertical integration—and the corresponding decrease in the
prices of own brands—led to an increase in the demand for brands owned by a vertically-
integrated bottler. A capacity constrained bottler may have chosen to reduce produc
tion of Dr Pepper SG products in order to liberate capacity to increase the production
of own brands and meet the higher demand for own brands. One way of reducing the
quantity of Dr Pepper SG products is by increasing the prices of these products. In
principle, these changes in prices would be consistent with those that we have reported
above. However, the demand for carbonated beverages is seasonal, making us expect
that the bottlers would only be constrained in some months of the year. Figure 3
suggests that the price increases are uniform across seasons, making the constrained
capacity explanation unlikely.
A last alternative hypothesis is that our results are explained by a post-merger increase
in the frequency of temporary price reductions that was specific to Dr Pepper SG
products that were not bottled by a vertically-integrated bottler. We address this
possibility in Table 5 (Column 4), where we measure the impact of vertical integration
on the frequency of sales. The table shows that vertical integration caused an increase
in temporary price reductions of Dr Pepper SG products that were bottled by vertically-
integrated bottlers, which rules out this alternative hypothesis.
6 Discussion
Measuring the impact of vertical integration on prices has attracted the attention of
economists because of its implications for competition policy. While most empirical
research has focused on the tension between the elimination of double marginalization
and market foreclosure, we evaluate a third mechanism that arises with multiproduct
firms. When integrating with a supplier, vertical integration may eliminate double
margins for only a subset of the products of the downstream firm. The products with
20

eliminated double margins become relatively more profitable to sell, which gives the
multiproduct firm incentives to divert demand towards these by increasing the prices
of the products for which double marginalization was not eliminated. We evaluate this
mechanism by studying vertical mergers between The Coca Cola Company, PepsiCo,
and their main bottlers, which only eliminated double margins for the brands owned
by these companies.
We find that the vertical integration of The Coca Cola Company and PepsiCo on
average increased the prices of products sold by these firms, and the price increase
was driven by the prices of Dr Pepper SG brands bottled by the integrated firms for
which double marginalization was not eliminated. These results show that eliminating
double marginalization may potentially hurt consumers in multiproduct industries—or
at least mitigate potential benefits—and thus suggest caution when evaluating vertical
mergers in these industries.
References
Asker, John (2016) “Diagnosing Foreclosure due to Exclusive Dealing,” The Journal
of Industrial Economics, Vol. 64, pp. 375–410.
Atalay, Enghin, Ali Hortacsu, and Chad Syverson (2014) “Vertical integration and
input flows,” The American Economic Review, Vol. 104, pp. 1120–1148.
Bolton, Patrick and Michael D Whinston (1991) “The “Foreclosure” Effects of Vertical
Mergers,” Journal of Institutional and Theoretical Economics (JITE)/Zeitschrift fur
die gesamte Staatswissenschaft, Vol. 147, pp. 207–226.
Bronnenberg, Bart J, Michael W Kruger, and Carl F Mela (2008) “Database Paper-The
IRI Marketing Data Set,” Marketing Science, Vol. 27, pp. 745–748.
Chen, Yongmin (2001) “On Vertical Mergers and their Competitive Effects,” RAND
Journal of Economics, pp. 667–685.
Chipty, Tasneem (2001) “Vertical Integration, Market Foreclosure, and Consumer Wel
fare in the Cable Television Industry,” American Economic Review, pp. 428–453.
Choi, Jay Pil and Sang-Seung Yi (2000) “Vertical Foreclosure with the Choice of Input
Specifications,” RAND Journal of Economics, pp. 717–743.
21

Crawford, Gregory S, Robin S Lee, Michael D Whinston, and Ali Yurukoglu (2015)
“The Welfare Effects of Vertical Integration in Multichannel Television Markets.”
Dube, Jean-Pierre (2004) “Multiple discreteness and product differentiation: Demand
for carbonated soft drinks,” Marketing Science, Vol. 23, pp. 66–81.
Edgeworth, F (1925) “The Theory of Pure Monopoly,” Papers Relating to Political
Economy, Vol. 1.
Federal Trade Commission (2010a) “United States of America vs. PepsiCo, Inc.,” .
(2010b) “United States of America vs. The Coca Cola Company,” .
Hart, Oliver, Jean Tirole, Dennis W Carlton, and Oliver E Williamson (1990) “Ver
tical Integration and Market Foreclosure,” Brookings Papers on Economic Activity.
Microeconomics, Vol. 1990, pp. 205–286.
Hastings, Justine S and Richard J Gilbert (2005) “Market Power, Vertical Integration
and the Wholesale Price of Gasoline,” The Journal of Industrial Economics, Vol. 53,
pp. 469–492.
Hendel, Igal and Aviv Nevo (2006) “Sales and consumer inventory,” The RAND Jour
nal of Economics, Vol. 37, pp. 543–561.
(2013) “Intertemporal Price Discrimination in Storable Goods Markets,”
American Economic Review, Vol. 103, pp. 2722–51.
Hortacsu, Ali and Chad Syverson (2007) “Cementing Relationships: Vertical Integra
tion, Foreclosure, Productivity, and Prices,” Journal of Political Economy, Vol. 115,
pp. 250–301.
Hotelling, HH (1932) “Edgeworth’s Paradox of Taxation and the Nature of Supply and
Demand Functions’,” Journal of Political Economy, Vol. 40, pp. 577–615.
Houde, Jean-Francois (2012) “Spatial differentiation and vertical mergers in retail mar
kets for gasoline,” The American Economic Review, Vol. 102, pp. 2147–2182.
Lafontaine, Francine and Margaret Slade (2007) “Vertical Integration and Firm Bound
aries: The Evidence,” Journal of Economic Literature, Vol. 45, pp. 629–685.
Lee, Robin S (2013) “Vertical integration and exclusivity in platform and two-sided
markets,” The American Economic Review, Vol. 103, pp. 2960–3000.
22

Mortimer, Julie H (2008) “Vertical contracts in the video rental industry,” The Review
of Economic Studies, Vol. 75, pp. 165–199.
Motta, Massimo (2004) Competition policy: theory and practice: Cambridge University
Press.
Ordover, Janusz A, Garth Saloner, and Steven C Salop (1990) “Equilibrium Vertical
Foreclosure,” The American Economic Review, pp. 127–142.
Patel, Ketan (2012) “Essays in Industrial Organization.”
PepsiAmericas, Inc. (2009) “Annual report,” .
Perry, Martin K (1989) “Vertical Integration: Determinants and Effects,” Handbook of
industrial organization, Vol. 1, pp. 183–255.
Pesendorfer, Martin (2002) “Retail sales: A study of pricing behavior in supermarkets,”
The Journal of Business, Vol. 75, pp. 33–66.
Reiffen, David (1992) “Equilibrium Vertical Foreclosure: Comment,” The American
Economic Review, Vol. 82, pp. 694–697.
Riordan, Michael H (1998) “Anticompetitive Vertical Integration by a Dominant
Firm,” American Economic Review, pp. 1232–1248.
Riordan, Michael H and Steven C Salop (1995) “Evaluating Vertical Mergers: A Post-
Chicago Approach,” Antitrust Law Journal, Vol. 63, pp. 513–568.
Salinger, Michael A (1988) “Vertical Mergers and Market Foreclosure,” The Quarterly
Journal of Economics, pp. 345–356.
(1991) “Vertical Mergers in Multi-product Industries and Edgeworth’s Para
dox of Taxation,” The Journal of Industrial Economics, pp. 545–556.
Stanford, Duane ed. (2016a) The Coke System: Detailed Territory Information, Own
ership and Contacts: Beverage Digest.
ed. (2016b) The Pepsi System: Detailed Territory Information, Ownership
and Contacts: Beverage Digest.
The Coca Cola Company (2009) “Annual report,” .
The Pepsi Bottling Group, Inc. (2009) “Annual report,” .
23

Villas-Boas, Sofia Berto (2007) “Vertical relationships between manufacturers and re
tailers: Inference with limited data,” The Review of Economic Studies, Vol. 74, pp.
625–652.
24
Tables and Figures
U1 U2 U1 U2
Downstream
Consumers
Product 1(p1) Product 2(p2)
I c1 c2 c1 = 0 < c1 c2
Downstream
Consumers
I
1 < p1) Product 2(p I
Product 1(p 2 > p2)
(a) Before vertical integration (b) After vertical integration
Figure 1: Illustrating the Edgeworth-Salinger Effect Notes: The figure presents an example that illustrates the Edgeworth-Salinger effect. Figure 1a shows a downstream firm that produces Product 1 and Product 2 using inputs purchased from the upstream firms U1 and U2 at prices c1 and c2. Figure 1b illustrates what happens if the downstream firm integrates with the upstream firm U1. Specifically, in the example, the input price c1 decreases to zero, the assumed marginal cost for U1. Because of this, Product 1 faces a downward pressure on its price. This is the efficiency gain associated with the elimination of double marginalization. At the same time, this makes Product 1 relatively more profitable to sell, inducing the downstream firm to increase the price of Product 2 to divert demand to Product 1. This is the Edgeworth-Salinger effect.
25
.65
.7
.75
.8
.85
log(
pric
e)
18ju
l200
6
30no
v200
7
13ap
r200
9
26au
g201
0
08ja
n201
2
22m
ay20
13
Week
Bottled by CCEBottled by others
(a) Coca-Cola products
.6
.65
.7
.75
.8
log(
pric
e)
18ju
l200
6
30no
v200
7
13ap
r200
9
26au
g201
0
08ja
n201
2
22m
ay20
13
Week
Bottled by PBG-PAS-PYCBottled by others
(b) PepsiCo products
.65
.7
.75
.8
log(
pric
e)
18ju
l200
6
30no
v200
7
13ap
r200
9
26au
g201
0
08ja
n201
2
22m
ay20
13
Week
Bottled by CCEor PBG-PAS-PYCBottled by others
(c) Dr Pepper SG products
Figure 2: The evolution of prices before and after the mergers by whether the products were ever sold by a VI firm
Notes: An observation is a firm–VI status–week combination, where VI status takes the value one if the product was ever bottled by a VI firm (e.g., Coke bottled by CCE or Dr Pepper bottled by CCE). The price variable is measured in logs. The black–discontinuous vertical lines indicate PepsiCo mergers. The gray–discontinuous–dotted vertical line indicates the Coca-Cola merger. The black–continuous vertical line indicates when the mergers were cleared by the FTC.
26

-.01
0.0
1.0
2.0
3.0
4P
rice
coef
ficie
nts
Q1/08 Q2/09 Q3/11
Figure 3: The dynamics of the impact of vertical integration on prices: OLS regressions.
Notes: Standard errors clustered at the county level. The figure reports estimates for five quarters before the first transaction (i.e., Q3/2009) and five quarter after the last transaction (i.e., Q2/2010) as well as 95 percent confidence intervals. The coefficient for Q2/2009 is normalized to zero. All specifications include controls for feature and display as well as county–week, firm–week, and product– county–season-of-year fixed effects.
27
0
.2
.4
.6
.8
1
Cum
ula
tive P
robabili
ty
−.05 0 .05 .1
Estimated coefficent on Vertical Integration
Own brands
Dr Pepper brands
Figure 4: Empirical CDF of estimated product-level coefficients on vertical integration: OLS regressions.
Notes: The figure reports the empirical CDF of the estimated coefficients on vertical integration for own and Dr Pepper SG brands. The underlying regressions are at the product level and include store and week fixed effects.
28
0
.2
.4
.6
.8
1
Cu
mu
lative
Pro
ba
bili
ty
−.2 −.1 0 .1 .2
Estimated coefficent on Vertical Integration
Own brands
Dr Pepper brands
A) Empirical CDF of estimated product-level quantity effects of vertical integration (OLS regressions)
0
.2
.4
.6
.8
1
Cu
mu
lative
Pro
ba
bili
ty
−8 −6 −4 −2 0 2 4
Elasticity
Own brands
Dr Pepper brands
Vertical lines denote median elasticities
B) Empirical CDF of estimated product-level elasticities
Figure 5: Quantity effects of vertical integration and implied elasticities. Notes: Panel A reports the empirical CDF of the estimated coefficients on vertical integration for own and Dr Pepper SG brands when the dependent variable is quantity. The underlying regressions are at the product level and include store and week fixed effects as well as controls for price promotions in the same and previous week. Panel B reports the empirical CDF of the product-level ratio between
j,quantity j,price the coefficients on vertical integration in the quantity and price regressions (i.e., β /β ).V I V I The ratio provides a measure of the price elasticity of demand for each product. The vertical lines indicate the median elasticities for each category. Both panels restrict attention to products with statistically significant vertical integration coefficients in the price regressions.
29
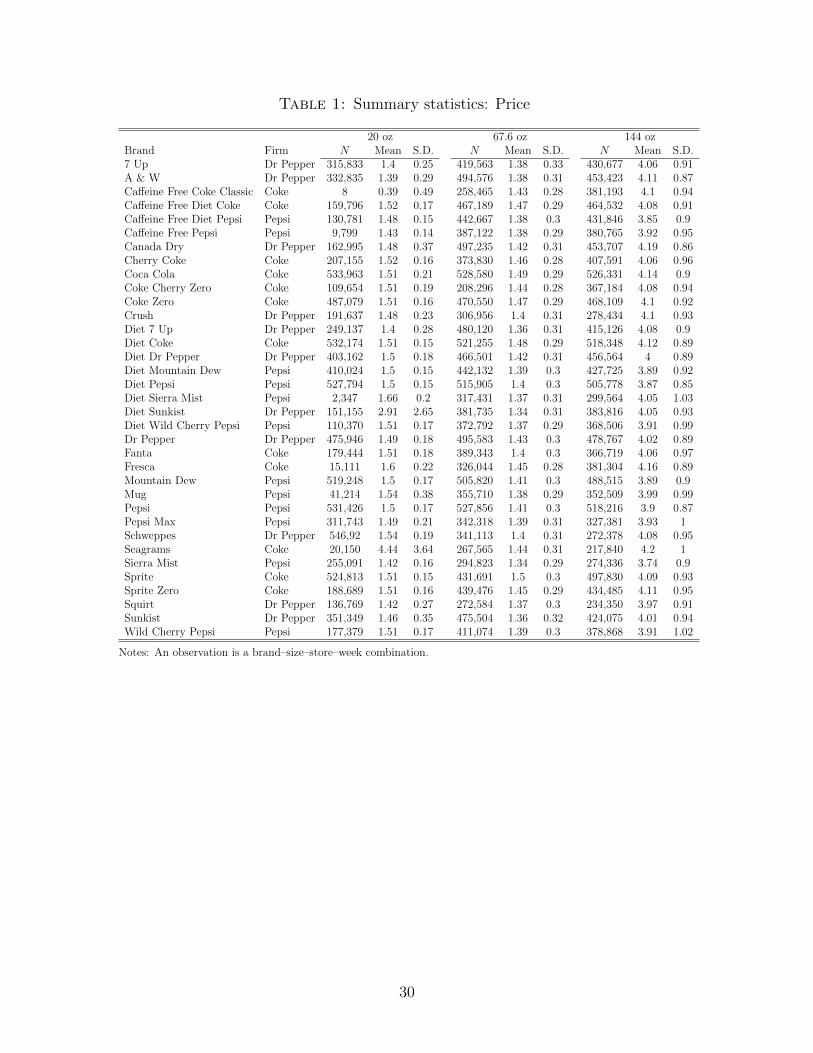
Table 1: Summary statistics: Price
20 oz 67.6 oz 144 oz Brand Firm N Mean S.D. N Mean S.D. N Mean S.D. 7 Up Dr Pepper 315,833 1.4 0.25 419,563 1.38 0.33 430,677 4.06 0.91 A & W Dr Pepper 332,835 1.39 0.29 494,576 1.38 0.31 453,423 4.11 0.87 Caffeine Free Coke Classic Coke 8 0.39 0.49 258,465 1.43 0.28 381,193 4.1 0.94 Caffeine Free Diet Coke Coke 159,796 1.52 0.17 467,189 1.47 0.29 464,532 4.08 0.91 Caffeine Free Diet Pepsi Pepsi 130,781 1.48 0.15 442,667 1.38 0.3 431,846 3.85 0.9 Caffeine Free Pepsi Pepsi 9,799 1.43 0.14 387,122 1.38 0.29 380,765 3.92 0.95 Canada Dry Dr Pepper 162,995 1.48 0.37 497,235 1.42 0.31 453,707 4.19 0.86 Cherry Coke Coke 207,155 1.52 0.16 373,830 1.46 0.28 407,591 4.06 0.96 Coca Cola Coke 533,963 1.51 0.21 528,580 1.49 0.29 526,331 4.14 0.9 Coke Cherry Zero Coke 109,654 1.51 0.19 208,296 1.44 0.28 367,184 4.08 0.94 Coke Zero Coke 487,079 1.51 0.16 470,550 1.47 0.29 468,109 4.1 0.92 Crush Dr Pepper 191,637 1.48 0.23 306,956 1.4 0.31 278,434 4.1 0.93 Diet 7 Up Dr Pepper 249,137 1.4 0.28 480,120 1.36 0.31 415,126 4.08 0.9 Diet Coke Coke 532,174 1.51 0.15 521,255 1.48 0.29 518,348 4.12 0.89 Diet Dr Pepper Dr Pepper 403,162 1.5 0.18 466,501 1.42 0.31 456,564 4 0.89 Diet Mountain Dew Pepsi 410,024 1.5 0.15 442,132 1.39 0.3 427,725 3.89 0.92 Diet Pepsi Pepsi 527,794 1.5 0.15 515,905 1.4 0.3 505,778 3.87 0.85 Diet Sierra Mist Pepsi 2,347 1.66 0.2 317,431 1.37 0.31 299,564 4.05 1.03 Diet Sunkist Dr Pepper 151,155 2.91 2.65 381,735 1.34 0.31 383,816 4.05 0.93 Diet Wild Cherry Pepsi Pepsi 110,370 1.51 0.17 372,792 1.37 0.29 368,506 3.91 0.99 Dr Pepper Dr Pepper 475,946 1.49 0.18 495,583 1.43 0.3 478,767 4.02 0.89 Fanta Coke 179,444 1.51 0.18 389,343 1.4 0.3 366,719 4.06 0.97 Fresca Coke 15,111 1.6 0.22 326,044 1.45 0.28 381,304 4.16 0.89 Mountain Dew Pepsi 519,248 1.5 0.17 505,820 1.41 0.3 488,515 3.89 0.9 Mug Pepsi 41,214 1.54 0.38 355,710 1.38 0.29 352,509 3.99 0.99 Pepsi Pepsi 531,426 1.5 0.17 527,856 1.41 0.3 518,216 3.9 0.87 Pepsi Max Pepsi 311,743 1.49 0.21 342,318 1.39 0.31 327,381 3.93 1 Schweppes Dr Pepper 546,92 1.54 0.19 341,113 1.4 0.31 272,378 4.08 0.95 Seagrams Coke 20,150 4.44 3.64 267,565 1.44 0.31 217,840 4.2 1 Sierra Mist Pepsi 255,091 1.42 0.16 294,823 1.34 0.29 274,336 3.74 0.9 Sprite Coke 524,813 1.51 0.15 431,691 1.5 0.3 497,830 4.09 0.93 Sprite Zero Coke 188,689 1.51 0.16 439,476 1.45 0.29 434,485 4.11 0.95 Squirt Dr Pepper 136,769 1.42 0.27 272,584 1.37 0.3 234,350 3.97 0.91 Sunkist Dr Pepper 351,349 1.46 0.35 475,504 1.36 0.32 424,075 4.01 0.94 Wild Cherry Pepsi Pepsi 177,379 1.51 0.17 411,074 1.39 0.3 378,868 3.91 1.02
Notes: An observation is a brand–size–store–week combination.
30

Table 2: Summary statistics: Vertical structure
Panel A: Counties where PBG–PAS–PYC and CCE bottled PepsiCo and Coca-Cola products, respectively
Other Pepsi bottler PBG–PAS–PYC Total counties Other Coca-Cola bottler 16 61 77 CCE 20 339 359 Total counties 36 400 436
Panel B: Counties where PBG–PAS–PYC and CCE bottled Dr Pepper SG products
Bottled Dr Pepper SG products Total counties No Yes
CCE 256 103 359 PBG–PAS–PYC 67 333 400
Notes: An observation is a county. A county is labeled as PBG–PAS–PYC if PBG, PAS, or PYC bottled PepsiCo products in the county before vertical integration. A county is labeled as CCE if CCE bottled Coca-Cola products in the county before vertical integration.
31

Table 3: The effect of vertical integration on prices: OLS regressions.
(1) (2) (3) (4) log(price)
V I · Own or Dr Pepper SG product 0.018*** bottled by Coca-Cola or PepsiCo bottler (0.003)
V I · Own product -0.014*** bottled by Coca-Cola or PepsiCo bottler (0.003)
V I · Dr Pepper SG product 0.039*** bottled by Coca-Cola or PepsiCo bottler (0.002)
V I · Own or Dr Pepper SG product 0.019*** bottled by Coca-Cola bottler (0.004)
V I · Own or Dr Pepper SG product 0.018*** bottled by PepsiCo bottler (0.004)
V ICocaCola · Coca-Cola product -0.010*** (0.004)
V ICocaCola · Dr Pepper SG product 0.042** bottled by Coca-Cola bottler (0.004)
V IP epsiCo · PepsiCo product -0.021*** (0.006)
V IP epsiCo · Dr Pepper SG product 0.031*** bottled by PepsiCo bottler (0.003)
Observations 37,106,025 37,106,025 37,106,025 37,106,025 R2 0.893 0.893 0.893 0.893 Prod × County × Season-of-year FE Yes Yes Yes Yes Week × County FE Yes Yes Yes Yes Week × Firm FE Yes Yes Yes Yes Store FE Yes Yes Yes Yes
Notes: Standard errors clustered at the county level (436 clusters) in parentheses. * p < 0.1, ** p < 0.05, *** p < 0.01. All specifications include controls for feature and display. Post-merger period starts at transaction times.
32
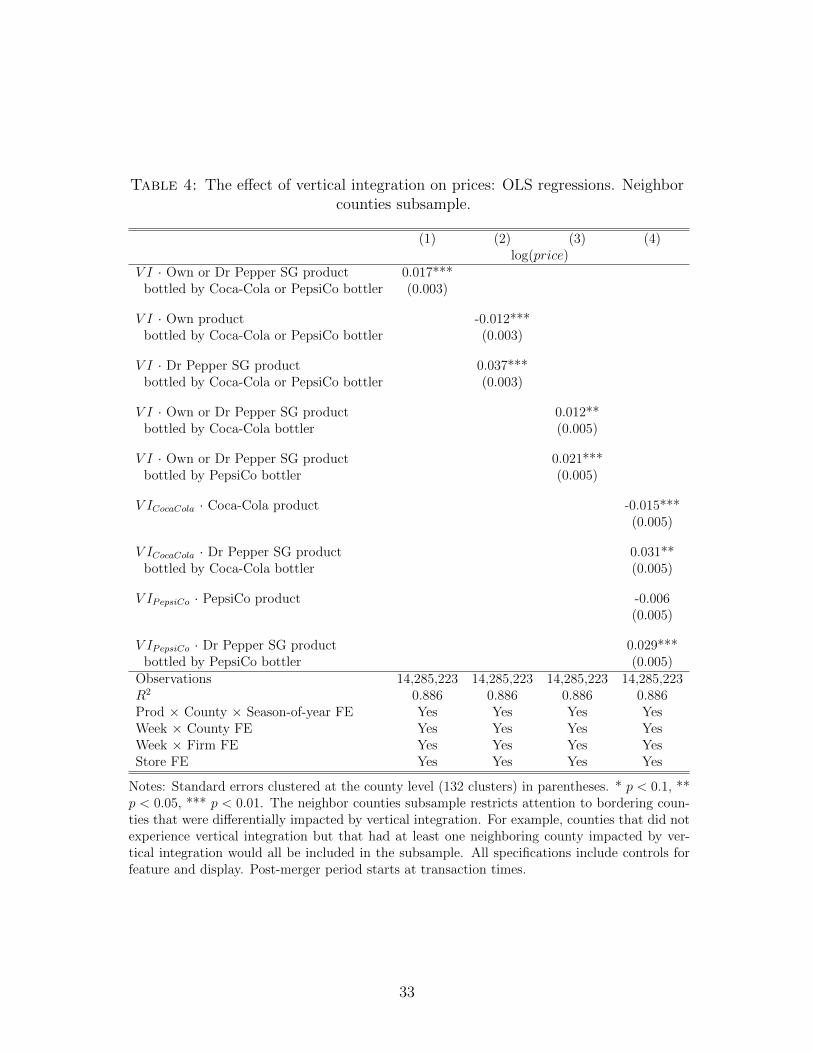
Table 4: The effect of vertical integration on prices: OLS regressions. Neighbor counties subsample.
(1) (2) (3) (4) log(price)
V I · Own or Dr Pepper SG product 0.017*** bottled by Coca-Cola or PepsiCo bottler (0.003)
V I · Own product -0.012*** bottled by Coca-Cola or PepsiCo bottler (0.003)
V I · Dr Pepper SG product 0.037*** bottled by Coca-Cola or PepsiCo bottler (0.003)
V I · Own or Dr Pepper SG product 0.012** bottled by Coca-Cola bottler (0.005)
V I · Own or Dr Pepper SG product 0.021*** bottled by PepsiCo bottler (0.005)
V ICocaCola · Coca-Cola product -0.015*** (0.005)
V ICocaCola · Dr Pepper SG product 0.031** bottled by Coca-Cola bottler (0.005)
V IP epsiCo · PepsiCo product -0.006 (0.005)
V IP epsiCo · Dr Pepper SG product 0.029*** bottled by PepsiCo bottler (0.005)
Observations 14,285,223 14,285,223 14,285,223 14,285,223 R2 0.886 0.886 0.886 0.886 Prod × County × Season-of-year FE Yes Yes Yes Yes Week × County FE Yes Yes Yes Yes Week × Firm FE Yes Yes Yes Yes Store FE Yes Yes Yes Yes
Notes: Standard errors clustered at the county level (132 clusters) in parentheses. * p < 0.1, ** p < 0.05, *** p < 0.01. The neighbor counties subsample restricts attention to bordering counties that were differentially impacted by vertical integration. For example, counties that did not experience vertical integration but that had at least one neighboring county impacted by vertical integration would all be included in the subsample. All specifications include controls for feature and display. Post-merger period starts at transaction times.
33

Table 5: The effect of vertical integration on prices: OLS regressions. Regular/sale price analysis.
(1) (2) (3) (4) log(price) Sale indicator
Regular Price Sale Price
V I · Own product Subsample -0.018∗∗∗
Subsample -0.013∗∗∗
Full Sample -0.014∗∗∗
Full Sample -0.006
bottled by Coca-Cola or PepsiCo bottler (0.003) (0.003) (0.003) (0.005)
V I · Dr Pepper SG product 0.052∗∗∗ 0.026∗∗∗ 0.039∗∗∗ 0.009∗∗
bottled by Coca-Cola or PepsiCo bottler (0.003) (0.003) (0.002) (0.003) Observations 21,679,165 15,422,052 37,106,025 37,124,313 R2 0.935 0.921 0.893 0.383 Prod × County × Season-of-year FE Yes Yes Yes Yes Week × County FE Yes Yes Yes Yes Week × Firm FE Yes Yes Yes Yes Store FE Yes Yes Yes Yes
Notes: Standard errors clustered at the county level (436 clusters) in parentheses. * p < 0.1, ** p < 0.05, *** p < 0.01. All specifications include controls for feature and display. Post-merger period starts at transaction times. The sale price subsample (regular price subsample) includes product–store–week combinations for which the product was (was not) being sold at a reduced price, i.e., the pr variable in the IRI dataset (Bronnenberg et al., 2008). Sale indicator takes the value when there was a temporary reduction in the price of a product of 5 percent or greater (i.e., pr variable). The sale indicator is defined at the product–store–week level.
34

Online Appendix: Not For Publication
Vertical Integration with Multiproduct Firms:
When Eliminating Double Marginalization May
Hurt Consumers
Fernando Luco and Guillermo Marshall

A FTC’s Complaints and Decision Orders
The FTC reviewed the transactions in 2010 and cleared them in October and Novem
ber of that year subject to some behavioral remedies. The FTC’s main concerns were
related to Coca-Cola and PepsiCo having access to confidential information provided
by Dr Pepper SG to the vertically-integrated bottlers. In particular, the FTC argued
that the agreements between Coca-Cola/PepsiCo and Dr Pepper SG could lessen com
petition because, first, they could eliminate competition between Coca-Cola/PepsiCO
and Dr Pepper SG; second, they could increase the likelihood of unilateral exercise of
market power by Coca-Cola and PepsiCo; and third, they could facilitate coordinated
interaction. That is, the concerns raised by the FTC were based on potential violations
of Section 5 of the FTC Act and Section 7 of the Clayton Act. The FTC did not raise
arguments related to the Edgeworth-Salinger effect.
The remedies imposed by the FTC included, among others, that Coca-Cola/PepsiCo
employees that would gain access to confidential information had to be “firewalled,”
could only participate in the bottling process, and could not receive bonuses or benefits
incentivizing them to increase sales of own brands relative to Dr Pepper SG brands.
ii
B Additional Tables
Table A.1: Price variance decomposition
Sample Between store–week Within store–week All 67 oz products 0.401 0.599 All 67 oz products (non-sale prices) 0.704 0.296 Select 67 oz products 0.503 0.497 Select 67 oz products (non-sale prices) 0.869 0.131
Notes: The variance of prices is decomposed using the identity pjst = pst +(pjst −pst), where pjst is the price of product j at store–week (s, t), and pst is the average price at store–week (s, t). The variance of pjst is the sum of var(pst) (between store–week variation) and var(pjst−pst) (within store–week variation). The table reports the between and within store–week variation relative to total variance (i.e., var(pst)/var(pjst) and var(pjst −pst)/var(pjst), respectively). Select 67 oz products include Coca-Cola, Diet Coke, Pepsi, Diet Pepsi, Dr Pepper, and Diet Dr Pepper.
Table A.2: Frequency of temporary price reductions by upstream firm
Share of product–store–weeks with a temporary price reduction
Coca-Cola products 0.408 Dr Pepper SG products 0.385 PepsiCo products 0.450 Total 0.416
Notes: An observation is a product–store–week combination. An observation is classified as being on sale if the temporary price reduction is 5 percent or greater.
iii

Table A.3: The effect of vertical integration on prices: OLS regressions. Post-merger period starts after regulatory clearance.
(1) (2) (3) (4) log(price)
V I · Own or Dr Pepper SG product 0.016*** bottled by Coca-Cola or PepsiCo bottler (0.002)
V I · Own product -0.007*** bottled by Coca-Cola or PepsiCo bottler (0.003)
V I · Dr Pepper SG product 0.030*** bottled by Coca-Cola or PepsiCo bottler (0.002)
V I · Own or Dr Pepper SG product 0.016*** bottled by Coca-Cola bottler (0.004)
V I · Own or Dr Pepper SG product 0.016*** bottled by PepsiCo bottler (0.003)
V ICocaCola · Coca-Cola product -0.004 (0.003)
V ICocaCola · Dr Pepper SG product 0.032*** bottled by Coca-Cola bottler (0.003)
V IP epsiCo · PepsiCo product -0.012*** (0.005)
V IP epsiCo · Dr Pepper SG product 0.025*** bottled by PepsiCo bottler (0.003)
Observations 37,106,025 37,106,025 37,106,025 37,106,025 R2 0.893 0.893 0.893 0.893 Prod × County × Season-of-year FE Yes Yes Yes Yes Week × County FE Yes Yes Yes Yes Week × Firm FE Yes Yes Yes Yes Store FE Yes Yes Yes Yes
Notes: Standard errors clustered at the county level (436 clusters) in parentheses. * p < 0.1, ** p < 0.05, *** p < 0.01. All specifications include controls for feature and display. Post-merger period starts after regulatory clearance.
iv
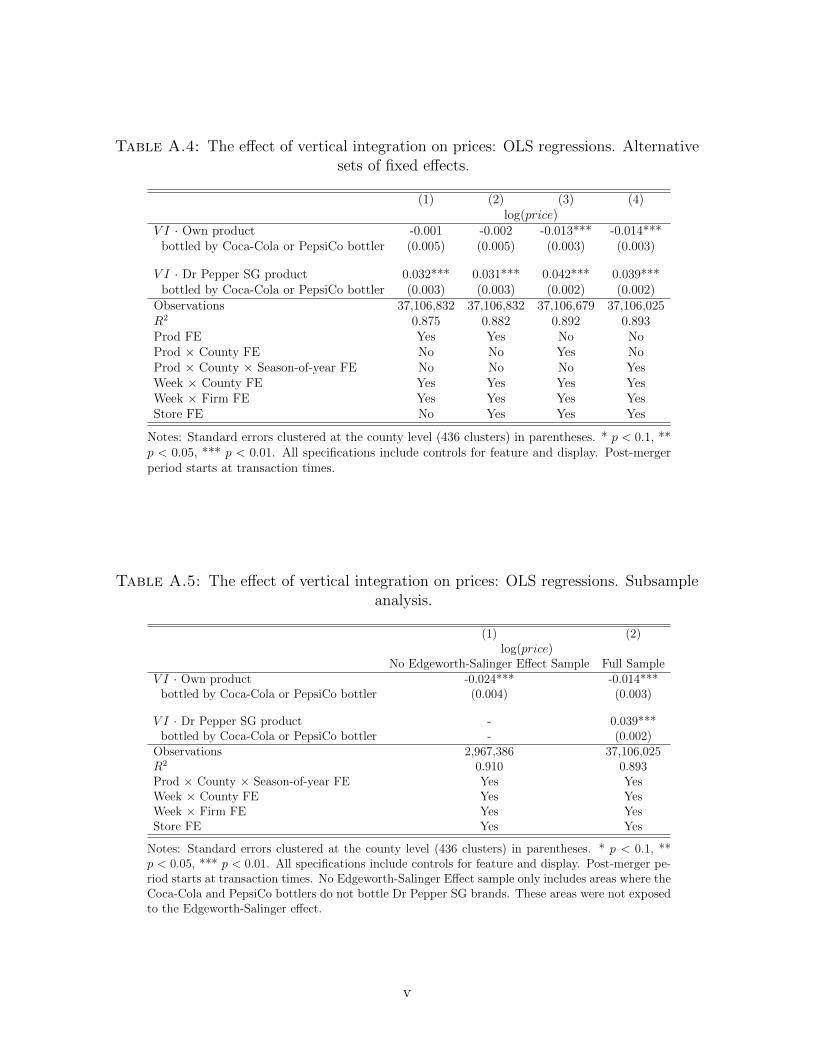
Table A.4: The effect of vertical integration on prices: OLS regressions. Alternative sets of fixed effects.
(1) (2) (3) (4) log(price)
V I · Own product -0.001 -0.002 -0.013*** -0.014*** bottled by Coca-Cola or PepsiCo bottler (0.005) (0.005) (0.003) (0.003)
V I · Dr Pepper SG product 0.032*** 0.031*** 0.042*** 0.039*** bottled by Coca-Cola or PepsiCo bottler (0.003) (0.003) (0.002) (0.002)
Observations 37,106,832 37,106,832 37,106,679 37,106,025 R2 0.875 0.882 0.892 0.893 Prod FE Yes Yes No No Prod × County FE No No Yes No Prod × County × Season-of-year FE No No No Yes Week × County FE Yes Yes Yes Yes Week × Firm FE Yes Yes Yes Yes Store FE No Yes Yes Yes
Notes: Standard errors clustered at the county level (436 clusters) in parentheses. * p < 0.1, ** p < 0.05, *** p < 0.01. All specifications include controls for feature and display. Post-merger period starts at transaction times.
Table A.5: The effect of vertical integration on prices: OLS regressions. Subsample analysis.
(1) (2) log(price)
No Edgeworth-Salinger Effect Sample Full Sample V I · Own product -0.024*** -0.014*** bottled by Coca-Cola or PepsiCo bottler (0.004) (0.003)
V I · Dr Pepper SG product - 0.039*** bottled by Coca-Cola or PepsiCo bottler - (0.002)
Observations 2,967,386 37,106,025 R2 0.910 0.893 Prod × County × Season-of-year FE Yes Yes Week × County FE Yes Yes Week × Firm FE Yes Yes Store FE Yes Yes
Notes: Standard errors clustered at the county level (436 clusters) in parentheses. * p < 0.1, ** p < 0.05, *** p < 0.01. All specifications include controls for feature and display. Post-merger period starts at transaction times. No Edgeworth-Salinger Effect sample only includes areas where the Coca-Cola and PepsiCo bottlers do not bottle Dr Pepper SG brands. These areas were not exposed to the Edgeworth-Salinger effect.
v
C Clustering
In our main analysis we cluster errors at the county level. This choice is primarily driven
by the fact that treatment is at the county level and not at the MSA level. That is, two
neighbor counties may have been differentially impacted by vertical integration. While
pricing incentives vary at the county level, one may be concerned about within-MSA
residual price correlation due to shocks at the MSA-level. As a robustness check, we
replicate our main table with clustering at the MSA level in Table A.6. All of the
coefficients remain statistically significant.
vi
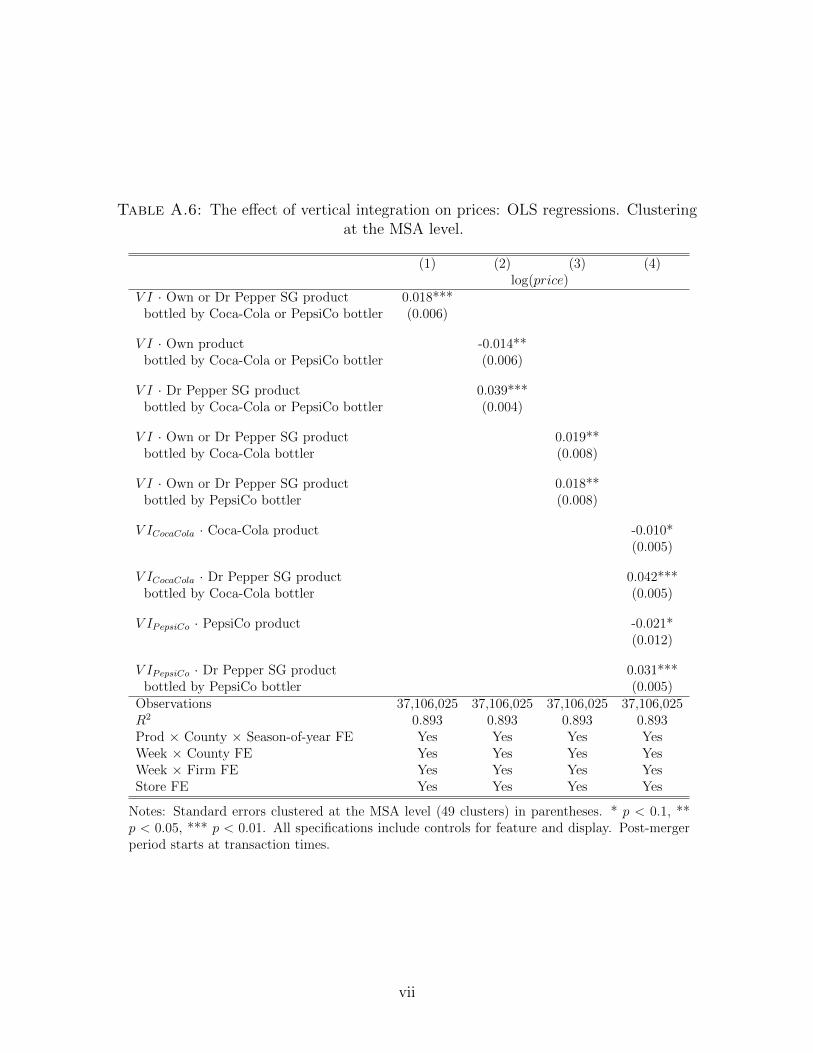
Table A.6: The effect of vertical integration on prices: OLS regressions. Clustering at the MSA level.
(1) (2) (3) (4) log(price)
V I · Own or Dr Pepper SG product 0.018*** bottled by Coca-Cola or PepsiCo bottler (0.006)
V I · Own product -0.014** bottled by Coca-Cola or PepsiCo bottler (0.006)
V I · Dr Pepper SG product 0.039*** bottled by Coca-Cola or PepsiCo bottler (0.004)
V I · Own or Dr Pepper SG product 0.019** bottled by Coca-Cola bottler (0.008)
V I · Own or Dr Pepper SG product 0.018** bottled by PepsiCo bottler (0.008)
V ICocaCola · Coca-Cola product -0.010* (0.005)
V ICocaCola · Dr Pepper SG product 0.042*** bottled by Coca-Cola bottler (0.005)
V IP epsiCo · PepsiCo product -0.021* (0.012)
V IP epsiCo · Dr Pepper SG product 0.031*** bottled by PepsiCo bottler (0.005)
Observations 37,106,025 37,106,025 37,106,025 37,106,025 R2 0.893 0.893 0.893 0.893 Prod × County × Season-of-year FE Yes Yes Yes Yes Week × County FE Yes Yes Yes Yes Week × Firm FE Yes Yes Yes Yes Store FE Yes Yes Yes Yes
Notes: Standard errors clustered at the MSA level (49 clusters) in parentheses. * p < 0.1, ** p < 0.05, *** p < 0.01. All specifications include controls for feature and display. Post-merger period starts at transaction times.
vii