Vertical (Dis-)Integration and Firm Performance: A ......vertical integration, while firms with too...
37
ORIGINAL ARTICLE https://doi.org/10.1007/s41464-020-00083-1 Schmalenbach Bus Rev (2020) 72:1–37 Vertical (Dis-)Integration and Firm Performance: A Management Paradigm Revisited Florian Kaiser 1 · Robert Obermaier 1 Received: 19 September 2017 / Accepted: 16 January 2020 / Published online: 10 February 2020 © The Author(s) 2020 Abstract Vertical disintegration in manufacturing industries has been an increas- ing trend since the 1990s in many countries. According to a prevailing manage- ment paradigm of focusing on core competencies, firms should have vertically disintegrated (i.e. outsourced non-core competencies) to achieve cost savings, en- hance competitiveness and improve firm performance. In line with this management paradigm, most empirical studies therefore hypothesized a negative linear relation- ship between the degree of vertical integration and firm performance, expecting performance to rise when vertical integration decreases. In contrast to previous studies, finding mixed results, we assume an inverted u-shaped relationship, theoretically based on transaction cost economics and the resource-based view of the firm, and by considering advantages and disadvantages of vertical integration, with an optimal level of vertical integration, where firms with a too low degree of vertical integration could achieve higher performance by vertical integration, while firms with too broad vertical integration could achieve higher performance by vertical disintegration. With respect to our data based on a sample of 434 German manufacturing firms between 1993 and 2013 we find a decreasing trend of vertical integration over time. Applying multiple regression analysis, our findings suggest a positive, but diminishing relationship between the degree of vertical integration and financial performance. These two findings describe a paradox of vertical disintegration. The decreasing trend mainly emerges because lower performing firms outsourced their F. Kaiser fl[email protected] R. Obermaier [email protected] 1 Chair for Business Economics, Accounting and Managerial Control, University of Passau, Innstraße 27, 94032 Passau, Germany K
Transcript of Vertical (Dis-)Integration and Firm Performance: A ......vertical integration, while firms with too...

ORIGINAL ARTICLE
https://doi.org/10.1007/s41464-020-00083-1Schmalenbach Bus Rev (2020) 72:1–37
Vertical (Dis-)Integration and Firm Performance:A Management Paradigm Revisited
Florian Kaiser1 · Robert Obermaier1
Received: 19 September 2017 / Accepted: 16 January 2020 / Published online: 10 February 2020© The Author(s) 2020
Abstract Vertical disintegration in manufacturing industries has been an increas-ing trend since the 1990s in many countries. According to a prevailing manage-ment paradigm of focusing on core competencies, firms should have verticallydisintegrated (i.e. outsourced non-core competencies) to achieve cost savings, en-hance competitiveness and improve firm performance. In line with this managementparadigm, most empirical studies therefore hypothesized a negative linear relation-ship between the degree of vertical integration and firm performance, expectingperformance to rise when vertical integration decreases.
In contrast to previous studies, finding mixed results, we assume an invertedu-shaped relationship, theoretically based on transaction cost economics and theresource-based view of the firm, and by considering advantages and disadvantagesof vertical integration, with an optimal level of vertical integration, where firmswith a too low degree of vertical integration could achieve higher performance byvertical integration, while firms with too broad vertical integration could achievehigher performance by vertical disintegration.
With respect to our data based on a sample of 434 German manufacturing firmsbetween 1993 and 2013 we find a decreasing trend of vertical integration overtime. Applying multiple regression analysis, our findings suggest a positive, butdiminishing relationship between the degree of vertical integration and financialperformance. These two findings describe a paradox of vertical disintegration. Thedecreasing trend mainly emerges because lower performing firms outsourced their
� R. [email protected]
1 Chair for Business Economics, Accounting and Managerial Control, University of Passau,Innstraße 27, 94032 Passau, Germany
K

2 Schmalenbach Bus Rev (2020) 72:1–37
activities significantly whereas high performing firms do not show such a devel-opment. Overall, our results indicate that German manufacturing firms might havegone too far in in their vertical disintegration strategy by following a managementparadigm which needs much more critical reflection.
Keywords Vertical integration · outsourcing · financial performance · transactioncosts · resource-based view
JEL Classifications L25 · C23 · M11
1 Introduction
Vertical disintegration has been an influential management paradigm and an empiri-cally detectable business trend in the manufacturing industry during the last decadeswhich has been accompanied by the concept of supply chain management—bothseen as key drivers for the financial performance of firms (Shi and Yu 2013; Ottoand Obermaier 2009).
In stark contrast, during the beginning of industrialization “owning the valuechain” and a high degree of vertical integration has been a predominant strategy overdecades (Harrigan 1984). A classic example is Henry Ford’s River Rouge complex,built during the late 1920s, with a vertical integration of processes from coal andiron ore mines, timberlands and rubber plantations to the final assembly of thecar, resulting in total control over the entire supply chain. This formerly successfulstrategy of high vertical integration was pushed out of fashion in the recent decadeswhen firms realized that a concentration on core competencies and outsourcing ofnon-core activities has advantages as well. Hence, vertical disintegration becamea prevailing management paradigm in practice (Welch and Nayak 1992).
However, recent literature indicates that vertical disintegration strategies oftenfailed to reach the expected performance improvements. For instance, Rigby andBilodeau (2015) analyze the usage-satisfaction relationship among different man-agement tools and show that outsourcing in particular is on the one hand widelyused but on the other hand dissatisfies managers most when asked about the resultsof outsourcing decisions. Furthermore, a rich body of empirical literature is inter-ested in the performance implications of vertical integration strategies (see Lahiri(2016) for an overview). However, the results so far are inconclusive; i.e. somestudies found a negative (e.g. Rumelt 1982; D’Aveni and Ilinitch 1992; Desyllas2009), others detect positive (e.g. Novak and Stern 2008; Broedner et al. 2009) orinsignificant relationships (e.g. Levin 1981).
Hence, there seem to be some striking research gaps that we aim to address inour study. First, from a methodological point of view prior research predominantlyhypothesizes and investigates a linear relationship (expecting it to be negative) be-tween vertical integration (or disintegration) and firm performance although “manyintuitively appealing arguments have been offered both for and against outsourcingas a means of achieving sustainable competitive advantage” (Gilley and Rasheed2000, p. 763). Although there are a few exceptions that investigate non-linear rela-
K
Schmalenbach Bus Rev (2020) 72:1–37 3
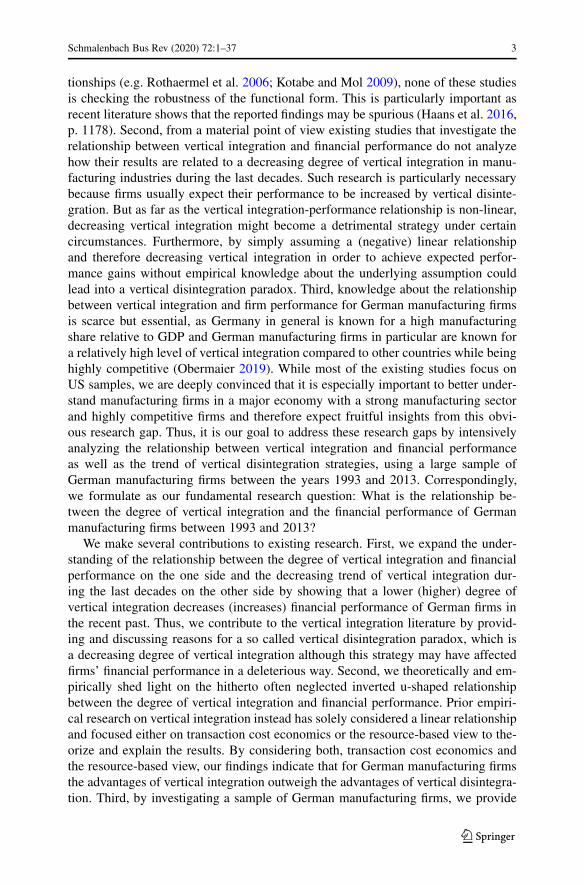
tionships (e.g. Rothaermel et al. 2006; Kotabe and Mol 2009), none of these studiesis checking the robustness of the functional form. This is particularly important asrecent literature shows that the reported findings may be spurious (Haans et al. 2016,p. 1178). Second, from a material point of view existing studies that investigate therelationship between vertical integration and financial performance do not analyzehow their results are related to a decreasing degree of vertical integration in manu-facturing industries during the last decades. Such research is particularly necessarybecause firms usually expect their performance to be increased by vertical disinte-gration. But as far as the vertical integration-performance relationship is non-linear,decreasing vertical integration might become a detrimental strategy under certaincircumstances. Furthermore, by simply assuming a (negative) linear relationshipand therefore decreasing vertical integration in order to achieve expected perfor-mance gains without empirical knowledge about the underlying assumption couldlead into a vertical disintegration paradox. Third, knowledge about the relationshipbetween vertical integration and firm performance for German manufacturing firmsis scarce but essential, as Germany in general is known for a high manufacturingshare relative to GDP and German manufacturing firms in particular are known fora relatively high level of vertical integration compared to other countries while beinghighly competitive (Obermaier 2019). While most of the existing studies focus onUS samples, we are deeply convinced that it is especially important to better under-stand manufacturing firms in a major economy with a strong manufacturing sectorand highly competitive firms and therefore expect fruitful insights from this obvi-ous research gap. Thus, it is our goal to address these research gaps by intensivelyanalyzing the relationship between vertical integration and financial performanceas well as the trend of vertical disintegration strategies, using a large sample ofGerman manufacturing firms between the years 1993 and 2013. Correspondingly,we formulate as our fundamental research question: What is the relationship be-tween the degree of vertical integration and the financial performance of Germanmanufacturing firms between 1993 and 2013?
We make several contributions to existing research. First, we expand the under-standing of the relationship between the degree of vertical integration and financialperformance on the one side and the decreasing trend of vertical integration dur-ing the last decades on the other side by showing that a lower (higher) degree ofvertical integration decreases (increases) financial performance of German firms inthe recent past. Thus, we contribute to the vertical integration literature by provid-ing and discussing reasons for a so called vertical disintegration paradox, which isa decreasing degree of vertical integration although this strategy may have affectedfirms’ financial performance in a deleterious way. Second, we theoretically and em-pirically shed light on the hitherto often neglected inverted u-shaped relationshipbetween the degree of vertical integration and financial performance. Prior empiri-cal research on vertical integration instead has solely considered a linear relationshipand focused either on transaction cost economics or the resource-based view to the-orize and explain the results. By considering both, transaction cost economics andthe resource-based view, our findings indicate that for German manufacturing firmsthe advantages of vertical integration outweigh the advantages of vertical disintegra-tion. Third, by investigating a sample of German manufacturing firms, we provide
K

4 Schmalenbach Bus Rev (2020) 72:1–37
results for a major European economy with a very strong manufacturing sector anda striking decreasing degree of vertical integration during the last decades. Prior re-search has focused on US firms, i.e. insights for other major economies are scarce.Our findings of a positive relationship between vertical integration and financialperformance indicate that the vertical disintegration strategy of German manufactur-ing firms, mainly motivated by lower labor costs in low-cost countries (Sinn 2005),either have outsourced too much of their activities or have not been able to realizethe benefits they desired.
The structure of this study is organized as follows: Sect. 2 gives an overview ofthe underlying theory developing our core hypothesis and the relevant literature athand. In Sect. 3 the research methodology is described. The results of the analysis arepresented in Sect. 4 and discussed in Sect. 5. The study concludes with a summaryof key findings and further research opportunities.
2 Theory and Hypothesis
Vertical integration, defined as “the combination, under a single ownership, of twoor more stages of production or distribution (or both) that are usually separate”(Buzzell 1983, p. 93) and vertical disintegration, defined as “the emergence of newintermediate markets that divide a previously integrated production process betweentwo sets of specialized firms in the same industry” (Jacobides 2005, p. 465) areclassical issues for researchers and practitioners. As in prior studies, we use theconcepts of vertical disintegration and outsourcing synonymously although theymay slightly differ (e.g. Broedner et al. 2009; Desyllas 2009). Further, the terms“vertical integration” and “degree of vertical integration” are used interchangeablethroughout this study.
Transaction costs economics (TCE)—pioneered by Coase (1937) and further de-veloped principally by Williamson (1971, 1975, 1991b)—and the resource-basedview (RBV) of the firm (Penrose 1959; Wernerfelt 1984; Barney 1991) have madeseminal contributions to our understanding of the existence of firms in general andmake-or-buy decisions as well as vertical (dis-)integration in special. The core issueof TCE is that utilizing the market system is not for free as it causes costs for usingit (so called transaction costs). Hence, the transaction costs of firm activities viamarket transactions have to be compared with the costs of internalization activities(i.e. vertical integration) and transactions should accordingly only be undertakenwithin that institutional arrangement (market or firm) which causes the lowest costs.According to the RBV, vertical integration is mainly influenced by the competitiveadvantage a firm has in a particular stage of the value chain relative to the market(Jacobides and Hitt 2005; Jacobides and Winter 2005). This competitive advan-tage is a result of a firm’s predominant resources and capabilities which arise froma unique, path-dependent learning process (Levinthal 1997; Jacobides and Winter2005). According to Barney (1991), resources and capabilities lead to competitiveadvantage if they are valuable, rare, difficult to imitate and non-substitutable. Insum, TCE and RBV provide complementary explanations for the decisions whether
K
Schmalenbach Bus Rev (2020) 72:1–37 5
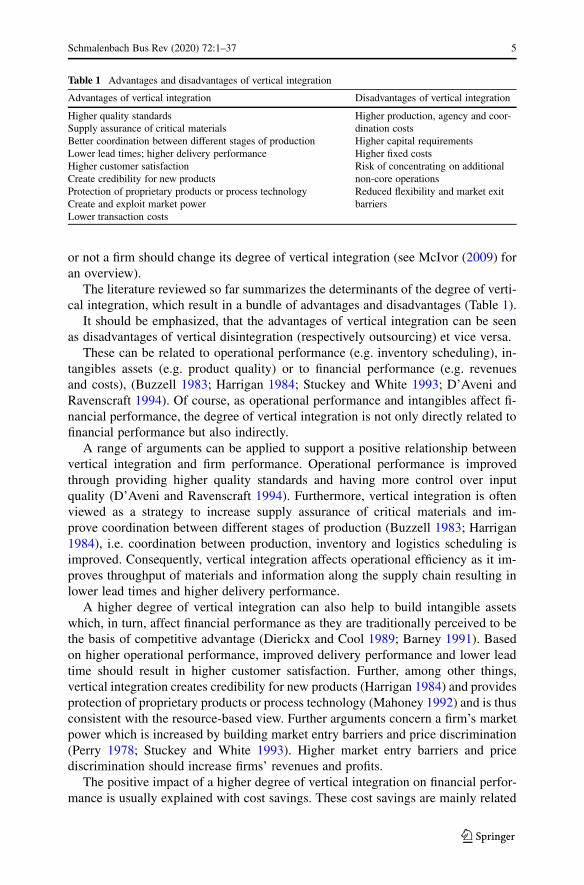
Table 1 Advantages and disadvantages of vertical integration
Advantages of vertical integration Disadvantages of vertical integration
Higher quality standardsSupply assurance of critical materialsBetter coordination between different stages of productionLower lead times; higher delivery performanceHigher customer satisfactionCreate credibility for new productsProtection of proprietary products or process technologyCreate and exploit market powerLower transaction costs
Higher production, agency and coor-dination costsHigher capital requirementsHigher fixed costsRisk of concentrating on additionalnon-core operationsReduced flexibility and market exitbarriers
or not a firm should change its degree of vertical integration (see McIvor (2009) foran overview).
The literature reviewed so far summarizes the determinants of the degree of verti-cal integration, which result in a bundle of advantages and disadvantages (Table 1).
It should be emphasized, that the advantages of vertical integration can be seenas disadvantages of vertical disintegration (respectively outsourcing) et vice versa.
These can be related to operational performance (e.g. inventory scheduling), in-tangibles assets (e.g. product quality) or to financial performance (e.g. revenuesand costs), (Buzzell 1983; Harrigan 1984; Stuckey and White 1993; D’Aveni andRavenscraft 1994). Of course, as operational performance and intangibles affect fi-nancial performance, the degree of vertical integration is not only directly related tofinancial performance but also indirectly.
A range of arguments can be applied to support a positive relationship betweenvertical integration and firm performance. Operational performance is improvedthrough providing higher quality standards and having more control over inputquality (D’Aveni and Ravenscraft 1994). Furthermore, vertical integration is oftenviewed as a strategy to increase supply assurance of critical materials and im-prove coordination between different stages of production (Buzzell 1983; Harrigan1984), i.e. coordination between production, inventory and logistics scheduling isimproved. Consequently, vertical integration affects operational efficiency as it im-proves throughput of materials and information along the supply chain resulting inlower lead times and higher delivery performance.
A higher degree of vertical integration can also help to build intangible assetswhich, in turn, affect financial performance as they are traditionally perceived to bethe basis of competitive advantage (Dierickx and Cool 1989; Barney 1991). Basedon higher operational performance, improved delivery performance and lower leadtime should result in higher customer satisfaction. Further, among other things,vertical integration creates credibility for new products (Harrigan 1984) and providesprotection of proprietary products or process technology (Mahoney 1992) and is thusconsistent with the resource-based view. Further arguments concern a firm’s marketpower which is increased by building market entry barriers and price discrimination(Perry 1978; Stuckey and White 1993). Higher market entry barriers and pricediscrimination should increase firms’ revenues and profits.
The positive impact of a higher degree of vertical integration on financial perfor-mance is usually explained with cost savings. These cost savings are mainly related
K
6 Schmalenbach Bus Rev (2020) 72:1–37
to lower transaction costs associated with less dependency on external suppliers.A higher degree of vertical integration could reduce the cost of searching, negotiat-ing, drawing up a contract, monitoring and enforcement costs with external suppliers(Mahoney 1992). Besides transaction costs, vertical integration leads to cost savingsachieved by improved coordination of production or by eliminating steps, reducingduplicate overhead costs (Buzzell 1983; Harrigan 1984).
However, it is argued that vertical integration is only beneficial to financial perfor-mance up to a certain point. Beyond that point, a higher degree of vertical integrationcould have detrimental effects on financial performance. A first group of argumentsis concerned with additional costs that are associated with an excessively high degreeof vertical integration, which consist of production, agency and coordination costs(Bettis et al. 1992; D’Aveni and Ravenscraft 1994; Desyllas 2009). The simultane-ous coordination of a large number of activities and the underutilization of capacitiesin some stages of production (D’Aveni and Ravenscraft 1994; Harrigan 1985) couldincrease production costs. A higher degree of vertical integration leads to less effi-cient utilization of different stages of production which increases unit cost (Mahoney1992). Further sources of production cost disadvantages are higher capital require-ments and capital lockups (Mahoney 1992), higher fixed costs that lead to higheroperating leverage and to a higher break-even point (Gilley and Rasheed 2000).Highly integrated firms bear the risk that they focus on additional non-core opera-tions. This may result in information deficits among corporate-level managers dueto information asymmetries about non-core activities (D’Aveni and Ilinitch 1992).Moreover, changing technology or market conditions which make products obsoletein one stage of a vertically integrated firm are key drivers of reduced flexibility andexit barriers (Buzzell 1983). A higher degree of vertical integration then reducesstrategic flexibility with respect to environmental changes by switching to supplierswith newer and better technologies (Balakrishnan and Wernerfelt 1986; Gilley andRasheed 2000; Mahoney 1992).
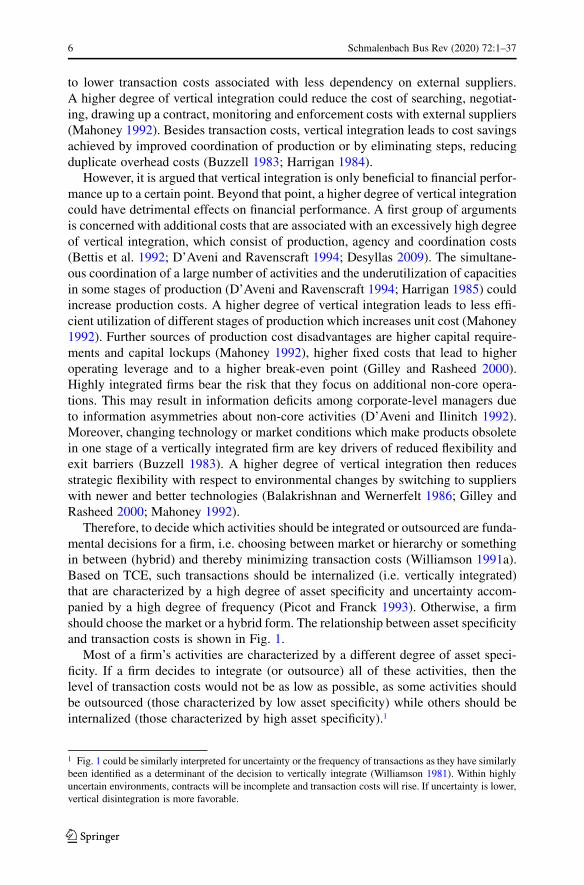
Therefore, to decide which activities should be integrated or outsourced are funda-mental decisions for a firm, i.e. choosing between market or hierarchy or somethingin between (hybrid) and thereby minimizing transaction costs (Williamson 1991a).Based on TCE, such transactions should be internalized (i.e. vertically integrated)that are characterized by a high degree of asset specificity and uncertainty accom-panied by a high degree of frequency (Picot and Franck 1993). Otherwise, a firmshould choose the market or a hybrid form. The relationship between asset specificityand transaction costs is shown in Fig. 1.
Most of a firm’s activities are characterized by a different degree of asset speci-ficity. If a firm decides to integrate (or outsource) all of these activities, then thelevel of transaction costs would not be as low as possible, as some activities shouldbe outsourced (those characterized by low asset specificity) while others should beinternalized (those characterized by high asset specificity).1
1 Fig. 1 could be similarly interpreted for uncertainty or the frequency of transactions as they have similarlybeen identified as a determinant of the decision to vertically integrate (Williamson 1981). Within highlyuncertain environments, contracts will be incomplete and transaction costs will rise. If uncertainty is lower,vertical disintegration is more favorable.
K

Schmalenbach Bus Rev (2020) 72:1–37 7
Fig. 1 Asset specificity, trans-action costs and structural form.(Source: Williamson 1991a)
st soC
no itcasna rT
Asset Specificity
MarketHybrid
Hierarchy
S0 S1
Transaction Costs
This is in line with RBV after what a firm should outsource its non-core activitiesand concentrate on core competencies, which is intended to result in a competitiveadvantage and higher financial performance. Hence, a missing focus on activities aswell as vertical disintegration of all activities would lower performance.
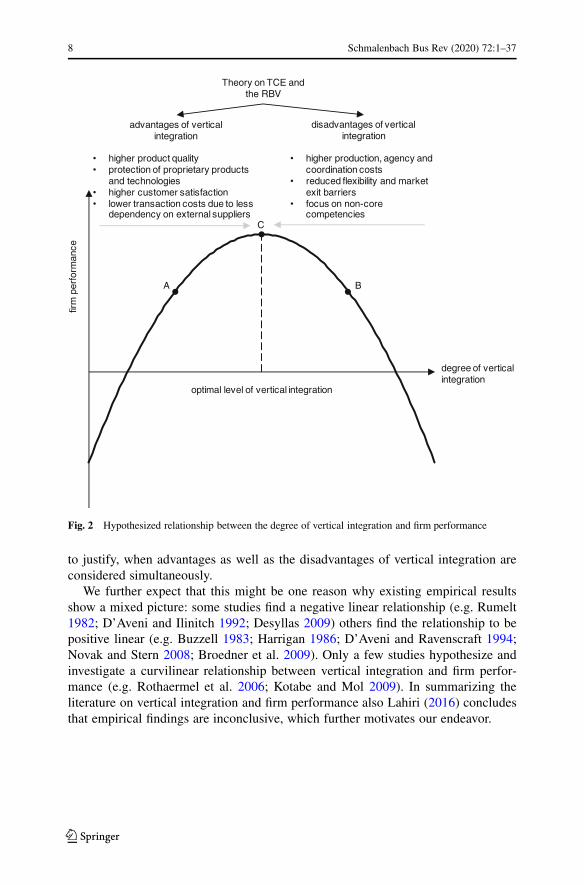
Based on both theories, an optimal degree of vertical integration can be assumedwhich to achieve is the result of firm specific decisions. The adequate strategy toreach the optimal degree of vertical integration, i.e. whether a higher or a lowerdegree of vertical scope would be profitable, depends on a firm’s initial position.Fig. 2 illustrates this relationship.
If a firm starts in position A, then the degree of vertical integration is below theoptimum. In this case, a firm is not sufficiently vertically integrated, i.e. the degreeof vertical integration is too low (in other words the firm uses the market althoughvertical integration would be beneficial). Hence, the advantages of higher verticalintegration would outbalance the disadvantages and an increase would improveperformance in that situation. The opposite is true if a firm’s integration-performancestarting point would be point B. The initial level of vertical scope is too high andthe firm conducts core and non-core activities simultaneously or uses integrationinstead of using the market. Thus, the concentration on core competencies or usingthe market increases firm performance. Once the optimum is reached (position C)deviations from that optimal level would lower performance.
Based on these arguments, we state our general hypothesis:
The relationship between the degree of vertical integration and a firm’s financialperformance follows an inverted u-shape, describing a positive relationship upto its optimum, while describing a negative relationship beyond that point.
Somewhat surprisingly many of the empirical studies at hand only hypothesizeand investigate a linear relationship between the degree of vertical integration andfirm performance assuming either improvements of firm performance through inte-gration or disintegration, although most of them are based on TCE and the RBVwhich should result in hypothesizing an inverted u-shaped relationship as we tried
K
8 Schmalenbach Bus Rev (2020) 72:1–37
Theory on TCE and the RBV
advantages of vertical integration
disadvantages of vertical integration
• higher product quality• protection of proprietary products
and technologies• higher customer satisfaction• lower transaction costs due to less
dependency on external suppliers
• higher production, agency and coordination costs
• reduced flexibility and market exit barriers
• focus on non-core competencies
degree of vertical integration
ecnamrofrep
mrif
optimal level of vertical integration
A B
C
Fig. 2 Hypothesized relationship between the degree of vertical integration and firm performance
to justify, when advantages as well as the disadvantages of vertical integration areconsidered simultaneously.
We further expect that this might be one reason why existing empirical resultsshow a mixed picture: some studies find a negative linear relationship (e.g. Rumelt1982; D’Aveni and Ilinitch 1992; Desyllas 2009) others find the relationship to bepositive linear (e.g. Buzzell 1983; Harrigan 1986; D’Aveni and Ravenscraft 1994;Novak and Stern 2008; Broedner et al. 2009). Only a few studies hypothesize andinvestigate a curvilinear relationship between vertical integration and firm perfor-mance (e.g. Rothaermel et al. 2006; Kotabe and Mol 2009). In summarizing theliterature on vertical integration and firm performance also Lahiri (2016) concludesthat empirical findings are inconclusive, which further motivates our endeavor.
K

Schmalenbach Bus Rev (2020) 72:1–37 9
3 Research Methodology
3.1 Data
Our research is focused on the German manufacturing sector. Interestingly its shareof value-added in percent of the GDP has been nearly constant over the last decades(mean=23%) and is considerably higher than it has been in other major economiesas shown in Fig. 3. Furthermore and in contrast to Germany, manufacturing firms inthe European Union (mean=18%) and USA (mean=14%) show a decreasing trendof value-added in percent of the GDP since 1997.
All data used for the empirical analysis of German corporations in the manufac-turing sector were taken from Thomson Reuters Datastream. In some cases, firms’annual financial reports serve as data base because manual corrections of the datawas required due to false figures or because the required data were not available viaThomson.
The chosen sample covers the time frame from 1993 to 2013. The beginning ofthe time frame was chosen due to data availability. 2013 represents the last year forwhich full information was available at the beginning of the data collection. Onlycomplete data sets were reprocessed, i.e. independent as well as dependent variableshad to be available. Considering the data criteria mentioned above the sample covers434 different firms and 3848 firm years.
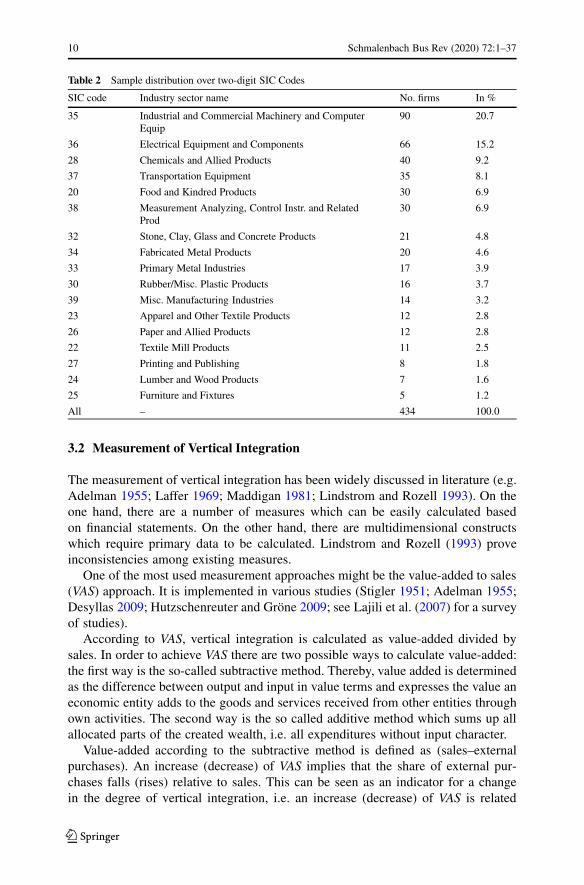
The firms in the sample belong to the Standard Industrial Classification (SIC)manufacturing division. The sample distribution based on two-digit SIC codes isshown in Table 2. The three most represented manufacturing industry sectors aremachinery (SIC35), electronics (SIC36) and chemicals (SIC28).
0
5
10
15
20
25
30
1992 1996 2000 2004 2008 2012
Germany
European Union
United States
Year
Value-added in % of GDP
Fig. 3 Share of value-added of manufacturing industries in % of GDP (Data Source: The World Bank;U.S. Bureau of Economic Analysis)
K
10 Schmalenbach Bus Rev (2020) 72:1–37
Table 2 Sample distribution over two-digit SIC Codes
SIC code Industry sector name No. firms In %
35 Industrial and Commercial Machinery and ComputerEquip
90 20.7
36 Electrical Equipment and Components 66 15.2
28 Chemicals and Allied Products 40 9.2
37 Transportation Equipment 35 8.1
20 Food and Kindred Products 30 6.9
38 Measurement Analyzing, Control Instr. and RelatedProd
30 6.9
32 Stone, Clay, Glass and Concrete Products 21 4.8
34 Fabricated Metal Products 20 4.6
33 Primary Metal Industries 17 3.9
30 Rubber/Misc. Plastic Products 16 3.7
39 Misc. Manufacturing Industries 14 3.2
23 Apparel and Other Textile Products 12 2.8
26 Paper and Allied Products 12 2.8
22 Textile Mill Products 11 2.5
27 Printing and Publishing 8 1.8
24 Lumber and Wood Products 7 1.6
25 Furniture and Fixtures 5 1.2
All – 434 100.0
3.2 Measurement of Vertical Integration
The measurement of vertical integration has been widely discussed in literature (e.g.Adelman 1955; Laffer 1969; Maddigan 1981; Lindstrom and Rozell 1993). On theone hand, there are a number of measures which can be easily calculated basedon financial statements. On the other hand, there are multidimensional constructswhich require primary data to be calculated. Lindstrom and Rozell (1993) proveinconsistencies among existing measures.
One of the most used measurement approaches might be the value-added to sales(VAS) approach. It is implemented in various studies (Stigler 1951; Adelman 1955;Desyllas 2009; Hutzschenreuter and Gröne 2009; see Lajili et al. (2007) for a surveyof studies).
According to VAS, vertical integration is calculated as value-added divided bysales. In order to achieve VAS there are two possible ways to calculate value-added:the first way is the so-called subtractive method. Thereby, value added is determinedas the difference between output and input in value terms and expresses the value aneconomic entity adds to the goods and services received from other entities throughown activities. The second way is the so called additive method which sums up allallocated parts of the created wealth, i.e. all expenditures without input character.
Value-added according to the subtractive method is defined as (sales–externalpurchases). An increase (decrease) of VAS implies that the share of external pur-chases falls (rises) relative to sales. This can be seen as an indicator for a changein the degree of vertical integration, i.e. an increase (decrease) of VAS is related
K
Schmalenbach Bus Rev (2020) 72:1–37 11
to an extension (withdrawal) of a firm’s upstream or downstream activities in thevalue chain which leads to an increase (reduction) of a firm’s value-added (mea-sured as sales minus external purchases) compared to external purchases. Backwardintegration will tend to reduce the amount of external purchases while leaving salesconstant whereas forward integration will tend to increase sales more than externalpurchases (Tucker and Wilder 1977). Both backward and forward integration resultin an increase of VAS. In general, two extreme cases are imaginable: a fully inte-grated firm which consequently has a VAS quotient of 1 and a totally dis-integratedfirm that has a VAS quotient of 0. A fully integrated firm does not need any externalpurchases to produce an output. Therefore, VAS would be calculated as (Sales–0) /Sales=1. In contrast, a totally dis-integrated firm does not produce any output; itonly deals with its external purchases, i.e. external purchases are equal to output(sales) and value-added is reduced to 0. Consequently VAS is 0.
In our study we will measure the degree of vertical integration with the VAS ratio,due to its straight forward way of calculating and interpreting the ratio with readilyavailable accounting data. But as the coverage of external purchases in ThomsonReuters Datastream is very poor, value-added is calculated by the additive method,i.e. as the sum of salaries and benefit expense, income taxes, interest expense ondebt, dividends and net income.
Another widely used measurement approach of vertical integration is the input-output approach which utilizes national input-output tables and has been imple-mented in a number of studies (see Lajili et al. (2007)). Maddigan’s (1981) VerticalIndustry Connection (VIC) index was one of the first measures of this category. TheVIC index assumes that a firm operates in more than one industry and considersthat firms of one industry might be simultaneously suppliers and buyers of anotherindustry. The major disadvantage of this approach is the assumption that aggregatednational input-output tables are applicable to individual firms (Hutzschenreuter andGröne 2009; see also for further disadvantages Lindstrom and Rozell (1993)). Be-sides Harrigan’s VIC index, there exist other measures based on input-output tables(e.g. Fan and Lang 2000).
Adelman (1955) suggests the inventory to sales ratio to measure the degree ofvertical integration. He argues that “The longer the production line and the moresuccessive processes are operated by one firm, the higher the ratio” (p. 283) whereasthe measure could be improved by using work-in-process only. However, the majordisadvantage of this measure is that inventory level is also influenced by other factorsthan vertical integration, mainly different production methods and different manu-facturing processes across industries, i.e. a comparison of firms between differentindustries is not very useful (Lindstrom and Rozell 1993).
Therefore, due to their disadvantages inventory to sales ratios as well as Maddi-gan’s VIC index are not applied in this study.
3.3 Measurement of Performance
Performance measurement is a huge topic; both in management accounting as wellas in operations or strategic management literature. Accordingly, different theoreticalapproaches can be differentiated (Obermaier and Donhauser 2012).
K
12 Schmalenbach Bus Rev (2020) 72:1–37
The goal-based approach measures performance by goals which a firm sets itself.It usually is based on financial or non-financial metrics. Financial metrics are eitherbased on P&L statement and balance sheet data (e.g. ROI, ROS) or on stock marketvalues, whereas non-financial metrics focus on operational performance dimensionssuch as quality, time, or flexibility (Neely et al. 1995). Moreover, management andorganization theory has an even broader concept of business performance (Venkatra-man and Ramanujam 1986). The systems approach measures business performanceaccording to a firm’s capacity for long-term survival in its surrounding environment.The stakeholder approach argues that a firm should take into account the viewsof all the stakeholders of the business and not just the owners. Accordingly, thisapproach defines business performance as a firm’s ability to achieve the goals ofdifferent stakeholder groups simultaneously. The measurement issues of the latterperspectives are obvious.
Murphy et al. (1996) report that most empirical studies use financial metrics suchas ROI or ROS, which are in line with the goal-based approach. In our study wealso use financial data to measure performance. However, in order to account for theperils of a performance perspective which might be too narrow, we decided to useAltman’s Z-score as a financial but multidimensional performance measure (Altman1968), because multidimensional measures are more robust compared to traditional,single dimensional measures such as ROI or ROS.
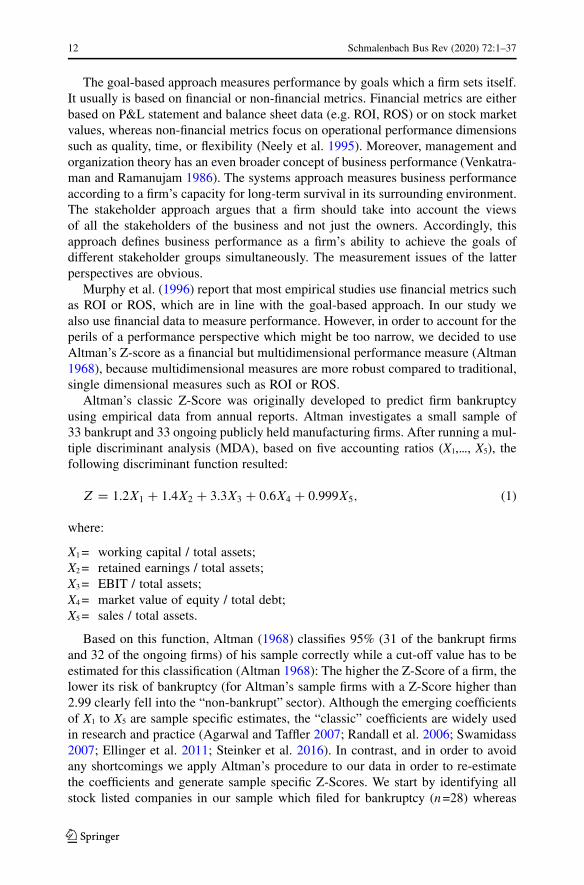
Altman’s classic Z-Score was originally developed to predict firm bankruptcyusing empirical data from annual reports. Altman investigates a small sample of33 bankrupt and 33 ongoing publicly held manufacturing firms. After running a mul-tiple discriminant analysis (MDA), based on five accounting ratios (X1,..., X5), thefollowing discriminant function resulted:
Z D 1.2X1 C 1.4X2 C 3.3X3 C 0.6X4 C 0.999X5; (1)
where:
X1= working capital / total assets;X2= retained earnings / total assets;X3= EBIT / total assets;X4= market value of equity / total debt;X5= sales / total assets.
Based on this function, Altman (1968) classifies 95% (31 of the bankrupt firmsand 32 of the ongoing firms) of his sample correctly while a cut-off value has to beestimated for this classification (Altman 1968): The higher the Z-Score of a firm, thelower its risk of bankruptcy (for Altman’s sample firms with a Z-Score higher than2.99 clearly fell into the “non-bankrupt” sector). Although the emerging coefficientsof X1 to X5 are sample specific estimates, the “classic” coefficients are widely usedin research and practice (Agarwal and Taffler 2007; Randall et al. 2006; Swamidass2007; Ellinger et al. 2011; Steinker et al. 2016). In contrast, and in order to avoidany shortcomings we apply Altman’s procedure to our data in order to re-estimatethe coefficients and generate sample specific Z-Scores. We start by identifying allstock listed companies in our sample which filed for bankruptcy (n=28) whereas
K
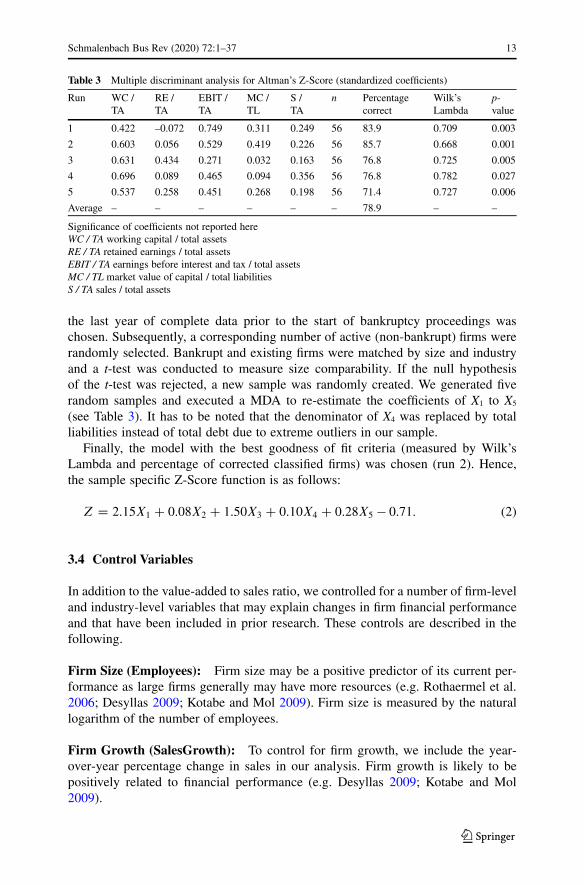
Schmalenbach Bus Rev (2020) 72:1–37 13
Table 3 Multiple discriminant analysis for Altman’s Z-Score (standardized coefficients)
Run WC /TA
RE /TA
EBIT /TA
MC /TL
S /TA
n Percentagecorrect
Wilk’sLambda
p-value
1 0.422 –0.072 0.749 0.311 0.249 56 83.9 0.709 0.003
2 0.603 0.056 0.529 0.419 0.226 56 85.7 0.668 0.001
3 0.631 0.434 0.271 0.032 0.163 56 76.8 0.725 0.005
4 0.696 0.089 0.465 0.094 0.356 56 76.8 0.782 0.027
5 0.537 0.258 0.451 0.268 0.198 56 71.4 0.727 0.006
Average – – – – – – 78.9 – –
Significance of coefficients not reported hereWC / TA working capital / total assetsRE / TA retained earnings / total assetsEBIT / TA earnings before interest and tax / total assetsMC / TL market value of capital / total liabilitiesS / TA sales / total assets
the last year of complete data prior to the start of bankruptcy proceedings waschosen. Subsequently, a corresponding number of active (non-bankrupt) firms wererandomly selected. Bankrupt and existing firms were matched by size and industryand a t-test was conducted to measure size comparability. If the null hypothesisof the t-test was rejected, a new sample was randomly created. We generated fiverandom samples and executed a MDA to re-estimate the coefficients of X1 to X5
(see Table 3). It has to be noted that the denominator of X4 was replaced by totalliabilities instead of total debt due to extreme outliers in our sample.
Finally, the model with the best goodness of fit criteria (measured by Wilk’sLambda and percentage of corrected classified firms) was chosen (run 2). Hence,the sample specific Z-Score function is as follows:
Z D 2.15X1 C 0.08X2 C 1.50X3 C 0.10X4 C 0.28X5 � 0.71: (2)
3.4 Control Variables
In addition to the value-added to sales ratio, we controlled for a number of firm-leveland industry-level variables that may explain changes in firm financial performanceand that have been included in prior research. These controls are described in thefollowing.
Firm Size (Employees): Firm size may be a positive predictor of its current per-formance as large firms generally may have more resources (e.g. Rothaermel et al.2006; Desyllas 2009; Kotabe and Mol 2009). Firm size is measured by the naturallogarithm of the number of employees.
Firm Growth (SalesGrowth): To control for firm growth, we include the year-over-year percentage change in sales in our analysis. Firm growth is likely to bepositively related to financial performance (e.g. Desyllas 2009; Kotabe and Mol2009).
K
14 Schmalenbach Bus Rev (2020) 72:1–37
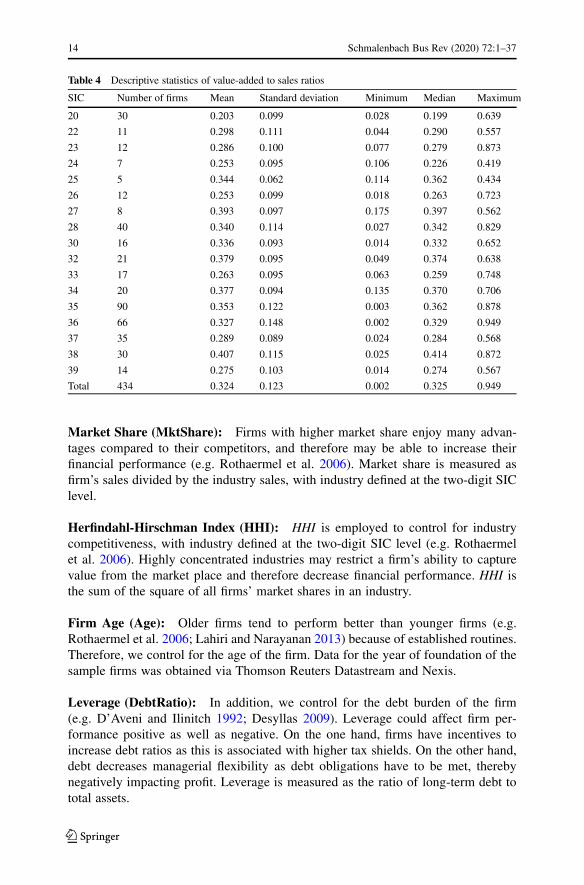
Table 4 Descriptive statistics of value-added to sales ratios
SIC Number of firms Mean Standard deviation Minimum Median Maximum
20 30 0.203 0.099 0.028 0.199 0.639
22 11 0.298 0.111 0.044 0.290 0.557
23 12 0.286 0.100 0.077 0.279 0.873
24 7 0.253 0.095 0.106 0.226 0.419
25 5 0.344 0.062 0.114 0.362 0.434
26 12 0.253 0.099 0.018 0.263 0.723
27 8 0.393 0.097 0.175 0.397 0.562
28 40 0.340 0.114 0.027 0.342 0.829
30 16 0.336 0.093 0.014 0.332 0.652
32 21 0.379 0.095 0.049 0.374 0.638
33 17 0.263 0.095 0.063 0.259 0.748
34 20 0.377 0.094 0.135 0.370 0.706
35 90 0.353 0.122 0.003 0.362 0.878
36 66 0.327 0.148 0.002 0.329 0.949
37 35 0.289 0.089 0.024 0.284 0.568
38 30 0.407 0.115 0.025 0.414 0.872
39 14 0.275 0.103 0.014 0.274 0.567
Total 434 0.324 0.123 0.002 0.325 0.949
Market Share (MktShare): Firms with higher market share enjoy many advan-tages compared to their competitors, and therefore may be able to increase theirfinancial performance (e.g. Rothaermel et al. 2006). Market share is measured asfirm’s sales divided by the industry sales, with industry defined at the two-digit SIClevel.
Herfindahl-Hirschman Index (HHI): HHI is employed to control for industrycompetitiveness, with industry defined at the two-digit SIC level (e.g. Rothaermelet al. 2006). Highly concentrated industries may restrict a firm’s ability to capturevalue from the market place and therefore decrease financial performance. HHI isthe sum of the square of all firms’ market shares in an industry.
Firm Age (Age): Older firms tend to perform better than younger firms (e.g.Rothaermel et al. 2006; Lahiri and Narayanan 2013) because of established routines.Therefore, we control for the age of the firm. Data for the year of foundation of thesample firms was obtained via Thomson Reuters Datastream and Nexis.
Leverage (DebtRatio): In addition, we control for the debt burden of the firm(e.g. D’Aveni and Ilinitch 1992; Desyllas 2009). Leverage could affect firm per-formance positive as well as negative. On the one hand, firms have incentives toincrease debt ratios as this is associated with higher tax shields. On the other hand,debt decreases managerial flexibility as debt obligations have to be met, therebynegatively impacting profit. Leverage is measured as the ratio of long-term debt tototal assets.
K
Schmalenbach Bus Rev (2020) 72:1–37 15
Diversification (Diversification): We follow prior research (e.g. Rothaermel et al.2006) and include an indicator variable that equals 1 if a firm operates in more thanone industry segment. Diversification is expected to be positively related to financialperformance (e.g. Rumelt 1982).
Environmental Dynamism (Dynamism): Higher environmental uncertainty isexpected to negatively affect financial performance and is therefore included inour analysis. The calculation is based on the approach first suggested by Dess andBeard (1984). First, we summed up the sales for all firms in each of the two-digitSIC industries for each year between 1988 and 2013. Then, we used five yearsof the two-digit SIC industry-level data to calculate environmental uncertainty forthe sixth year (for instance, industry sales from 1988 through 1992 were used toestimate environmental uncertainty for 1993). For each year and each industry, weregressed the five previous years’ industry sales against year. Dynamism was thenmeasured as the standard error of the regression coefficient of “year” divided byindustry-average sales over the five-year period.
Capital Intensity (CapitalIntens): We control for differences in financial perfor-mance across firms that are due to differences in capital intensity by including theratio of capital expenditures to sales (e.g. D’Aveni and Ilinitch 1992; Bhuyan 2002).
Export Ratio (ExportRatio): As prior research has shown that a firm’s exportratio affects its financial performance (e.g. Kotabe and Mol 2009), we control forthis fact by including the ratio of a firm’s international sales to total sales.
3.5 Model
In order to test the proposed hypothesis which is a concave functional form regardingthe degree of vertical integration and firm performance, the following regressionmodel is estimated:
P erfi t D ˇ0 C ˇ1VASi t C ˇ2.VASi t/2 C ˇ3ln .Employeesi t/
Cˇ4SalesGrowthi t C ˇ5MktSharei t C ˇ6HHIjtCˇ7Agei t C ˇ8DebtRatioi t C ˇ9Diversificationi t
Cˇ10Dynamismjt C ˇ11CapitalIntensi t C ˇ12ExportRatioi t
CX
ıiFi CX
�iYi C ui t ,
(3)
with Perfit as the performance measure of firm i in year t as measured by Z-Score.VASit is the value-added to sales ratio. Linear and quadratic terms of the VAS wereincluded in the regression model, thus allowing for a nonlinear relationship to bedetected. In addition, firm(F)- and year(Y)-fixed effects are controlled for (whereasa Hausman-test was conducted to test if a fixed effects model is appropriate). Fur-thermore, we use autocorrelation- and heteroscedasticity-corrected robust standarderrors.
Since we test for an inverted u-shaped relationship between vertical integrationand financial performance, the sign of β1 is expected to be positive and the sign
K
16 Schmalenbach Bus Rev (2020) 72:1–37
of β2 is expected to be negative. The coefficients of VAS allow us to determine theturning point in the relationship between the degree of vertical integration and firmperformance. Taking the first derivative of Eq. 3 and setting it to zero results in theturning point at–β1 / 2 β2.
4 Results
4.1 Descriptive Results
As a first step we start with some descriptive findings with respect to vertical in-tegration of German manufacturing industries. As a brief overview Table 4 reportsdescriptive statistics for value-added to sales ratios of the manufacturing industries(SIC20–SIC39). Regarding means, the industry sectors with the highest degree ofvertical integration are measuring instruments (SIC38) and printing, publishing, andallied industries (SIC27) whereas sectors with the lowest degree are food products(SIC20) and leather and leather products (SIC31).
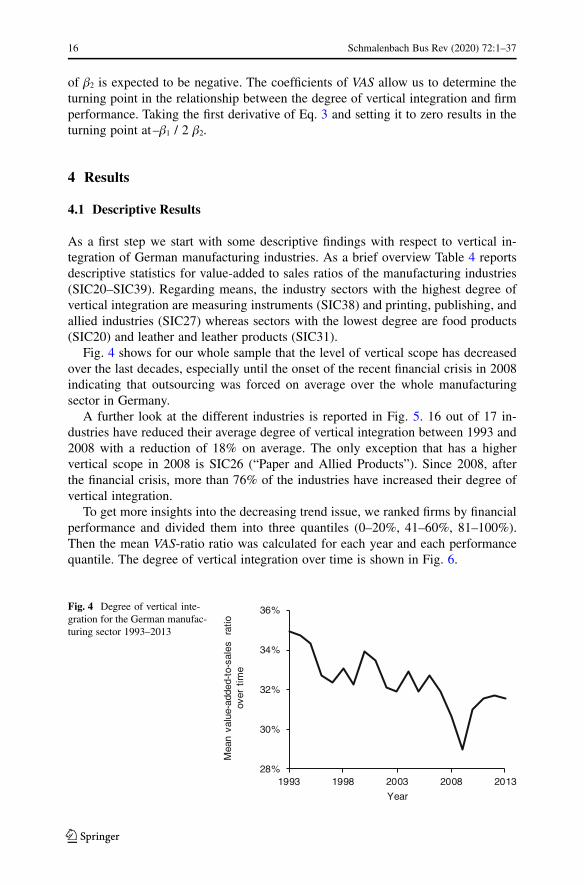
Fig. 4 shows for our whole sample that the level of vertical scope has decreasedover the last decades, especially until the onset of the recent financial crisis in 2008indicating that outsourcing was forced on average over the whole manufacturingsector in Germany.
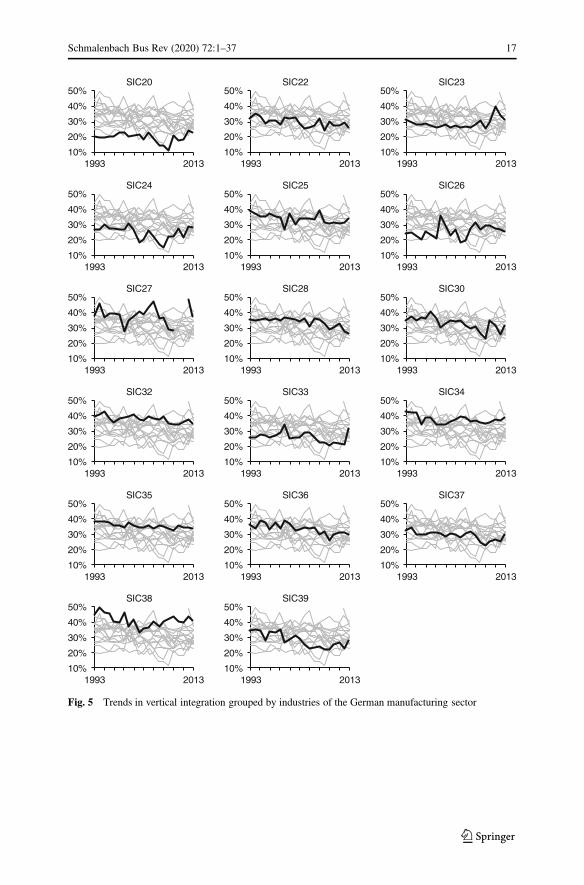
A further look at the different industries is reported in Fig. 5. 16 out of 17 in-dustries have reduced their average degree of vertical integration between 1993 and2008 with a reduction of 18% on average. The only exception that has a highervertical scope in 2008 is SIC26 (“Paper and Allied Products”). Since 2008, afterthe financial crisis, more than 76% of the industries have increased their degree ofvertical integration.
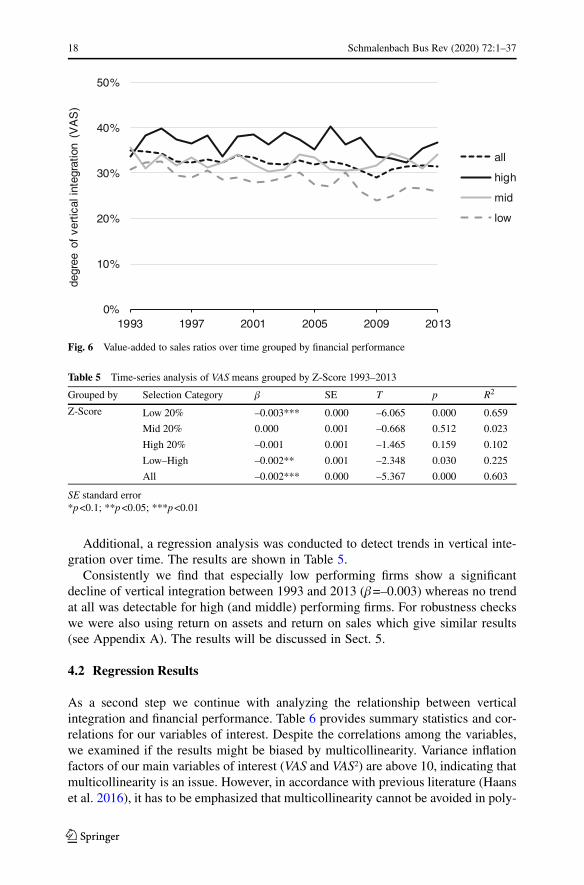
To get more insights into the decreasing trend issue, we ranked firms by financialperformance and divided them into three quantiles (0–20%, 41–60%, 81–100%).Then the mean VAS-ratio ratio was calculated for each year and each performancequantile. The degree of vertical integration over time is shown in Fig. 6.
Fig. 4 Degree of vertical inte-gration for the German manufac-turing sector 1993–2013
28%
30%
32%
34%
36%
1993 1998 2003 2008 2013
Year
naeM
eulav-
dedda-t
o-oitar
selase
mitrevo
K
Schmalenbach Bus Rev (2020) 72:1–37 17
SIC35 SIC36 SIC37
SIC38 SIC39
SIC27 SIC28 SIC30
SIC32 SIC33 SIC34
SIC20 SIC22 SIC23
SIC24 SIC25 SIC26
10%
20%
30%
40%
50%
1993 201310%
20%
30%
40%
50%
1993 201310%
20%
30%
40%
50%
1993 2013
10%
20%
30%
40%
50%
1993 201310%
20%
30%
40%
50%
1993 201310%
20%
30%
40%
50%
1993 2013
10%
20%
30%
40%
50%
1993 201310%
20%
30%
40%
50%
1993 201310%
20%
30%
40%
50%
1993 2013
10%
20%
30%
40%
50%
1993 201310%
20%
30%
40%
50%
1993 201310%
20%
30%
40%
50%
1993 2013
10%
20%
30%
40%
50%
1993 201310%
20%
30%
40%
50%
1993 201310%
20%
30%
40%
50%
1993 2013
10%
20%
30%
40%
50%
1993 201310%
20%
30%
40%
50%
1993 2013
Fig. 5 Trends in vertical integration grouped by industries of the German manufacturing sector
K
18 Schmalenbach Bus Rev (2020) 72:1–37
0%
10%
20%
30%
40%
50%
1993 1997 2001 2005 2009 2013
)S
AV(
noita rget ni lac itrevfo
e e rge d
all
high
mid
low
Fig. 6 Value-added to sales ratios over time grouped by financial performance
Table 5 Time-series analysis of VAS means grouped by Z-Score 1993–2013
Grouped by Selection Category β SE T p R2
Z-Score Low 20% –0.003*** 0.000 –6.065 0.000 0.659
Mid 20% 0.000 0.001 –0.668 0.512 0.023
High 20% –0.001 0.001 –1.465 0.159 0.102
Low–High –0.002** 0.001 –2.348 0.030 0.225
All –0.002*** 0.000 –5.367 0.000 0.603
SE standard error*p<0.1; **p<0.05; ***p<0.01
Additional, a regression analysis was conducted to detect trends in vertical inte-gration over time. The results are shown in Table 5.
Consistently we find that especially low performing firms show a significantdecline of vertical integration between 1993 and 2013 (β=–0.003) whereas no trendat all was detectable for high (and middle) performing firms. For robustness checkswe were also using return on assets and return on sales which give similar results(see Appendix A). The results will be discussed in Sect. 5.
4.2 Regression Results
As a second step we continue with analyzing the relationship between verticalintegration and financial performance. Table 6 provides summary statistics and cor-relations for our variables of interest. Despite the correlations among the variables,we examined if the results might be biased by multicollinearity. Variance inflationfactors of our main variables of interest (VAS and VAS2) are above 10, indicating thatmulticollinearity is an issue. However, in accordance with previous literature (Haanset al. 2016), it has to be emphasized that multicollinearity cannot be avoided in poly-
K
Schmalenbach Bus Rev (2020) 72:1–37 19
Table 6 Correlations among key variables and summary statistics
1 2 3 4 5 6 7 8 9 10 11 12
1. Z-Score 1.00 – – – – – – – – – – –
2. Value-added tosales
0.22 1.00 – – – – – – – – – –
3. ln(em-ployees)
–0.20 0.06 1.00 – – – – – – – – –
4. Salesgrowth
0.00 –0.02 –0.02 1.00 – – – – – – – –
5. Marketshare
–0.13 –0.07 0.46 –0.01 1.00 – – – – – – –
6. HHI –0.03 0.05 –0.01 –0.01 0.20 1.00 – – – – – –
7. Firmage
–0.11 0.09 0.25 0.01 0.05 0.03 1.00 – – – – –
8. Debtratio
–0.30 –0.03 0.05 0.01 0.16 0.00 –0.08 1.00 – – – –
9. Diversi-fication
–0.14 0.00 0.22 –0.01 0.08 –0.06 0.04 0.06 1.00 – – –
10. Dy-namism
0.02 –0.03 –0.11 –0.01 0.08 0.01 –0.08 0.01 –0.07 1.00 – –
11. Capitalintensity
–0.11 0.05 0.05 0.02 0.01 –0.12 –0.12 0.07 0.06 –0.03 1.00 –
12. Exportratio
0.01 0.10 0.33 –0.01 0.07 0.05 0.00 0.00 0.11 –0.04 –0.06 1.00
Mean 0.48 0.32 7.68 0.24 0.07 0.25 4.06 0.12 0.90 0.03 0.05 0.48
Standarddeviation
0.75 0.12 1.78 4.62 0.13 0.13 1.04 0.12 0.30 0.03 0.06 0.26
Minimum –3.56 0.00 0.00 –0.86 0.00 0.08 0.00 0.00 0.00 0.00 0.00 0.00
Median 0.40 0.32 7.46 0.04 0.01 0.22 4.43 0.09 1.00 0.02 0.04 0.51
Maximum 14.60 0.95 13.22 172.54 0.89 0.87 6.56 1.75 1.00 0.36 1.22 1.00
nomial regressions. None of the other independent variables had a variance inflationfactor greater than 2. As the generally accepted range for variance inflation factorsconcerning individual variables is below 10, we conclude that multicollinearity doesnot negatively influence our results.
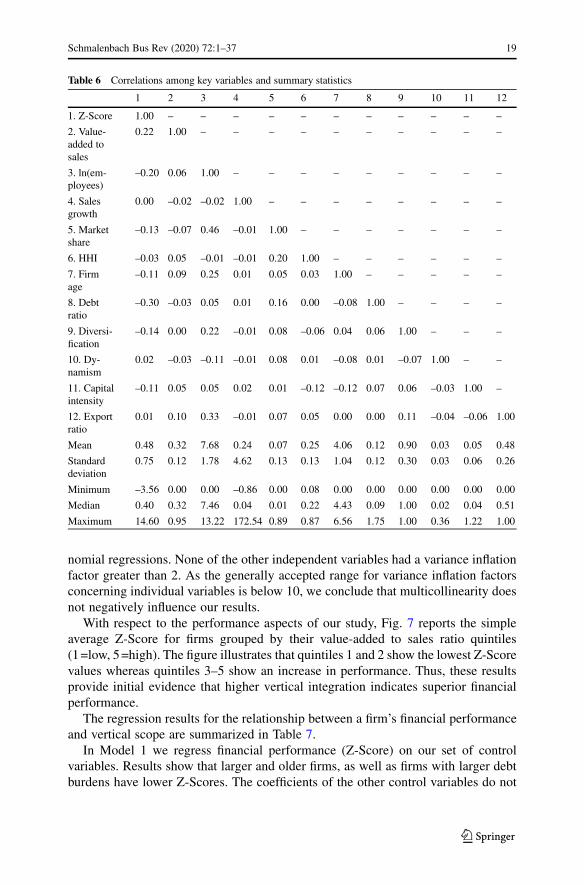
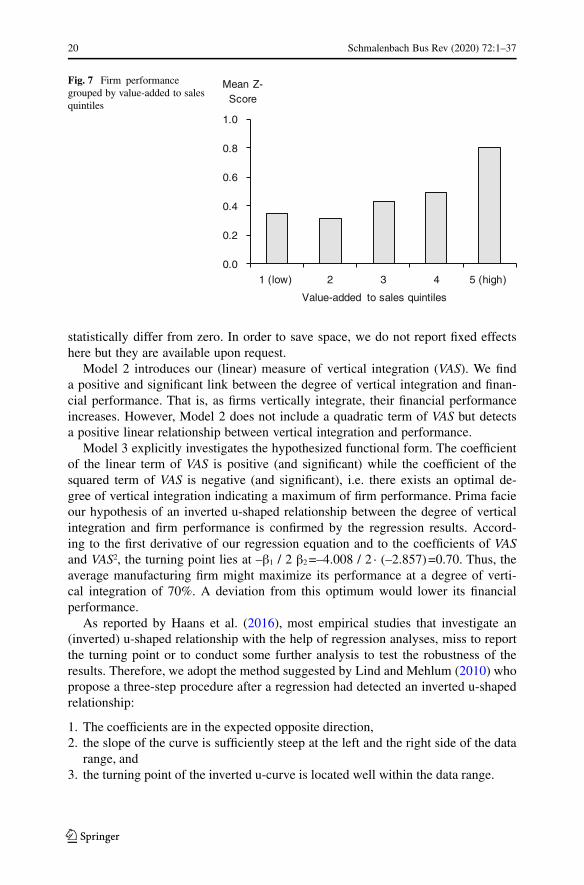
With respect to the performance aspects of our study, Fig. 7 reports the simpleaverage Z-Score for firms grouped by their value-added to sales ratio quintiles(1=low, 5=high). The figure illustrates that quintiles 1 and 2 show the lowest Z-Scorevalues whereas quintiles 3–5 show an increase in performance. Thus, these resultsprovide initial evidence that higher vertical integration indicates superior financialperformance.
The regression results for the relationship between a firm’s financial performanceand vertical scope are summarized in Table 7.
In Model 1 we regress financial performance (Z-Score) on our set of controlvariables. Results show that larger and older firms, as well as firms with larger debtburdens have lower Z-Scores. The coefficients of the other control variables do not
K
20 Schmalenbach Bus Rev (2020) 72:1–37
Fig. 7 Firm performancegrouped by value-added to salesquintiles
0.0
0.2
0.4
0.6
0.8
1.0
1 (low) 2 3 4 5 (high)
Mean Z-Score
Value-added to sales quintiles
statistically differ from zero. In order to save space, we do not report fixed effectshere but they are available upon request.
Model 2 introduces our (linear) measure of vertical integration (VAS). We finda positive and significant link between the degree of vertical integration and finan-cial performance. That is, as firms vertically integrate, their financial performanceincreases. However, Model 2 does not include a quadratic term of VAS but detectsa positive linear relationship between vertical integration and performance.
Model 3 explicitly investigates the hypothesized functional form. The coefficientof the linear term of VAS is positive (and significant) while the coefficient of thesquared term of VAS is negative (and significant), i.e. there exists an optimal de-gree of vertical integration indicating a maximum of firm performance. Prima facieour hypothesis of an inverted u-shaped relationship between the degree of verticalintegration and firm performance is confirmed by the regression results. Accord-ing to the first derivative of our regression equation and to the coefficients of VASand VAS2, the turning point lies at –β1 / 2 β2=–4.008 / 2 · (–2.857)=0.70. Thus, theaverage manufacturing firm might maximize its performance at a degree of verti-cal integration of 70%. A deviation from this optimum would lower its financialperformance.
As reported by Haans et al. (2016), most empirical studies that investigate an(inverted) u-shaped relationship with the help of regression analyses, miss to reportthe turning point or to conduct some further analysis to test the robustness of theresults. Therefore, we adopt the method suggested by Lind and Mehlum (2010) whopropose a three-step procedure after a regression had detected an inverted u-shapedrelationship:
1. The coefficients are in the expected opposite direction,2. the slope of the curve is sufficiently steep at the left and the right side of the data
range, and3. the turning point of the inverted u-curve is located well within the data range.
K

Schmalenbach Bus Rev (2020) 72:1–37 21
Table 7 Regression results (dependent variable: Z-Score)
Model 1 Model 2 Model 3
Value-added to sales – 1.853***(6.97)
4.008***(6.44)
(Value-added to sales)2 – – –2.857***(–4.09)
Ln(employees) –0.164***(–2.76)
–0.139**(–2.16)
–0.151**(–2.35)
Sales growth 0.001(0.47)
0.001(1.23)
0.001(1.51)
Market share 0.353(1.32)
0.466(1.60)
0.494*(1.68)
Herfindahl-Hirschman –0.145(–0.79)
–0.190(–1.05)
–0.207(–1.17)
Firm age –0.331**(–2.14)
–0.393**(–2.55)
–0.397***(–2.59)
Debt ratio –0.672***(–3.16)
–0.657***(–2.85)
–0.657***(–2.85)
Diversification 0.102*(1.66)
0.095(1.62)
0.093(1.63)
Dynamism –0.211(–0.66)
–0.060(–0.20)
–0.051(–0.17)
Capital intensity –0.484(–1.22)
–0.590(–1.34)
–0.630(–1.42)
Export ratio –0.167(–1.32)
–0.136(–1.08)
–0.123(–1.00)
Constant 3.230***(3.55)
2.637***(2.83)
2.382**(2.56)
Year effects included Yes Yes Yes
Firm-fixed effects Yes Yes Yes
Observations 3,848 3,848 3,848
Number of Firms 434 434 434
Within R2 0.085 0.15 0.16
F 6.514 9.76 10.319
Robust standard errors are in parentheses*p<0.1; **p<0.05; ***p<0.01
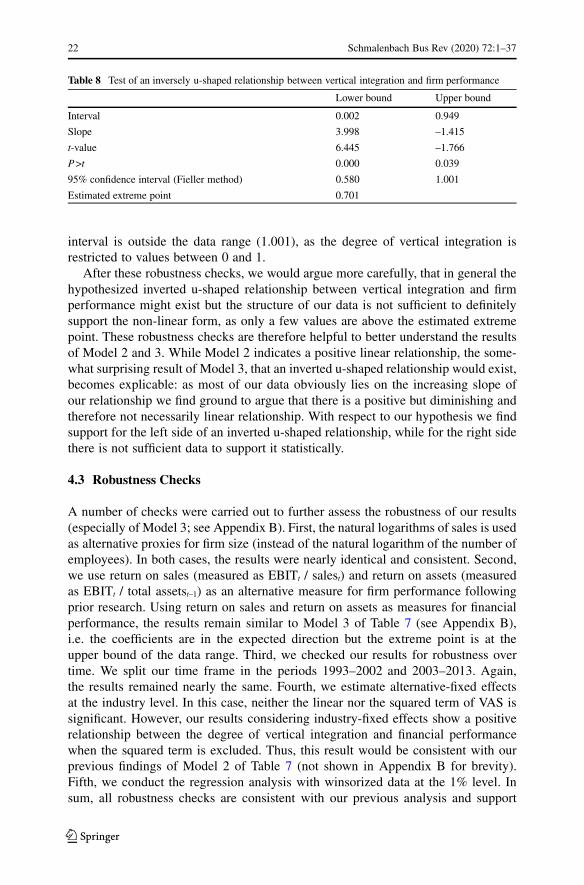
As shown in Table 7, condition (1) is met. The linear term of the value-added tosales ratio is positive and significant (4.008) and the squared term is negative andsignificant (–2.857). The results for conditions (2) and (3) are shown in Table 8.
The slope at the lower bound of the data range of vertical integration is negativeand significant and positive and significant at the upper bound. Thus, condition (2)is also met. However, a closer look at the confidence interval and the extreme pointshows that condition (3) is not met. In particular, the estimated extreme point is notwell within the data range of the value-added to sales ratios. This is caused by ourdata, because only 21 observations out of our 3848 firm-year observations are abovethe estimated extreme point. Furthermore, the upper bound of the 95% confidence
K
22 Schmalenbach Bus Rev (2020) 72:1–37
Table 8 Test of an inversely u-shaped relationship between vertical integration and firm performance
Lower bound Upper bound
Interval 0.002 0.949
Slope 3.998 –1.415
t-value 6.445 –1.766
P>t 0.000 0.039
95% confidence interval (Fieller method) 0.580 1.001
Estimated extreme point 0.701
interval is outside the data range (1.001), as the degree of vertical integration isrestricted to values between 0 and 1.
After these robustness checks, we would argue more carefully, that in general thehypothesized inverted u-shaped relationship between vertical integration and firmperformance might exist but the structure of our data is not sufficient to definitelysupport the non-linear form, as only a few values are above the estimated extremepoint. These robustness checks are therefore helpful to better understand the resultsof Model 2 and 3. While Model 2 indicates a positive linear relationship, the some-what surprising result of Model 3, that an inverted u-shaped relationship would exist,becomes explicable: as most of our data obviously lies on the increasing slope ofour relationship we find ground to argue that there is a positive but diminishing andtherefore not necessarily linear relationship. With respect to our hypothesis we findsupport for the left side of an inverted u-shaped relationship, while for the right sidethere is not sufficient data to support it statistically.
4.3 Robustness Checks
A number of checks were carried out to further assess the robustness of our results(especially of Model 3; see Appendix B). First, the natural logarithms of sales is usedas alternative proxies for firm size (instead of the natural logarithm of the number ofemployees). In both cases, the results were nearly identical and consistent. Second,we use return on sales (measured as EBITt / salest) and return on assets (measuredas EBITt / total assetst–1) as an alternative measure for firm performance followingprior research. Using return on sales and return on assets as measures for financialperformance, the results remain similar to Model 3 of Table 7 (see Appendix B),i.e. the coefficients are in the expected direction but the extreme point is at theupper bound of the data range. Third, we checked our results for robustness overtime. We split our time frame in the periods 1993–2002 and 2003–2013. Again,the results remained nearly the same. Fourth, we estimate alternative-fixed effectsat the industry level. In this case, neither the linear nor the squared term of VAS issignificant. However, our results considering industry-fixed effects show a positiverelationship between the degree of vertical integration and financial performancewhen the squared term is excluded. Thus, this result would be consistent with ourprevious findings of Model 2 of Table 7 (not shown in Appendix B for brevity).Fifth, we conduct the regression analysis with winsorized data at the 1% level. Insum, all robustness checks are consistent with our previous analysis and support
K
Schmalenbach Bus Rev (2020) 72:1–37 23
our main finding of a positive (but diminishing) relationship between the degree ofvertical integration and financial performance.
5 Discussion
Our study reveals two key results. First, we detect a positive but diminishing andtherefore not necessarily linear relationship between vertical integration and firmperformance for German manufacturing firms and find partial support for our hy-pothesis. Even if our data structure is not in total support of the inverted u-shapedrelationship, as the maximum point lies at the extreme range of our sample, ourempirical analysis suggests a positive but rather diminishing relationship betweenthe vertical integration level and financial performance. As there are only some datapoints beyond the turning point, this might at least indicate an inverted u-shaped re-lationship from a theoretical point of view, although there is not sufficient data fromGerman manufacturing firms to empirically support it. From a methodological pointof view, our study extends prior research as it assumes a non-linear relationship be-tween the degree of vertical integration and firm performance and conducts furtherrobustness checks to investigate the hypothesized u-shaped relationship by applyinga three step procedure. But perhaps more importantly, from a material point of viewour results indicate that the advantages of a higher degree of vertical integrationoutweigh the disadvantages in most cases for German manufacturing firms. Or inother words: German manufacturing firms have obviously been surprisingly capableto gainfully manage relatively high degrees of vertical integration. Hence, for thelongstanding, in literature and practice popularized and very broadly generalizedproposition that lowering vertical integration would increase financial performanceof firms per se, we find no supporting evidence in our sample; i.e. the managementparadigm of vertical dis-integration requires revision—at least for German man-ufacturing firms. From a managerial perspective, managers should be cautious infollowing management fashions and fads in general and vertical disintegration andoutsourcing as a redeemer in special. Managers should therefore not simply believein an expected increase of firm performance through vertical disintegration per se,as recommended by some lean management gurus (Lonsdale and Cox 2000). More-over, our results give reason to encourage managers not only to critically reflectpotential disintegration strategies but also to reconsider potential integration strate-gies as we are able to show that financially successful German manufacturing firmswere able to manage levels of vertical integration far beyond what was expected.Managers might find it therefore helpful to think about the advantages (disadvan-tages) of vertical integration or disintegration strategies rather as goals (threats) tobe achieved (avoided). Besides, the performance outcomes of such strategies mightneed closer monitoring in order to better understand and control cause and effects.
As a second key result, we are able to show a decreasing trend of vertical integra-tion for German manufacturing firms over the time frame of our study, while havingfound a positive but diminishing relationship between the degree of vertical integra-tion and financial performance. From a theoretical point of view, this finding mightdepend on the stage and starting point of the outsourcing process of firms. Various
K

24 Schmalenbach Bus Rev (2020) 72:1–37
scenarios are imaginable: Thus, there might be a negative (positive) relationship be-tween vertical integration and performance at work for firms with excessively high(low) integration levels which are in an early stage of their outsourcing process.In accordance with our findings, excessive vertical disintegration below the opti-mal level might confront firms with an initial degree of vertical integration below(above) the optimal level surrounded by an area of a positive (negative) relation-ship and therefore negative (positive) performance effects. As our empirical resultshighlight on average a positive diminishing relationship for our sample, it appearsthat firms which might have outsourced too much of their activities could have beenfallen below an optimal level of vertical integration, or that firms could have beenmuch more capable in managing even higher vertical integration levels. This empir-ical coincidence of decreasing vertical integration surrounded by a positive verticalintegration-performance-relationship raises further questions. The most interestingquestion for us seems to be why firms reduced the degree of vertical integrationover decades, although, as our results suggest, this decline is associated with de-creasing financial performance on average. We term this the paradox of verticaldisintegration, which will be elaborated in detail in the following subsections byproviding several arguments such as: (a) (reversed) causality, (b) structural inertiaand the bandwagon effect, (c) management fashions, (d) the shareholder value para-dox, (e) lack of knowledge and uncertainty and (f) supply chain control in order todiscuss why managers might have gone too far in reducing the degree of verticalintegration by following a management paradigm focused on core competencies andoutsourcing although this might have been detrimental to the financial performanceof the firm.
5.1 (a) (Reversed) Causality
The development of vertical integration over time varies across performance quan-tiles, as shown above (see Sect. 4.1). Thus, instead of interpreting performance asa function of vertical integration, the latter could also be a function of performance.Several arguments might reason vertical integration as a function of performance.First of all, vertical integration is a complex, cost intensive and hard to reverse strat-egy (Stuckey and White 1993). Secondly, a high degree of vertical integration offersa number of potential benefits as it improves coordination and scheduling, reducesforeclosure to inputs, services or markets, increases the opportunity to create prod-uct differentiation (Harrigan 1984), builds higher market entry barriers for potentialcompetitors (Mahoney 1992) and helps to develop a market in young industries(Stuckey and White 1993). But firms need to be able to afford these very cost-intense benefits. As a third argument, there are a number of challenges which couldarise from a high degree of vertical integration; e.g. increasing operating leveragedue to a disadvantageous cost structure (Gilley and Rasheed 2000), increasing cap-ital required and bureaucratic costs and increasing required management capacityand capability as well as decreasing strategic flexibility (Mahoney 1992). Therefore,low performing firms may try to reduce costs and risks which arise from these chal-lenges by reducing their degree of vertical integration. Fourth, as Hutzschenreuterand Gröne (2009) show firms which reduce their degree of vertical integration are
K
Schmalenbach Bus Rev (2020) 72:1–37 25
faced with higher competitive pressure from foreign competition; i.e. higher com-petitive pressure could trigger vertical disintegration. Based on these results, firmsmight become less profitable while facing higher competitive pressure and beingtherefore forced to decrease their vertical integration. In sum, the issue of causalityis hard to tackle, as not only the direction but also the causality between verti-cal integration and performance might switch under certain circumstances. Whilefirms with low performance might have been forced into vertical disintegration thisis not the same as to say lowering vertical integration will increase performance;even more taking into account that the underlying relationship is assumed to be aninverted u-shape.
5.2 (b) Structural Inertia and the Bandwagon Effect
In general, structural inertia exists if “organizations respond relatively slowly tothe occurrence of threats and opportunities in their environments” (Hannan andFreeman 1984), while outsourcing inertia can be defined as “the slow adaptationby organizations to changing circumstances that accommodate higher outsourcinglevels” (Mol and Kotabe 2011) under which firms may suffer. We therefore arguethat inertia prevents firms from responding quickly to changes in business processesafter outsourcing manufacturing activities. Outsourcing inertia could therefore bedetrimental for business performance. Mol and Kotabe (2011) detect a negative re-lationship between a firm’s outsourcing inertia and its performance. Furthermore,Desyllas (2009) finds time-lag effects between vertical disintegration and improve-ments of business performance of firms, due to short performance declines beforeachieving higher performance levels in later periods (Desyllas 2009). These find-ings indicate the existence of significant disintegration costs which reduce financialperformance at a first glance. Those consist of restructuring costs, costs of organi-zational redesign or investments in information and communication technologies.Firms need to be able to handle such disintegration costs.
5.3 (c) Management Fashions
Vertical (dis-)integration is not a trivial but rather a serious interference in busi-ness processes which takes a long time. Nevertheless, managers might have been“infected” by some best practice reports on outsourcing decisions; e.g. during theearly 1990s by Japanese competitors and their reliance on the philosophy of leanmanagement and so called keiretsu alliances with external suppliers (Womack andJones 1994). While Mol and Kotabe (2011) argue that bandwagon effects mighthelp to overcome initial inertia by providing outsourcing guidelines for managers,we propose that a bandwagon effect could lead to even more detrimental outsourcingprojects which consequently results in “overriding the system”. Accordingly, Cabralet al. (2014) find that bandwagon behavior is one reason for outsourcing failure. Theiranalyses indicate that managers have been influenced by business schools, scholars,consultants and other managers “who brought that (outsourcing) into the organiza-tion” (Cabral et al. 2014; p. 369). Thus, their results highlight the view on verticaldisintegration during the 1990s as a management fashion because “[o]utsourcing
K
26 Schmalenbach Bus Rev (2020) 72:1–37
was a fever” because “[e]verybody was outsourcing” (Cabral et al. 2014, p. 369).Management fashions in general describe a collective belief that a management tech-nique is new, efficient, and at the forefront of management progress (Abrahamson1996). This belief increases pressure on organizations to adopt the “managementtool” because firms’ stakeholders expect managers to employ modern and efficienttechniques to manage their organizations (Meyer and Rowan 1977). Kieser (1997)further argues that management fashions create myths of extraordinary performancewhich are initiated and further transmitted by rhetoric, either by managers or con-sultants. As vertical disintegration and the expected success is always a firm specificdecision and result, one firm’s success is not a guarantee for disintegration successper se as the circumstances always need to be taken into account. Furthermore, theremight have existed fadlike dynamics; i.e. mechanisms of overtaking beliefs of oth-ers, observational learning and therefore ignoring own information and emulatingchoices made earlier by other firms (Bikhchandani et al. 1998).2 With respect tovertical disintegration, Broedner et al. (2009) point out that there might have beentoo many outsourcing projects which could be detrimental for financial performance.This is in line with recent reports such as Bain’s Management Tools and Trends 2015which reveal that outsourcing has the lowest satisfaction rates among managers inrelation to the use of this management tool (Rigby and Bilodeau 2015). Moreover,recent research examines reasons why firms re-insource or re-integrate activities thathad been outsourced before (e.g. Drauz 2014; Hartman et al. 2017). These reasonsconsist of hidden costs of outsourcing, external triggers like the recent financial cri-sis or supply chain disruptions and rethinking of core competencies, indicating thatmanagers recently might have recognized or revalued contrary to their longstandingbelief that the opportunities of vertical integration might outweigh the challengesunder certain circumstances.
5.4 (d) Shareholder Value Paradox
Since the 1990s, the shareholder value approach dominates the behavior of manymanagers. Accordingly, managers might want to reduce the degree of vertical in-tegration in order to reduce capital employed and as an expected consequence toincrease shareholder value. This will usually be stimulated by compensation schemeswhich rely on annual accounting-based performance measures (Das et al. 2009). Buteven if managers would find a strategy to vertically integrate reasonable, the para-dox could emerge that they would not do so, if this strategy would reduce theircompensation. This paradox might be strengthened by short-term oriented (and im-patient) managers, often propelled by incentive schemes based on annual accountingnumbers, when potential benefits are in the further future while the costs of addi-tional capital required immediately appear causing managerial compensation to drop.Furthermore, conducting too many vertical integration projects during their tenurewould be detrimental for business performance, as the process of vertical integra-
2 Shiller (2017) recently pointed out the relevance of popular narratives in economics when they spreadout over markets like epidemics causing irrational exuberance.
K
Schmalenbach Bus Rev (2020) 72:1–37 27
tion takes a certain amount of time and the organizations need time to adapt to newcircumstances.
5.5 (e) Lack of Knowledge and Uncertainty
Another argument is concerned with the lack of knowledge and the uncertaintywhich firms have to face when deciding to vertically integrate or to disintegrate.Lack of knowledge in this context, refers to knowledge about a firm’s initial positionon the inverted u-shaped relationship of vertical integration and performance, themeasurement of costs related to vertical (dis-)integration and the identification ofcore and non-core competencies. Uncertainty refers to the difficulties in forecastingthe performance outcomes of (dis-)integration decisions.
On the one hand, lack of knowledge about a firm’s initial position can causedifficulties when deciding to vertically disintegrate. Reconsidering Fig. 2 illustratesthe inverted u-shaped relationship: assuming that a firm’s starting point is A, itwould be profitable if the firm vertically integrates. However, an initial degree ofvertical integration related to point B would suggest vertical disintegration. Buthow should firms be aware of their optimal vertical integration level? This questionis obviously hard to be answered, but if management fashion tells managers thatvertical disintegration is favorable per se, there is significant probability that theymay choose the wrong direction.
On the other hand, lack of knowledge related to the measurement of costs ofvertical (dis-)integration and the characterization of core competencies may leadmanagers to solely take production costs (especially labor costs) into account ratherthan a combination of transaction costs and the competence perspective.
Sinn (2005) analyzes the decreasing trend of vertical integration in the Germanmanufacturing sector, a phenomenon he denoted as a “bazaar economy”, arguesthat vertical disintegration of German manufacturing firms was mainly motivated bylower labor costs in low-cost countries. One of his main arguments for the decreas-ing trend is the increase of foreign external sourcing (especially from East Europeand China) compared to a more or less low increase of value-added. It is doubtful ifmanagers have sufficiently taken into account other influencing variables than poten-tial advantages through lower labor costs, as the measurement of transaction costs isdifficult (if not impossible) in general, therefore often denoted as the “hidden costsof outsourcing” (Hendry 1995), related to outsourcing towards low-cost countriesand unproven suppliers (Gümüs et al. 2012). And of course, cost savings throughlower labor costs could have been (over-)compensated by higher transactions costsor strategic risks related to a loss of control over competencies. Even worse: laborcosts in China and East Europe have increased over the last 20 years so that verticaldisintegration has become less attractive over time. Furthermore, if managers decideto outsource non-core activities, they have to clearly distinguish between core andnon-core competencies in a first step as only the latter should be outsourced in orderto gain competitive advantage and to improve firm performance. But the appropri-ate identification of core and non-core competencies is a non-trivial decision formanagers. As Prahalad and Hamel (1990) point out only outsourcing of non-corecompetencies leads to competitive advantages, (German) manufacturing firms (in
K
28 Schmalenbach Bus Rev (2020) 72:1–37
particular low performing firms) may have outsourced too many and thereby alsothe wrong ones, i.e. core activities. Hartman et al. (2017) point out that the revivalof vertical integration since the onset of the recent financial crisis is, among others,attributed to firms rethinking their core competencies. Overall, managers have rec-ognized the uncertainty related to the outsourcing decision as a risk in their supplychains (Kenyon et al. 2016).
5.6 (f) Supply Chain Control
Firms that (are forced to) reduce their degree of vertical integration might losesufficient control over their supply chain. Hendricks and Singhal (2005) show ina seminal study that supply chain disruptions may cause severe damage to share-holder value, i.e. control of supply chains is a key performance driver. But howcould firms with a low degree of vertical integration keep control over their supplychain and remain successful yet? One option might be a form of quasi-integrationlike strategic alliances. Previous research has shown that firms with a low degreeof vertical integration but high control over the value chain through supply chainintegration gain competitive advantages (Dietl et al. 2009). However, such quasi-integrations require investments and management capacities as well and low per-forming firms have neither capacity for real nor quasi integration to keep theirsupply chain under control. Our previous arguments have shown that especially lowperforming firms have reduced their degree of vertical integration significantly forseveral reasons. But while such firms could not afford a sufficiently higher degreeof vertical integration, and tried to achieve cost savings by lowering their degree ofvertical integration, they slipped into the paradox of vertical disintegration.
6 Conclusion
Our study theoretically establishes and empirically investigates a hypothesized in-verted u-shaped relationship between the degree of vertical integration and financialperformance for a large sample of German manufacturing firms using longitudinaldata. To put it in a nutshell: Considering the inverted u-shaped relationship betweenvertical integration and performance we interpret its right half, beyond the turningpoint, as the longstanding management paradigm of vertical disintegration. Accord-ingly disintegration would enhance performance, although nearly no firm level dataof our sample describes that part. In contrast, most of the data fills the left half ofthe inverted u-shaped relationship, below the turning point, for which we are ableto detect a positive but diminishing and therefore non-linear relationship betweenvertical integration and firm performance, which coincides with a decreasing trendof vertical integration for German manufacturing firms, and discuss this paradoxof vertical disintegration in detail. The decreasing trend mainly emerges becauselower performing firms outsourced their activities significantly whereas high per-forming firms do not show such a development. Overall, our results indicate thatGerman manufacturing firms might have gone too far in in their vertical disintegra-tion strategy by following a management paradigm which needs much more critical
K
Schmalenbach Bus Rev (2020) 72:1–37 29
reflection. Obviously, a high degree of vertical integration costs money, but providesa bundle of advantages with respect to firm performance as well. Financially suc-cessful firms can afford such a strategy and cope with the challenges of a high degreeof vertical integration while low performing firms cannot. This might be a reasonwhy low performing firms reduced their degree of vertical integration during thelast decades. Our results therefore suggest a much more sophisticated evaluation ofvertical (dis-)integration strategies. On the one hand it should be paid much moreattention how to realize the benefits of vertical integration. And on the other handa considerable amount of critical reflection of expected benefits of vertical disinte-gration is required which might have been overestimated over a long time, ignoringthe detrimental effects of vertical disintegration on financial performance.
Of course, our study also has some limitations which nevertheless might openfruitful avenues for further research. First, further analyses might be helpful in clari-fying the interplay of causality as we have indicated that poor performing firms havereduced their degree of vertical integration more than high and medium perform-ing firms. Second, by focusing on the manufacturing sector, we provide insightsfor a major industry. Future research could examine if the hypothesized invertedu-shaped relationship between the degree of vertical integration and financial per-formance holds for other industry sectors, as the degree of vertical integration alsoplays an important role in other industrial sectors, which are still largely unexplored.Third, it can be assumed that there are many more boundary conditions at work,which influence the relationship between vertical integration and financial perfor-mance. We did not offer this research but tried to pave the way. It would thereforebe a deserving task to further investigate moderating effects, to get more and deeperinsights into such a relevant and fundamental issue of business economics at theinterface of operations, accounting and strategy.
Acknowledgements We gratefully acknowledge the associate editor and two anonymous reviewers aswell as session discussants of the 27th annual POMS conference and of the 79th annual VHB conferencefor their helpful comments and suggestions to improve our paper.
Funding Open Access funding provided by Projekt DEAL.
Open Access This article is licensed under a Creative Commons Attribution 4.0 International License,which permits use, sharing, adaptation, distribution and reproduction in any medium or format, as long asyou give appropriate credit to the original author(s) and the source, provide a link to the Creative Com-mons licence, and indicate if changes were made. The images or other third party material in this articleare included in the article’s Creative Commons licence, unless indicated otherwise in a credit line to thematerial. If material is not included in the article’s Creative Commons licence and your intended use is notpermitted by statutory regulation or exceeds the permitted use, you will need to obtain permission directlyfrom the copyright holder. To view a copy of this licence, visit http://creativecommons.org/licenses/by/4.0/.
K

30 Schmalenbach Bus Rev (2020) 72:1–37
Appendix
Appendix A: Time-series Analysis of VAS Means Grouped by ROS and ROA1993–2013
(1) Mean Value-added to Sales Grouped by ROS
Grouped by Selection Category β SE T p R2
ROS Low 20% –0.005*** 0.001 –9.278 0.000 0.819
Mid 20% –0.002*** 0.001 –3.577 0.002 0.402
High 20% 0.001 0.001 1.418 0.172 0.096
Low–High –0.006*** 0.001 –5.557 0.000 0.619
All –0.002*** 0.000 –5.367 0.000 0.603SE standard error*p<0.1; **p<0.05; ***p<0.01
(2) Mean Value-added to Sales Grouped by ROA
Grouped by Selection Category β SE T p R2
ROS Low 20% –0.005*** 0.001 –7.569 0.000 0.751
Mid 20% –0.002*** 0.001 –3.280 0.004 0.361
High 20% 0.001 0.001 1.727 0.100 0.136
Low–High –0.006*** 0.001 –6.245 0.000 0.672
All –0.002*** 0.000 –5.367 0.000 0.603SE standard error*p<0.1; **p<0.05; ***p<0.01
K

Schmalenbach Bus Rev (2020) 72:1–37 31
Appendix B: Robustness Checks
Ln(sales)
ROS
ROA
1992–2002
2003–2013
Industry-fixed
effects
Winsorized
data
Value-added
tosales
3.827***
(6.39)
1.004***
(7.90)
1.374***
(12.02)
4.040***
(5.17)
4.138***
(6.24)
0.492
(0.64)
4.094***
(–5.58)
(Value-added
tosales)2
–2.460***
(–3.64)
–0.463**
(–2.40)
–0.959***
(–7.24)
–2.606***
(–2.66)
–2.429***
(–3.15)
1.563
(1.32)
–2.9***
(–2.93)
Firm
size
0.065
(0.87)
0.001
(0.07)
–0.002
(–0.19)
–0.247***
(–2.71)
–0.149***
(–2.78)
–0.077***
(–4.05)
–0.161**
(–2.50)
Salesgrow
th0.001
(1.00)
0.000***
(2.59)
0.004***
(3.23)
0.001
(1.13)
0.008**
(2.14)
0.002
(1.59)
0.347***
(–4.15)
Marketshare
–0.107
(–0.33)
0.077**
(2.20)
0.098**
(1.99)
0.591
(1.45)
1.540***
(3.66)
0.376*
(1.68)
0.401
(–1.3)
Herfin
dahl-
Hirschm
an–0.143
(–0.81)
–0.041*
(–1.87)
–0.052
(–1.61)
–0.172
(–0.91)
–0.978***
(–2.75)
–0.187
(–0.94)
–0.203
(–1.13)
Firm
age
–0.446***
(–2.74)
–0.004
(–0.30)
–0.041*
(–1.89)
–0.687*
(–1.87)
–0.202
(–1.05)
–0.086***
(–3.36)
–0.318**
(–2.33)
Debtratio
–0.681***
(–3.31)
–0.052
(–1.62)
–0.112***
(–2.64)
–0.483*
(–1.84)
–0.227
(–0.84)
–1.807***
(–9.97)
–0.586**
(–2.59)
Diversification
0.064
(1.16)
–0.010
(–0.72)
0.008
(0.60)
–0.002
(–0.02)
0.157***
(2.69)
–0.224**
(–2.31)
0.077
(–1.25)
Dynam
ism
–0.025
(–0.08)
–0.023
(–0.74)
–0.052
(–1.08)
0.302
(0.38)
–0.085
(–0.34)
–0.268
(–0.67)
–0.038
(–0.12)
Capitalintensity
–0.663
(–1.46)
–0.036
(–1.05)
–0.086**
(–2.07)
–0.487
(–1.64)
–1.214***
(–3.86)
–1.081***
(–4.05)
–1.145***
(–3.16)
Exportratio
–0.188
(–1.53)
0.029
(1.60)
0.022
(1.32)
–0.240
(–1.23)
–0.117
(–0.93)
0.064
(0.63)
–0.113
(–0.94)
K

32 Schmalenbach Bus Rev (2020) 72:1–37
Ln(sales)
ROS
ROA
1992–2002
2003–2013
Industry-fixed
effects
Winsorized
data
Constant
0.676**
(0.50)
–0.223***
(–3.28)
–0.085
(–0.78)
4.457**
(2.17)
1.434*
(1.82)
2.382**
(2.56)
2.143**
(–2.45)
Yeareffectsin-
cluded
Yes
Yes
Yes
Yes
Yes
Yes
Yes
Firm
-fixedeffects
Yes
Yes
Yes
Yes
Yes
No
Yes
Observatio
ns3848
3,848
3,848
1,819
2,029
3848
3,848
Num
berof
Firm
s434
434
434
434
434
434
434
With
inR2
0.16
0.412
0.381
0.192
0.204
0.25
0.18
F10.319
20.315
19.291
8.397
10.741
8.36
11.784
Thistableshow
stheresults
oftherobustness
checks
ofModel3of
Table7thatwerecarriedoutinthestudy
Inthesecond
columnwemeasure
firm
size
with
thenaturallogarithm
ofsalesinsteadof
numberof
employees(inallothermodel
wemeasure
Firm
size
with
the
naturallogarith
mof
thenumberof
employees)
Incolumn3and4,wereplaceourmeasure
offin
ancial
performance
(Altm
an’sZ-Score)with
return
onsalesandreturn
onassets
Afurtherregression
analysisisconductedfortwonon-overlappingtim
eperiodsin
columns
5and6
The
regression
results
intheseventhcolumnarebasedon
aregression
with
industry-fixedeffectsrather
than
firm-fixedeffects.The
lastcolumnreportsregression
results
basedon
winsorizeddataatthe1%
level
K

Schmalenbach Bus Rev (2020) 72:1–37 33
Appendix C: Robustness Test of the Inverted u-shaped Relationship
(1) Ln(sales)
Modification: ln(sales)
Lower bound Upper bound
Interval 0.002 0.949
Slope 3.819 –0.842
t-value 6.403 –1.104
P>t 0.000 0.135
95% confidence interval—Fieller method 0.629 1.229
Estimated extreme point 0.778
(2) Return on Sales and Return on Assets
Dependent variable
ROS ROA
Lower bound Upper bound Lowerbound
Upperbound
Interval 0.002 0.949 0.002 0.949
Slope 1.002 0.124 1.371 –0.447
t-value Extremum outsideinterval—trivialrejection of H0
12.035 –2.786
P>t 0.000 0.003
95% confidence inter-val—Fieller method
0.722 4.656 0.629 0.857
Estimated extreme point 1.083 0.716
(3) Time Split
Modification: time split1993–2002
Modification: time split2003–2013
Lower bound Upper bound Lower bound Upper bound
Interval 0.002 0.949 0.002 0.949
Slope 4.031 –0.906 4.130 –0.473
t-value 5.182 –0.781 6.249 –0.530
P>t 0.000 0.218 0.000 0.298
95% confidence inter-val—Fieller method
0.587 1.940 0.657 1.628
Estimated extreme point 0.775 0.852
K
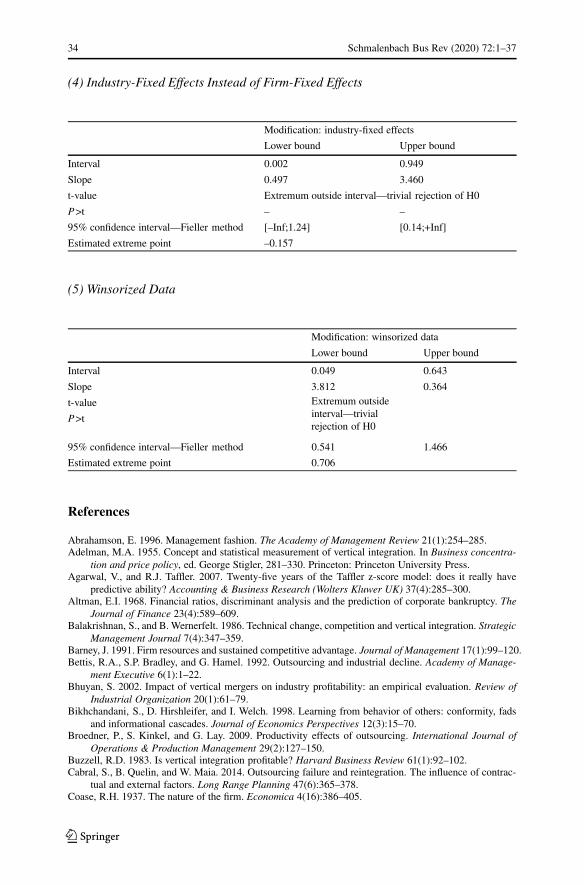
34 Schmalenbach Bus Rev (2020) 72:1–37
(4) Industry-Fixed Effects Instead of Firm-Fixed Effects
Modification: industry-fixed effects
Lower bound Upper bound
Interval 0.002 0.949
Slope 0.497 3.460
t-value Extremum outside interval—trivial rejection of H0
P>t – –
95% confidence interval—Fieller method [–Inf;1.24] [0.14;+Inf]
Estimated extreme point –0.157
(5) Winsorized Data
Modification: winsorized data
Lower bound Upper bound
Interval 0.049 0.643
Slope 3.812 0.364
t-value Extremum outsideinterval—trivialrejection of H0
P>t
95% confidence interval—Fieller method 0.541 1.466
Estimated extreme point 0.706
References
Abrahamson, E. 1996. Management fashion. The Academy of Management Review 21(1):254–285.Adelman, M.A. 1955. Concept and statistical measurement of vertical integration. In Business concentra-
tion and price policy, ed. George Stigler, 281–330. Princeton: Princeton University Press.Agarwal, V., and R.J. Taffler. 2007. Twenty-five years of the Taffler z-score model: does it really have
predictive ability? Accounting & Business Research (Wolters Kluwer UK) 37(4):285–300.Altman, E.I. 1968. Financial ratios, discriminant analysis and the prediction of corporate bankruptcy. The
Journal of Finance 23(4):589–609.Balakrishnan, S., and B.Wernerfelt. 1986. Technical change, competition and vertical integration. Strategic
Management Journal 7(4):347–359.Barney, J. 1991. Firm resources and sustained competitive advantage. Journal of Management 17(1):99–120.Bettis, R.A., S.P. Bradley, and G. Hamel. 1992. Outsourcing and industrial decline. Academy of Manage-
ment Executive 6(1):1–22.Bhuyan, S. 2002. Impact of vertical mergers on industry profitability: an empirical evaluation. Review of
Industrial Organization 20(1):61–79.Bikhchandani, S., D. Hirshleifer, and I. Welch. 1998. Learning from behavior of others: conformity, fads
and informational cascades. Journal of Economics Perspectives 12(3):15–70.Broedner, P., S. Kinkel, and G. Lay. 2009. Productivity effects of outsourcing. International Journal of
Operations & Production Management 29(2):127–150.Buzzell, R.D. 1983. Is vertical integration profitable? Harvard Business Review 61(1):92–102.Cabral, S., B. Quelin, and W. Maia. 2014. Outsourcing failure and reintegration. The influence of contrac-
tual and external factors. Long Range Planning 47(6):365–378.Coase, R.H. 1937. The nature of the firm. Economica 4(16):386–405.
K
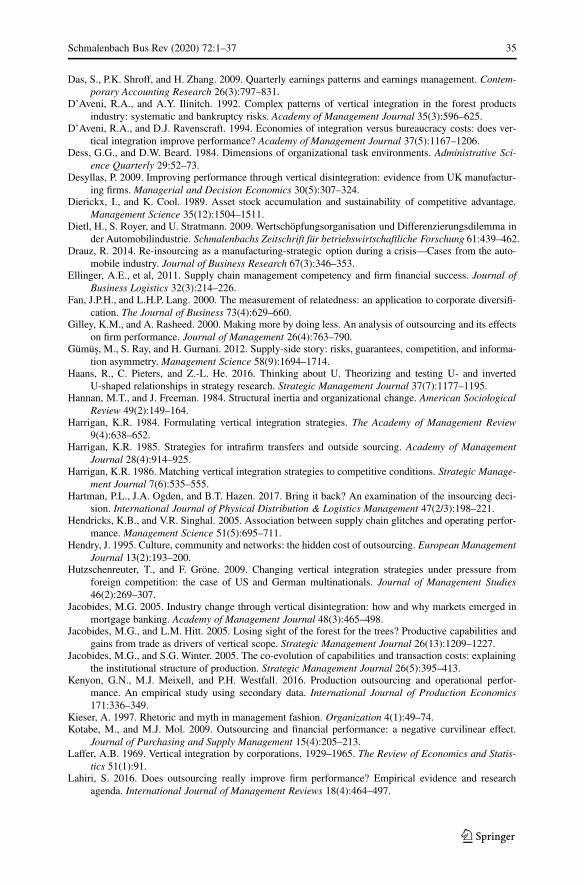
Schmalenbach Bus Rev (2020) 72:1–37 35
Das, S., P.K. Shroff, and H. Zhang. 2009. Quarterly earnings patterns and earnings management. Contem-porary Accounting Research 26(3):797–831.
D’Aveni, R.A., and A.Y. Ilinitch. 1992. Complex patterns of vertical integration in the forest productsindustry: systematic and bankruptcy risks. Academy of Management Journal 35(3):596–625.
D’Aveni, R.A., and D.J. Ravenscraft. 1994. Economies of integration versus bureaucracy costs: does ver-tical integration improve performance? Academy of Management Journal 37(5):1167–1206.
Dess, G.G., and D.W. Beard. 1984. Dimensions of organizational task environments. Administrative Sci-ence Quarterly 29:52–73.
Desyllas, P. 2009. Improving performance through vertical disintegration: evidence from UK manufactur-ing firms.Managerial and Decision Economics 30(5):307–324.
Dierickx, I., and K. Cool. 1989. Asset stock accumulation and sustainability of competitive advantage.Management Science 35(12):1504–1511.
Dietl, H., S. Royer, and U. Stratmann. 2009. Wertschöpfungsorganisation und Differenzierungsdilemma inder Automobilindustrie. Schmalenbachs Zeitschrift für betriebswirtschaftliche Forschung 61:439–462.
Drauz, R. 2014. Re-insourcing as a manufacturing-strategic option during a crisis—Cases from the auto-mobile industry. Journal of Business Research 67(3):346–353.
Ellinger, A.E., et al, 2011. Supply chain management competency and firm financial success. Journal ofBusiness Logistics 32(3):214–226.
Fan, J.P.H., and L.H.P. Lang. 2000. The measurement of relatedness: an application to corporate diversifi-cation. The Journal of Business 73(4):629–660.
Gilley, K.M., and A. Rasheed. 2000. Making more by doing less. An analysis of outsourcing and its effectson firm performance. Journal of Management 26(4):763–790.
Gümüs, M., S. Ray, and H. Gurnani. 2012. Supply-side story: risks, guarantees, competition, and informa-tion asymmetry. Management Science 58(9):1694–1714.
Haans, R., C. Pieters, and Z.-L. He. 2016. Thinking about U. Theorizing and testing U- and invertedU-shaped relationships in strategy research. Strategic Management Journal 37(7):1177–1195.
Hannan, M.T., and J. Freeman. 1984. Structural inertia and organizational change. American SociologicalReview 49(2):149–164.
Harrigan, K.R. 1984. Formulating vertical integration strategies. The Academy of Management Review9(4):638–652.
Harrigan, K.R. 1985. Strategies for intrafirm transfers and outside sourcing. Academy of ManagementJournal 28(4):914–925.
Harrigan, K.R. 1986. Matching vertical integration strategies to competitive conditions. Strategic Manage-ment Journal 7(6):535–555.
Hartman, P.L., J.A. Ogden, and B.T. Hazen. 2017. Bring it back? An examination of the insourcing deci-sion. International Journal of Physical Distribution & Logistics Management 47(2/3):198–221.
Hendricks, K.B., and V.R. Singhal. 2005. Association between supply chain glitches and operating perfor-mance. Management Science 51(5):695–711.
Hendry, J. 1995. Culture, community and networks: the hidden cost of outsourcing. European ManagementJournal 13(2):193–200.
Hutzschenreuter, T., and F. Gröne. 2009. Changing vertical integration strategies under pressure fromforeign competition: the case of US and German multinationals. Journal of Management Studies46(2):269–307.
Jacobides, M.G. 2005. Industry change through vertical disintegration: how and why markets emerged inmortgage banking. Academy of Management Journal 48(3):465–498.
Jacobides, M.G., and L.M. Hitt. 2005. Losing sight of the forest for the trees? Productive capabilities andgains from trade as drivers of vertical scope. Strategic Management Journal 26(13):1209–1227.
Jacobides, M.G., and S.G. Winter. 2005. The co-evolution of capabilities and transaction costs: explainingthe institutional structure of production. Strategic Management Journal 26(5):395–413.
Kenyon, G.N., M.J. Meixell, and P.H. Westfall. 2016. Production outsourcing and operational perfor-mance. An empirical study using secondary data. International Journal of Production Economics171:336–349.
Kieser, A. 1997. Rhetoric and myth in management fashion. Organization 4(1):49–74.Kotabe, M., and M.J. Mol. 2009. Outsourcing and financial performance: a negative curvilinear effect.
Journal of Purchasing and Supply Management 15(4):205–213.Laffer, A.B. 1969. Vertical integration by corporations, 1929–1965. The Review of Economics and Statis-
tics 51(1):91.Lahiri, S. 2016. Does outsourcing really improve firm performance? Empirical evidence and research
agenda. International Journal of Management Reviews 18(4):464–497.
K

36 Schmalenbach Bus Rev (2020) 72:1–37
Lahiri, N., and S. Narayanan. 2013. Vertical integration, innovation, and alliance portfolio size: implica-tions for firm performance. Strategic Management Journal 34(9):1042–1064.
Lajili, K., M. Madunic, and J.T. Mahoney. 2007. Testing organizational economics theories of verticalintegration. In Research methodology in strategy and management, Vol. 4, ed. David Ketchen, DonBerg, 343–368. Amsterdam: Elsevier.
Levin, R.C. 1981. Vertical integration and profitability in the oil industry. Journal of Economic Behavior& Organization 2(3):215–235.
Levinthal, D.A. 1997. Adaptation on rugged landscapes. Management Science 43(7):934–950.Lind, J.T., and H. Mehlum. 2010. With or without U? The appropriate test for a U-shaped relationship.
Oxford Bulletin of Economics and Statistics 72(1):109–118.Lindstrom, G., and E. Rozell. 1993. Is there a true measure of vertical integration? American Business
Review 11(1):44.Lonsdale, C., and A. Cox. 2000. The historical development of outsourcing: the latest fad? Industrial
Management & Data Systems 100(9):444–450.Maddigan, R.J. 1981. The measurement of vertical integration. The Review of Economics and Statistics
63(3):328–335.Mahoney, J.T. 1992. The choice of organizational form: vertical financial ownership versus other methods
of vertical integration. Strategic Management Journal 13(8):559–584.McIvor, R. 2009. How the transaction cost and resource-based theories of the firm inform outsourcing
evaluation. Journal of Operations Management 27(1):45–63.Meyer, J.W., and B. Rowan. 1977. Institutionalized organizations: formal structure as myth and ceremony.
American Journal of Sociology 83(2):340–363.Mol, M.J., and M. Kotabe. 2011. Overcoming inertia. Drivers of the outsourcing process. Long Range
Planning 44(3):160–178.Murphy, G.B., Trailer, J.W., and Hill, R.C., 1996. Measuring performance in entrepreneurship research.
Journal of Business Research, 36(1),15–23.Neely, A., M. Gregory, and K. Platts. 1995. Performance measurement system design: a literature
review and research agenda. International Journal of Operations and Production Management25(12):1228–1263.
Novak, S., and S. Stern. 2008. How does outsourcing affect performance dynamics? Evidence from theautomobile industry. Management Science 54(12):1963–1979.
Obermaier, R. 2019. Industrie 4.0 und Digitale Transformation als unternehmerische Gestaltungsaufgabe.In Handbuch Industrie 4.0 und Digitale Transformation: Betriebswirtschaftliche, technische undrechtliche Herausforderungen, 1st edn., ed. R. Obermaier, 3–46. Wiesbaden: Springer.
Obermaier, R., and A. Donhauser. 2012. Zero inventory and firm performance: a management paradigmrevisited. International Journal of Production Research 50(16):4543–4555.
Otto, A., and R. Obermaier. 2009. How can supply networks increase firm value? A causal framework tostructure the answer. Logistics Research 1:131–148.
Penrose, E. 1959. The theory of the growth of the firm. New York: John Wiley & Sons.Perry, M.K. 1978. Price discrimination and forward integration. The Bell Journal of Economics 9(1):209–217.Picot, A., and E. Franck. 1993. Vertikale Integration. In Ergebnisse betriebswirtschaftlicher Forschung: Zu
einer Realtheorie der Unternehmung – Festschrift für Eberhard Witte, ed. Jürgen Hauschildt, OskarGrün, 179–219. Stuttgart: Schaffer-Poeschel.
Prahalad, C.K., and G. Hamel. 1990. The core competence of the corporation. Harvard Business Review68(3):79–91.
Randall, T., S. Netessine, and N. Rudi. 2006. An empirical examination of the decision to invest in fulfill-ment capabilities: a study of Internet retailers. Management Science 52(4):567–580.
Rigby, D., and B. Bilodeau. 2015. Management tools & trends 2015. Boston: Bain and Company.Rothaermel, F.T., M.A. Hitt, and L.A. Jobe. 2006. Balancing vertical integration and strategic outsourcing:
effects on product portfolio, product success, and firm performance. Strategic Management Journal27(11):1033–1056.
Rumelt, R.P. 1982. Diversification strategy and profitability. Strategic Management Journal 3(4):359–369.Shi, M., and W. Yu. 2013. Supply chain management and financial performance: literature review and
future directions. International Journal of Operations & Production Management 33(10):1283–1317.Shiller, R.J. 2017. Narrative economics. American Economic Review 107(4):967–1004.Sinn, H.-W. 2005. Die Basar-Ökonomie. Deutschland Exportweltmeister oder Schlusslicht? Berlin: Econ.Steinker, S., M. Pesch, and K. Hoberg. 2016. Inventory management under financial distress. An empirical
analysis. International Journal of Production Research 54(17):5182–5207.
K
Schmalenbach Bus Rev (2020) 72:1–37 37
Stigler, G.J. 1951. The division of labor is limited by the extent of the market. Journal of Political Economy59(3):185–193.
Stuckey, J., and D. White. 1993. When and when “not” to vertically integrate. Sloan Management Review34(3):71–83.
Swamidass, P.M. 2007. The effect of TPS on US manufacturing during 1981–1998. Inventory increasedor decreased as a function of plant performance. International Journal of Production Research45(16):3763–3778.
Tucker, I.B., and R.P. Wilder. 1977. Trends in vertical integration in the U.S. manufacturing sector. TheJournal of Industrial Economics XXVI(1):81–94.
Venkatraman, N., and V. Ramanujam. 1986. Measurement of business performance in strategy research: acomparison of approaches. The Academy of Management Review 11(4):801–814.
Welch, J.A., and P.R. Nayak. 1992. Strategic Sourcing. A progressive approach to the make-or-buy deci-sion. The Executive 6(1):23–31.
Wernerfelt, B. 1984. A resource-based view of the firm. Strategic Management Journal 5(2):171–180.Williamson, O.E. 1971. The vertical integration of production: market failure considerations. The Ameri-
can Economic Review 61(2):112–123.Williamson, O.E. 1975. Markets and hierarchies: analysis and antitrust implications. New York: Free
Press.Williamson, O.E. 1981. The economics of organization: the transaction cost approach. American Journal
of Sociology 87(3):548–577.Williamson, O.E. 1991a. Comparative economic organization. The analysis of discrete structural alterna-
tives. Administrative Science Quarterly 36(2):269–296.Williamson, O.E. 1991b. Strategizing, economizing, and economic organization. Strategic Management
Journal 12:75–94. special issue: Fundamental research issues in strategy and economics.Womack, J.P., and D.T. Jones. 1994. From lean production to the lean enterprise. (cover story). Harvard
Business Review 72(2):93–103.
Publisher’s Note Springer Nature remains neutral with regard to jurisdictional claims in published mapsand institutional affiliations.
K