Veltman EA - 2012 - R - Next-Gen. Seq. and Id of Disease Genes
8
REVIEW Disease gene identification strategies for exome sequencing Christian Gilissen* ,1 , Alexander Hoischen 1 , Han G Brunner 1 and Joris A Veltman 1 Next generation sequencing can be used to search for Mendelian disease genes in an unbiased manner by sequencing the entire protein-coding sequence, known as the exome, or even the entire human genome. Iden tifyin g the pathogeni c mutation among st thousands to millions of genomic variants is a major challenge, and novel variant prioritization strategies are required. The choice of these strategies depends on the availability of well-phenotyped patients and family members, the mode of inheritance, the severity of the disease and its population frequency. In this review, we discuss the current strategies for Mendelian disease gene identific ation by exome resequen cing. We conclude that exome strategi es are successful and ident ify new Mende lian disease genes in approximately 60% of the projects. Improvements in bioinformatics as well as in sequencing technology will likely increase the success rate even further. Exome sequencing is likely to become the most commonly used tool for Mendelian diseas e gene identifica tion for the coming years. European Journal of Human Genetics (2012) 20, 490–497; doi: 10.1038/ejhg.2011.258; published online 18 January 2012 Keywords: Mendelian disease; gene identifi cation; strategies; next generation sequencing; exome sequencing INTRODUCTION The number of rare monogenic diseases is estimated to be 45000 and for half of these the underlying genes are unknown. 1 In addition, an increasing proportion of common diseases, such as intellectual dis- ability, schizophrenia, and autism, previously thought to be due to complex multifactorial inheritance, are now thought to represent a heter ogen eous coll ectio n of rar e mon ogen ic diso rde rs, 2–5 the larg e maj ori ty of which is sti ll unkno wn. The ide nt ific ati on of gen es responsible for these diseases enables molecular diagnosis of patients, as well as testing gene carriers and prenatal testing. Gene identificat ion represents the first step to a better understanding of the physiological role of the underlying protein and disease pathways, which in turn serves as a starting point for developing therapeutic interventions. 6 Rec ent adva nces in next gene ration sequ enci ng tech nolo gies hav e dra matic ally change d the proc ess of disea se gene iden tific atio n, in part icul ar by usin g exome sequ enc ing in whic h the prot ein- codi ng part of the genome of a patient can be studied in a single experiment (see Majewsk i et al 7 for an overview of exome sequencing technology and its applications). As tens of thousands of genomic variants can be identified in each exome, i t is important to carefully consider strategies for efficiently and robustly prioritizing pathogenic variants. In order to do so, much can be learned from traditional disease gene identi- fication approaches, but also novel strategies need to be established. TRADITIONAL DISEASE GENE IDENTIFICATION Pas t iden tific atio n of Men deli an dise ase genes was carried out by Sanger sequencing of candidate genes. Candidate genes can be selected because they resemble genes associated with similar diseases, because the predicted protein function seems relevant to the physiology of the disease, or because a positional mapping approach pointed to these gen es in a gen omi c re gion. 8 This la st approac h has been most successful as it does not rely on prior biological or medical knowledge and can be app lie d in an unbi ase d fa shi on. The mos t imp ortant genetic mapping approaches rely on karyotyping, 9 linkage analys is, 10 homozygosity mapping, 11 copy number variation analysis, 12 and SNP- bas ed asso ciat ion anal ysis . 13 One pr oblem as soc iat ed wit h us ing genetic mapping approaches is that it is difficult, if not impossible, to predict whether a disease is caused by a single nucleotide mutation or by structural genomic variation. Without family information it is also often difficul t to pred ict whet her a disease is dominantly or recessively inherited. Therefore, different mapping approaches often need to be applied in a sequential order before a disease locus is identified. In addition, these mapping approaches commonly do not reduce the number of candidate genes sufficiently for follow-up by Sanger sequencing, when the disease locus remains very large. This is especially the case if these mapping approaches are applied to only a single patient or family wi th a limited number of informative relatives . Combining data from multiple unrelated but phenotypically similar patients or families is useful to reduce this to a manageable number, but carries a risk that patients with similar phenotypes are affected by mutations in different genes. Alternatively, a candidate gene approach can be used to select the best candidate genes from the large disease locu s for Sang er sequ enci ng. Man y bioi nfor matics tool s hav e been dev elop ed to prio riti ze cand idat e dise ase gene s from diseas e gene loci. 14–16 Candidate gene selection is however critically dependent on prior knowledge and only few disease genes have been identified by specificall y using these bioinformatics tools. 17 A particular category of diseases that has remained largely unresolved is that of the rare genetic disorders that occur sporadically , and for which neither a family-b ased appr oach nor an asso ciat ion- base d appr oach can be used . Thes e Received 24 August 2011; revised 31 October 2011; accepted 7 December 2011; published online 18 January 2012 1 Department of Human Genetics, Nijmegen Centre for Molecular Life Sciences and Institute for Genetic and Metabolic Disorders, Radboud University Nijmegen Medical Centre, Nijmegen, The Netherlands *Corre sponde nce: C Gilisse n, Department of Human Genetics , Nijmeg en Centre for Molecular Life Scien ces and Instit ute for Genetic and Metabolic Disorde rs, Radboud University Nijmegen Medical Centre, 6500 HB Nijmegen, The Netherlands. Tel: +31243668940; E-mail: [email protected] European Journal of Human Genetics (2012) 20, 490–497 & 2012 Macmillan Publishers Limited All rights reserved 1018-4813/12 www.nature.com/ejhg
-
Upload
clark-xingzhi-zhang -
Category
Documents
-
view
215 -
download
0
Transcript of Veltman EA - 2012 - R - Next-Gen. Seq. and Id of Disease Genes

7/27/2019 Veltman EA - 2012 - R - Next-Gen. Seq. and Id of Disease Genes
http://slidepdf.com/reader/full/veltman-ea-2012-r-next-gen-seq-and-id-of-disease-genes 1/8
REVIEW
Disease gene identification strategies for exomesequencing
Christian Gilissen*,1, Alexander Hoischen1, Han G Brunner1 and Joris A Veltman1
Next generation sequencing can be used to search for Mendelian disease genes in an unbiased manner by sequencing the entire
protein-coding sequence, known as the exome, or even the entire human genome. Identifying the pathogenic mutation amongst
thousands to millions of genomic variants is a major challenge, and novel variant prioritization strategies are required. The
choice of these strategies depends on the availability of well-phenotyped patients and family members, the mode of inheritance,
the severity of the disease and its population frequency. In this review, we discuss the current strategies for Mendelian disease
gene identification by exome resequencing. We conclude that exome strategies are successful and identify new Mendelian
disease genes in approximately 60% of the projects. Improvements in bioinformatics as well as in sequencing technology will
likely increase the success rate even further. Exome sequencing is likely to become the most commonly used tool for Mendelian
disease gene identification for the coming years.
European Journal of Human Genetics (2012) 20, 490–497; doi:10.1038/ejhg.2011.258; published online 18 January 2012
Keywords: Mendelian disease; gene identification; strategies; next generation sequencing; exome sequencing
INTRODUCTION
The number of rare monogenic diseases is estimated to be 45000 and
for half of these the underlying genes are unknown.1 In addition, an
increasing proportion of common diseases, such as intellectual dis-
ability, schizophrenia, and autism, previously thought to be due to
complex multifactorial inheritance, are now thought to represent a
heterogeneous collection of rare monogenic disorders,2–5 the large
majority of which is still unknown. The identification of genes
responsible for these diseases enables molecular diagnosis of patients,
as well as testing gene carriers and prenatal testing. Gene identification
represents the first step to a better understanding of the physiological
role of the underlying protein and disease pathways, which in turn
serves as a starting point for developing therapeutic interventions.6
Recent advances in next generation sequencing technologies have
dramatically changed the process of disease gene identification, in
particular by using exome sequencing in which the protein-coding
part of the genome of a patient can be studied in a single experiment
(see Majewski et al 7 for an overview of exome sequencing technology
and its applications). As tens of thousands of genomic variants can be
identified in each exome, it is important to carefully consider strategies
for efficiently and robustly prioritizing pathogenic variants. In order
to do so, much can be learned from traditional disease gene identi-
fication approaches, but also novel strategies need to be established.
TRADITIONAL DISEASE GENE IDENTIFICATION
Past identification of Mendelian disease genes was carried out by
Sanger sequencing of candidate genes. Candidate genes can be selected
because they resemble genes associated with similar diseases, because
the predicted protein function seems relevant to the physiology of the
disease, or because a positional mapping approach pointed to these
genes in a genomic region.8 This last approach has been most
successful as it does not rely on prior biological or medical knowledge
and can be applied in an unbiased fashion. The most important
genetic mapping approaches rely on karyotyping,9 linkage analysis,10
homozygosity mapping,11 copy number variation analysis,12 and SNP-
based association analysis.13 One problem associated with using
genetic mapping approaches is that it is difficult, if not impossible,
to predict whether a disease is caused by a single nucleotide mutation
or by structural genomic variation. Without family information it is
also often difficult to predict whether a disease is dominantly or
recessively inherited. Therefore, different mapping approaches often
need to be applied in a sequential order before a disease locus is
identified. In addition, these mapping approaches commonly do not
reduce the number of candidate genes sufficiently for follow-up by
Sanger sequencing, when the disease locus remains very large. This is
especially the case if these mapping approaches are applied to only a
single patient or family with a limited number of informative relatives.
Combining data from multiple unrelated but phenotypically similar
patients or families is useful to reduce this to a manageable number,
but carries a risk that patients with similar phenotypes are affected by
mutations in different genes. Alternatively, a candidate gene approach
can be used to select the best candidate genes from the large disease
locus for Sanger sequencing. Many bioinformatics tools have been
developed to prioritize candidate disease genes from disease geneloci.14–16 Candidate gene selection is however critically dependent on
prior knowledge and only few disease genes have been identified by
specifically using these bioinformatics tools.17 A particular category of
diseases that has remained largely unresolved is that of the rare genetic
disorders that occur sporadically, and for which neither a family-based
approach nor an association-based approach can be used. These
Received 24 August 2011; revised 31 October 2011; accepted 7 December 2011; published online 18 January 2012
1Department of Human Genetics, Nijmegen Centre for Molecular Life Sciences and Institute for Genetic and Metabolic Disorders, Radboud University Nijmegen Medical Centre,
Nijmegen, The Netherlands
*Correspondence: C Gilissen, Department of Human Genetics, Nijmegen Centre for Molecular Life Sciences and Institute for Genetic and Metabolic Disorders, Radboud
University Nijmegen Medical Centre, 6500 HB Nijmegen, The Netherlands. Tel: +31243668940; E-mail: [email protected]
European Journal of Human Genetics (2012) 20, 490–497
& 2012 Macmillan Publishers Limited All rights reserved 1018-4813/12
www.nature.com/ejhg

7/27/2019 Veltman EA - 2012 - R - Next-Gen. Seq. and Id of Disease Genes
http://slidepdf.com/reader/full/veltman-ea-2012-r-next-gen-seq-and-id-of-disease-genes 2/8
diseases require unbiased gene identification approaches that can be
successfully applied in small cohorts or single patients.
NEXT GENERATION SEQUENCING (NGS) TECHNOLOGY
NGS technology is changing medical genomics by making high-
throughput sequencing of DNA and RNA available and affordable.18
Mendelian disease gene identification in particular benefits from this
development. Rapid sequencing of the entire genome of a patientremoves the necessity to prioritize candidate genes for sequencing, and
can therefore reduce the disease gene identification process from a
two-step approach (positional mapping followed by Sanger sequen-
cing) to a one-step approach (whole genome sequencing). The
technical simplicity of this approach allows large-scale application in
Mendelian disease research and diagnostics. With NGS, the disease
gene identification challenge shifts from the identification to the
interpretation phase; millions of genomic variants are identified per
genome but only one or two may explain the Mendelian disease.
Prioritization of variants is therefore, crucial to the disease gene
identification process. For (severe) Mendelian disorders prioritiza-
tion assumes that the mutation has a large effect, and is therefore
(1) unique in patients or at least very rare in the general population,(2) located within the protein-coding regions of the genome, and
(3) directly affecting the function of the protein encoded by the
mutated gene.19
Most whole genome studies published so far have focused on the
2% of the genome that is coding, as roughly 85% of the known genetic
causes for Mendelian disorders affect the protein coding regions
(although this may have to do with an ascertainment bias).8 This
reduces the amount of variants from 3 to 4 million to o25000 for
follow-up.20–24 Because whole genome sequencing is still limited in
throughput and too costly to be applied as the main tool for disease
gene discovery, different capturing approaches have been developed to
enrich the exome before NGS.25 The advantage of this enrichment is
that many more exomes than genomes can be sequenced per NGS
system per run, and despite the additional enrichment, costs are lowerby a factor of 5–10. A single run on the latest generation of such NGS
systems can generate enough sequence data to simultaneously study
up to 100 exomes in parallel.
Disease gene identification strategies for exome sequencing
The number of variants that are identified in exome sequencing
studies varies greatly. This depends on the exome enrichment set
that was used, the sequencing platform and the algorithms used for
mapping, and variant calling (see Figure 1). Typically, between 20 000
and 50 000 variants are identified per sequenced exome. In order to
reduce the number of false-positive calls, variants are first filtered
based on quality criteria, such as the total number of independent
reads showing the variant (eg, at least five independent reads), and the
percentage of reads showing the variant (eg, at least 20% for hetero-
zygous variants, at least 80% for homozygous variants). Subsequently,
variants outside the coding regions can be filtered out, as well as
synonymous coding variants, on the basis of the assumption
that these will have minimal effect on the protein, as described
above. This reduces the number of potential disease-causing variants
to roughly 5000. The most substantial reduction follows from
excluding known variants (commonly from dbSNP, published
studies,26,27 or in-house databases). This step typically reduces the
number of potential candidate mutations by 90–95%. After this,
typically between 150 and 500 private non-synonymous or splice-
site variants are prioritized as potential pathogenic variants (see
Figures 1 and 2).4,28–34
It is important to emphasize that prioritization may discard the
pathogenic variant. A variant that is present at low frequency in a
heterozygous state in the normal population may be removed even
though it causes disease if present in a homozygous state. For a very
0
2000
4000
6000
8000
10000
12000
Number of non-synonymous and splicesitevariants identified in different exome studies
0
200
400
600
800
1000
1200
1400
1600
1800
2000
Number of novel non-synonymous and splicesitevariants identified in different exome studies
V i s s e r s e t a l .
M u s u n u r u
e t a l .
K r a w i t z
e t a l .
I s i d o r e t a l .
H a a c k e t a l .
V i s s e r s e t a l .
H o i s c h e n e t a l .
G i l i s s e n e t a l .
W a n g e t a l .
B o l z e
e t a l .
O ’ S u l l i v a n
e t a l
K a l a y
e t a l
S i m p s o n e t a l .
P u e n t e e t a l .
M u s u n u r u e t a l .
K l e i n e t a l .
B e c k e r e t a l .
G i l i s s e n e t a l .
S i m p s o n
e t a l .
G l a z o v
e t a l .
W a n g e t a l .
P u e n t e e t a l .
H o i s c h e n e t a l .
B e c k e r e t a l .
H a a c k e t a l .
I s i d o r e t a l .
B o l z e
e t a l .
K a l a y
e t a l
O ’ S u l l i v
a n e t a l
Figure 1 Number of variants identified in published exome studies. (a)
Number of non-synonymous variants identified in published exome studies.
From left to right:36,73,80,74,33,32,51,31,82,52,83,72,84,85,61. (b) Number of
novel non-synonymous variants identified in published exome studies. From
left to right:74,52,32,72,57,51,83,33,31,80,73,61,85,84.
All variants detected in anexome
Exonic and splice-sitevariants
Affecting proteinsequence
Private variants
Figure 2 Prioritization of NGS variants. Common prioritization of variants.
The size of the enclosing ellipses is indicative of the relative number of
variants that remain after each prioritization step.
Gene identification strategies for exome sequencingC Gilissen et al
491
European Journal of Human Genetics

7/27/2019 Veltman EA - 2012 - R - Next-Gen. Seq. and Id of Disease Genes
http://slidepdf.com/reader/full/veltman-ea-2012-r-next-gen-seq-and-id-of-disease-genes 3/8
rare recessive disorder, the expected carrier frequency in the popula-
tion will be extremely low, which allows for the use of large control
sets to exclude previously identified variants. To assume that there are
no carriers for recessive disorders in the population and thereby in the
control data is dangerous, especially when the disease occurs more
frequently. Hence, it is important that reliable population frequencies
are obtained for variants in control data sets, as this will allow the
exclusion of variants that are present at frequencies higher than the
expected carrier frequency. Walsh et al 35 warned about the use of
uncurated variant databases. One of the pathogenic mutations they
identified was recorded in dbSNP as a known variant based on a single
study. The authors did not observe the variant in 768 individuals,
which led them to speculate that the entry was likely an artifact due to
alignment errors in short mononucleotide runs.
It is clear that this initial prioritization is no more than a first
selection, and will rarely identify the pathogenic variant by itself.
Additional strategies are needed to find the causative mutation amongthis list of 150–500 private variants. For this, both traditional posi-
tional mapping strategies as well as other common approaches have
been adapted for exome sequencing (Figure 3, Table 1). We briefly
discuss each of these strategies:
Linkage strategy. For a family with a monogenic inherited disorder,
multiple affected family members can be sequenced to identify shared
variation. In addition, non-affected family members can be sequenced
to exclude private benign variation. By selecting the most distantly
related affected family members, the amount of shared benign varia-
tion can be kept to a minimum. For example, two affected siblings are
expected to share about 50% of their DNA. By combining sequence
data, this will lead to a similar reduction in private variants that needs
to be considered. The first application of this approach was by Ng
et al 29 who used data from two affected siblings to determine shared
variation, reducing the amount of recessive candidates to a mere 9
genes. Krawitz et al 36 applied a more sophisticated version of this
approach using only exome sequencing data. The authors determined
the haplotype for all variants shared by three affected siblings, and
selected those variants that are identical by descent. In this way they
reduced the number of candidate genes from 14 to only 2 genes.
Homozygosity strategy. In case of a rare recessively inherited disorder
and suspected consanguinity, the initial assumptions are that the
disease is caused by a homozygous variant inherited from both parents
and that this variant resides within a large stretch of a homozygous
region. Homozygous variants can therefore be prioritized by their
presence in large homozygous regions of the patient’s genome. These
regions can be identified by SNP microarrays and used during the
prioritization process,35 but Becker et al 31 recently showed that exome
data itself may contain sufficient numbers of informative SNPs to
allow reliable homozygosity mapping. In this study, 17 of the 318
private non-synonymous variants observed in the index patient were
autosomal homozygous variants, but only three were located in large
homozygous regions and the causative mutation was located in thelargest of these three. The main difference of this strategy compared
with the linkage strategy is that variants, although homozygous, are
only selected when contained within a large homozygous stretch. As
such, this approach reduces the amount of variants for follow-up
sufficiently to allow disease gene identification in individual cases, and
does not require additional family members, at least not for initial
variant identification. This approach however, can only detect homo-
zygous loci in regions with a sufficient target density containing
informative SNPs.
Double-hit strategy. When only a single patient is available without
additional family members and the disorder is suspected to be
recessively inherited (but without any indication for consanguinity),
it is possible to sequence only this single patient’s exome and select for
genes carrying homozygous as well as compound heterozygous
variants, as there are relatively few of these private non-synonymous
variants in the average outbred individual. Gilissen et al 32 used this
strategy to reduce the number of candidate disease genes in two
individuals with Sensenbrenner syndrome from 139 and 158 to only 3
and 4, respectively. Pierce et al 37 used the same approach for a patient
with Perrault syndrome, prioritizing a single gene among 207 private
non-synonymous variants. Both studies show that this is a powerful
approach that can identify the genetic cause of a disorder from just
sequencing a single individual.
Overlap strategy. In the absence of genetic heterogeneity, one can
search for mutations in a single gene in multiple unrelated patients
with a similar phenotype. This is particularly important for disease
gene identification in dominant disorders, as there are many more
genes with private heterozygous non-synonymous variants than there
are genes with private homozygous or compound heterozygote non-
synonymous variants. The number of genes with mutations in multi-
ple affected patients will decrease rapidly by combining data from
increasing numbers of patients, resulting in less candidate genes for
follow-up. The first study to find the mutated gene for a dominant
disorder by using this overlap approach in exome sequencing data
used four unrelated individuals.33 Recently, we showed that combining
data from three individuals was sufficient to identify the gene for
Bohring-Opitz syndrome.34 Although in the individual patients we
found between 130 and 222 novel non-synonymous variants, the
Overlap based
strategy
De novo based
strategy
Linkage based
strategy
Homozygosity based
strategy
Double-hit based
strategy
Candidate based
strategy
Figure 3 Disease gene identification strategies for exome sequencing. The
strategies (a–f) are detailed in the main text. Pedigrees indicate the
inheritance model loosely underlying the strategy; filled symbols represent
affected individuals, empty symbols represent presumably healthy
individuals, and carriers are depicted by a symbol with a dot. Dashed
rectangle encloses individuals that are exome sequenced. Circles below each
pedigree symbolize sets of genetic variants identified in the exomes. Solid
circles represent variants from affected individuals, whereas dashed circles
represent variants from unaffected.
Gene identification strategies for exome sequencingC Gilissen et al
492
European Journal of Human Genetics
7/27/2019 Veltman EA - 2012 - R - Next-Gen. Seq. and Id of Disease Genes
http://slidepdf.com/reader/full/veltman-ea-2012-r-next-gen-seq-and-id-of-disease-genes 4/8
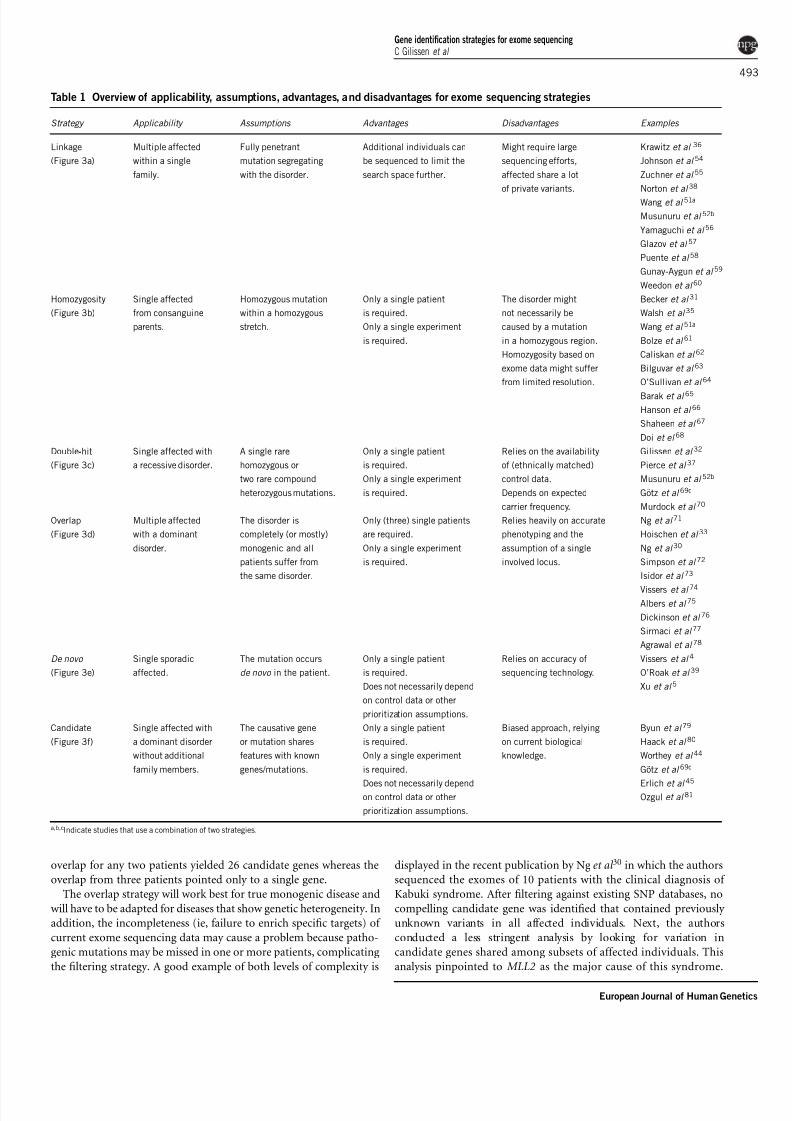
overlap for any two patients yielded 26 candidate genes whereas the
overlap from three patients pointed only to a single gene.
The overlap strategy will work best for true monogenic disease and
will have to be adapted for diseases that show genetic heterogeneity. In
addition, the incompleteness (ie, failure to enrich specific targets) of
current exome sequencing data may cause a problem because patho-
genic mutations may be missed in one or more patients, complicating
the filtering strategy. A good example of both levels of complexity is
displayed in the recent publication by Ng et al 30 in which the authors
sequenced the exomes of 10 patients with the clinical diagnosis of
Kabuki syndrome. After filtering against existing SNP databases, no
compelling candidate gene was identified that contained previously
unknown variants in all affected individuals. Next, the authors
conducted a less stringent analysis by looking for variation in
candidate genes shared among subsets of affected individuals. This
analysis pinpointed to MLL2 as the major cause of this syndrome.
Table 1 Overview of applicability, assumptions, advantages, and disadvantages for exome sequencing strategies
Strategy Applicability Assumptions Advantages Disadvantages Examples
Linkage
(Figure 3a)
Multiple affected
within a single
family.
Fully penetrant
mutation segregating
with the disorder.
Additional individuals can
be sequenced to limit the
search space further.
Might require large
sequencing efforts,
affected share a lot
of private variants.
Krawitz et al 36
Johnson et al 54
Zuchner et al 55
Norton et al 38
Wang et al 51a
Musunuru et al 52b
Yamaguchi et al 56
Glazov et al 57
Puente et al 58
Gunay-Aygun et al 59
Weedon et al 60
Homozygosity
(Figure 3b)
Single affected
from consanguine
parents.
Homozygous mutation
within a homozygous
stretch.
Only a single patient
is required.
Only a single experiment
is required.
The disorder might
not necessarily be
caused by a mutation
in a homozygous region.
Homozygosity based on
exome data might suffer
from limited resolution.
Becker et al 31
Walsh et al 35
Wang et al 51a
Bolze et al 61
Caliskan et al 62
Bilguvar et al 63
O’Sullivan et al 64
Barak et al 65
Hanson et al 66
Shaheen et al 67
Doi et el 68
Double-hit
(Figure 3c)
Single affected with
a recessive disorder.
A single rare
homozygous or
two rare compound
heterozygous mutations.
Only a single patient
is required.
Only a single experiment
is required.
Relies on the availability
of (ethnically matched)
control data.
Depends on expected
carrier frequency.
Gilissen et al 32
Pierce et al 37
Musunuru et al 52b
Gotz et al 69c
Murdock et al 70
Overlap
(Figure 3d)
Multiple affected
with a dominant
disorder.
The disorder is
completely (or mostly)
monogenic and all
patients suffer from
the same disorder.
Only (three) single patients
are required.
Only a single experiment
is required.
Relies heavily on accurate
phenotyping and the
assumption of a single
involved locus.
Ng et al 71
Hoischen et al 33
Ng et al 30
Simpson et al 72
Isidor et al 73
Vissers et al 74
Albers et al 75
Dickinson et al 76
Sirmaci et al 77
Agrawal et al 78
De novo
(Figure 3e)
Single sporadic
affected.
The mutation occurs
de novo in the patient.
Only a single patient
is required.
Does not necessarily depend
on control data or other
prioritization assumptions.
Relies on accuracy of
sequencing technology.
Vissers et al 4
O’Roak et al 39
Xu et al 5
Candidate
(Figure 3f)
Single affected with
a dominant disorder
without additional
family members.
The causative gene
or mutation shares
features with known
genes/mutations.
Only a single patient
is required.
Only a single experiment
is required.
Does not necessarily dependon control data or other
prioritization assumptions.
Biased approach, relying
on current biological
knowledge.
Byun et al 79
Haack et al 80
Worthey et al 44
Gotz et al 69c
Erlich et al 45
Ozgul et al 81
a,b,cIndicate studies that use a combination of two strategies.
Gene identification strategies for exome sequencingC Gilissen et al
493
European Journal of Human Genetics

7/27/2019 Veltman EA - 2012 - R - Next-Gen. Seq. and Id of Disease Genes
http://slidepdf.com/reader/full/veltman-ea-2012-r-next-gen-seq-and-id-of-disease-genes 5/8
On the basis of exome data, mutations in this gene were observed in
7 out of 10 patients. Sanger sequencing of the entire coding region of
this gene in the mutation-negative cases, however, revealed MLL2
mutation in two out of the three cases, both being frameshift indels
that were missed by exome sequencing. Similarly, one should be
mindful of copy number variations, inversions, or translocations
overlapping with the nucleotide variants identified in patients with
the same phenotype, as these can cause the same disease but are easily missed by exome sequencing as illustrated by Norton et al 38 The
clinical and genetic heterogeneity of Kabuki syndrome was further
highlighted in the replication cohort used in the study of Ng et al 30 in
which only 60% (26 out of 43 patients) of cases were found to have
MLL2 mutations. The difference in the percentage of MLL2 mutation-
positive cases between the discovery and replication cohort illustrates
that the authors were able to clinically select canonical Kabuki cases
for exome sequencing, highlighting the importance of accurate and
consistent clinical phenotyping for successful disease gene identifica-
tion using this overlap strategy.
De novo strategy. The overlap strategy described above only works
for rare diseases that are largely monogenic. For common disordersthat are genetically highly heterogeneous, the mutational target, that
is, the amount of genome occupied by genes that when mutated result
in disease, is too large to have a reasonable chance of finding two
patients with mutations in the same gene. This large mutational target
however, also increases the chance that a de novo mutation during
meiosis occurs in one of these genes and causes disease. Especially
when a disorder occurs mostly sporadic and is associated with reduced
fecundity, as is the case for example for intellectual disability, the
underlying cause can be hypothesized to lie with these de novo
mutations. De novo mutations in these patients can be identified by
using a family-based exome sequencing approach. By sequencing the
exome of the patient as well as his or her parents, de novo candidates
can be selected by filtering out all inherited variants. This will yield a
limited number of potential pathogenic variants, as the averageexome contains only 0–3 de novo mutations.4,22,26,39 Vissers et al 4
showed that de novo point mutations could be linked to disease
in 7 out of 10 patients with intellectual disability, indicating that
these mutations may explain the large majority of the genetic burden.
These remarkable findings in intellectual disability have recently been
replicated in sporadic forms of autism39 and schizophrenia,5 indicat-
ing that de novo mutations may explain a considerable proportion of
the sporadic forms of common neurodevelopmental disorders.4,40
Note that, as for the other strategies, variants prioritized in this way
are more likely to be causative for disease, but de novo occurrence in
itself is not sufficient evidence, and follow-up studies are required to
identify recurrence or functional proof of pathogenicity. In addition,
the focus on variants that are present only in an affected child and not
in the parents does not only enrich for de novo mutations but also for
sequencing and mapping artifacts, and therefore requires high sequen-
cing accuracy and equal coverage in all three samples investigated. It
may therefore be wise to enrich and sequence all samples of a trio in
the same experiment. Finally, the de novo strategy requires a relatively
high number of three experiments per patient, and will therefore only
be applied when none of the other strategies is likely to be successful
and parental samples are available.
Candidate strategy. In case of a single dominantly affected indivi-
dual, without further availability of family members or other affected
individuals, the options are limited. Prioritization may be on the basis
of predicted impact of the variant on protein function and structure,
that is one prioritizes for stop mutations, frame-shifting mutations,
and mutations in the canonical splice-sites. In case of missense
variants, the two main criteria currently applied are predicted impact
on protein structure (eg, Grantham score) and evolutionary conserva-
tion of the variant nucleotide (eg, phyloP or GERP scores). Pathogenic
mutations tend to have a markedly higher conservation than benign
variants.4,41 Based on a comparison of scores for benign and patho-
genic variants from dbSNP and Human Genome Mutation Database,respectively, we estimated that most pathogenic missense variants have
a PhyloP score42.5.4 Indeed, so far almost all published missense and
nonsense mutations that have been identified by exome sequencing
are more conserved than expected (Figure 4).
Similar to the traditional candidate gene approach, information on
gene function in relation to the phenotype and what is known or
inferred about its pathophysiology may be used in further prioritiza-
tion. Methods for selecting candidate variants on this scale are
relatively new. When there are no obvious candidate variants available
(ie, truncating mutations), most studies have turned to computational
predictors of the impact of missense variants on the protein structure
or function.42 There are some practical issues with regard to the utility
of these prediction programs for NGS data. Most importantly, how-ever, the sensitivity and specificity needs to be very high, given the
large amount of predictions that is performed for a single exome. As
an example, one of the two mutations identified as the cause for Miller
syndrome by Ng et al 29 was initially missed because it was predicted to
be benign. Hence, some studies have used combinations of predictions
by different methods to evaluate missense variants.43 On the other
hand, predictions on a complete set of detected exonic variants will
usually yield far too many potential damaging mutations for follow
up.44 Recently, Erlich et al 45 demonstrated how gene prediction tools
typically applied in combination with traditional mapping
approaches, can also successfully be applied to prioritize candidate
genes from exome resequencing experiments. They used three differ-
ent bioinformatics tools (SUSPECTS,46 ToppGene,47 and Endea-
vour15) to prioritize KIF1A as the most likely candidate gene forhereditary spastic paraparesis. Prioritization of the variants itself using
MutationTaster,48 Polyphen,49 and SIFT50 independently pointed to
the variant in KIF1A as being the most likely pathogenic variant. This
nicely illustrates the potential of combining gene level information
with genomic variant information.
In practice, not all studies use a single strategy, and some rely on a
combination of approaches. For example Wang et al 51 used a
combination of a homozygosity and linkage-based approach whereas
Musunru et al 52 used the combination of a linkage- and double hit-
based strategy (Table 1). As a final step in this process, validation by
traditional Sanger sequencing as the golden standard for mutation
detection is still required. Importantly, definite proof of pathogenicity
requires validation in independent patient cohorts and/or functional
experiments.
Success rate
In order to evaluate the success rate of exome sequencing for
Mendelian diseases, we investigated the exome coverage of known
disease-causing mutations. We considered all 37 424 non-synon-
ymous-coding variants annotated as disease-causing in the Human
Genome Mutation Database that do not overlap with known
dbSNP132 positions.53 For each of these mutations, we evaluated
the sequence coverage of corresponding targets from 51 exomes, with
a median coverage of 49-fold, that were sequenced in-house using
the Agilent 50Mb exome kit (Agilent Technologies, Inc., Santa Clara,
CA, USA) with SOLiD4 sequencing.
Gene identification strategies for exome sequencingC Gilissen et al
494
European Journal of Human Genetics

7/27/2019 Veltman EA - 2012 - R - Next-Gen. Seq. and Id of Disease Genes
http://slidepdf.com/reader/full/veltman-ea-2012-r-next-gen-seq-and-id-of-disease-genes 6/8
First, we observed that all 37 424 disease-causing variant positions
were targeted by the enrichment kit. Of these, 2128 (5.7%) positions
were not covered with sequencing reads at all (median o 1.0),
whereas 80.8% of the positions were covered with a median coverage
of at least 10-fold. Variants that were covered less were typically within
regions of either very high or low GC. We conclude that for up to 80%
of all mutations, reliable variants calling would have been possible,
that is, a detection with exome sequencing would have been likely.
Additionally, we performed a more biased analysis by evaluating all
projects involving unexplained rare Mendelian disorders from the first
year of exome sequencing at our institute. We revisited data from 10
likely dominant syndromes as well as 14 suspected recessive disorders.
For 6 out of the 10 dominant diseases, we identified heterozygous
mutations in a novel gene. In addition we identified homozygous or
compound heterozygous mutations in a novel gene in 8 out of 14
recessive disorders. All these mutations were Sanger-validated and
independently replicated in at least one unrelated patient with the
same disorder, and/or functionally implicated in the disease. This
results in a success rate of 58% (14 out of 24), a number that may
increase slightly as some of the projects are still ongoing.
Among the 10 projects where we did not find any novel genes, in 3
we identified mutations in previously known disease genes (B13%).
One of the other unsuccessful projects involved Kabuki syndrome,
where we sequenced four patients and two unaffected parents, and
0.00
0.50
1.00
1.50
2.00
2.50
3.00
3.50
4.00
4.50
- 4 . 1
- 3 . 7
- 3 . 3
- 2 . 9
- 2 . 5
- 2 . 1
- 1 . 7
- 1 . 3
- 0 . 9
- 0 . 5
- 0 . 1
0 . 3
0 . 7
1 . 1
1 . 5
1 . 9
2 . 3
2 . 7
3 . 1
3 . 5
3 . 9
4 . 3
4 . 7
5 . 1
5 . 5
5 . 9
6 . 3
6 . 7
7 . 1
R e l a t i v e f r e q u e n c y
PhyloP Evolutionary conservation score (log10)
HGMD
dbSNP
-2
-1
0
1
2
3
4
5
6
7
8
F A D D - C > W (
3 )
A A R S 2 - R > W (
1 )
M L L 2 - Q > P ( 3 )
M L L 2 - R > P ( 1 )
M L L 2 - Y > P ( 3 )
D H O D H - R > W (
1 )
H S D 1 7 B 4 - Y > P ( 3 )
B A G 3 - R > W (
1 )
S H 3 T C 2 - R > P ( 1 )
B A G 3 - T > A ( 1 )
A C A D 9 - R > W (
1 )
S H 3 T C 2 - Y > H ( 1 )
A C A D 9 - R > C ( 1 )
M L L 2 - R > P ( 1 )
M L L 2 - R > P ( 1 )
M L L 2 - R > P ( 1 )
P O P 1 - R > P ( 1 )
M L L 2 - R > P ( 1 )
B A G 3 - I > F ( 1 )
B A G 3 - R > Q ( 2 )
M L L 2 - Q > P ( 1 )
T G M 6 - L > W (
2 )
D H O D H - R > C ( 1 )
A C A D 9 - F > I ( 1 )
M L L 2 - Q > P ( 1 )
I M P A D 1 - R > P ( 1 )
B A G 3 - A > T ( 1 )
B A G 3 - H > R ( 2 )
P I G V - A > E ( 2 )
D H O D H - R > C ( 1 )
M L L 2 - R > H ( 2 )
D H O D H - D > G ( 2 )
D H O D H - G > E ( 2 )
D H O D H - R > W (
1 )
I M P A D 1 - T > P ( 1 )
D H O D H - T > I ( 2 )
T G M 6 - D > G ( 2 )
M L L 2 - K > P ( 1 )
T E C R - P > L ( 2 )
I M P A D 1 - D > N ( 1 )
W D R 3 5 - E > G ( 2 )
M L L 2 - W > P ( 3 )
P I G V - H > P ( 2 )
M L L 2 - C > F ( 2 )
H S D 1 7 B 4 - Y > C ( 2 )
A A R S 2 - L > R ( 2 )
S E T B P 1 - I > T ( 2 )
P I G V - Q > K ( 1 )
M L L 2 - R > H ( 2 )
M L L 2 - R > L ( 2 )
D H D D S - K > E ( 1 )
S E T B P 1 - D > A ( 2 )
W D R 3 5 - A > T ( 1 )
M L L 2 - Q > P ( 1 )
A C A D 9 - A > P ( 1 )
M L L 2 - Q > P ( 1 )
M L L 2 - R > P ( 1 )
P O P 1 - G > E ( 2 )
B A N F 1 - A > T ( 1 )
M L L 2 - Q > P ( 1 )
M L L 2 - R > P ( 1 )
A C A D 9 - R > Q ( 2 )
M L L 2 - T > M ( 2 )
M L L 2 - R > P ( 1 )
M L L 2 - Q > P ( 1 )
M L L 2 - Q > P ( 1 )
B A G 3 - R > H ( 2 )
D H O D H - G > R ( 1 )
D H O D H - G > A ( 2 )
S E T B P 1 - D > N ( 1 )
S E T B P 1 - G > S ( 1 )
S E T B P 1 - G > D ( 2 )
Figure 4 Base pair conservation of published pathogenic missense variants identified by exome sequencing. (a) Histogram plots of PhyloP evolutionary
conservation score for non-synonymous variants from dbSNP and Human Genome Mutation Database, showing a clear difference. (b) Conservation of
published missense mutations ranked from low to high. Each bar represents the conservation of a missense mutation. Mutations are labeled with gene name,
amino-acid change and affected base within the codon (in parentheses). Horizontal dotted line indicates conservation of 2.5 where the distributions of the
two distributions from panel (a) intersect. Variants from different studies are indicated by distinct colors. The color reproduction of this figure is available at
the European Journal of Human Genetics online.
Gene identification strategies for exome sequencingC Gilissen et al
495
European Journal of Human Genetics

7/27/2019 Veltman EA - 2012 - R - Next-Gen. Seq. and Id of Disease Genes
http://slidepdf.com/reader/full/veltman-ea-2012-r-next-gen-seq-and-id-of-disease-genes 7/8
applied both the overlap as well as the de novo approach without
identifying the (at that time unknown) causative gene. After the
publication of MLL2 as the causative gene for Kabuki syndrome,30
we identified the reason for our lack of success. MLL2 was not
represented on the exome enrichment kit that we used at that time,
and therefore no sequence data for this gene was obtained. While this
explains why we were not able to identify any disease-causing muta-
tion, it also shows that we were not misled by false-positive variantsand identified wrong candidate genes.
There are several other possible reasons why we are unable to
identify the genetic cause by exome sequencing in some projects.
Variants have not been identified due to (a) lack of sequence coverage
of the variant, (b) bioinformatics variant calling issues, and (c) mis-
interpretation of variants. Moreover, it may be that (d) the cause of the
disease is located outside the coding sequences or (e) being a large
indel or structural genomic variant missed by exome sequencing. In
addition, for some projects too many candidate variants remained
after filtering and no independent recurrence or functional proof has
been obtained so far. Finally, clinical heterogeneity or incorrect
diagnosis may have falsely impacted our filtering strategy.
CONCLUSION
The introduction of NGS is transforming Mendelian disease gene
identification. No longer is there a need for a complex and time-
consuming laboratory workflow consisting of many different posi-
tional cloning approaches. Instead, a single streamlined laboratory
workflow will rapidly identify most of the genomic variation present
in an individual exome. By applying tailored strategies for disease
variant prioritization, many new Mendelian disease genes have been
identified in the last 2 years. We estimate that straightforward
application of these approaches achieves a success rate of 60–80%
for Mendelian disorders. Improvements in the technology and bioin-
formatics are likely to increase this success rate. It is therefore likely
that exome sequencing will become the most commonly used tool for
Mendelian disease gene identification in the next few years.
CONFLICT OF INTEREST
The authors declare no conflict of interest.
1 McKusick VA Online Mendelian Inheritance in Man, OMIM http://www.ncbi.nlm.nih.
gov/omim, http://www.ncbi.nlm.nih.gov/omim , 2011.
2 McClellan J, King MC: Genetic heterogeneity in human disease. Cell 2010; 141:
210–217.
3 Mitchell KJ, Porteous DJ: Rethinking the genetic architecture of schizophrenia. Psychol
Med 2011; 41: 19–32.
4 Vissers LE, de Ligt J, Gilissen C et al : A de novo paradigm for mental retardation.
Nat Genet 2010; 42: 1109–1112.
5 Xu B, Roos JL, Dexheimer P et al : Exome sequencing supports a de novo mutational
paradigm for schizophrenia. Nat Genet 2011; 43: 864–868.6 Antonarakis SE, Beckmann JS: Mendelian disorders deserve more attention. Nat Rev
Genet 2006; 7: 277–282.
7 Majewski J, Schwartzentruber J, Lalonde E, Montpetit A, Jabado N: What can exome
sequencing do for you? J Med Genet 2011; 48: 580–589.
8 Botstein D, Risch N: Discovering genotypes underlying human phenotypes: past
successes for Mendelian disease, future approaches for complex disease. Nat Genet
2003; 33 (Suppl): 228–237.
9 Kurotaki N, Imaizumi K, Harada N et al : Haploinsufficiency of NSD1 causes Sotos
syndrome. Nat Genet 2002; 30: 365–366.
10 Kerem B, Rommens JM, Buchanan JA et al : Identification of the cystic fibrosis gene:
genetic analysis. Science 1989; 245: 1073–1080.
11 Lander ES, Botstein D: Homozygosity mapping: a way to map human recessive traits
with the DNA of inbred children. Science 1987; 236: 1567–1570.
12 Vissers LE, Veltman JA, van Kessel AG, Brunner HG: Identification of disease genes by
whole genome CGH arrays. Hum Mol Genet 2005; 14 Spec No. 2: 215.
13 Duerr RH, Taylor KD, Brant SR et al : A genome-wide association study identifies
IL23R as an inflammatory bowel disease gene. Science 2006; 314: 1461–1463.
14 Franke L, van BH, Fokkens L, de Jong ED, Egmont-Petersen M, Wijmenga C:
Reconstruction of a functional human gene network, with an application for prioritizing
positional candidate genes. Am J Hum Genet 2006; 78: 1011–1025.
15 Aerts S, Lambrechts D, Maity S et al : Gene prioritization through genomic data fusion.
Nat Biotechnol 2006; 24: 537–544.
16 Tranchevent LC, Capdevila FB, Nitsch D, De MB, De CP, Moreau Y: A guide to web tools
to prioritize candidate genes. Brief Bioinform 2011; 12: 22–32.
17 Tiffin N, Andrade-Navarro MA, Perez-Iratxeta C: Linking genes to diseases: it’s all in the
data. Genome Med 2009; 1: 77.
18 Mardis ER: A decade’s perspective on DNA sequencing technology. Nature 2011; 470:198–203.
19 Ng SB, Nickerson DA, Bamshad MJ, Shendure J: Massively parallel sequencing and
rare disease. Hum Mol Genet 2010; 19: 119.
20 Sobreira NL, Cirulli ET, Avramopoulos D et al : Whole-genome sequencing of a single
proband together with linkage analysis identifies a Mendelian disease gene. PLoS
Genet 2010; 6: 1000991.
21 Lupski JR, Reid JG, Gonzaga-Jauregui C et al : Whole-genome sequencing in a patient
with Charcot-Marie-Tooth neuropathy. N Engl J Med 2010; 362: 1181–1191.
22 Roach JC, Glusman G, Smit AF et al : Analysis of genetic inheritance in a family quartet
by whole-genome sequencing. Science 2010; 328: 636–639.
23 Ashley EA, Butte AJ, Wheeler MT et al : Clinical assessment incorporating a personal
genome. Lancet 2010; 375: 1525–1535.
24 Bainbridge MN, Wiszniewski W, Murdock DR et al : Whole-genome sequencing for
optimized patient management. Sci Transl Med 2011; 3: 87re3.
25 Mamanova L, Coffey AJ, Scott CE et al : Target-enrichment strategies for next-
generation sequencing. Nat Methods 2010; 7: 111–118.
26 Durbin RM, Abecasis GR, Altshuler DL et al : A map of human genome variation from
population-scale sequencing. Nature 2010; 467: 1061–1073.
27 NHLBI Exome Sequencing Project (ESP). : Exome Variant Server http://evs.gs.washington.edu/EVS/ , 2011.
28 Ng SB, Turner EH, Robertson PD et al : Targeted capture and massively parallel
sequencing of 12 human exomes. Nature 2009; 461: 272–276.
29 Ng SB, Buckingham KJ, Lee C et al : Exome sequencing identifies the cause of a
Mendelian disorder. Nat Genet 2010; 42: 30–35.
30 Ng SB, Bigham AW, Buckingham KJ et al : Exome sequencing identifies MLL2
mutations as a cause of Kabuki syndrome. Nat Genet 2010; 42: 790–793.
31 Becker J, Semler O, Gilissen C et al : Exome sequencing identifies truncating
mutations in human SERPINF1 in autosomal-recessive osteogenesis imperfecta.
Am J Hum Genet 2011; 88: 362–371.
32 Gilissen C, Arts HH, Hoischen A et al : Exome sequencing identifies WDR35 variants
involved in Sensenbrenner syndrome. Am J Hum Genet 2010; 87: 418–423.
33 Hoischen A, van Bon BW, Gilissen C et al : De novo mutations of SETBP1 cause
Schinzel-Giedion syndrome. Nat Genet 2010; 42: 483–485.
34 Hoischen A, van Bon BW, Rodriguez-Santiago B et al : De novo nonsense mutations in
ASXL1 cause Bohring-Opitz syndrome. Nat Genet 2011; 43: 729–731.
35 Walsh T, Shahin H, Elkan-Miller T et al : Whole exome sequencing and homozygosity
mapping identify mutation in the cell polarity protein GPSM2 as the cause ofnonsyndromic hearing loss DFNB82. Am J Hum Genet 2010; 87: 90–94.
36 Krawitz PM, Schweiger MR, Rodelsperger C et al : Identity-by-descent filtering of
exome sequence data identifies PIGV mutations in hyperphosphatasia mental retarda-
tion syndrome. Nat Genet 2010; 42: 827–829.
37 Pierce SB, Walsh T, Chisholm KM et al : Mutations in the DBP-deficiency protein
HSD17B4 cause ovarian dysgenesis, hearing loss, and ataxia of Perrault Syndrome.
Am J Hum Genet 2010; 87: 282–288.
38 Norton N, Li D, Rieder MJ et al : Genome-wide studies of copy number variation and
exome sequencing identify rare variants in BAG3 as a cause of dilated cardiomyopathy.
Am J Hum Genet 2011; 88: 273–282.
39 O’Roak BJ, Deriziotis P, Lee C et al : Exome sequencing in sporadic autism spectrum
disorders identifies severe de novo mutations. Nat Genet 2011; 43: 585–589.
40 Girard SL, Gauthier J, Noreau A et al : Increased exonic de novo mutation rate in
individuals with schizophrenia. Nat Genet 2011; 43: 860–863.
41 Cooper GM, Goode DL, Ng SB et al : Single-nucleotide evolutionary constraint scores
highlight disease-causing mutations. Nat Methods 2010; 7: 250–251.
42 Thusberg J, Olatubosun A, Vihinen M: Performance of mutation pathogenicity predic-
tion methods on missense variants. Hum Mutat 2011; 32: 358–368.
43 Shearer AE, DeLuca AP, Hildebrand MS et al : Comprehensive genetic testing forhereditary hearing loss using massively parallel sequencing. Proc Natl Acad Sci USA
2010; 107: 21104–21109.
44 Worthey EA, Mayer AN, Syverson GD et al : Making a definitive diagnosis: successful
clinical application of whole exome sequencing in a child with intractable inflammatory
bowel disease. Genet Med 2011; 13: 255–262.
45 Erlich Y, Edvardson S, Hodges E et al : Exome sequencing and disease-network analysis
of a single family implicate a mutation in KIF1A in hereditary spastic paraparesis.
Genome Res 2011; 21: 658–664.
46 Adie EA, Adams RR, Evans KL, Porteous DJ, Pickard BS: SUSPECTS: enabling
fast and effective prioritization of positional candidates. Bioinformatics 2006; 22:
773–774.
47 Chen J, Bardes EE, Aronow BJ, Jegga AG: ToppGene Suite for gene list enrichment
analysis and candidate gene prioritization. Nucleic Acids Res 2009; 37: W305–W311.
48 Schwarz JM, Rodelsperger C,Schuelke M, Seelow D: MutationTaster evaluates disease-
causing potential of sequence alterations. Nat Methods 2010; 7: 575–576.
49 Adzhubei IA, Schmidt S, Peshkin L et al : A method and server for predicting damaging
missense mutations. Nat Methods 2010; 7: 248–249.
Gene identification strategies for exome sequencingC Gilissen et al
496
European Journal of Human Genetics

7/27/2019 Veltman EA - 2012 - R - Next-Gen. Seq. and Id of Disease Genes
http://slidepdf.com/reader/full/veltman-ea-2012-r-next-gen-seq-and-id-of-disease-genes 8/8