RNA-SEQ REVEALS NOVEL GENES AND PATHWAYS INVOLVED IN ...
109
RNA-SEQ REVEALS NOVEL GENES AND PATHWAYS INVOLVED IN BOVINE MAMMARY INVOLUTION DURING THE DRY PERIOD AND UNDER ENVIRONMENTAL HEAT STRESS By BETHANY M. DADO SENN A THESIS PRESENTED TO THE GRADUATE SCHOOL OF THE UNIVERSITY OF FLORIDA IN PARTIAL FULFILLMENT OF THE REQUIREMENTS FOR THE DEGREE OF MASTER OF SCIENCE UNIVERSITY OF FLORIDA 2018
Transcript of RNA-SEQ REVEALS NOVEL GENES AND PATHWAYS INVOLVED IN ...

RNA-SEQ REVEALS NOVEL GENES AND PATHWAYS INVOLVED IN BOVINE MAMMARY INVOLUTION DURING THE DRY PERIOD AND UNDER
ENVIRONMENTAL HEAT STRESS
By
BETHANY M. DADO SENN
A THESIS PRESENTED TO THE GRADUATE SCHOOL
OF THE UNIVERSITY OF FLORIDA IN PARTIAL FULFILLMENT OF THE REQUIREMENTS FOR THE DEGREE OF
MASTER OF SCIENCE
UNIVERSITY OF FLORIDA
2018

© 2018 Bethany M. Dado Senn

To my family, the true dairy enthusiasts

4
ACKNOWLEDGMENTS
To my advisor, mentor, and friend Dr. Jimena Laporta, I am humbled and grateful
to have served as your graduate student as you provided invaluable advice and
kindness throughout my projects. Your open-door policy has facilitated my growth both
personally and professionally. Thank you for the opportunity to research lactation
physiology, volunteer and teach, and pursue a degree at the University of Florida.
I extend my appreciation to my committee members Dr. Geoffrey Dahl and Dr.
Pete Hansen for utilizing their many years of experience to provide useful critiques and
additional insight into my analysis and interpretations. Thank you to Dr. Hansen for the
use of Ingenuity Pathway Analysis® and to Dr. Dahl for his heat stress expertise.
I thank the faculty and staff in the Department of Animal Sciences at the
University of Florida, especially Dr. Francisco Peñagaricano for his vital RNA-
sequencing and statistical contribution to my thesis project. Further thanks to Dr. Corwin
Nelson, Dr. Stephanie Wohlgemuth, and Dr. John Bromfield for use of lab space and
research support. Special appreciation goes to Joyce Hayen, Pam Krueger, and Renee
Parks-James and the UF Dairy Unit staff. I also express appreciation to the Animal
Molecular and Cellular Biology program, the Brélan E. Moritz family, and the National
Dairy Shrine for funding a portion of my education.
I am grateful for my supportive laboratory community for their assistance with
projects and papers, not to mention the memories and laughter accumulated from long
nights in the lab. Special thanks to Dr. Amy Skibiel for being an incredible role model
and mentoring me through assays, presentations, and paper writing, Catalina Mejia
Bonilla for being my first UF friend and research confidante, Marcela Marérro-Perez and
Sena Field for bringing joy into research, Thiago Fabris for his guidance on-farm, and

5
Debora da Silva, Carolina Collazos, Fabiana Corra, and Therus Brown for their
assistance with various aspects of my research projects including sample collection,
analysis, and presentation practice.
Thanks to my undergraduate role models Dr. Laura Hernandez, Dr. Hasan
Khatib, Dr. Marina Danes, Dr. Michel Wattiaux, Ryan Pralle, Nicole Gross, and Patti
Hurtgen for helping me find academic direction and pointing me to UF. Thank you to my
friends near and far—Jessi and Cody Getschel, Saager Paliwal, Eleanor Miller, Katey
Scholz, Mykayla Getschel, Alexus and Josh Berndt, Mackenzie Dickson, and the Flores,
Tyler, Sy, and Guernsey families—for listening to my crazy lab stories, offering solutions
to my dilemmas, and being truly genuine friends throughout the journey.
I would like to give special thanks to my loving family. Thank you to my parents,
Rick and Gwen Dado, for serving as excellent examples of academics and dairy
producers. To my siblings Ethan, Trent, and Meikah Dado, thank you for praying for me
and setting the bar high for success. I thank my extended families, specially my
Grandma Thelma Betzold, Grandpa Gary Dado, and Grandma Arlene Dado, and my in-
laws Jim, Deb, and Ted Senn and Jeremy and Tracy Keifenheim for the many phone
calls inquiring about my research. And to my husband, Travis Senn: thank you for
moving across the country for me, challenging me academically and spiritually, and
providing for our beautiful future. I look forward to all our adventures to come.
Finally, I give thanks to my Heavenly Father who has granted me strength and
patience for the journey and the talents and resources to serve others through this
degree. To God be the Glory.

6
TABLE OF CONTENTS page
ACKNOWLEDGMENTS .................................................................................................. 4
LIST OF TABLES ............................................................................................................ 8
LIST OF FIGURES .......................................................................................................... 9
LIST OF OBJECTS ....................................................................................................... 10
LIST OF ABBREVIATIONS ........................................................................................... 11
ABSTRACT ................................................................................................................... 13
CHAPTER
1 LITERATURE REVIEW .......................................................................................... 15
The Bovine Mammary Gland Dry Period ................................................................ 15 Physiology of the Dry Period ............................................................................ 16
Molecular Regulators of Mammary Involution and Redevelopment ................. 18
Heat Stress in Dairy Cattle ...................................................................................... 21
Heat Stress During the Dry Period ................................................................... 25 Mammary Gene Expression under Heat Stress ............................................... 27
RNA-Sequencing Technology ................................................................................. 30 Transcriptome Analysis Technology Comparisons ........................................... 32 RNA-Sequencing Application in Bovine Research ........................................... 34
Summary ................................................................................................................ 35
2 RNA-SEQ REVEALS NOVEL GENES AND PATHWAYS INVOLVED IN BOVINE MAMMARY INVOLUTION DURING THE DRY PERIOD AND UNDER ENVIRONMENTAL HEAT STRESS ....................................................................... 37
Abstract ................................................................................................................... 37 Introduction ............................................................................................................. 38 Materials and Methods............................................................................................ 40
Animals, Treatments, and Experimental Design ............................................... 40
Mammary Tissue Collection and RNA Extraction ............................................. 40 Library Generation and RNA Sequencing ........................................................ 41 Identification of Differentially Expressed Genes, Pathways, and Regulators ... 42
Results .................................................................................................................... 44 Physiological Parameters and Milk Yield .......................................................... 44
Ingenuity® Pathways Analysis (IPA®) Regulator and Network Analysis............ 47
Differentially Expressed Genes and Regulators Impacted by Heat Stress ....... 48
Discussion .............................................................................................................. 49 Conclusions ............................................................................................................ 59

7
3 GENERAL DISCUSSION AND SUMMARY ............................................................ 87
APPENDIX: TABLES IN LINKS .................................................................................... 92
LIST OF REFERENCES ............................................................................................... 93
BIOGRAPHICAL SKETCH .......................................................................................... 109

8
LIST OF TABLES
Table page 2-1 Primer sequences for genes utilized for quantitative real-time PCR (qRT-
PCR) validation of RNA-Seq results in bovine mammary tissue......................... 60
2-2 Top KEGG pathways and MeSH terms along with their corresponding DEGs in bovine mammary tissue during transition between lactation to involution. ...... 61
2-3 Top KEGG pathways and MeSH terms along with their corresponding DEGs inbovine mammary tissue during early involution. .............................................. 69
2-4 Differentially expressed genes (DEGs) in bovine mammary tissue during steady-state involution and redevelopment. ....................................................... 71
2-5 Differentially expressed genes (DEGs) in bovine mammary tissue between heat-stressed and cooled cows during the dry period. ....................................... 73

9
LIST OF FIGURES
Figure page 2-1 Pictorial representation of experimental design. ................................................ 79
2-2 Volcano plot of DEGs in bovine mammary tissue during early involution (D3 vs. D-3 and D7 vs. D3). ...................................................................................... 80
2-3 Significantly enriched Kyoto Encyclopedia of Genes and Genomes (KEGG) pathways and Medical Subject Headings (MeSH) terms in bovine mammary tissue during early involution (D3 vs. D-3 and D7 vs. D3). ................................. 81
2-4 Ingenuity® Pathway Analysis (IPA®) upstream regulators and summary network in bovine mammary tissue comparing D3 vs. D-3 relative to dry-off. .... 82
2-5 Ingenuity® Pathway Analysis (IPA®) upstream regulators and summary network in bovine mammary tissue comparing D7 vs. D3 relative to dry-off. ..... 83
2-6 Characterization of DEGs in bovine mammary tissue between heat-stressed (HT) and cooled (CL) dairy cattle during the dry period. ..................................... 84
2-7 Ingenuity® Pathway Analysis (IPA®) upstream regulators and summary network in bovine mammary tissue between heat-stressed (HT, n=6) and cooled (CL, n=6) dairy cattle during the dry period. ............................................ 85
2-8 Validation of RNA-Sequencing results by quantitative RT-PCR. ........................ 86

10
LIST OF OBJECTS
Object page A-1 Differentially expressed genes D3 vs. D-3. ........................................................ 92
A-2 Differentially expressed genes D7 vs. D3. ......................................................... 92
A-3 miRNAs and target genes impacted by heat stress. .......................................... 92

11
LIST OF ABBREVIATIONS
AKT Serine/threonine protein kinase B
BAX BCL2 Associated X
BHBA Beta-hydroxybutyrate
BMEC Bovine mammary epithelial cell
bp Base-pair
C Celsius
CL Cooled
D or d Day
DEGs Differentially expressed genes
FasL Fas ligand
FC Fold change
FDR False-discovery rate
GO Gene Ontology
H Hour
HSP Heat shock protein
HSF1 Heat shock transcription factor 1
HT Heat stressed
IGF Insulin-like growth factor
IGFBP Insulin-like growth factor binding protein
IPA Ingenuity Pathway Analysis
KEGG Kyoto Encyclopedia of Genes and Genomes
LIF Leukemia inhibitory factor
LIFR Leukemia inhibitor factor receptor

12
lncRNA Long non-coding RNA
MEC Mammary epithelial cell
MeSH Medical Subject Headings
Min Minute
miRNA microRNA
MMP Matrix metallopeptidase
NEFA Non-esterified fatty acid
NFκB Nuclear factor kappa-light-chain-enhancer of activated B cells
qRT-PCR Quantitative real-time polymerase chain reaction
RNA-Seq RNA-Sequencing
s seconds
STAT Signal transducer and activator of transcription
SNPs Single nucleotide polymorphisms
TGF Transforming growth factor
THI Temperature-humidity index
TNF Tumor necrosis factor
VDR Vitamin D receptor

13
Abstract of Thesis Presented to the Graduate School of the University of Florida in Partial Fulfillment of the Requirements for the Degree of Master of Science
RNA-SEQ REVEALS NOVEL GENES AND PATHWAYS INVOLVED IN BOVINE
MAMMARY INVOLUTION DURING THE DRY PERIOD AND UNDER ENVIRONMENTAL HEAT STRESS
By
Bethany M. Dado Senn
May 2018
Chair: Jimena Laporta Major: Animal Molecular and Cellular Biology
The aim of this thesis was to characterize genes, pathways, and regulators
involved in mammary involution and redevelopment during the bovine dry period and to
determine how exposure to environmental heat stress impacts this dynamic process.
The objective of Chapter 1 is to review literature that uncovers physiological
mechanisms controlling the bovine dry period, specifically involution and
redevelopment, linking the impacts of heat stress on cellular turnover and subsequent
milk production. It highlights histological characteristics and molecular factors of
mammary involution and redevelopment. When undergoing these changes, the gland is
sensitive to heat stress perturbation, thus the effect of heat stress both during lactation
and the dry period on production, health, and gene expression was evaluated. Finally,
RNA-sequencing was discussed as a tool to uncover the transcriptome of the bovine
mammary gland undergoing these alterations.
Chapter 2 describes the outcomes of an RNA-sequencing experiment conducted
to determine mammary gene expression changes across the dry period and under heat
stress insult. Mammary biopsies were collected before and during the dry period from

14
heat stressed or cooled late-lactation, pregnant cows under a 46-d dry-period. RNA-
Sequencing was conducted, and differentially expressed genes were analyzed under a
false-discovery rate ≤ 5%. Changes in genes, pathways, and regulators during
involution indicate downregulation of mammary metabolism, and upregulation of cell
death and immune response. Compared to cooled cows, dry period heat-stressed cows
had altered expression of genes and regulators involved in ductal branching, cell death,
immune function, and stress protection, potentially impairing mammary development
and function.
15
CHAPTER 1 LITERATURE REVIEW
The Bovine Mammary Gland Dry Period
The bovine dry period is a management practice consisting of six to eight-weeks
of a non-lactating state initiated between two consecutive lactations. In a traditional
dairy production setting, cows are dried-off through cessation of milking during late
gestation. At this time, the cow has passed peak milk production of a typical lactation
curve and has experienced a consistent decline in milk yield due to reduced number
and activity of mammary epithelial cells (MEC), the cells responsible for milk synthesis.1
The old, senescent cells remaining do not secrete milk efficiently and have a reduced
capacity for proliferation. Thus the dry period is critical as it allows for optimal milk yield
in the subsequent lactation through the turnover of these worn, senescent MECs with
new, active cells fully prepared for optimal milk synthesis.2
It is well-recognized that the dry period is essential to avoid significant reductions
in milk production in the next lactation. If not allowed a dry period and continuously
milked until calving, cows experience, on average, a 20% reduction in milk yield in the
subsequent lactation and lower peak milk yield.3–6 Extensive research has been
conducted to determine optimal duration of the dry period in commercial dairy herds to
maximize production while minimizing negative energy balance. Dated retrospective
analyses and experiments suggest that target dry period length should be between 40
to 60 d for maximal milk production, as nonlactating periods less than 40 d do not allow
for enough MEC turnover and periods greater than 60 d are associated with higher feed
costs with no return of increased milk production.7–9 However, a majority of these
studies were uncontrolled observational studies and measured production from low-

16
yielding cattle with reduced genetic merit. Thus, dry period duration has more recently
been re-examined through controlled experiments using today’s high-producing and
genetically-superior cattle. More recent data illustrate that cows with a 30 d dry periods
experience undergo lower levels of negative energy balance with non-significant
reductions in subsequent milk yield compared to cows dried for 60 d in the next
lactation.10–12 Further work is needed to refine the optimal dry period duration in today’s
high-producing dairy cattle, accounting for the balance of cell turnover to postpartum
energy demands and the complex environmental factors and management practices
that impact production.13
Physiology of the Dry Period
Regardless of dry period length, the general physiological targets during the dry
period remain the same. Upon cessation of milk removal, the accumulation of milk
causes a cascade of events to initiate the first stages of the dry period. An increase in
mammary pressure from the retained milk leads to a decrease in mammary blood flow,
halting the exchange of nutrients and waste by-products from milk synthesis.14,15
Accumulated local factors within the mammary gland (e.g. serotonin, transforming
growth factor β1) together with diminished prolactin concentration promote a decline in
the rate of milk synthesis and secretion and initiation of programmed cell death such as
apoptosis and autophagy.16–19 As expected, secretory volume and milk constituent (milk
fat, protein, and lactose) concentrations decrease, except for inflammatory factors like
lactoferrin.20
Histological and ultrastructural changes across the dry period reflect a secretory
shift in the mammary gland rather than extensive tissue regression. Alveolar structure is
generally maintained, and even though cell death is initiated, tissue and cellular

17
regression is not as dramatic as in other species such as rodents due to the
concurrency of late gestation and the necessity for cellular proliferation for the next
lactation.21 An inverse relationship between stromal and parenchymal tissue has been
reported across a 60-d dry period.2 Luminal area decreases until about the middle of the
dry period (25 d dry), but then increases 7 d prepartum due to colostrogenesis in
preparation for the next lactation, whereas stromal area increases at 25 d dry and
decreases as the cow reaches 7 d before calving.2 Other cytological changes include
the appearance of large vacuoles through fusion of secretory vesicles in MECs,
accumulation of lipid droplets, decrease of cellular organelles, microtubule disassembly,
and increased tight junction permeability.21–23
Generally, the dry period is divided into three phases known as active involution,
steady-state involution, and redevelopment. Involution is the natural process by which
the mammary gland transitions from a lactating to a non-lactating state including a
decrease in milk secretion and consequent rise in mammary pressure, apoptosis and
autophagy of MECs, and inflammatory response.20,21,24,25 Involution continues for
approximately 21 d, followed by redevelopment of the mammary gland until calving.26
Redevelopment consists of a higher rate of cell proliferation and, near parturition, an
increase in secretion for colostrogenesis. However, there is some debate over the
assignment of specific phases to the dry period of the pregnant, late-lactation cow.
Smith and Todhunter27 were the first to assign the three phases described above.
Others note that the short duration of the bovine dry period along with the concurrency
of pregnancy indicates there is no time for a “steady-state” period of involution.2,20
Additionally, because there was no significant loss of mammary cells during the dry

18
period in Holstein cattle dried off in late-gestation, Capuco et al. believe that the term
“involution” was inappropriate to characterize the initial phase.2
Molecular Regulators of Mammary Involution and Redevelopment
Even though significant cell loss does not occur during the bovine dry period, the
early stages of involution at the histological level are still complex, requiring initiation of
epithelial cell death, tissue remodeling, and controlled influx of immune cells. Many
factors involved have been well-established and described in mouse and bovine models
using microarrays and quantitative real-time PCR (qRT-PCR). Time course and degree
of mammary involution differs greatly between species, so caution must be taken when
translating findings and specific molecular markers between the two models. Stein et al.
(2007)28 describes the main characteristics of cell death and immune signaling within
the first 72 hours of involution in the mouse model. The first stage of mouse involution is
reversible and is comparable to the active involution phase of dairy cattle. Accumulation
of milk causes tight junction permeability and accumulation of local factors such as
lactalbumin induce apoptosis, leading to upregulated pro-apoptotic factors including
Igfbp5, Stat3, Tgfb3, and FasL and caspases, and reduced survival factors such as Igf1,
Akt, and Stat5, to name a few.29 Within 12 hours of milk stasis, there is an increase of
cell death-inducing ligands from these alternative cell death pathways; one of the most
studied pathways is highlighted here.30 The protein LIF binds to LIFR, which activates
the Jak/Stat pathway and phosphorylates the signal transducer STAT3.31 This
transcription activator is highly proapoptotic, upregulating factors important for early
apoptosis like C/EBPδ (activates an acute phase response) and IGFBP5
(downregulates IGF) and downregulating the major survival factor pAKT through
induction of phosphoinositide 3-kinase.32–34 This 12-hour period also leads to an

19
increase in proinflammatory cytokines (such as interleukins IL-1a, IL-1b, and IL-13) and
a neutrophil-attracting chemokine Cxc11.30 While mammary gland involution is not
characterized by an inflammatory response, it does resemble a wound healing process
with attraction of neutrophils and later macrophages to phagocytize apoptotic cell and
debris. Genes such as p53, Tgfb3, Stat3, Igfbp5, C/ebpδ, and Vdr are landmarks of the
first 12-hour phase.32,33,35–38 As involution progressed to 24 hours, Stein et al. (2004)39
found an increase in alternative cell death pathways involving the Vitamin D(3) receptor,
prolonged expression of anti-inflammatory responses, an acute phase response,
phagocytosis of apoptotic cells, and further activation of pro-apoptotic factors including
Tgfb3 and Bax.39
While cell death during involution is not nearly as extensive in the dairy cow,
many of these cell death-inducing ligands and immune response factors are shared in
the bovine model. Few studies in dairy cattle have utilized microarrays40 and qRT-
PCR25,26,41 to characterize the molecular events occurring in the bovine mammary
gland. Indeed, only one study has used a model during a typical gradual involution of
pregnant cows,26 whereas others have used different experimental models including
forced involution of non-pregnant cows at peak lactation40,41 and gradual involution of
non-pregnant cows at peak lactation.25 Singh et al.40,41 obtained tissues at short
duration time points (e.g. within hours of one another), but slaughtered cows to collect
this tissue. In contrast Sørenson et al.26 and Piantoni et al.25 utilized mammary biopsies
to reduce variation in the model by using the same animal but needed to space out
tissue collection to 3-d intervals or more. It was reported that there was an overall
upregulation of genes and/or proteins related to apoptosis (e.g. STAT3P, LIF, SOCS1,

20
SOCS3, CASP1, CLU, MYC, and TGFB3), tissue remodeling (AKT1, IGF1, and MMP2),
oxidative stress (e.g. SSAT, SOD2, and MT1A), and immune response (e.g. LTF, LBP,
SAA3, C3, and SPP1). There was also downregulation of cell survival signaling (e.g.
STAT5P) and biosynthesis of milk constituents including milk protein, fat, and lactose
synthesis gene expression (e.g. CD36, ACACA, SCD, LALBA, FABP3, and FASN)
during involution. Due to different physiological state at dry off, these different models
present slightly varied patterns of gene expression. In non-pregnant cows under abrupt
involution at maximal milk production, the mammary gland experiences extensive
apoptosis and increases expression of molecular markers such as STAT3P, SOCS, and
IGF1, decreases in STAT5P, but no change in IGFBP5 and AKT.41 These are conflicting
results compared to the pregnant, late-lactation dairy model that indicates that IGFBP5
and IGF1 expression increases if the cows are pregnant and dried off during late
lactation.26
Research exploring the gene expression of the bovine mammary redevelopment
period is scarce. The redevelopment phase is a proliferative, mammogenic period that
occurs after the completion of involution and before calving. During this phase,
upregulation of IGF1 and IGFBP326 promotes cell proliferation and turnover, leading to
increased MEC number and secretory capacity in preparation for colostrogenesis and
lactation.2 A shift in mammary gland gene expression occurs upon parturition as the
cow transitions between redevelopment and early lactation (lactogenesis to
galactopoiesis). When comparing gene expression between the late dry period (i.e.
redevelopment/lactogenesis, 5 d prepartum) and early lactation (10 d postpartum,
galactopoiesis) Finucane et al.42 found that genes upregulated during lactation were, as

21
expected, related to metabolic transport (e.g. amino acids, glucose, and ions),
carbohydrate and lipid metabolism, and cell signaling factors, indicating an overall
upregulation of milk synthesis upon calving. Meanwhile, genes downregulated during
lactation (in other words, increased expression during the redevelopment phase
prepartum) were associated with cellular proliferation and cell cycle (e.g. cyclins, cell
division genes), microtubule assembly, chromosome organization, DNA replication, and
RNA and protein degradation (e.g. proteasome activity), further highlighting the
importance of the redevelopment phase for tissue proliferation and regeneration of
mammary gland microstructure necessary to initiate colostrum secretion.42 Because
these shifts in gene expression and physiology both during the involution and
redevelopment phases are so dynamic and time-specific, they are sensitive to
environmental perturbations. One stressor that has been extensively studied and shown
to have large negative impacts on both dairy cow and producer is heat stress.
Heat Stress in Dairy Cattle
Climate change is defined as the long-term variation from normal weather
patterns including temperature, rainfall, and wind in a certain region.43 Rapid climate
changes are unprecedented in Earth’s recent history and may be one of largest
dilemmas facing life on the planet. Since 1880, global temperature has increased by an
average of 0.85°C and 9 of the 10 warmest years since 1880 have occurred in the past
15 years.44 The Intergovernmental Panel on Climate Change (IPCC) predicts continual
increases at unprecedented rates, with models indicating a 1.88°C to 4.08°C increase in
global average surface temperature by 2100.45 Besides the biological impacts of rising
temperatures on habitats, agricultural systems are suffering adverse consequences in
terms of reduced crop and livestock productivity, health, and quality, which threaten

22
economies and global food security. In fact, it is estimated that in the United States
alone, environmental heat stress in both lactating and dry cows costs the dairy industry
nearly $2 billion in losses annually due to decreased cow performance and increased
morbidity and mortality.46–48 Advances in heat abatement strategies that provide shade,
move air (e.g. fans, cross-ventilated barns), soak the cow’s surface (e.g. sprinklers,
soakers), and mist the cow in both the housing and milking facilities can maximize heat
exchange and reduce production losses during hotter seasons.46 Therefore, southern
and southeastern regions of the U.S. like Florida, Georgia, Texas, and Virginia that
experience more than 140 d of heat stress per year and together have a population of
nearly 1 million dairy cows48 should carefully consider providing heat stress abatement
to their herd across the heat stress period to maximize animal performance.
Environmental heat stress causes behavioral and physiological adaptations in
ruminant livestock that negatively impact productivity. As homeothermic animals, when
cattle are in their thermoneutral zone (environmental temperature 5 to 25°C)49,50
minimal and constant energy is needed to maintain normal body temperature (38.0 to
39.3°C).51,52 Physiological heat stress occurs when an animal is pushed past the upper
limit of the thermoneutral zone through increased environmental temperature or solar
radiation, causing an increase in body temperature that increases total heat load
(environment plus heat internally produced) past equilibrium to total heat dissipation. To
acclimate to this environmental strain, the animal adapts physiology and behaviors to
reduce heat production and increase heat loss, primarily through respiratory and
cutaneous evaporative heat loss.53 In dairy cattle, a livestock species especially
susceptible to thermal stress due to high metabolic rates and high production demand,

23
heat stress response is initiated above skin-surface temperature of 35°C and
acclimations occur at a temperature-humidity index (THI) as low as 68.54,55 Initial short-
term acclimatory responses include homeostatic mechanisms such as increased water
intake by approximately 30-35%, elevated sweating and respiration rates, decreased
heart rate, reduced feed intake, and energy diversion from production (e.g. milk
yield).52,56,57 If heat stress is prolonged, further alterations for long-term acclimation
include alterations in the expression of specific genes and coordinated cellular
responses to improve efficiency of signaling and metabolism, likely through the
mediation of heat shock proteins (HSP)56,58 one of the hallmarks of heat stress
response. Shifts in the endocrine system are also implicated in heat stress acclimation.
For example, decreased expression of growth hormone, glucocorticoids, and thyroid
hormones thyroxine and triiodithryonine reduce basal metabolic rate to lower heat
production,59–62 and increased expression of prolactin impacts sweat gland function and
insensible (i.e. evaporative) heat loss.63,64
Physiological acclimations such as reduced feed intake, energy partitioning, and
hormonal variation may ultimately adversely affect animal health and reproduction.65
Across species, heat stress directly causes illnesses like heat stroke, exhaustion,
cramps, and eventual organ dysfunction that can lead to death.43,66,67 Further, thermal
stress indirectly alters animal health by inducing lower feed intake, which leads to
increased metabolic disorders like ketosis, liver lipidosis, and oxidative stress during the
transition period.68–70 Rumen acidosis may also occur due to altered rumen pH from
fewer buffering agents, reduced volatile fatty acid absorption, and increased respiration
rates.71–74 Immune response is negatively impacted, as higher temperatures can alter

24
microbial populations in and around animals, improve survival and multiplication of
bacteria in the animal, and decrease host resistance, all of which may increase mastitis
and potentially other infections in dairy cattle.75–77 Furthermore, environmental exposure
to heat stress impairs dairy cow reproductive performance. Dairy cows inseminated in
the summer or heat-stressed in climate chambers experience altered estrous cycle
hormone levels and lowered estrous expression, reduced conception rates, impaired
embryo growth and survival, and inhibited fetal growth and maintenance, all leading to
poor female fertility.63,78–80
One of the largest concerns for dairy producers is the impact of environmental
heat stress on milk production. Lactating cows will reduce energy intake and divert
remaining energy towards heat loss, leading to a negative energy balance and thus less
energy available for lactation. Researchers estimate that for every increase in one THI
unit above ~68-70, cows will experience a 0.23-0.50 kg/d drop in milk production.43,81–83
Stage of lactation and production demand factor into heat stress impact with mid-
lactation, high-producing cows being most susceptible to heat stress perturbation due to
their energetic demands.84,85 Traditionally, reduced feed intake has been cited as the
cause for this drop in production.60,86 However, a pair-feeding study shows that the
indirect action of reduced dry matter intake accounts for only approximately 35% of the
heat stress induced lost yield in mid-lactation dairy cattle.57 Other contributing factors
include direct downregulation of genes in MECs associated with milk synthesis,87
altered carbohydrate metabolism through greater glucose disposal, insulin-dependent
glucose utilization, hepatic adaptations to thermal stress,88,89 and reduced mammary
blood flow and secretory function.74

25
Heat Stress During the Dry Period
As previously discussed, the dry period is a critical window for extensive
mammary growth and cell turnover required to maximize milk production in the next
lactation. Because this period coincides with late gestation, the cow undergoes huge
shifts in energy demands and will often experience negative energy balance, health and
metabolic disorders, and immune dysfunction in the transition from late gestation to
early lactation.90,91 To maximize milk production in the next lactation while minimizing
risk of negative influences, it is crucial that the cow’s environment, including exposure to
environmental heat stress, be well-managed to avoid further perturbations.
While dry cows generate less heat via metabolism86 and have a higher upper
critical temperature to their thermoneutral zone than lactating cows,92 heat stress during
the dry period can still negatively impact milk production. Compared to cows cooled with
fans and soakers, cows heat-stressed during the dry period will have impaired milk yield
in the next lactation, producing an average of 5-7.5 kg less milk per d for the entire
duration of the next lactation even when all cows are provided active cooling after
calving.93–95 Amount and duration of heat stress abatement will impact the effectiveness
of cooling strategies; shade-only,61 mid-day soaking,96 and/or cooling for only the late
dry-period97,98 will only partially rescue milk yield compared to more complex cooling
systems with shades, fans, and soakers that are run for the duration of the dry
period.95,99 Milk yield reduction has been partially attributed to altered cellular processes
in the mammary gland during the dry period including reduced autophagy in the early
dry period,100 decreased mammary cell proliferation during the late dry period,95 and
altered tissue microstructure.101 Further explanations for loss of performance include
reduced blood flow to the mammary gland that may impede mammary growth,102
26
altered endocrine signaling such as the inverse relationship between increased prolactin
blood concentrations and decreased prolactin receptor expression,99,103 and induced
HSP expression that inhibits apoptosis in the early dry period.104
In contrast to lactating heat-stressed cows that experience negative energy
balance due to reduced feed intake (30-35% reduction),57 cows under heat stress
during the dry period do not undergo negative energy balance even with the
combination of energy partitioned to the growing fetus and the energy lost to reduced
dry matter intake of 10-15%.105,106 Furthermore, these cows do not experience altered
concentrations or actions of glucose, insulin, beta-hydroxybutyrate (BHBA), or non-
esterified fatty acids (NEFA).60,94,107,108 These differences in metabolism could be due to
the different energetic needs between a high-producing, lactating cow and a dry cow in
late gestation.109 The reduction in intake under dry period heat stress does, however,
lead to reduction in body weight gain in late gestation.99 After calving, dry matter intake
between dry period heat-stressed and cooled cows is similar.95,110
Late-gestation heat stress will negatively impact cow performance outside of milk
production by influencing health, immune function, and reproduction during the
transition period. As part of a large-scale commercial farm analysis (n=2613),
Thompson and Dahl (2012)112 report increased incidence of mastitis, respiratory
disorders, and retained fetal membranes by 60 d postpartum in cows that were dried off
in the summer months, suggesting that compromised immune function due to dry-period
heat stress may be playing a role in these transition cow health disorders.104 Studies
also suggest that dry period heat stress alters both innate and acquired immunity by
impairing neutrophil function in early lactation,99 reducing peripheral blood mononuclear

27
cell proliferation,103,113 and increasing TNFA and IL8 gene expression in peripheral
blood mononuclear cells in late gestation and early lactation, respectively.114 Further,
reproduction is compromised in heat-stressed dry cows, as shown by cows dried off in
the summer months having increased number of breedings, days to first breeding, and
days to pregnancy after 150 d postpartum compared to cows dried in the cooler winter
months.112 However, these results should be considered with caution, as data was
confounded with seasonal effects during lactation, and other commercial (n=341) and
controlled studies (n=38) found conflicting results with no difference in reproductive
performance between heat-stressed and cooled dry cows.96,97
Mammary Gene Expression under Heat Stress
While physiology, endocrine status, and histology have been well-studied in
bovine heat stress models both during lactation and the dry period, relatively little
research has been conducted on heat stress acclimation via altered cellular gene
expression and accompanying molecular events, particularly within the mammary gland.
However, extrapolations from other models may be made, as the ability to survive and
adapt to thermal stress is a requirement for cellular life, demonstrated by the ubiquitous
stress responses among eukaryotes and prokaryotes and high conservation of heat
shock proteins across species, including the bovine.115–117 Sonna et al. (2002)118
established that thermal stress in animal models triggers anomalies in cellular function,
including inhibition of protein synthesis through altered transcription, translation, and cell
cycle progression, defects in protein structure and function, cytoskeletal disruption and
morphological changes, metabolic shifts, changes in membrane permeability, and
decreased cellular proliferation. These alterations invoke large changes in gene
transcription and protein synthesis in a heat stress response, causing activation of heat

28
shock transcription factor 1 (HSF1) and increased expression of HSP, increased
glucose and amino acid oxidation and reduced fatty acid utilization, stress-induced
endocrine activation, and immune response activated by heat shock proteins.115,117
Timing and activation of these pathways is critical for successful acclimation and
ultimately cell survival. HSF1 and HSP serve as the first line of defense against acute
cellular heat stress. Heat shock factors are transcription factors that regulate HSP by
binding to specific DNA sequences called heat shock elements in HSP promoters. Of
the three mammalian heat shock factors, HSF1 is known for its involvement in acute
response to heat stress.119 HSF1 is activated by the hydrophobic regions of extracellular
denatured proteins (a consequence of heat shock) then binds to heat shock elements to
increase HSP gene expression during elevated temperatures.120 HSF1 gene is mapped
to chromosome 14 in cattle,121 but bovine studies are limited in HSF1 regulation and
function despite importance for heat stress response initiation.
HSP are a group of highly conserved proteins induced by a variety of cellular
stresses, but originally identified in response to heat shock.115 Several HSPs are
expressed under thermoneutral, unstressed conditions and play roles in normal
physiological functions. However, HSP increases expression under heat stress
response for a short period of time, beginning within minutes of exposure and peaking
up to 3 hours later.118 These proteins possess three fundamental biochemical activities
include: 1) chaperone activity to prevent misaggregation of denatured proteins and
refolding denatured proteins into original conformation; 2) regulation of cellular redox
state; and 3) regulation of protein turnover by marking proteins for proteasome
degradation.116,122,123 HSP requires further investigation in livestock models, but few

29
studies in ruminants report possible associations of single nucleotide polymorphisms
(SNPs) in the HSP70 genes with weight gain, pregnancy, and mastitis124–126 and directly
with heat stress response in vitro.87,127
Outside of HSP, additional transcription factors and genes experience expression
changes under cellular heat stress in a variety of species and tissues (e.g.
downregulated: Myc, Bcl2, TnfA; upregulated: Vegf, TgfB, p53, Nfκb, C/ebpB) that are
likely to alter the physiological cellular stress response through roles in apoptosis, cell
growth, differentiation, and division.118 These genes may act in a tissue specific manner
to modulate cellular responses and are of interest in dry cows due to their additional
roles in mammary gland involution and redevelopment.
To capture genetic alterations related to BMEC development and function under
early, acute heat shock response, Collier et al. (2006)87 conducted a microarray
analysis of in vitro bovine mammary epithelial cells (BMEC) exposed to acute
hyperthermia at 42°C vs. control thermoneutral cells at 37°C with RNA collected at 1, 2,
4, and 8 h after initiation of heat shock. Overall, there were 340 genes responsive to
thermal stress with the majority downregulated. These heat-stressed cells experienced
downregulation of genes related to ductal branching and microtubule assembly. That
observation was supported by phallodin-stained BMEC collagen whole mounts that
showed a dramatic reduction of ductal structures compared with thermoneutral cultures.
Cell growth was reduced through downregulation of genes related to cell cycle, cell-
specific biosynthesis, metabolism, and structural proteins. Concurrently, there was an
upregulation of genes involved in stress responses, protein repair, and apoptosis.
Further, HSP70 was upregulated in the heat-stressed cells through 1, 2, and 4 h (with

30
peak expression occurring at 4 h) before expression declined to basal levels at 8 h of
acute exposure accompanied by increased apoptotic gene expression, indicating that
the cells lose thermotolerance after 8 h of exposure and undergo cell death.87 Together,
these results indicate a shutdown of cellular growth and development and an increase
in cell survival in response to heat stress until the thermal load becomes too great and
cells die.
While the effect of acute heat stress on primary cellular processes and in vitro
BMEC gene expression has been determined, the impact of both acute and long-term
heat stress on whole genome expression of the mammary gland in vivo has yet to be
elucidated for the bovine. As genomic and transcriptomic analytic tools continue to
advance, scientists can discover even more genes associated in the heat stress
response and elicit the complex pathways that lead to thermotolerance.
RNA-Sequencing Technology
RNA-Sequencing (RNA-Seq) is a technology that emerged just over a decade
ago and has revolutionized biotechnology, specifically transcriptomics, in the 21st
century.128 The transcriptome contains the full set of RNA transcripts in a cell and their
relative quantities under different physiological conditions. Because RNA is a baseline
indicator of cell identity and function, assessing animal cellular transcriptomics can be
utilized for determining phenotype. Therefore, the development of this high-throughput
RNA-Seq tool has provided avenues for detailed exploration of entire transcriptomes.
The term “RNA-sequencing” was first mentioned in literature in 2008 according to the
ISI Web of Knowledge, and to date over 16,000 articles containing this keyword have
been published (as of a February 2018 search), indicating an explosion of research in
this field in only ten years. It has been utilized in transcriptome analysis of many model

31
organisms such as mice,129,130 yeast,131–133 Drosophila,134 Arabidopsis,135 and
humans136–138 to name a few and can be utilized to explore non-model organisms such
as lesser known plant, insect, and mammalian species to gain further insight into their
physiology.
The basis of RNA-Seq technology is a “sequencing-by-synthesis” approach using
deep-sequencing technologies.139 It is used for two major types of analyses: discovering
novel sequences or quantifying current transcripts by comparing samples from wild-
types vs. mutants, different treatments, or even different tissues within the same
organism. Any RNA sample extracted with high enough quality and purity to be reverse-
transcribed can be analyzed through RNA-Seq. Illumina IG,129,131,132 Applied
Biosystems SOLiD,130 and Roche 454 Life Science140–142 sequencing systems have
been utilized in published RNA-Seq research. The following brief description of library
preparation and sequencing is based on the method used in this research: Illumina
(Illumina®, New England Biolabs, USA).
After tissue collection and RNA extraction, library preparation occurs starting with
RNA fragmentation to the necessary base pair (bp) length (~30-400 bp). RNA
fragmentation allows for cleaner reads at the core of the transcript whereas
fragmentation further in the process after reverse transcription, DNA fragmentation,
leads to improved recognition at the 3’ ends of fragments.139 The population of
fragmented RNA is converted to a library of cDNA transcripts with adaptors added to
one or both ends. These adaptors allow for the fragments to be recognized by the
sequencing machine and make it possible to sequence multiple barcoded samples at
one time, saving time and resources. DNA fragments are PCR amplified via bridge

32
amplification and quality control checked for concentration and length.128 Next, the
fragments are fixed to a glass surface in a grid and this flow cell is inserted into the
sequencing machine. In the machine, a new DNA strand is synthesized alongside the
immobilized transcripts as immunofluorescent probes color-coded to the four
nucleotides affix themselves to each fragment one nucleotide at a time. After each
probe addition, a highly sensitive camera system records the fluorescent colors at that
nucleotide level for each fragment in the flow cell, then the color is washed away for the
addition of the next probe at the next nucleotide level,128 repeating until the full
sequence has been read. The Illumina HiSeq instrument, as an example, is capable of
generating up to 5 billion reads, allowing for a high number of reads for a large number
of samples (e.g. assuming 10 million reads is sufficient for a high level of coverage, 500
RNA-Seq reactions are possible). Thus, this incredibly high-throughput capacity of the
Illumina system has made it the preferred method for RNA-Sequencing.128 Following
sequencing, the reads are aligned to a reference genome for eventual quantification or
assembled without genomic sequence to generate data of the transcriptional structure
and gene expression to later unravel or compare differentially expressed genes
between treatments, specimen, or tissues.
Transcriptome Analysis Technology Comparisons
While the RNA-Seq technology is still advancing, its current features have far
superseded previous transcriptomic analysis technologies under the hybridization
approach (e.g. microarrays) or technologies utilizing Sanger sequencing (e.g. serial-
analysis of gene expression, cap-analysis of gene expression, and massively parallel
signature sequencing).139 In fact, authors that correlate RNA-Seq results to previous

33
microarray work conclude that this new technology will soon replace the previous
methods because of numerous advantages described below.135,142
First, RNA-Seq is not limited to detecting changes in transcripts from known
sequences as it is not dependent on existing knowledge of the genome; whereas
microarrays, for example, require prior information from genome sequencing or
expressed-sequence tags to draw conclusions.139 This independence from sequence
comparison allows simultaneous sequence discovery and quantification. RNA-Seq can
determine transcription boundaries, exon connections, and sequence variations in the
transcriptome. Again, this makes RNA-Seq a vital tool for transcriptomics in non-model
organisms and complex transcriptomes.
Next, microarrays measure relative fluorescent intensity, so they generate high
background noise due to cross-contamination and saturation of signals, making it
difficult to detect a broad range of expression especially reads with relatively very low or
high expression.143,144 Unlike microarrays, RNA-Seq has little to no background signal
as sequences are mapped unambiguously to unique genomic regions.139 Thus RNA-
Seq directly measures RNA abundance and does not have an upper limit in
quantification, allowing for at least a two orders of magnitude broader range in
expression when compared with mircoarrays.128 In fact, studies report estimated
dynamic ranges of greater than 9,000-fold in Saccharomyces cerevisiae131 and
spanning 5 orders of magnitude in mice.129 This specificity also allows for high levels of
accuracy, confirmed through qRT-PCR and spike-in RNA controls, and improved
replicability of RNA-Seq studies between labs.133,145 Finally, as previously mentioned,

34
this technology utilizes small amounts of RNA and is high-throughput with relatively low
costs (especially compared to Sanger sequencing) that are dropping every year.128
RNA-Seq is not without its challenges, however. Library construction introduces
several manipulation steps that can complicate identification of both large and small
transcripts, introduce bias into the reads, and hinder statistical analysis.139 Further, the
large number of reads generated upon sequencing proves a bioinformatics challenge,
as a huge amount of storage space and computer capacity is needed to analyze and
store RNA-Seq data. Finally, researchers must consider coverage versus cost when
running their data. Higher read numbers will lead to fuller coverage of the transcriptome;
for example, in the study of the S. cerevisiae transcriptome, 4 million reads covered
80% of the transcriptome whereas 35 million reads covered >90%.131 Large and
complex transcriptomes will also require more sequencing depth for satisfactory
coverage. However, higher read numbers lead to added expense, and one must weigh
the moderate increase in level of coverage against the sizable increase in reads.
RNA-Sequencing Application in Bovine Research
Transcriptomics is now being widely utilized in bovine research. Studies using
RNA-Seq have characterized the transcriptome of the mammary gland and milk
secretions to determine production phenotypes,146 characterized the bovine milk
transcriptome,147 determined expression profiles of microRNAs (miRNAs) related to
lactation and the dry period,148 revealed candidate genes for extreme milk protein and
fat concentration,149,150 and even analyzed the optimal RNA source for determining
transcriptional activity during lactation.151 RNA-Seq has been extensively applied to
study reproduction and metabolism in the bovine. Huang and Khatib (2010)152
surveyed the bovine embryo transcriptome, citing it as the first application of RNA-Seq
35
in cattle, while further research uncovered embryo genome activation153 and effect of
methionine supplementation on the embryo.154 RNA extracted from bovine blastocysts
has been analyzed in RNA-Seq to characterize the blastocyst transcriptome155 and
determine transcriptomic differences between in vivo and in vitro models.156 The
bovine liver transcriptome has been studied to determine the impact of negative
energy balance, particularly on expression of miRNAs.157,158
With bovine RNA-Seq research exploding in the past five to eight years, further
questions continue to be asked about the physiology of the many organs that
coordinate responses to milk production, metabolism, reproduction, and stresses. To
my knowledge, this research is the first RNA-Seq analysis of the bovine mammary
gland transcriptome both across the dry period and under environmental heat stress.
Summary
Further research is needed in the bovine model to characterize the late-lactation,
late-gestation dry period mammary transcriptome through both involution and
redevelopment. Additionally, there are no in vivo models that have studied the impact of
chronic heat stress and heat stress acclimation on the dry period mammary
transcriptome. Previous research, mainly from the University of Florida, has highlighted
the importance of heat stress abatement during the dry period to improve production in
the next lactation, but there are still questions as to how heat stress impacts the
mammary gland long-term at the cellular level and how to develop complementary
methods to active cooling that could rescue production loss. I was motivated to utilize
RNA-Seq to investigate the landscape of the mammary transcriptome both across the
dry period and under heat stress in order to answer some of these questions and to
provide a direction for future research in this area. The objective of this thesis was to

36
characterize novel genes, pathways, and upstream regulators involved in bovine
mammary gland involution and redevelopment during the dry period and to determine
how heat stress affects this dynamic process. I hypothesize that, relative to cooled
cows, cows exposed to heat stress will experience alterations in expression of key
genes and pathways required for normal involution and redevelopment, compromising
mammary function and milk production in the subsequent lactation. This thesis will not
only contribute to the knowledge in mammary gland and lactation physiology but will
also provide candidate genes and highlight entire pathways and transcription factors
involved in this processes that can be used for further investigation to manipulate the
dry period and to determine mitigation strategies against heat stress.

37
CHAPTER 2 RNA-SEQ REVEALS NOVEL GENES AND PATHWAYS INVOLVED IN BOVINE
MAMMARY INVOLUTION DURING THE DRY PERIOD AND UNDER ENVIRONMENTAL HEAT STRESS
Abstract
The bovine dry period is a dynamic non-lactating phase wherein the mammary
gland undergoes extensive tissue remodeling. Utilizing RNA-Sequencing, I
characterized novel genes and pathways involved in this process and determined the
impact of dry period heat stress. Mammary tissue was collected before and during the
dry period (-3, 3, 7, 14, and 25 d relative to dry-off i.e. D0) from heat-stressed (HT, n=6)
or cooled (CL, n=6) pregnant Holstein cows. RNA-Seq identified 3,315 differentially
expressed genes between late lactation and early involution, and 880 genes later in the
involution process. Differentially expressed genes, pathways, and upstream regulators
during early involution highlight the downregulation of functions such as anabolism and
milk component synthesis, and upregulation of cell death, cytoskeleton degradation,
and immune response. Environmental heat stress affected genes, pathways, and
upstream regulators involved in processes such as ductal branching, metabolism, cell
death, immune function, and protection against tissue stress. This research advances
the understanding of the mammary gland transcriptome during the dry period,
particularly under heat stress insult. Individual genes, pathways, and upstream
regulators highlighted in this study point towards potential targets for dry period
manipulation and mitigation of the negative consequences of heat stress on mammary
function.

38
Introduction
In dairy cows, the dry period is a six to eight-week non-lactating state initiated
between lactations that allows for optimal milk yield in the subsequent lactation through
the turnover of worn, senescent mammary epithelial cells (MEC) with new, active cells.2
It consists of three phases known as active involution, steady state involution, and
redevelopment. Involution is the natural process whereby the mammary gland
transitions from a lactating to a non-lactating state. It begins after the cessation of milk
removal and is characterized by a decrease in milk secretion and rise in mammary
pressure, apoptosis and autophagy of MEC, and immune response.20,21,24,25 Involution
continues for approximately 21 d, followed by redevelopment of the mammary gland
until calving.26
The onset of involution triggers the expression of genes and pathways that
function to increase cell death and immune signals. Downregulated pathways during
involution include prolactin signaling (via the inactivation of signal transducer and
activator of transcription [STAT]5, a cell proliferation and differentiation regulator)159,160
and insulin-like growth factor (IGF; via the upregulation of IGF-binding protein [IGFBP]5,
a regulator of cell apoptosis and tissue remodeling).161 The redevelopment phase is a
mammogenic period where upregulation of genes, such as IGF1 and IGFBP3, promote
cell proliferation and turnover to increase MEC number and secretory capacity in
preparation for colostrogenesis and lactation.2,26 Key candidate genes of involution have
been well characterized in rodent models. In dairy cattle, limited studies have been
done utilizing microarrays and quantitative real-time PCR (qRT-PCR) evaluate the
molecular events occurring in the mammary gland during a typical dry period of
pregnant cows,26 during forced involution of non-pregnant cows at peak lactation,40,41
39
and during gradual involution of non-pregnant cows at peak lactation.25 These studies
report an overall upregulation of genes related to cell turnover, oxidative stress, tissue
remodeling, and inflammation and downregulation of cell survival signaling and
biosynthesis of milk constituents during involution and upregulation of cellular
proliferation later during redevelopment. However, a more thorough characterization of
the entire bovine mammary transcriptome through in vivo dry period models is lacking.
Perturbations, such as impaired nutrition and poor management, during the dry
period may alter the involution process and affect cow performance. Indeed, exposure
of dairy cows to environmental heat stress during the dry period decreases milk
production in the subsequent lactation.94,95 This phenomenon has been partially
attributed to reduced autophagy in the early dry period,100 decreased cell proliferation in
the late dry period,95 and altered alveolar microstructure.101 Bovine MEC exposed to
acute heat stress in vitro downregulate genes related to cell cycle, focal adhesion and
cytoskeleton activity, cell biosynthesis and metabolism, ductal branching, and
morphogenesis and upregulate genes involved in stress response and protein
repair.87,127 Whereas the effect of heat stress on cellular processes and in vitro gene
expression has been studied, its impact on the mammary gland transcriptome through
in vivo models has yet to be elucidated for the bovine.
The aim of this study was to discover and characterize novel genes, pathways,
and upstream regulators involved in mammary gland involution and redevelopment
during the dry period and to determine how heat stress affects this dynamic process in
the dairy cow by utilizing RNA-Seq. I hypothesize that, relative to cooled cows, cows
exposed to environmental heat stress will experience alterations in expression of key

40
genes and pathways required for normal involution and redevelopment, compromising
mammary function and milk production in the subsequent lactation.
Materials and Methods
Animals, Treatments, and Experimental Design
This study was conducted at the University of Florida Dairy Unit (Hague, FL;
29.7938° N, 82.4944° W) during the summer of 2015. The University of Florida
Institutional Animal Care and Use Committee approved all treatments and procedures.
Twelve multiparous Holstein cows selected based on mature equivalent milk production
and parity were dried off at ~46 d before expected calving. Cows were randomly
assigned to two treatments for the duration of the dry period: heat-stressed (Figure 2-
1A, HT, n=6; access to shade in a sand-bedded free-stall pen) or cooled (CL, n=6;
access to shade, fans and soakers in a separate pen). Fans (J&D Manufacturing, Eau
Claire, WI) ran continuously and soakers (Rain Bird Manufacturing, Glendale, CA) were
activated when ambient temperature reached 21.1°C, running for 1.5 min in 6 min
intervals. After calving, cows were treated identically with access to shade, fans, and
soakers. Details of the total mixed ration diet, dry matter intake, rectal temperature and
respiration rates during the dry period, and milk production during lactation are reported
in Fabris et al. (2017).106
Mammary Tissue Collection and RNA Extraction
For all cows, mammary biopsies were collected at day (D) -3 (before dry-off
during late lactation) and at D3, 7, 14, and 25 relative to dry-off (which was considered
D0) based on the method described by Farr et al. (1996)162 with slight modifications95
(Figure 2-1B). Time points for mammary biopsy collection were chosen to capture the
three phases of the dry period: D-3 represents late lactation, D3 and D7 represents

41
active involution, D14 represents the steady-state phase, and D25 captures the
beginning of the redevelopment phase. Mammary tissue biopsies were washed in
sterile saline, trimmed of visible fat, placed in RNALater (ThermoFisher, Invitrogen,
Grand Island, NY), and stored at -80° C until RNA isolation. Total RNA was extracted
using the RNeasy Mini Kit (catalog #74104, Qiagen, Valencia, CA) according to the
manufacturer’s instructions. RNA concentration was determined on Qubit® 2.0
Fluorometer (ThermoFisher, Invitrogen, Grand Island, NY), and RNA quality was
assessed using the Agilent 2100 Bioanalyzer (Agilent Technologies, Inc.). Total RNA
with 28S/18S > 1 and RNA integrity number ≥ 7 were used for library construction.
Library Generation and RNA Sequencing
RNA-Sequencing (RNA-Seq) library was constructed using NEBNext® Ultra™
RNA Library Prep Kit for Illumina® (New England Biolabs, USA) following
manufacturer’s recommendations. Briefly, 500 ng of total RNA was used for mRNA
isolation using NEBNext Poly(A) mRNA Magnetic Isolation module (catalog #E7490)
then followed by RNA library construction with NEBNext Ultra RNA Library Prep Kit for
Illumina (catalog #E7530) according to the manufacturer's user guide. Sixty barcoded
libraries (n=12 cows at 5 different time points D-3, 3, 7, 14, 25) were sized on the
Bioanalyzer, quantitated by QUBIT and quantitative PCR using the KAPA library
quantification kit (Kapa Biosystems, catalog #KK4824). Finally, the 60 individual
libraries were pooled equimolarly and sequenced by Illumina NextSeq 500 for 5 runs
(Illumina Inc., CA) which generated 150 base-pair single-ended reads.
Mapping, Assembly, and Normalization of RNA-Seq Data
The quality of the sequencing reads was evaluated using FastQC software, and if
necessary, sequencing reads were trimmed using the software Trim Galore (v0.4.1).

42
Sequence reads were mapped to the bovine reference genome (bosTau7) using the
software package Tophat (v2.0.13).163,164 Two rounds of alignment were performed to
maximize sensitivity to splice junction discovery, allowing for full utilization of novel
splice junctions. Novel splice junctions were first determined in each sample
individually, then combined with the known ENSEMBL annotated splice junctions and
entered in Tophat for a second alignment.154,165 Read alignments were discarded if they
had greater than two mismatches or were equally mapped to more than 40 genomic
locations. The subsequent alignments were used to reconstruct transcript models using
the software package Cufflinks (v2.2.1).166 The Cuffmerge tool was used to merge each
assembly to the bovine annotation file, combining novel transcripts with known
annotated transcripts to maximize quality of the final assembly. The number of reads
that mapped to each gene in each sample was calculated using the tool htseq-count.167
Identification of Differentially Expressed Genes, Pathways, and Regulators
Differentially expressed genes were detected using the R package edgeR
(v.3.4.2).168 This package combines the use of the trimmed mean of M-values as the
normalization method of the count data, an empirical Bayes approach for estimating
tagwise negative binomial dispersion values, and finally, generalized linear models and
quasi-likelihood F-test for detecting differentially expressed genes (DEGs). The
following comparisons over time were made: D3 vs. D-3, D7 vs. D3, D14 vs. D7, and
D25 vs. D14 to highlight differences in gene expression as the cow transitions between
dry period phases, focusing on the active involution phase. Additionally, due to the lack
of a significant interaction between time and treatment, HT vs. CL were compared for
each time point independently.

43
Genes that were differentially expressed over time or between treatments were
analyzed using Fisher’s exact test to determine significant enrichment of Gene Set
Enrichment Analysis Gene Ontology (GO) Kyoto Encyclopedia of Genes and Genomes
(KEGG) pathways and Medical Subject Headings (MeSH) terms.169 For all
comparisons, genes that had an ENSEMBL annotation and a false-discovery rate (FDR)
≤ 5% were tested against the background set containing all expressed genes with
ENSEMBL annotation. The GO, KEGG and MeSH enrichment analyses were
performed in R software using goseq170 and meshr171 packages respectively. Functional
categories with a nominal p <0.05 were considered significantly enriched by DEGs.
Additionally, DEGs were explored using Ingenuity® Pathway Analysis (IPA®,
Ingenuity Systems, Qiagen, Valencia, CA) to determine upstream regulators. For each
comparison, lists of DEGs with ENSEMBL annotation were uploaded into IPA and
compared to the background annotated bovine genome (24,616 unique ENSEMBL IDs).
Both up- and downregulated genes were analyzed together. The IPA feature Upstream
Analysis was used to determine significant upstream regulators within the dataset. IPA
broadly describes upstream regulators as any molecule that can affect the expression of
other molecules. The impact of upstream regulators was calculated using overlapping p-
value to identify regulators that explained observed gene expression changes and
activation z score to estimate the activation state of predicted regulators. From this list
of upstream regulators, IPA generates a molecular network of upstream regulators,
downstream target genes, and biological functions that are impacted by expression
changes in these molecules.

44
Validation of RNA-Seq Results with qRT-PCR
Ten DEGs were chosen for validation of RNA-Seq results, five DEGs
downregulated at D3 (α-lactalbumin, LALBA; β-casein, CSN2; casein-αS1; CSN1S1;
casein-αS2, CSN1S2; solute carrier family 7 member 5, SLC7A5) and five upregulated
genes at D3 (matrix-remodeling-associated protein 5, MXRA5; lipopolysaccharide
binding protein, LBP; lysyl oxidase like 4, LOXL4; angiopoietin like 4, ANGPTL4; solute
carrier family 7 member 8, SLC7A8). Validation was performed using qRT-PCR
conducted with the CFX96 Touch Real-Time PCR Detection System (Bio-Rad). A total
of 1 μg RNA from each sample was used to synthesize cDNA using the iScript cDNA
synthesis kit (Bio-Rad Laboratories, CA) and diluted 1:5 in dH2O. Reaction mixtures
were performed as previously described172 and cycling conditions were as follows: 1
cycle for 3 min at 95°C then 50 cycles of 10 s at 95°C and 30 s at 60°C followed by melt
curve measurement from 65°C to 95°C in 0.5° increments for 5 s. Positive and negative
controls were added to each PCR plate. Each sample was assessed in duplicate and
the %CV between the duplicates was < 2%. Primer sequences for the validated genes
were obtained from the literature or specifically designed to span exon-exon junctions to
minimize the potential of amplifying genomic DNA using Primer3 software (Table 2-1).
173,174 The geometric mean between two housekeeping genes (ribosomal protein S9,
RPS9 and ubiquitously expressed prefoldin-like chaperone, UXT) was used to calculate
the relative gene expression using the method 2-ΔΔCt with D3 as the reference group.175
Results
Physiological Parameters and Milk Yield
Physiological parameters and production data of the cows used in this study are
reported in Fabris et al. (2017).106 Briefly, heat-stressed and cooled pens had similar

45
temperature humidity index (THI) which was never lower than 68 at any time during the
experimental period. Cows provided with active cooling during the dry period had a
tendency toward higher feed intake (11.0 vs. 10.3 ± 0.46 kg/d, p = 0.10; CL vs. HT
respectively), had lower rectal temperature (38.92 vs. 39.31 ± 0.05°C, p < 0.01), and
had reduced respiration rates (45.2 vs. 77.2 ± 1.59 breaths/min, p < 0.01) compared
with heat-stressed cows. Thus, heat stress was effective in inducing physiological
changes. On average, cows provided with active cooling during the dry period produced
4.8 kg more milk over 9 weeks compared to heat-stressed cows (40.7 vs. 35.9 ± 1.6
kg/d, p = 0.09).
Mapping Statistic Summary
RNA-Seq technology was used to analyze genome-wide gene expression of
mammary samples collected on D-3, 3, 7, 14, and 25 relative to dry-off (D0) for cows
under HT or CL conditions. Through Illumina sequencing, roughly 34 million single-
ended reads per sample were acquired. Approximately 81% of the reads were
successfully mapped to the bovine genome. Among these aligned reads, 98% were
mapped to unique genomic regions. Only uniquely mapped reads were considered in
the analysis. Sequencing data can be accessed through NCBI GEO with accession
number GSE108840.
Differentially Expressed Genes and Pathways Across the Dry Period
The main effect of time relative to dry-off on the mammary gland transcriptome
was analyzed, comparing D3 vs. D-3, D7 vs. D3, D14 vs. D7, and D25 vs. D14. When
comparing D3 (initiation of involution) vs. D-3 (late lactation) 3,315 genes were
differentially expressed, of which 1,311 were upregulated, and 2,004 were
downregulated at D3 relative to D-3 (FDR ≤ 5%, Figure 2-2A, Object 2-1). These DEGs

46
were associated with 44 KEGG pathways and 51 MeSH terms (p ≤ 0.01, Figure 2-3A,
Table 2-2). KEGG pathways with a high percentage of DEGs upregulated at D3 were
related to cytoskeleton and cellular degradation and immune response, whereas
pathways with a greater ratio of downregulated DEGs were associated with anabolism
and amino acid biosynthesis and metabolism. Similarly, MeSH terms related to
cytoskeletal proteins and cellular differentiation and movement had a high proportion of
DEGs upregulated at D3, whereas terms with a greater number of downregulated DEGs
at D3 were associated with lactation, milk proteins, and amino acids.
There were fewer DEGs when comparing D7 vs. D3, which captures the first
week of involution, with 880 DEGs between these time points, 292 of which were
upregulated and 588 of which were downregulated at D7 (FDR ≤ 5%, Figure 2-2B;
Object 2-2). These DEGs were grouped into 11 enriched KEGG pathways and 14
MeSH terms (p ≤ 0.01, Figure 2-3B; Table 2-3). Only one KEGG pathway, cell cycle,
had a high proportion of DEGs that were upregulated at D7. The other ten pathways
had a greater ratio of DEGs that were downregulated, and these were associated with
cytoskeleton degradation and immunity. DEGs in MeSH terms related to cyclin were
exclusively upregulated at D7, while the majority of DEGs in MeSH terms such as actin
and kinases were downregulated at D7. Interestingly, the majority of KEGG pathways
and MeSH terms had a higher percentage of downregulated DEGs at D7 compared with
D3, and 6 out of these 11 KEGG pathways were simultaneously enriched in the D3 vs.
D-3 comparison (e.g. regulation of actin cytoskeleton, focal adhesion, adherens
junction, p53 signaling pathway, bacterial invasion of epithelial cells, and leukocyte

47
transendothelial migration) indicating a common pattern of regulation during the first
week of involution.
As involution progressed to steady state and D14 vs. D7 was compared, there
were no DEGs at a FDR ≤ 5%. Using a nominal p ≤ 0.005 and log2 fold change ≥ |0.5|,
10 DEGs with 9 upregulated and 1 downregulated genes at D14 were identified, most of
which were unknown or uncharacterized (Table 2-4). As involution concluded and
redevelopment of the mammary tissue initiated, a slight increase in the number of DEGs
was detected when comparing D25 to D14. Twenty-six DEGs were identified, 4 of which
were upregulated and 22 downregulated at D25 (nominal p ≤ 0.005 and log2 fold
change ≥ |0.5|; Table 2-4). These DEGs were related to cell death and proliferation,
immune function, and metabolism. No pathways, terms, or upstream regulators were
determined for these comparisons.
Ingenuity® Pathways Analysis (IPA®) Regulator and Network Analysis
Upstream regulators and summary networks for D3 vs. D-3 and D7 vs. D3 were
assessed utilizing IPA. The list of 2,816 mapped DEGs for D3 vs. D-3 generated a
catalog of 179 predicted biological upstream regulators through IPA. After restricting the
analysis to those differentially expressed within the dataset with log2 fold change ≥ |1.0|,
41 significant upstream regulators were revealed (Figure 2-4A). The network analysis of
upstream regulators and corresponding downstream genes relative to D3 revealed the
participation in functions related to involution and metabolism of lipids, carbohydrates,
and proteins (Figure 2-4B).
As involution progressed (D7 vs. D3 comparison), there were fewer upstream
regulators expressed. From 748 mapped DEGs, a list of 556 predicted biological
upstream regulators was obtained through IPA. After restricting the analysis to those

48
differentially expressed within the dataset with log2 fold change ≥ |1.0|, 11 were
significantly different and the majority was upregulated at D7 (Figure 2-5A). The network
analysis of these 11 upstream regulators and corresponding downstream genes relative
to D7 indicates that these regulators play a role in involution, cell division, and
transcription and translation (Figure 2-5B).
Differentially Expressed Genes and Regulators Impacted by Heat Stress
Differentially expressed genes between dry period HT and CL cows at each
specific time point (e.g. D3, 7, 14, and 25 d relative to dry-off) were evaluated. When
using a FDR ≤ 5%, the only significant DEG was a non-annotated gene at D25 (log2FC
= -3.95 and q < 0.0001). The UCSC Genome Browser and NCBI identified this non-
annotated gene as a long non-coding RNA (lncRNA) at position chr7: 61592484-
61595879. The Sequence-Structure Motif Base Pre-miRNA Prediction Webserver was
used to discern pre-microRNAs (miRNA), corresponding mature miRNA seed regions,
and the miRNA secondary structures within the lncRNA sequence.176,177 The program
utilizes PriMir filtration and Mirident software to screen and confirm candidate pre-
miRNA sequences by score matrix based on features in sequence or structure of known
pre-miRNAs. The program revealed 7 mature miRNA seed regions and their secondary
structures. According to the bioinformatics program TargetScan utilizing the human
database,178 seed regions regulate 1,159 downstream target genes (Object 2-3).
Using a less stringent approach (p ≤ 0.005 and log2 fold change ≥ |0.5|), a total of
180 DEGs were detected when comparing HT to CL with 9, 115, 27 and 29 DEGs at
D3, 7, 14 and 25, respectively (Figure 2-6A; Table 2-5). Additionally, from D7 to D25, 11
genes were consistently upregulated and 7 consistently downregulated in HT cows
(Figure 2-6B). Upstream regulators and their resultant networks for HT vs. CL cows at

49
D7 were determined using IPA, where a catalog of 504 upstream regulators was
predicted. The network analysis of 11 significant upstream regulators (Figure 2-7A;
restricting the cut-off to differential expression within the dataset and log2 fold change ≥
|1.0|) and their corresponding downstream genes indicate these influence functions
related to cell death, immunity, lipid synthesis, and development (Figure 2-7B).
Validation of RNA-Seq Results with qRT-PCR
Ten DEGs of D3 vs. D-3 (D3 downregulated: LALBA, CSN2, CSN1S2, CSN1S1,
SLC7A5; D3 upregulated: MXRA5, SLC7A8, LBP, ANGPTL4, LOXL4) were selected to
validate RNA-Seq results followed the same direction of expression under qRT-PCR
and had comparable log2 fold change (Figure 2-8A). Expression levels calculated via
RNA-Seq were significantly positively correlated to expression levels determined via
qRT-PCR (Figure 2-8B; R2= 0.9386, p < 0.0001).
Discussion
The dry period is characterized by dynamic shifts in mammary gland cellular
metabolism, cell turnover, immune signaling, and tissue remodeling. Any perturbation
(e.g. exposure to heat stress) of these cellular processes and developmental events
could severely reduce the mammary gland’s ability to effectively involute and redevelop,
negatively affecting milk production in the next lactation.95,108 The present study
confirms the involvement of metabolic, cell death, and immune-related genes and
pathways in the bovine mammary gland during the dry period and reveals others not
previously reported. These findings provide insights into the landscape of the bovine
mammary transcriptome undergoing involution when exposed to environmental heat
stress, highlighting changes in cell death, branching morphogenesis and cell response
to stress.
50
Cessation of milking induces the recruitment of immune cells and local factors,
such as pro-apoptotic signaling factors, and increases mammary pressure. This leads to
a dramatic decline in milk synthesis and metabolic processes and protects against
inflammation.20,40 More than 3,000 DEGs between late lactation and early involution and
more than 800 DEGs during the first week of involution were discovered. After seven d
of milk stasis, the mammary gland approaches the end of the active involution phase.
Interestingly, there were no DEGs under FDR ≤ 5% during the steady state and
redevelopment time-point comparisons (D14 vs. D7 and D25 vs. D14). Possible
explanations include failure to capture peak gene expression associated with
redevelopment, inability to identify post-transcriptional modifications through RNA-Seq,
and subtle physiological alterations not captured under the stringent statistical analysis.
To better understand the physiology of these two phases, statistical analysis was
relaxed to a nominal p ≤ 0.005 and log2 fold change ≥ |0.5| and uncovered 10 DEGs
during steady-state involution and 26 DEGs during redevelopment.
The most significant pathways downregulated during early involution were
related to synthesis and metabolism of lipids, proteins, and carbohydrates. These
findings are consistent with previous research where, in general, concentrations of milk-
specific constituents decline as galactopoietic activity halts in the involuting mammary
gland.4,20 Pathways and terms related to lipid metabolism (e.g. steroid biosynthesis,
synthesis and degradation of ketone bodies, fatty acid degradation, saturated and
unsaturated fatty acids) expressed a higher number of downregulated genes, indicating
reduced lipid synthesis and metabolism at D3 of involution. Pathways related to
biosynthesis, degradation, and transport of amino acid and terms related to milk

51
proteins (e.g. lactalbumin, caseins, and lactoglobulins) had a higher number of
downregulated genes at D3 of involution, which is consistent with downregulation of
milk protein gene expression and decreased concentrations of milk-specific proteins
upon milk stasis.40,179 Fifteen out of 17 DEGs in the valine, leucine, and isoleucine
degradation pathway were also downregulated. Interestingly, some of those genes (e.g.
IVD, DBT, BCAT2) are involved in catabolism of the branched-chain amino acids for
eventual milk protein synthesis.180,181 Production of the milk-specific carbohydrate
lactose declines rapidly upon milk stasis, accompanied by decreased lactose
synthetase activity.25,111 Six (UGP2, PFKM, LALBA, GANC, HK2, and B4GALT1) of the
11 DEGs in the galactose metabolism pathway, related to lactose synthesis and lactose
synthetase formation, were downregulated after 3 d of milk stasis.
Cell death is one of the molecular landmarks of involution. Pathways and genes
involved in different cell death mechanisms are well described in mouse and bovine
models of involution using microarrays and qRT-PCR and are confirmed in the present
study utilizing RNA-Seq. However, some discrepancies between animal models are
apparent. Accumulation of milk in a mouse model causes local factors to induce
apoptosis as soon as 12-hours after milk cessation. For example, LIF phosphorylates
the signal transducer STAT3,31 which downregulates a major survival factor pAk
through induction of PI3-kinase and downregulates IGF1 through upregulation of
IGFBP5.30,161,182 Cell death during involution is not as extensive in the dairy cow, and
while many of these factors discussed above were present in this study, their temporal
expression pattern was different. In this study, pro-apoptotic factors such as LIF,
STAT3, IGFBP5, CASP9, BAX, and SOCS3 were all upregulated at D3 of involution,

52
while the survival-signaling factor AKT1S1 was downregulated. Similarly, elevated
levels of apoptosis during the early dry period in Holstein cows are evidenced by
upregulation of histological markers and pro-apoptotic genes (e.g. CASP3 and IGFBP5)
at D4 of involution.26 These authors also reported a simultaneous increase in mammary
expression of proliferative genes (e.g. IGF1 and IGF1R) during the early involution (D4)
and redevelopment (D36) phases of the dry period. In the present study, not IGF-1 but
IGF1-R, IGFBP2 and IGFBP4 were upregulated in the mammary gland at D3 of
involution compared with late lactation. Abruptly drying-off non-pregnant dairy cows at
peak lactation increased apoptosis of the mammary gland (D3 to D8 after milk stasis),
indicated by increased STAT3 and SOCS3 and decreased STAT5 gene expression.41
However, IGF1 expression increased and IGFBP5, AKT and AKTP protein
concentrations did not change.41 Non-pregnant cows gradually dried-off had increased
mammary apoptosis from D5 to D14 of involution evidenced by upregulation of STAT3
and downregulation of AKT1, but no changes in IGFBP5 were reported.25 Additionally,
in this study, autophagy-promoting genes (e.g. ATG9, DRAM1, and EPG5) were
upregulated in the mammary gland of cows at D3 of involution, corroborating the
participation of autophagic cell death in the involuting bovine mammary gland.100,183,184
Discrepancies between the present model and other mouse and bovine models may be
attributed to the stage of lactation at dry-off, state of concurrent pregnancy, and reduced
extent of MEC turnover during involution. Pro-apoptotic and pro-proliferative molecules
may be co-expressed in the mammary gland of pregnant cows that requires both cell
death and proliferation during the dry period.

53
Other molecular landmarks of involution include disruption of cell tight junctions,
immune cell signaling, and cytoskeleton and extracellular matrix degradation. Not
surprisingly, mammary cell tight junction permeability was impacted by milk stasis.15
Herein, 15 out of 16 DEGs in the tight junction pathway were downregulated during the
first week of involution. Immune cell signaling is activated in response to milk stasis to
protect against mammary inflammation and remove debris through phagocytosis.185 In
the present study, the influx of immune factors was indicated by the upregulation of
bacterial invasion of epithelial cells and leukocyte transendothelial migration pathways
and upregulation of immune-related genes (e.g. LBP, TMSB4X, ANXA1, and STAT3)
after D3 of initiated involution. In addition, genes upregulated in the lysosome,
phagosome, and peroxisome pathways (e.g. SOD, LAMP1, SORT1, and COMP)
indicate clearing of apoptotic cell bodies after D3 of involution. Phagocytosis of
apoptotic cells is not pro-inflammatory and acts in a wound-healing manner39 by
inducing expression of inflammatory factors that were upregulated in this dataset (e.g.
IL34, IL27RA, IL6R, IL10RB, and IL1R1). Neutrophil-attracting chemokines (e.g.
CXCL12, CXCL13, and CXCL17) were upregulated at D3, in accordance with the pro-
inflammatory molecules reported in a mouse model of involution.30 The observed
downregulation of genes involved chemotaxis at D7 of involution is consistent with the
reported presence of immune factors in a non-pregnant bovine model at 36 h after milk
stasis.41 Pathways and terms associated with cytoskeleton degradation (e.g. adherens
junction, focal adhesion, regulation of actin cytoskeleton, and actins) had a greater
number of genes upregulated D3 of involution. This was accompanied by upregulation
of genes (e.g. RHOA) involved in the reorganization of the actin cytoskeleton. As

54
involution progressed to D7, adherens junction and actin cytoskeleton pathways were
downregulated while the stromal matrix metallopeptidase 27 (MMP27) was upregulated
indicating promotion of extracellular matrix breakdown.185
The present study revealed novel upstream regulators in the mammary gland
during early involution. Two upstream regulators that play central roles in energy
metabolism, PPARGC1A and INSIG1, were downregulated in the mammary gland of
dairy cows during early involution, supporting a rapid and coordinated decrease of
overall cellular metabolism upon milk stasis. Upstream regulators of lipid synthesis that
coordinate downstream target networks were downregulated at D3 of involution,
consistent with a previous bovine involution study.25 The regulator ACACA and its
lipogenic downstream target genes (FASN and GPAM) were downregulated. Similarly,
SCD, a key upstream regulator in oleic acid biosynthesis that interacts with and
regulates other upstream regulators (such as ACACA, LPL, and SREBF1) was
downregulated. The upstream regulator ALOX15, which acts on polyunsaturated fatty
acids to generate bioactive lipid mediators that regulate inflammation and immunity, was
also downregulated. Three pro-apoptotic factors IGFBP5, PTGES, and BACH2 are
examples of upstream regulators related to cell death that were upregulated at D3 of
involution relative to late lactation in the bovine model. As involution progressed to D7,
the number of upstream regulators dropped but the majority were upregulated and
related to the cell cycle. Specific functions of these factors include mitotic regulation
(NEK2), chromosome segregation through the spindle checkpoint (BUB1B), cyclin
dependent kinases (CKS2), and regulation of cyclin expression (FOXM1). There were
three downregulated upstream regulators: NUPR1, involved in combating micro-

55
environmental cellular stress, EFNA1, modulating developmental events in the vascular
system, and RET, a cell proliferation and growth signaling molecule. The upstream
regulator NUPR1 is not only a negative regulator of cell cycle but also targets
downstream genes that assist stress signaling to fortify cells against perturbations like
reactive oxygen species and defective DNA repair, all critical components of immune
response and tissue remodeling.
When analyzing gene expression changes further in the dry period, a less
stringent statistical analysis of steady-state involution (D14 vs. D7) and redevelopment
(D25 vs. D14) revealed interesting DEG patterns. There were 10 DEGs during the
steady-state involution (D14 vs. D7), 9 of which were upregulated relative to D14. This
was expected, as this phase does not express dynamic changes.27 The few genes
encoding known proteins play roles in heme metabolism (e.g. HMOX1 and
LOC100850059/hemoglobin subunit beta) and inhibition of immune response signaling
(e.g. CD300A), pointing towards vascular development and reduced need for an
immune response. The single downregulated DEG was the transcription factor GATA5
that regulates smooth muscle cell diversity. The redevelopment phase comparison
(D25 vs. D14) uncovered 26 DEGs with the majority downregulated at D25. While
downregulation may seem counterintuitive for a phase that promotes cellular
proliferation,26 these genes point toward inhibition of involution markers and decreased
expression of proliferation inhibitors. For example, genes downregulated include those
related to immune function and oxidative stress (e.g. LEP, C6, and GPX3), cell death
(e.g. FOSL2, TEAD4, and NFIL3), inhibition of metabolism (e.g. CH25H and GFPT2),
and inhibition of proliferation (e.g. CXCL2, TEAD4, and DACT2), all of which indicate a

56
shift away from cell death towards cellular proliferation. Across each time-point
comparison, this study revealed novel genes, pathways, upstream regulators and
transcription factors that could be targets of future studies to promote more rapid and
efficient mammary gland involution.
Interestingly, a non-annotated lncRNA was downregulated in the mammary
glands of heat-stressed dry cows compared with cooled cows at D25 relative to dry-off.
Long non-coding RNAs are involved in gene regulation through a variety of mechanisms
like binding to complementary RNA to affect RNA processing, turnover, or localization
or serving as precursors for smaller regulatory RNAs such as microRNAs or
piwiRNAs.186 I identified seven miRNA seed regions within the lncRNA sequence that
impact 1,159 downstream target genes, including known markers of involution (e.g.
SOCS3, IGF1R, IGFR, AKTIP) and upstream regulators that are significantly up- or
downregulated during involution or in heat-stressed dry cows (e.g. PPARGC1A,
ACACA, VEGFA, ERBB2). Recent studies have identified miRNAs differentially
expressed between lactating and non-lactating ruminants.148,187,188 For example, target
genes for miRNAs (e.g. miRNA-148 and miR-145) expressed during the dry period
promote cell death by downregulating STAT5188 and play a role in mammary
metabolism by targeting INSIG1 for lipogenesis. Inhibition of miR-145 in goat MEC led
to increased methylation levels of FASN, SCD1, PPARG, and SREBF1.189,190 Thus, the
downregulation of the lncRNA by heat stress might affect the regulation of miRNAs,
resulting in altered expression of proapoptotic and metabolic genes and key
transcription factors involved in mammary gland cell turnover and metabolism. Further

57
investigation is needed to determine how important these miRNAs are in regulating
downstream target gene expression in the mammary gland of heat-stressed cows.
Under a less stringent statistical analysis, this study identified genes impacted by
heat stress that play a role in key processes such as ductal branching, mammary
metabolism, cell death, immune function, and cell stress protection. Branching
morphogenesis of the mammary ductal network was inhibited in cows exposed to
environmental heat stress. Ductal branching during mammary development is
coordinated by epithelial cell cilia under the influence of signaling pathways, such as
Wnt and Hedgehog.191 In the present study, Wnt pathway inhibitor (WIF1) and genes
involved in ciliary function (e.g. LCA5, TEKT3, ACTL8, and MYO3B) were
downregulated at D7 of involution in cows exposed to heat stress relative to cooled
cows. In addition, upstream regulators and target genes involved in branching
morphogenesis were impacted by heat stress (e.g. PTHLH, MFGE8, and FGF2). These
results support previous reports of aberrant ductal branching of bovine MEC exposed to
very high temperatures in vitro.87 Furthermore, emerging results from related studies
suggest compromised mammary alveolar microstructure during lactation in cows
exposed to heat stress during the dry period.16
Genes related to fatty acid metabolism (e.g. FABP3, ACSM1), amino acid
transport (e.g. SLC38A3, SLC27A6, SLC39A8, and SLC31A2) and key upstream
metabolic regulators (e.g. INSIG, ALOX15, HSD11B1, PPARGC1A, and SCD) were
upregulated in the mammary gland of heat-stressed cows at D7 of involution. It is
possible that cows exposed to heat stress compensate for increased cellular stress by
promoting cellular metabolism. This possibility is supported by an in vitro study that

58
identified upregulated pathways related to functions necessary for cells undergoing
proliferation, such as cell biogenesis, in bovine MECs exposed to high temperatures.127
However, these findings are contradictory to another in vitro study that reported a
downregulation of metabolic genes in bovine MECs, leading to reduced cell growth,87
and to in vivo bovine models that reported increased utilization of glucose and amino
acids but reduced fatty acid metabolism in attempt to thermoregulate.88 It is possible
that these discrepancies could be due to the differences between in vivo and in vitro
models, the alternative metabolic needs between lactating and non-lactating cows, the
lack of negative energy balance in dry cows, and the cow’s ability to acclimate to heat
stress over the course of a few days.88,104
Changes in expression of autophagy proteins in the mammary tissue of heat-
stressed dairy cows have been reported,100 however, no genes related to autophagy
were impacted by heat stress in this study. Two other key cellular processes for a
successful involution of the mammary gland, apoptosis and immune response, were
impacted by heat stress. Genes playing a role in phagocytosis of apoptotic cells (e.g.
MFGE8), induction of STAT3 expression (e.g. IL20RB) and upstream regulators of
apoptotic promotion were upregulated in the mammary gland of heat-stressed cows
during early involution. Meanwhile, genes related to breakdown of the extracellular
matrix (e.g. MMP7 and MMP16), direct induction of apoptosis (e.g. FASLG), and
lysogenic activity (e.g. LYG2, GZMK) were downregulated. The discrepancy between
apoptosis promotion and inhibition could be due to the alternative roles of apoptosis,
that is, death of heat stress injured cells vs. sloughing mammary epithelial cells during
involution. Genes related to immune function (e.g. FCAMR, GP2, CRTAC1) and
59
inflammation (e.g. ILR20B, KLK7) were upregulated at D7 in heat-stressed cows.
Immune signaling was upregulated to combat heat stress in an in vitro rat model, where
immune response activation occurred via extracellular secretions of heat-shock
proteins.192 Herein, the heat shock protein Family (Hsp40) Member C12 (DNAJC12)
was upregulated in the mammary gland of heat-stressed cows at D7. Similarly, previous
literature has reported overexpression of other heat-shock proteins in the mammary
gland of rat and bovine models to protect cells against hyperthermia.117,127,193,194
Conclusions
This is the first in vivo study to characterize the bovine mammary gland
transcriptome during the dry period and under environmental heat stress utilizing RNA-
Seq. The findings reveal genes, pathways, and upstream regulators involved in the
dynamic process of mammary gland involution and point towards key genes and
pathways impacted by dry period heat stress. This work serves as the basis for more
exhaustive research to investigate candidate genes and pathways to combat the
negative effects of heat stress and promote successful cell turnover and tissue
restoration with the goal of improving synthetic capacity for the subsequent lactation.

60
Table 2-1. Primer sequences for genes utilized for quantitative real-time PCR (qRT-PCR) validation of RNA-Seq results in bovine mammary tissue.
Gene Name and Symbol Accession Number
5’ >3’
Primer Sequence Source
α-lactalbumin (LALBA) BC102173.1 F AAAGACTTGAAGGGCTACGGA 195 R AGATGTTGCTTGAGTGAGGGTT
β-casein (CSN2) BC111172.1 F AGTGAGGAACAGCAGCAAACAG 195 R AGCAGAGGCAGAGGAAGGTG
casein-αS1 (CSN1S1) BC109618.1 F TACCTGTCTTGTGGCTGTTGC 195 R CCTTTTGAATGTGCTTCTGCTC
casein-αS2 (CSN1S2) BC114773.1 F GCCTGGACTACTTGTCTTCCTTTTA 195 R TCCTCTTCATTTGCGTTCCTTAC
solute carrier family 7 member 5 (SLC7A5)
BC126651 F GGGTGACGTAGCCAATCTGG 196 R ATCCCCCATAGGCAAAGAGG
matrix-remodeling-associated protein 5 (MXRA5)
XP_001254410.3 F CGCTGGGATCTCTCCACAT 173,174 R GAGCTCCAGCTTCGTCAGTC
lipopolysaccharide binding protein (LBP)
NM_001038674 F TGGAGGTGCACATATCAGGA 173,174 R CTTGCTCTCCAAGACCCTTC
lysyl oxidase like 4 (LOXL4)
NM_174384 F CCAGCTTCTGCCTAGAGGAC 173,174 R TAGGTATCCCAGCAGCCAAC
angiopoietin like 4 (ANGPTL4)
NM_001046043 F GAAGAGGCTGCCCAAGATG 173,174 R CCCTCTTCAAACAGCTCCTG
solute carrier family 7 member 8 (SLC7A8)
NM_001192889.2 F TCAAGGCTCCTTTGCCTATG 173,174 R CAAATGTGACCAGTGGGATG
ubiquitously expressed prefoldin-like chaperone (UXT)
XM_004022128.3 F TGTGGCCCTTGGATATGGTT 197 R GGTTGTCGCTGAGCTCTGTG
ribosomal protein S9 (RPS9)
NM_001101152 F GGAGACCCTTCGAGAAGTCC 172 R CTTTCTCATCCAGCGTCAGC

61
Table 2-2. Top KEGG pathways and MeSH terms along with their corresponding DEGs in bovine mammary tissue during transition between lactation to involution. KEGG pathways and MeSH terms with DEGs when contrasting D3 vs. D-3 (n=12, early involution vs. late lactation), relative to D3. D0 indicates dry-off (~46 d relative to expected calving). Cut-off criteria for DEG significance was FDR ≤ 5% and pathway/term significance was set at p ≤ 0.01 (Fisher’s exact test).
KEGG Pathway p-value Genes Upregulated at D3 Genes Upregulated at D-3
Adipocytokine signaling pathway
1.70E-6
NFKBIB, PTPN11, TNFRSF1A, ACSL5, IKBKB, SOCS3, CPT1C, F1MVS.1, CPT1B, AKT3, NFKB1, STAT3, CPT1A, TNFRSF1B
ACSL1, PRKAB1, CAMKK1, MAPK8, PPARA, ADIPOR2, SLC2A1, CAMKK2, PCK2, PPARGC1A, CD36, PRKAA2
Other glycan degradation 0.00024 FUCA2, HEXA, GBA, GLB1, HEXB, NEU3, FUCA1
MAN2C1, HEXDC
Pyruvate metabolism 0.00025 ACAT2, LDHA, ALDH3A2
DLD, HAGHL, ACYP2, MDH2, ALDH7A1, DLAT, PCK2, ACSS2, ACACA, MDH1, PC, PDHA1, HAGH, PDHB
Butanoate metabolism 0.0003 ACAT2
BDH1, AACS, ACADS, HMGCS1, L2HGDH, ECHS1, EHHAD, PDHA1, PDHB, OXCT1, ACSM5
Adherens junction 0.00032
PTPRF, RHOA, ACTG1, SRC, RAC1, ACTN4, EGFR, SMAD3, INSR, CTNNA1, NECTIN2, MAPK3, CTNNB1, NECTIN4, ACTN1, WASF2, SSX2IP, IGF1R, RAC3, ACTB
ACTN2, NLK, PTPRB, TCF7L2
Glycolysis/ Gluconeogenesis
0.00046 ENO3, LDHA, BPGM, HK1, ALDH3B1, GAPDH, PGM1, TPI1, ALDH3A2
PFKM, DLD, ALDH7A1, DLAT, PCK2, ALDOC, HK2, ACSS2, PDHA1, GALM, PDHB
Citrate cycle (TCA Cycle) 0.0006 IDH3A
ACO1, DLD, ACO2, DLST, SUCLA2, MDH2, DLAT, PCK2, MDH1, PC, PDHA1, IDH1, PDHB
Bacterial invasion of epithelial cells
0.0011
RHOG, ILK, GAB1, LOC531038, RHOA, ARPC3, CTTN, ACTG1, CBL, FN1, SRC, RAC1, ARPC2, CTNNA1, CTNNB1, WASF2, ACTB, DOCK1, ARPC5
CD2AP, PTK2, MAD2L2, CAV2
Aminoacyl-tRNA biosynthesis
0.0012 WARS2, TARSL2
IARS, DARS2, LARS, CARS, CARS2, FARSB, TARS, RARS2, YARS, MARS, GARS, NARS, AARS, FARSA, EARS2
Valine, leucine, and isoleucine degradation
0.0012 ACAT2, ALDH3A2
HIBADH, DLD, IVD, DBT, MCCC1, ACADS, BCAT2, ALDH7A1, HMGCS1, MUT, PCCB, BCKDHA, ECHS1, EHHAD, OXCT1

62
Table 2-2. Cont.
KEGG Pathway p-value Genes Upregulated at D3 Genes Upregulated at D-3
SNARE interactions in vesicular transport
0.0019 STX7, VAMP5, STX6
YKT6, BNIP1, BET1, STX16, VAMP2, GOSR1, SNAP23, SEC22B, STX3, VAMP1, STX10, SNAP29
Steroid biosynthesis 0.002 N/A
CYP51A1, MSMO1, DHCR24, SQLE, HSD17B7, NSDHL, DHCR7, LSS, SC5D
Glycosaminoglycan degradation
0.002 IDUA, HEXA, GLB1, SGSH, HEXB, GNS
NA, HPSE, HGSNAT
PPAR signaling pathway 0.0022 ILK, ANGPTL4, OLR1, ACSL5, CPT1C, CPT1B, SLC27A1, CPT1A
PPARG, SCP2, ACSL1, PPARA, Glycerol kinase, PCK2, LPL, FABP3, CD36, EHHAD, FABP4, Acyl-CoA desaturase
Galactose metabolism 0.0023 B4GALT2, HK1, GLB1, PGM1, GLA
UGP2, PFKM, LALBA, GANC, HK2, B4GALT1
Glyoxylate and dicarboxylate metabolism
0.0032 ACAT2 ACO1, ACO2, MDH2, PGP, MUT, PCCB, MDH1
Amino sugar and nucleotide sugar
metabolism 0.0054
GNPDA1, HK1, HEXA, UGDH, HEXB, PGM1, CYB5R1, RENBP
UGP2, GNE, PMM2, GNPNAT1, UXS1, UAP1, HK2, GFPT1, TSTA3
Lysosome 0.0055
GALC, AP4M1, DNASE2, IDUA, ABCB9, SORT1, LAMP1, ASAH1, CTSB, HEXA, GBA, GLB1, SGSH, HEXB, ARSA, CTSL2, AP4S1, GNS, M6PR, CLNP5, ATP6V0B, GLA, GM2A, SUMF1
CTNS, GGA2, AP4B1, ATP6V0A2, AP1M1, AP1S1, GGA3, GNPTAB, AP3M1, HGSNAT
Regulation of actin cytoskeleton
0.0061
MSN, RHOA, PFN1, ARPC3, TMSB4, ACTG1, PDGFRA, FN1, ITGB6, RAC1, EZR, ARPC2, LIMK2, PFN2, ACTN4, MYL9, EGFR, PDGFA, MYLK, MYLK2, CFL2, MYL12A, MAPK3, CYFIP1, ARHGEF6, ITGB4, ACTN1, WASF2, ITGA2, NCKAP1L, ITGAV, CFL1, RAC3, ACTB, DOCK1, TMSB4Y, ARPC5
PIKFYVE, PIP4K2B, CYFIP2, PTK2, ACTN2, PIP5K1B, FGF12, GNA12, MAP2K2, SSH3
Focal adhesion 0.0078
ILK, PARVA, LAMC2, THBS1, RHOA, COMP, ACTG1, PDGFRA, PARVG, FN1, SRC ITGB6, RAC1, ACTN4, MYL9, EGFR, CAPN2, PDGFA, MYLK, MYLK2, MYL12A, MAPK3, CTNNB1, AKT3, ZYX, ITGB4, ACTN1, THBS2, ITGA2, BCL2, VASP, ITGAV, IGF1R, RAC3, TLN1, ACTB, DOCK1
KDR, TLN2, NA, MAPK8, PTEN, PTK2, ACTN2, VEGFC, FLT1, CAV2

63
Table 2-2. Cont.
KEGG Pathway p-value Genes Upregulated at D3 Genes Upregulated at D-3
Terpenoid backbone biosynthesis
0.009 ACAT2 FDPS, IDI1, MVK, HMGCR, HMGCS1, MVD
Peroxisome 0.0095 SOD, ACSL5, HSD17B4, GSTK1, ACOT8
PEX16, SCP2, ACSL1, MVK, SLC25A17, PECR, PEX26, XDH, ABCD4, ECH1, PAOX, SOD1, PEX11G, EHHAD, IDH1, ABCD1, NUDT19, PEX1, NUDT12
Phagosome 0.01
THBS1, DYNC12, TUBB2B, OLR1, COMP, ACTG1, NCF4, C1R, RAC1, LAMP1, RAB7B, DYNC1H1, CTSL2, STX7, M6PR, THBS2, ATP6V0B, ITGA2, ITGAV, CYBB, ACTB, TUBB2A
NOS1, PIKFYVE, ATP6V0A2, COLEC12, SEC22B, MPO, ATP6V1G2, DYNC1L1, CD36, TUBB1, FCGR2B, TUBA3E, TFRC, FCGR2A, LOC100295712, RAB5A
Starch and sucrose metabolism
0.012 PYGB, HK1, UGDH, PGM1, ENPP1, GYS1
UGP2, UXS1, GANC, HK2
N-Glycan biosynthesis 0.015 MGAT4B, B4GALT2, MGAT5
ALG14, RPN1, ALG3, STTA3, ALG11, ALG5, B4GALT1, GANAB, DOLPP1, MAN2A2, DAD1, ALG10
Osteoclast differentiation 0.105
CSF1, TNFRSF1A, STAT2, IL1R1, IRF9, NFKB2, FOSL1, MAP3K14, NCF4, IKBKB, SOCS3, RAC1, JUNB, IFNGR1, IFNAR2, SQSTM1, MAPK3, AKT3, BTK, CYBB, NFKB1, SPI1, IFNAR1, FOSL2, RELB
PPARG, JAK1, MAPK8, MAPK12, FCGR2B, TRAF6, FCGR2A
Vasopressin-regulated water reabsorption
0.018 DYNC12, DCTN1, DCTN2, PRKX, DYNC1H1
DCTN6, VAMP2, ADCY6, CREB3L1, AQP3, DYNC1L1, CREB3L2, DYNLL2, RAB5A
Fructose and mannose metabolism
0.018 PFKFB3, HK1, TPI1
PFKM, PMM2, PFKFB2, PFKFB4, KHK, ALDOC, HK2, MTMR2, TSTA3
Glycine, serine and threonine metabolism
0.02 N/A CBS, DLD, GAMT, GCAT, ALDH7A1, CHDH, PSPH, PSAT1, CTH, AOC2, PHGDH
Propanoate metabolism 0.02 ACAT2, LDHA, ALDH3A2 SUCLA2, ALDH7A1, ACSS2, MUT, PCCB, ACACA, ECHS1, EHHAD
Sphingolipid metabolism 0.023 PLPP2, GALC, SPHK1, SGPL1, ASAH1, GBA, GLB1, ARSA, ACER3, GLA, NEU3
SPTLC3
Valine, leucine and isoleucine biosynthesis
0.024 N/A IARS, LARS, BCAT2, PDHA1, PDHB
Pentose and glucuronate interconversions
0.024 UGDH, ALDH3A2 UGP2, DCXR, XYLB, RP3E

64
Table 2-2. Cont.
KEGG Pathway p-value Genes Upregulated at D3 Genes Upregulated at D-3
Leukocyte transendothelial migration
0.026
CLDN15, PTPN11, MSN, RHOA, PTK2B, ACTG1, NCF4, RAC1, ICAM1, EZR, RASSF5, ACTN4, MYL9, GNAI3, CTNNA1, MYL12A, CTNNB1, F11R, ACTN1, VASP, CYBB, ACTB, CLDN4
CXCL12, RAPGEF3, PTK2, ACTN2, MAPK12
Protein export 0.03 SEC11A, OXA1L IMMP1L, SPCS1, SRP19, SRP54, SRP9, SEC62
Alanine, aspartate and glutamate metabolism
0.031 GLUD1, GLUL GPT2, ASNS, GPT, PPAT, ADSSL1, GFPT1, CAD, ASS1
RNA degradation 0.034 ENO3, PATL1, PABPC1L, PABPC4, PABPC1
TOB1, CNOT9, C1D, EXOSC9, DHX36, LSM4, MPHOSPH6, HSPA9, HSPD1, LSM8, CNOT3, EXOSC5, CNOT7, BTG3, ZCCHC7
Ribosome biogenesis in eukaryotes
0.035 EIF6, UTP14A, POP7
NOL6, RPP40, POP5, NOP58, NHP2, PWP2, LSG1, MPHOSPH10, RIOK2, IMP3, BMS1, DKC1, GTPBP4, NMD3, RPP25L, RRP7A, NOB1, TAF9
Glycosphingolipid biosynthesis – ganglio series
0.037 HEXA, GLB1, HEXB ST3GAL1, ST6GALNAC5, SLC33A
Fatty acid degradation 0.038 ACAT2, ACSL5, CPT1C, CPT1B, CPT1A, ALDH3A2
ACSL1, ACADS, ALDH7A1, ECI1, ECHS1, EHHAD
Synthesis and degradation of ketone bodies
0.039 ACAT2 BDH1, HMGCS1, OXCT1
p53 signaling pathway 0.046 SESN2, CASP9, STEAP3, SFN, FAS, BAX, SERPINE1, PERP, RFWD2
GADD45G, ATM, CCNE2, PTEN, MDM2, BID, PIDD1, CYCS, CD82
Glycerophospholipid metabolism
0.04 PLPP2, PISD, PTDSS1, CHKB, PCYT1B, MBOAT1
CRLS1, PCYT2, CHPT1, AGPAT1, GPAT4, ETNK1, GPD1L, APT2, GPAM, PLA2G3, PLA2G12A, GPD1, PEMT, GPAT3
Retinol metabolism 0.047 N/A RDH11, CYP2B6, CYP3A5, ALDH1A1, LRAT, RETSAT, LOC540707

65
Table 2-2. Cont.
MeSH Term p-value Genes Upregulated at D3 Genes Upregulated at D-3
Milk Proteins 1.50E-6
CLDN15, TAGLN2, HBP1, IGFBP2, ACSL5, SLC38A7, GNPDA1, PON2, C1R, ANXA2, PPP2R3C, CNN1, TMX1, ACOT9, HSPB1, SNX6, GNAI3, THOC5, CLIC1, SPNS1, FMOD, TBCB, DSTN, SQSTM1, ANXA1, MYL12A, CTNNB1, RALY, CSNK1G1, OSER1, CTSL2, EMP3, M6PR, NFE2L2, CD151, TPI1, PPP2R1A, ITGAV, ORMDL2, CFL1, JAML, RNF41, RSU1, OSMR, PGM5, DUSP11, PFN1, CLU, SOD, SQRDL, MYL9, UTP14A
PYCR1, TMEM39A, TOB1, LZTFL1, RBM47, NARFL, CSN2, TINF2, MFGE8, ECHDC1, CDCA7L, SQLE, SNAP23, PLIN2, LALBA, EIF2S2, SPRTN, RSRC2, SLC25A17, NHP2, STT3A, TPD52, ERLIN1, FKBP4, RFTN2, CSN1S1, SREBF1, ALDH1A1, TMEM97, AQP3, TMEM171, GID4, MDH2, STAT5A, ALDH7A1, FAN1, DDX1, EMC2, STAT5B, UAP1, TALDO1, OCIAD1, ABT1, FASTK, HSPA9, OGN, ELF5, XDH, LPO, PAH, LPL, ALDOC, PAEP, LRWD1, CTH, BSG, FABP3, PPARGC1A, MMACHC, POR, KITLG, ABCG2, ECHS1, VPS72, DAD1, RNASE4, AUP1, C6orf62, PARK7, ARHGEF16, MAT2A, SET, P2RY14, FOLR1, PDHB, C25H16orf59, AOC2, ALG10, RBM4, C8orf4, FABP4, MLX, CSN1S2, APT2, HSPA8, DNAJA1, BS1A1, FOLR3, ANG, ACAD, LOC785756, ANG2
Pepsin A 1.60E-5 COMP, TIMP1, TIMP2, CTSB CSN2, CSN1S1, CSN1S2, ACYP2, PAEP, SOD1, HBB, H4, TROPT
Fatty acids 7.10E-5 CAST, SOCS3, CPT1B, CYB561
AGPAT1, NDUFAB1, SREBF1, PPARA, PTEN, NFYA, MSTN, LDLR, LPL, PAEP, FASN, FABP3, PC, FABP4, ACACA, SOD1, ACAD
Actins 3.00E-5
ILK, MYO1C, MKL1, SYNJ1, ACTR3, RHOA, ARPC3, ACTG1, TAGLN, SRC, RAC1, ANXA2, ACTR2, MYH9, PFN2, CD44, HSPB1, MYLK, S100A10, MAP4, MYL12A, CTNNB1, HSPB6, ARRB1, CFL1, ACTB, TPM1, ARPC5, CCDC53, PFN1, ARPC2, ACTA2
DCTN6, PTEN, CLIC5, UACA, PRKG1, MYO10, PDCL, CAV2, NA, ANG, TROPT

66
Table 2-2. Cont.
MeSH Term p-value Genes Upregulated at D3 Genes Upregulated at D-3
Microfilament Proteins 0.00018
MFAP5, FBN1, SYNJ1, ACTR3, CAPZB, ARPC3, CAPG, TAGLN, SRC, ACTR2, PFN2, CD44, LTBP1, LTBP2, ACTB, DNAJC6, CCDC53, PFN1, GAPDH
FBN3, HPSE, CLIC5, UACA, PRKG1, MYO10, PDHB
Adenosine Diphosphate 0.00018 ACTR3, RHOA, GLUD1, ACTR2, ACTB, TPM1, GAPDH, ARPC2
PTEN, CAMKK2, SLC25A4, ATP5B, MYO10, HSPA8
Trypsin 0.00041
CRYAB, RHOA, TIMP1, IDH3A, GLUD1, ANXA2, SERPINF1, TIMP2, CTSB, AGER, UGDH, LGALS1, AK3, F5, M6PR, CYB561, CNP, PFN1, GAPDH, HNRNPA1, CLU, MT2A
UQCRB, PFKFB2, CSN2, MFGE8, LALBA, ACO2, CSN1S1, RNASEH2A, SPADH1, PDE1A, CYC1, MRPS23, LPO, LPL, ATP5B, PAEP, MMACHC, PEBP1, PRKG1, COX6B1, HBB, NME2, ANG, TROPT, CSN1S2, ACYP2, CYCS, H4
Phosphatidyl-inositol 3-Kinases
0.00084
THBS1, GAB1, RHOA, OLR1, TIMP1, FN1, SRC, RAC1, EZR, EGFR, INSR, SERPINE1, MAPK3, ITGA2, BCL2, ITGAV, IGF1R
KDR, GRK2, MAPK8, CAMKK2, ANGPT2, PTGS2, FLT1, PPARGC1A, UPK1A, NA, SCDCT1,
Oxidants 0.001 ANXA2, TIMP2, CTSB, MAPK3
PPARG, PTK2, XDH, SOD1
Neoplasm Proteins 0.0014 MFAP5, FBN1, TIMP2, AHNAK, TBCB, SOD
TPD52, PRDX3, PTGS2, PAEP, FABP3, ATF4, ABCG2, NR3C1, FABP4, SPAM1, ABCB1, HSPA8, H4, ANG
Cytoskeletal Proteins 0.0018
ILK, KIF3B, ACTR3, TIMP1, ARPC3, EHD1, ACTR2, EZR, S100A10, DSC3, CTNNB1, NFE2L2, MICALL1, DSC2, ARPC5, NA, ARPC2
NA, DMD, CLIC5, FRZB, RAPGEF2, MYOC
Fatty Acids, Monounsaturate
0.0019 N/A SREBF1, MSTN, PAEP, LRAT, FABP4, ACAD
Peroxynitrous Acid 0.002 PFN1, SRC, TIMP2, BCL2, STAT3
NA, NDUFA6, NDUFS8, XDH, SLC8A1, NDUFA1, SOD1
Carrier Proteins 0.0028
RBP4, GLTP, ACTR3, TNFRSF1A, DCTN1, TIMP1, IGFBP2, IGFBP5, RTN2, IGFBP4, RAC1, ACTR2, DCTN2, MAP1LC3B, GABARAPL1, AGER, ISG15, VCAN, FMOD, LGALS1, CTNNB1, LBP, CYFIP1, TSPO, M6PR, SLC6A15, SLC1A1, LTBP2, IGFALS, RAET1G, DPDS4
UQCRB, SLC34A2, CNGA1, GGA2, CSN2, MFGE8, SCP2, VAMP2, SLC18A2, PLIN2, SLC7A5, BCL2L2-PABPN1, CUL2, FKBP4, AZIN1, AAK1, SND1, MYBPC1, OMD, RAPGEF2, NAPA, SLC8A1, PAEP, ATG4B, GGA3, CLINT1, FABP3, MMACHC, USO1, LRAT, PEBP1, PRKG1, PIBF1, APLN, MYO10, FOLR1, TGFBR3, PDCL, FABP4, TUBG1, BDA20, FOLR3, SCGB1D

67
Table 2-2. Cont.
MeSH Term p-value Genes Upregulated at D3 Genes Upregulated at D-3
Fas Ligand Protein 0.0021 CASP9, LAMP1, FAS, BAX, CYBB, GAPDH
VAMP2, DYSF
Clusterin 0.0022 CLU CSN1S2, LALBA, CSN1S1
Myxovirus Resistance Proteins
0.0022 MX2, ISG15, Mx1, OAS1X NA
Carbon 0.0023 FN1 SREBF1, PAEP, SOD1, ACAD
Growth Inhibitors 0.0023 LIF, EGFR ARG2, AMH, FABP3
Fatty Acids, Unsaturated 0.0029 MAPK3 PPARG, PPARA, PTGS2, FASN, FABP3, PPARGC1A, FABP4, SOD1, ACAD
Glucose-phosphate Dehydrogenase
0.0032 GLA CD36
Lactalbumin 0.0032 CRYAB, CLU CSN2, LALBA, CSN1S1, B4GALT1, CSN1S2
Arginine 0.0033 CHRNA3, ICAM1, DDAH2, CPT1B
RUSC1, BCL2L2-PABPN1, MSTN, B4GALT1, SLC7A1, MYOC, ASS1, NCAPG, HSPA8, SOD1, HIST1H2AC, H4, ACAD
NADPH Oxidase 0.0042 PTK2B, SRC, NOX5, RAC1, LAMP1, NOX4, CYBB, STAT3
NOS1, VAMP2, DYSF, PRKG1, NR3C2, SOD1
Sulfhydryl Reagents 0.0047 F5, CYB561 CNGA1, ACO2, SLC16A1, PRKG1
Oleic Acid 0.0047 N/A PPARG, LALBA, PAEP, FASN, SOD1, ACAD
Thrombospondins 0.0047 THBS1, RHOA, COMP, FN1, THBS2
NA
Antioxidants 0.0058 OLR1, ICAM1, TIMP2, NOX4, BCL2, NFKB1, SOD
KDR, PRDX3, SLC8A1, FLT1, NA, GSTM1, SOD1
Blood Proteins 0.0063 CLU, FN1, FMOD, F5, FBD, DEFB5, NA
OMD, BSG, POR, MYO10, ANG2, LOC540707
Caseins 0.0065 CRYAB, TUBB2B, IGFBP2, SOCS3, SERPINE1, FMOD, BCL2
CSN2, LALBA, LARS, LMAN1, CSN1S1, STAT5A, PTEN, PAEP, CSN1S2
Membrane Glycoproteins 0.0064
THBS1, KCNMB1, NOX5, RAC1, LAMP1, FAS, CD44, CD9, LBP, MOG, THBS2, ITGAV, CYBB, UPK3B, STAT3, ADGRE5, ENPP1, SELPLG, CLU, GAPDH, DEFB5, LOC100298356
ROM1, MFGE8, SLC18A2, PLIN2, SLC2A8, ANGPT2, LPL, B4GALT1, BSG, USO1, UPK1A, DMD, CD36, SOD1, BS1A1
Acetylgluco-aminidase 0.0067 GNG5, FMOD HSPA8, HIST1H2AC, H4
Ascorbic Acid 0.0067 OLR1, CYB561 HAPLN1, PTGS2, SOD1
Lactoglobulins 0.0067 RBP4 CSN2, CSN1S1, PAEP, NA
Epoprostenol 0.0067 N/A KDR, RAPGEF3, FLT1, NA, ANG
Thymosin 0.0067 ILK, TMSB10, ACTG1, TMSB4, TMSB4X
N/A

68
Table 2-2. Cont.
MeSH Term p-value Genes Upregulated at D3 Genes Upregulated at D-3
Glycosylation End Products, Advanced
0.0067 OLR1, AGER, NFE2L2 NA, HBB
Actin-Related Protein 2-3 Complex
0.0067 ACTR3, ARPC3, ACTR2, ARPC5, ARPC2
N/A
Tryptophan 0.0067 GLTP, ACTR3, GLUD1, ACTR2
LALBA, SLC7A5, PAEP, B4GALT1, YARS, PRKG1, HBB, SOD1
NAD 0.0073 IDH3A, GLUD1, GAPDH BDH1, NQO2, DLD, XDH, IDH1, NDUFV1, NDUFS1
Alanine 0.0073 OLR1, CYB561 SLC34A2, CSN2, ATP5B, SLC1A5, FLT1, PRKAA2, FOLR1
Proteoglycans 0.0088
RHOA, OLR1, COMP, FN1, ANXA2, SERPINF1, PRG4, VCAN, FMOD, CTNNB1, IL6R, STAT3
JAK1, ANGPT2, MSTN, OMD, HAPLN1, FLT1, TGFBR3, NA
Papain 0.009 CTSB CSN2, CSN1S1, FABP3
Profilins 0.009 SYNJ1, PFN2, ACTB, PFN1 N/A
Retinol-Binding Proteins 0.0095 RBP4 OAT, KLF15, ADRA2B, PAEP, BDA20
Wiskott-Aldrich Syndrome Protein Family
0.0095 CCDC53, ACTR3, ARPC3, ACTR2, ARPC5, ARPC2
N/A

69
Table 2-3. Top KEGG pathways and MeSH terms along with their corresponding DEGs in bovine mammary tissue during early involution. KEGG pathways and MeSH terms with DEGs when contrasting D7 vs. D3 (n=12, first week of involution), relative to D7. D0 indicates dry-off (~46 d relative to expected calving). Cut-off criteria for DEG significance was FDR ≤ 5% and pathway/term significance was set at p ≤ 0.01 (Fisher’s exact test).
KEGG Pathway p-value Genes Upregulated at D7 Genes Upregulated at D3
Tight junction 0.00018 MYH7
CLDN15, MYH14, RHOA, ACTG1, MYH2, YBX3, ACTN4, MYL9, RRAS2, CTNNA1, MYL12A, VAPA, F11R, CLDN3 HRAS
Regulation of actin cytoskeleton
0.00057 PIK3R2, IQGAP3
RHOA, TMSB4, ACTG1, RAC1, EZR, ACTN4, MYL9, RRAS2, PPP1CB, PDGFA, MYLK, MYLK2, MYL12A, MAPK3, RAC3, TMSB4Y, GNA13, HRAS
Focal adhesion 0.00067 PIK3R2, LAMB1
ILK, LAMC2, THBS1, RHOA, ACTG1, RAC1, ACTN4, MYL9, PPP1CB, CAPN2, PDGFA, MYLK, MYLK2, MYL12A, MAPK3, ZYX, RAC3, HRAS
Leukocyte transendothelial migration
0.00071 PIK3R2, CXCL12
CLDN15, CTNND1, RHOA, ACTG1, RAC1, EZR, ACTN4, MYL9, CTNNA1, MYL12A, F11R, CLDN3
Adherens junction 0.0013 N/A
CTNND1, RHOA, ACTG1, RAC1, ACTN4, INSR, CTNNA1, MAPK3, SSX2IP, RAC3
Vascular smooth muscle contraction
0.0024 PLA2G3, MYL6B
ITPR2, KCNMB1, RHOA, MYL9, PPP1CB, KCNMA1, MYLK, ACTA2, MYLK2, MAPK3, GNA13
Bacterial invasion of epithelial cells
0.0052 PIK3R2 ILK, ARHGAP10, GAB1, RHOA, ACTG1, RAC1, CLTB, CTNNA1
Axon guidance 0.0072 UNC5C, EPHB3, ROBO1, EPHA4
RHOA, RAC1, PLXNB2, MAPK3, PPP3CC, EFNA1, SEMA6A, RAC3, HRAS
VEGF signaling pathway 0.016 PIK3R2, PLA2G3 RAC1, HSPB1, MAPK3, PPP3CC, RAC3, HRAS
p53 signaling pathway 0.042 CCNE1, GTSE1, CCNB1, PIDD1
STEAP3, FAS, RFWD2
Type II diabetes mellitus 0.044 PIK3R2, SOCS1, ADIPOQ INSR, MAPK3
Cell cycle 0.046 CDC45, CCNE1, CCNA2, BUB1B, ESPL1, CDC20, CDKN2C, CCNB1, BUB1
CDC26, CDKN1B
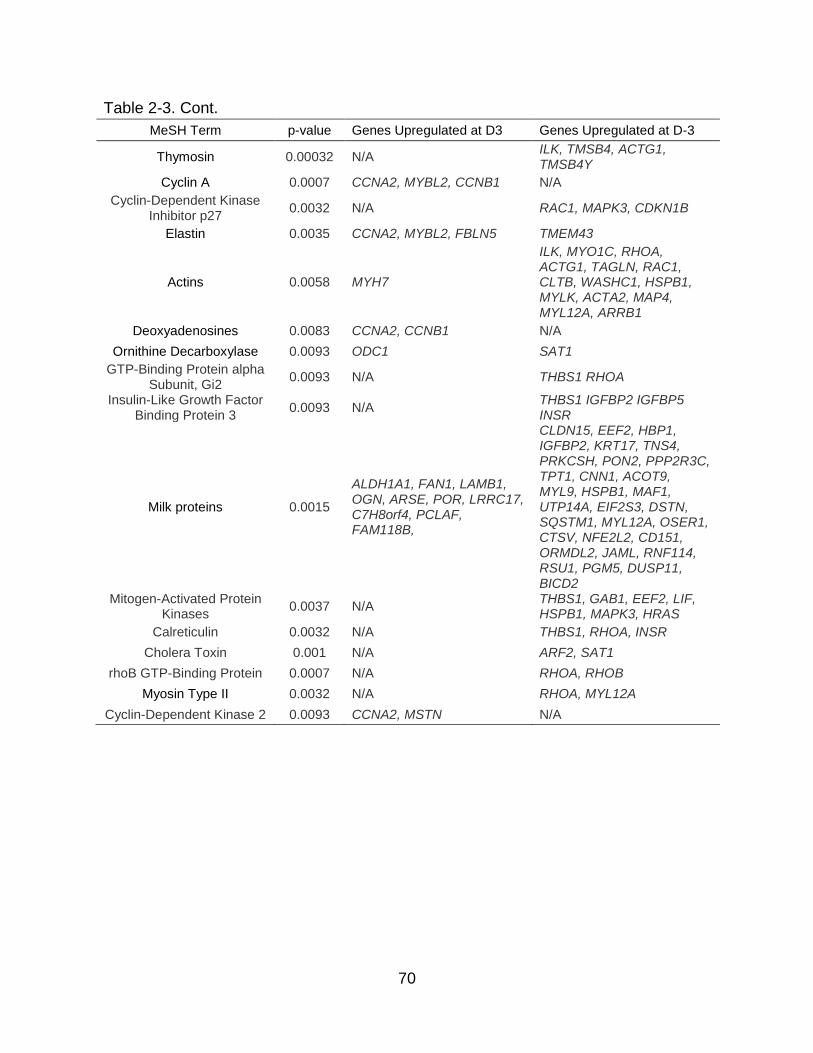
70
Table 2-3. Cont.
MeSH Term p-value Genes Upregulated at D3 Genes Upregulated at D-3
Thymosin 0.00032 N/A ILK, TMSB4, ACTG1, TMSB4Y
Cyclin A 0.0007 CCNA2, MYBL2, CCNB1 N/A
Cyclin-Dependent Kinase Inhibitor p27
0.0032 N/A RAC1, MAPK3, CDKN1B
Elastin 0.0035 CCNA2, MYBL2, FBLN5 TMEM43
Actins 0.0058 MYH7
ILK, MYO1C, RHOA, ACTG1, TAGLN, RAC1, CLTB, WASHC1, HSPB1, MYLK, ACTA2, MAP4, MYL12A, ARRB1
Deoxyadenosines 0.0083 CCNA2, CCNB1 N/A
Ornithine Decarboxylase 0.0093 ODC1 SAT1
GTP-Binding Protein alpha Subunit, Gi2
0.0093 N/A THBS1 RHOA
Insulin-Like Growth Factor Binding Protein 3
0.0093 N/A THBS1 IGFBP2 IGFBP5 INSR
Milk proteins 0.0015
ALDH1A1, FAN1, LAMB1, OGN, ARSE, POR, LRRC17, C7H8orf4, PCLAF, FAM118B,
CLDN15, EEF2, HBP1, IGFBP2, KRT17, TNS4, PRKCSH, PON2, PPP2R3C, TPT1, CNN1, ACOT9, MYL9, HSPB1, MAF1, UTP14A, EIF2S3, DSTN, SQSTM1, MYL12A, OSER1, CTSV, NFE2L2, CD151, ORMDL2, JAML, RNF114, RSU1, PGM5, DUSP11, BICD2
Mitogen-Activated Protein Kinases
0.0037 N/A THBS1, GAB1, EEF2, LIF, HSPB1, MAPK3, HRAS
Calreticulin 0.0032 N/A THBS1, RHOA, INSR
Cholera Toxin 0.001 N/A ARF2, SAT1
rhoB GTP-Binding Protein 0.0007 N/A RHOA, RHOB
Myosin Type II 0.0032 N/A RHOA, MYL12A
Cyclin-Dependent Kinase 2 0.0093 CCNA2, MSTN N/A

71
Table 2-4. Differentially expressed genes (DEGs) in bovine mammary tissue during steady-state involution and redevelopment. All DEGs between D14 vs. D7 (n=12, steady-state involution vs. active involution), relative to D14, and DEGs between D25 vs. D14 (n=12, redevelopment vs. steady-state), relative to D25. D0 indicates dry-off (~46 d to expected calving). Cut-off criteria for DEG significance was nominal p ≤ 0.005 and log2 fold change (FC) ≥ |0.5|.
D14 vs. 7
ENSEMBL Gene ID Gene Name Symbol Log2 FC -Log10 p-value
ENSBTAG00000038748 hemoglobin subunit beta LOC100850059 2.61 2.74
ENSBTAG00000000169
ankyrin repeat, SAM and basic leucine zipper domain
containing 1 ASZ1 1.84 2.47
ENSBTAG00000015582 heme oxygenase 1 HMOX1 1.31 2.31
ENSBTAG00000047449 antimicrobial peptide NK-lysin-
like LOC104968634 1.29 2.89
ENSBTAG00000031828 uncharacterized LOC616323 LOC616323 1.29 2.89
ENSBTAG00000047816 Uncharacterized protein NA 1.29 2.89
XLOC_017734 NA NA 0.95 2.48
ENSBTAG00000000812 CD300a molecule CD300A 0.5 2.42
XLOC_019509 NA NA 0.5 2.38
ENSBTAG00000047944 GATA binding protein 5 GATA5 -1.26 3.23
D25 vs. D14
XLOC_008198 NA NA 1.47 2.72
XLOC_020169 NA NA 0.97 2.35
ENSBTAG00000025448 IZUMO family member 4 IZUMO4 0.93 2.89
ENSBTAG00000029982 microRNA 142 MIR142 0.72 2.33
ENSBTAG00000019929 integrin subunit alpha V ITGAV -0.5 2.40
ENSBTAG00000021483 olfactomedin like 1 OLFML1 -0.51 2.29
ENSBTAG00000002585
solute carrier family 16, member 2 (thyroid hormone
transporter) SLC16A2 -0.57 2.66
ENSBTAG00000017763 nuclear factor, interleukin 3
regulated NFIL3 -0.59 2.36
ENSBTAG00000019788 TEA domain family member 4 TEAD4 -0.67 2.41
ENSBTAG00000001961 microtubule associated protein
1B MAP1B -0.69 2.48
ENSBTAG00000011115 cholesterol 25-hydroxylase CH25H -0.69 2.29
ENSBTAG00000023929 FOS like antigen 2 FOSL2 -0.71 2.80
ENSBTAG00000007101 tissue factor LOC101909187 -0.72 2.31
ENSBTAG00000046328 Xg blood group XG -0.72 2.31
ENSBTAG00000000442 retinol binding protein 4 RBP4 -0.93 2.33
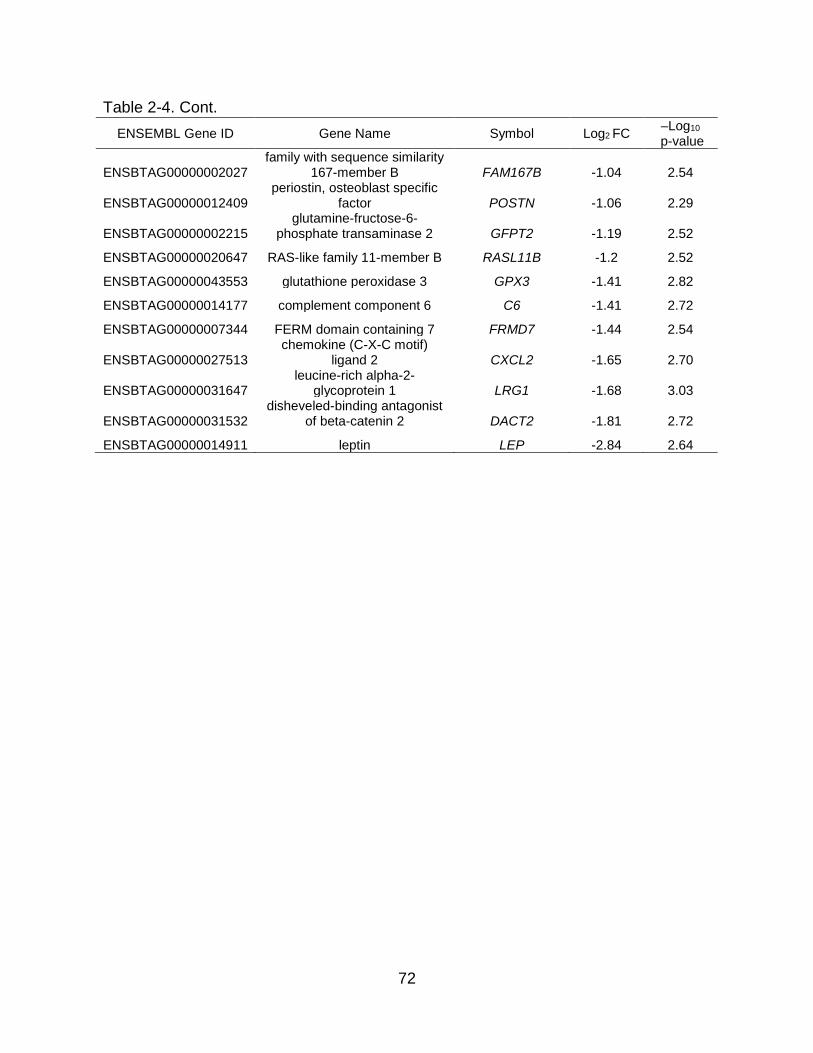
72
Table 2-4. Cont.
ENSEMBL Gene ID Gene Name Symbol Log2 FC –Log10
p-value
ENSBTAG00000002027 family with sequence similarity
167-member B FAM167B -1.04 2.54
ENSBTAG00000012409 periostin, osteoblast specific
factor POSTN -1.06 2.29
ENSBTAG00000002215 glutamine-fructose-6-
phosphate transaminase 2 GFPT2 -1.19 2.52
ENSBTAG00000020647 RAS-like family 11-member B RASL11B -1.2 2.52
ENSBTAG00000043553 glutathione peroxidase 3 GPX3 -1.41 2.82
ENSBTAG00000014177 complement component 6 C6 -1.41 2.72
ENSBTAG00000007344 FERM domain containing 7 FRMD7 -1.44 2.54
ENSBTAG00000027513 chemokine (C-X-C motif)
ligand 2 CXCL2 -1.65 2.70
ENSBTAG00000031647 leucine-rich alpha-2-
glycoprotein 1 LRG1 -1.68 3.03
ENSBTAG00000031532 disheveled-binding antagonist
of beta-catenin 2 DACT2 -1.81 2.72
ENSBTAG00000014911 leptin LEP -2.84 2.64
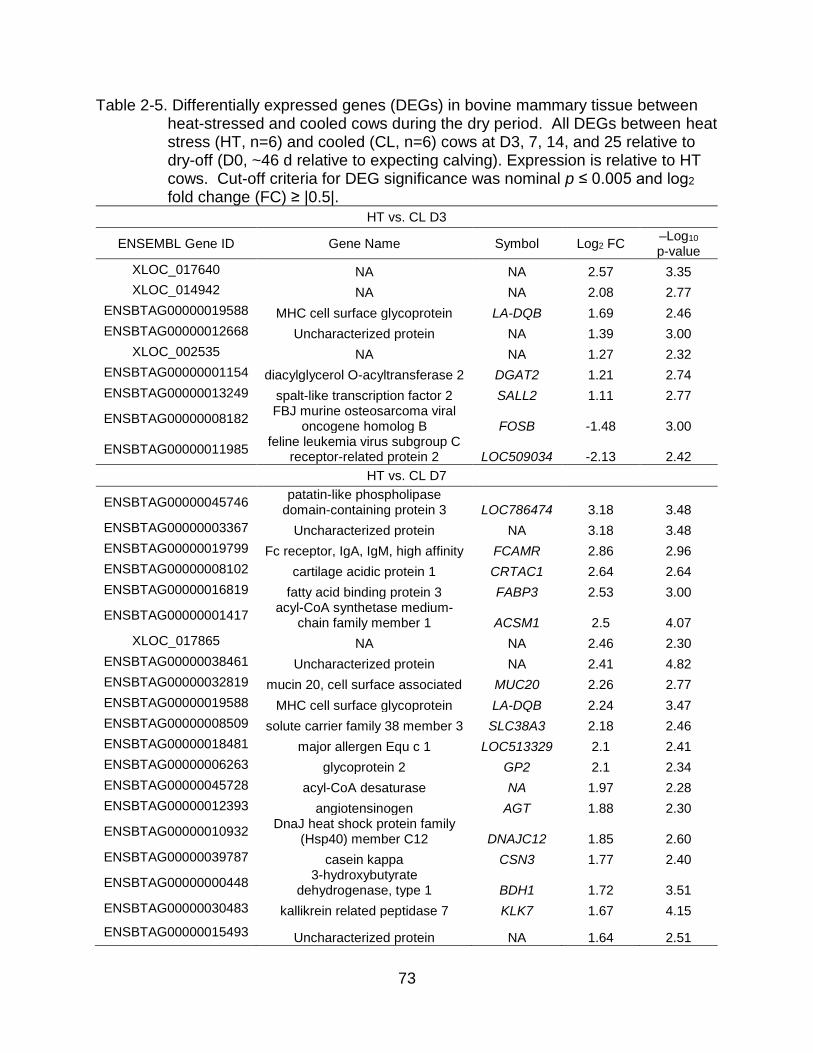
73
Table 2-5. Differentially expressed genes (DEGs) in bovine mammary tissue between heat-stressed and cooled cows during the dry period. All DEGs between heat stress (HT, n=6) and cooled (CL, n=6) cows at D3, 7, 14, and 25 relative to dry-off (D0, ~46 d relative to expecting calving). Expression is relative to HT cows. Cut-off criteria for DEG significance was nominal p ≤ 0.005 and log2 fold change (FC) ≥ |0.5|.
HT vs. CL D3
ENSEMBL Gene ID Gene Name Symbol Log2 FC –Log10 p-value
XLOC_017640 NA NA 2.57 3.35
XLOC_014942 NA NA 2.08 2.77
ENSBTAG00000019588 MHC cell surface glycoprotein LA-DQB 1.69 2.46
ENSBTAG00000012668 Uncharacterized protein NA 1.39 3.00
XLOC_002535 NA NA 1.27 2.32
ENSBTAG00000001154 diacylglycerol O-acyltransferase 2 DGAT2 1.21 2.74
ENSBTAG00000013249 spalt-like transcription factor 2 SALL2 1.11 2.77
ENSBTAG00000008182 FBJ murine osteosarcoma viral
oncogene homolog B FOSB -1.48 3.00
ENSBTAG00000011985 feline leukemia virus subgroup C
receptor-related protein 2 LOC509034 -2.13 2.42
HT vs. CL D7
ENSBTAG00000045746 patatin-like phospholipase
domain-containing protein 3 LOC786474 3.18 3.48
ENSBTAG00000003367 Uncharacterized protein NA 3.18 3.48
ENSBTAG00000019799 Fc receptor, IgA, IgM, high affinity FCAMR 2.86 2.96
ENSBTAG00000008102 cartilage acidic protein 1 CRTAC1 2.64 2.64
ENSBTAG00000016819 fatty acid binding protein 3 FABP3 2.53 3.00
ENSBTAG00000001417 acyl-CoA synthetase medium-
chain family member 1 ACSM1 2.5 4.07
XLOC_017865 NA NA 2.46 2.30
ENSBTAG00000038461 Uncharacterized protein NA 2.41 4.82
ENSBTAG00000032819 mucin 20, cell surface associated MUC20 2.26 2.77
ENSBTAG00000019588 MHC cell surface glycoprotein LA-DQB 2.24 3.47
ENSBTAG00000008509 solute carrier family 38 member 3 SLC38A3 2.18 2.46
ENSBTAG00000018481 major allergen Equ c 1 LOC513329 2.1 2.41
ENSBTAG00000006263 glycoprotein 2 GP2 2.1 2.34
ENSBTAG00000045728 acyl-CoA desaturase NA 1.97 2.28
ENSBTAG00000012393 angiotensinogen AGT 1.88 2.30
ENSBTAG00000010932 DnaJ heat shock protein family
(Hsp40) member C12 DNAJC12 1.85 2.60
ENSBTAG00000039787 casein kappa CSN3 1.77 2.40
ENSBTAG00000000448 3-hydroxybutyrate
dehydrogenase, type 1 BDH1 1.72 3.51
ENSBTAG00000030483 kallikrein related peptidase 7 KLK7 1.67 4.15
ENSBTAG00000015493 Uncharacterized protein NA 1.64 2.51

74
Table 2-5. Cont.
ENSEMBL Gene ID Gene Name Symbol Log2 FC –Log10 p-value
ENSBTAG00000004860 solute carrier family 27 (fatty acid
transporter), member 6 SLC27A6 1.64 2.28
ENSBTAG00000046391 GRAM domain containing 2 GRAMD2 1.62 2.36
ENSBTAG00000005668 solute carrier family 39 (zinc
transporter), member 8 SLC39A8 1.52 2.40
ENSBTAG00000007553 potassium channel, voltage gated
shaker related subfamily A, member 5 KCNA5 1.43 2.96
ENSBTAG00000007694 kinesin family member 25 KIF25 1.42 4.57
ENSBTAG00000008493 aquaporin 3 (Gill blood group) AQP3 1.42 2.34
ENSBTAG00000005115 solute carrier family 31 (copper
transporter), member 2 SLC31A2 1.4 3.19
XLOC_012445 NA NA 1.29 2.36
ENSBTAG00000033886 intestine-specific transcript 1
protein CIST1 1.26 3.32
ENSBTAG00000008434 glycine C-acetyltransferase GCAT 1.26 3.19
ENSBTAG00000020665 GDNF family receptor alpha 2 GFRA2 1.2 2.66
ENSBTAG00000012742 solute carrier family 22 member
18 SLC22A18 1.15 2.42
ENSBTAG00000011034 angiopoietin 2 ANGPT2 1.1 5.17
XLOC_024514 NA NA 1.09 2.34
ENSBTAG00000048017 proline rich 16 PRR16 1.05 2.59
XLOC_004900 NA NA 1.04 2.49
ENSBTAG00000006738 G protein-coupled receptor 68 GPR68 1.03 3.00
ENSBTAG00000034848 F2R like trypsin receptor 1 F2RL1 1.01 2.35
ENSBTAG00000010361 delta-like 4 (Drosophila) DLL4 0.97 3.00
ENSBTAG00000021082 transmembrane protein 125 TMEM125 0.96 2.59
ENSBTAG00000004356 roundabout guidance receptor 4 ROBO4 0.91 3.24
ENSBTAG00000007352 potassium channel, voltage gated
Shaw related subfamily C, member 4 KCNC4 0.91 2.37
ENSBTAG00000000496 solute carrier family 12, member 8 SLC12A8 0.88 2.39
ENSBTAG00000006835 melanoma cell adhesion molecule MCAM 0.85 2.30
ENSBTAG00000006752 6-phosphofructo-2-kinase/fructose-2,6-
biphosphatase 4 PFKFB4 0.82 2.39
ENSBTAG00000011403 RUN and SH3 domain containing
2 RUSC2 0.82 2.38
ENSBTAG00000020990 purinergic receptor P2Y, G-
protein coupled, 14 P2RY14 0.81 2.34
ENSBTAG00000004207 CD93 molecule CD93 0.8 2.70
ENSBTAG00000005871 MDS1 and EVI1 complex locus MECOM 0.79 2.89
ENSBTAG00000047144 Uncharacterized protein NA 0.79 2.89
ENSBTAG00000001803 four and a half LIM domains 5 FHL5 0.79 2.48

75
Table 2-5. Cont.
ENSEMBL Gene ID Gene Name Symbol Log2 FC –Log10 p-value
ENSBTAG00000007884 sterol regulatory element binding
transcription factor 1 SREBF1 0.76 2.60
ENSBTAG00000006894 nitric oxide synthase 2 NOS2 0.76 2.37
ENSBTAG00000015794 nestin NES 0.74 2.68
ENSBTAG00000006434 synaptopodin 2 SYNPO2 0.73 3.62
ENSBTAG00000030333 amine oxidase, copper containing
3 AOC3 0.73 3.37
ENSBTAG00000011001 v-ets avian erythroblastosis virus
E26 oncogene homolog ERG 0.73 3.15
ENSBTAG00000010366 hypocretin (orexin) receptor 1 HCRTR1 0.73 2.48
ENSBTAG00000046047 Uncharacterized protein NA 0.72 4.10
ENSBTAG00000022837 zinc finger protein 75D ZNF75D 0.72 4.10
ENSBTAG00000034373 cadherin 13 CDH13 0.69 3.55
ENSBTAG00000038700 family with sequence similarity
124 member B FAM124B 0.67 3.00
ENSBTAG00000003238 mesenchyme homeobox 2 MEOX2 0.66 2.96
ENSBTAG00000003711 endothelial PAS domain protein 1 EPAS1 0.66 2.38
ENSBTAG00000004347 adhesion G protein-coupled
receptor F5 ADGRF5 0.64 3.08
ENSBTAG00000031252 CD82 molecule CD82 0.64 3.00
ENSBTAG00000007129 murine retrovirus integration site 1
homolog MRVI1 0.64 2.36
ENSBTAG00000003312 carbohydrate (N-
acetylgalactosamine 4-sulfate 6-O) sulfotransferase 15 CHST15 0.63 3.21
ENSBTAG00000017869 caveolin 1 CAV1 0.62 2.82
ENSBTAG00000010297 dehydrogenase/reductase (SDR
family) member 11 DHRS11 0.62 2.29
ENSBTAG00000000053 filamin A interacting protein 1 FILIP1 0.61 3.77
ENSBTAG00000012066 platelet/endothelial cell adhesion
molecule 1 PECAM1 0.6 2.60
ENSBTAG00000009617 solute carrier family 2 (facilitated glucose transporter), member 1 SLC2A1 0.56 2.72
ENSBTAG00000037508 early B-cell factor 1 EBF1 0.54 2.43
ENSBTAG00000005077 chemokine (CXC motif) ligand 12 CXCL12 0.54 2.42
ENSBTAG00000012119 protein tyrosine phosphatase,
receptor type Z1 PTPRZ1 -0.55 2.31
ENSBTAG00000004066 poly(ADP-ribose) polymerase
family member 8 PARP8 -0.57 2.34
ENSBTAG00000021469 cortactin binding protein 2 CTTNBP2 -0.61 3.40
ENSBTAG00000046343 cyclin J like CCNJL -0.74 2.44
ENSBTAG00000037510 GTPase, IMAP family member 1 GIMAP1 -0.76 2.34
ENSBTAG00000039847 Uncharacterized protein NA -0.78 3.16
ENSBTAG00000039380 Uncharacterized protein NA -0.78 3.16

76
Table 2-5. Cont.
ENSEMBL Gene ID Gene Name Symbol Log2 FC –Log10 p-value
ENSBTAG00000006338 v-myc avian myelocytomatosis viral oncogene lung carcinoma
derived homolog MYCL -0.79 2.85
ENSBTAG00000044087 KIAA1328 KIAA1328 -0.8 3.27
ENSBTAG00000046744 paralemmin 3 PALM3 -0.8 2.35
ENSBTAG00000003802 tektin 3 TEKT3 -0.83 2.80
ENSBTAG00000000961 neuralized E3 ubiquitin protein
ligase 2 NEURL2 -0.84 2.64
ENSBTAG00000005122 kininogen 1 KNG1 -0.85 2.55
ENSBTAG00000013292 SID1 transmembrane family
member 1 SIDT1 -0.85 2.37
ENSBTAG00000006742 paired box 1 PAX1 -0.88 2.34
ENSBTAG00000011854 solute carrier family 38 member 5 SLC38A5 -0.93 2.62
ENSBTAG00000046389 killer cell lectin-like receptor
subfamily D, member 1 KLRD1 -0.94 2.59
ENSBTAG00000047625 protocadherin Fat 2 precursor NA -0.96 2.80
ENSBTAG00000010178 protein tyrosine phosphatase,
receptor type D PTPRD -0.97 2.37
ENSBTAG00000009460 zinc finger protein 550 ZNF550 -0.99 2.52
ENSBTAG00000007772 solute carrier family 29
(equilibrative nucleoside transporter), member 4 SLC29A4 -0.99 2.48
ENSBTAG00000008550 GTPase, IMAP family member 7 GIMAP7 -1.01 2.38
ENSBTAG00000044033 EGF like repeats and discoidin
domains 3 EDIL3 -1.12 3.06
ENSBTAG00000046648 carboxypeptidase A4 CPA4 -1.15 2.62
ENSBTAG00000013476 carboxypeptidase A5 CPA5 -1.15 2.62
XLOC_023625 NA NA -1.15 2.62
ENSBTAG00000008168 StAR related lipid transfer domain
containing 6 STARD6 -1.17 2.34
ENSBTAG00000015467 family with sequence similarity
184 member A FAM184A -1.19 2.51
ENSBTAG00000046104 beta-1,3-N-
acetylgalactosaminyltransferase 1 B3GALNT1 -1.26 3.09
ENSBTAG00000006438 actin like 8 ACTL8 -1.3 2.30
ENSBTAG00000006877 matrix metallopeptidase 16 MMP16 -1.42 3.09
ENSBTAG00000003626 myosin IIIB MYO3B -1.54 3.02
ENSBTAG00000031348 chemokine (C-C motif) receptor 9 CCR9 -1.55 2.62
ENSBTAG00000043950 Leber congenital amaurosis 5 LCA5 -1.61 2.96
XLOC_006989 NA NA -1.62 2.55
ENSBTAG00000002582 lysozyme g2 LYG2 -1.78 2.48
ENSBTAG00000019460 monooxygenase, DBH-like 1 MOXD1 -1.81 2.80
ENSBTAG00000011985 feline leukemia virus subgroup C receptor-related protein 2 LOC509034 -1.96 2.42

77
Table 2-5. Cont.
ENSEMBL Gene ID Gene Name Symbol Log2 Fold Change
–Log10 p-value
ENSBTAG00000039425 keratin 6A KRT6A -2.2 2.96
ENSBTAG00000014758 WNT inhibitory factor 1 WIF1 -3.18 3.08
HT vs. CL D14
ENSBTAG00000011666 thyroid hormone responsive THRSP 4.71 3.11
ENSBTAG00000031802 spermatogenesis associated 16 SPATA16 2.95 4.77
ENSBTAG00000001417 acyl-CoA synthetase medium-
chain family member 1 ACSM1 2.93 4.17
ENSBTAG00000019588 MHC cell surface glycoprotein LA-DQB 2.73 3.64
ENSBTAG00000030483 kallikrein related peptidase 7 KLK7 2.02 2.54
ENSBTAG00000012393 angiotensinogen AGT 1.93 2.27
ENSBTAG00000000908 hydroxycarboxylic acid receptor 1 HCAR1 1.78 2.43
ENSBTAG00000017677 secretogranin III SCG3 1.32 3.30
ENSBTAG00000023659 metallothionein 2A MT2A 1.17 3.01
ENSBTAG00000046583 transmembrane protein 61 TMEM61 1.14 2.68
ENSBTAG00000020704 receptor (G protein-coupled) activity modifying protein 3 RAMP3 1.05 2.55
ENSBTAG00000013848 adhesion G protein-coupled
receptor D1 ADGRD1 0.7 2.49
ENSBTAG00000036101 kynurenine-oxoglutarate
transaminase 1 LOC781863 0.65 3.16
ENSBTAG00000002081 bone morphogenetic protein
receptor type IB BMPR1B -1.93 2.43
ENSBTAG00000001835 gap junction protein alpha 1 GJA1 -2.44 2.33
XLOC_021776 NA NA -2.66 2.34
ENSBTAG00000008074 C1q and tumor necrosis factor
related protein 6 C1QTNF6 -2.79 2.42
ENSBTAG00000007344 FERM domain containing 7 FRMD7 -2.89 2.64
ENSBTAG00000018765 semaphorin 5B SEMA5B -2.91 2.74
ENSBTAG00000006579 prolyl 4-hydroxylase, alpha
polypeptide III P4HA3 -3.23 2.47
ENSBTAG00000017500 potassium channel, two pore
domain subfamily K, member 12 KCNK12 -3.44 2.54
ENSBTAG00000004206 leucine rich repeat containing 55 LRRC55 -4 2.89
ENSBTAG00000017071 C1q and tumor necrosis factor
related protein 3 C1QTNF3 -4.13 2.64
ENSBTAG00000026708 protease, serine 35 PRSS35 -4.13 2.62
ENSBTAG00000007431 cell migration inducing protein,
hyaluronan binding CEMIP -4.39 2.85
ENSBTAG00000021217 collagen type XI alpha 1 COL11A1 -4.45 2.77
ENSBTAG00000003938 fibronectin type III domain-
containing protein 1 LOC783891 -4.64 2.92
HT vs. CL D25
ENSBTAG00000005005 casein alpha-S2 CSN1S2 2.94 2.33
ENSBTAG00000045514 Uncharacterized protein NA 2.91 2.46

78
Table 2-5. Cont.
ENSEMBL Gene ID Gene Name Symbol Log2 FC –Log10 p-value
ENSBTAG00000031802 spermatogenesis associated 16 SPATA16 2.7 3.82
ENSBTAG00000019588 MHC cell surface glycoprotein LA-DQB 2.19 2.70
ENSBTAG00000023270 cadherin 19, type 2 CDH19 1.95 2.62
ENSBTAG00000010880 troponin I type 2 (skeletal, fast) TNNI2 1.58 2.89
ENSBTAG00000040103 synaptotagmin 8 SYT8 1.58 2.89
ENSBTAG00000013854 calmodulin-like 5 CALML5 1.49 2.74
ENSBTAG00000045746 patatin-like phospholipase
domain-containing protein 3 LOC786474 1.48 2.31
ENSBTAG00000003367 Uncharacterized protein NA 1.48 2.31
ENSBTAG00000016646 potassium channel, voltage gated
shaker related subfamily A, member 1 KCNA1 1.21 2.96
ENSBTAG00000030483 kallikrein related peptidase 7 KLK7 1.2 2.49
ENSBTAG00000015080 phosphatase and actin regulator
3 PHACTR3 1.15 2.46
ENSBTAG00000012768 HMG box domain containing 3 HMGXB3 0.73 3.92
ENSBTAG00000014615 solute carrier family 26 (anion
exchanger), member 2 SLC26A2 0.73 3.92
ENSBTAG00000007102 G2 and S-phase expressed 1 GTSE1 0.69 2.36
ENSBTAG00000037510 GTPase, IMAP family member 1 GIMAP1 -0.62 2.34
XLOC_008612 NA NA -0.69 2.44
ENSBTAG00000006452 CD3d molecule CD3D -0.7 2.29
ENSBTAG00000013292 SID1 transmembrane family
member 1 SIDT1 -0.7 2.54
ENSBTAG00000013476 carboxypeptidase A5 CPA5 -0.94 2.60
ENSBTAG00000046648 carboxypeptidase A4 CPA4 -0.94 2.60
ENSBTAG00000003802 tektin 3 TEKT3 -0.95 3.02
XLOC_003026 NA NA -1.05 2.31
ENSBTAG00000010103 tripartite motif containing 9 TRIM9 -1.57 2.77
ENSBTAG00000004145 anoctamin 4 ANO4 -1.71 2.89
XLOC_001738 NA NA -1.97 2.55
ENSBTAG00000014758 WNT inhibitory factor 1 WIF1 -2.63 2.74
XLOC_021690 NA NA -3.95 9.44
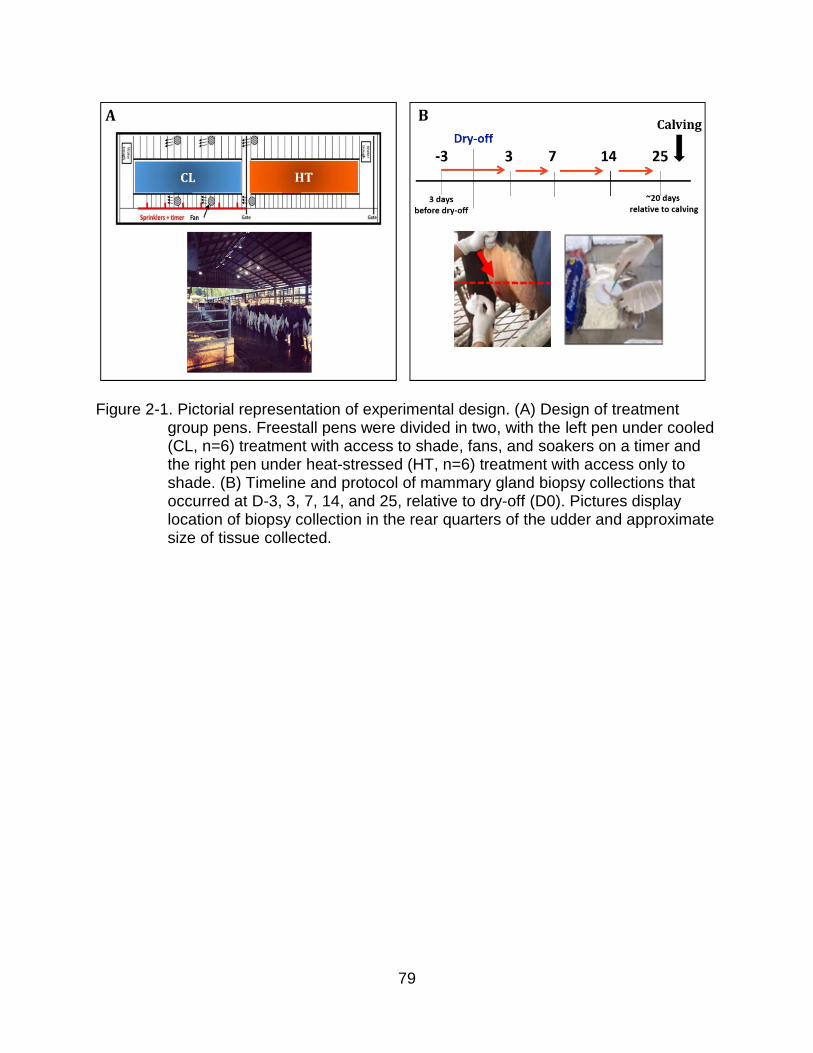
79
Figure 2-1. Pictorial representation of experimental design. (A) Design of treatment
group pens. Freestall pens were divided in two, with the left pen under cooled (CL, n=6) treatment with access to shade, fans, and soakers on a timer and the right pen under heat-stressed (HT, n=6) treatment with access only to shade. (B) Timeline and protocol of mammary gland biopsy collections that occurred at D-3, 3, 7, 14, and 25, relative to dry-off (D0). Pictures display location of biopsy collection in the rear quarters of the udder and approximate size of tissue collected.

80
Figure 2-2. Volcano plot of DEGs in bovine mammary tissue during early involution (D3
vs. D-3 and D7 vs. D3). Differential gene expression in the bovine mammary gland contrasting (A) D3 vs. D-3 (n=12, early involution vs. late lactation) and (B) D7 vs. D3 (n=12, first week of involution). D0 indicates dry-off (~46 d relative to expected calving). Cut-off criteria for DEG significance was FDR ≤ 5%. The y-axis displays the -log10 q-value for each gene, while the x-axis displays the log2 fold change for that gene relative to D3 (A) or D7 (B). Red dots indicate upregulation, green dots indicate downregulation, and black dots indicate non-significance relative to (A) D3 or (B) D7.

81
Figure 2-3. Significantly enriched Kyoto Encyclopedia of Genes and Genomes (KEGG) pathways and Medical Subject Headings (MeSH) terms in bovine mammary tissue during early involution (D3 vs. D-3 and D7 vs. D3). Enriched KEGG pathways and MeSH terms among DEGs in the bovine mammary gland contrasting (A) D3 vs. D-3 (n=12, early involution vs. late lactation) and (B) D7 vs. D3 (n=12, first week of involution). D0 indicates dry-off (~ 46 d relative to expecting calving). DEG significance was set at FDR ≤ 5%, and pathway/term significance was set at p ≤ 0.01 (Fisher’s exact test). The y-axis displays the names and the total number of genes of each pathway/term. The x-axis displays the total significance of enrichment (–log10 p-value) and the number of DEGs within each pathway/term with expression relative to (A) D3 or (B) D7. Red and blue bars indicate proportion of upregulated DEGs while green and orange bars indicate proportion of downregulated DEGs.

82
Figure 2-4. Ingenuity® Pathway Analysis (IPA®) upstream regulators and summary network in bovine mammary tissue comparing D3 vs. D-3 relative to dry-off. Significant upstream regulators and network in the bovine mammary gland contrasting early involution vs. late lactation (D3 vs. D-3, n=12). D0 indicates dry-off (~ 46 d relative to expecting calving). The DEG significance was set at FDR ≤ 5%, and the upstream regulator significance of enrichment at p ≤ 0.05 with log2 fold change ≥|1.0|. (A) Upstream regulators are grouped by functional categories with log2 FC (equivalent to expression log ratio) in blue bars, Z-score (activated: >2, inhibited: <-2) in orange bars, and significance of enrichment (–log10 p-value) in gray dots. (B) The summary network depicts the interactions between upstream regulators, downstream genes, and physiological functions. Red and green molecules indicate upregulated and downregulated genes, respectively, relative to D3. Figure legend displays molecules and function symbol types and colors.

83
Figure 2-5. Ingenuity® Pathway Analysis (IPA®) upstream regulators and summary network in bovine mammary tissue
comparing D7 vs. D3 relative to dry-off. Significant upstream regulators and network in the bovine mammary gland during the first week of involution (D7 vs. D3, n=12). D0 indicates dry-off (~46 d relative to expecting calving). The DEG significance was set at FDR ≤ 5%, and upstream regulator significance of enrichment at p ≤ 0.05 with log2 fold change ≥|1.0|. (A) Upstream regulators are grouped by functional categories with log2 fold change (equivalent to expression log ratio) in blue bars, Z-score (activated: >2, inhibited: <-2) in orange bars, and significance of enrichment (–log10 P-value) in gray dots. (B) The summary network depicts the interactions between upstream regulators, downstream genes, and physiological functions. Red and green molecules indicate upregulated and downregulated genes, respectively, relative to D7. Figure legend displays molecules and function symbol types and colors.

84
Figure 2-6. Characterization of DEGs in bovine mammary tissue between heat-stressed (HT) and cooled (CL) dairy cattle during the dry period. (A) Number and direction of DEGs (nominal p ≤ 0.005, absolute log2 fold change ≥ 0.5) in the bovine mammary between HT (n=6) and CL (n=6) dairy cattle at D3, 7, 14, and 25 relative to dry-off (D0, ~46 d relative to expecting calving). Expression is relative to HT cows. Red indicates upregulation, green indicates downregulation, and grey is the total number of DEGs. (B) DEGs that are consistently up- or downregulated over time (D7, 14, and 25) relative to HT cows. The y-axis displays the -log2 fold change of each DEG and the x-axis lists the gene name.

85
Figure 2-7. Ingenuity® Pathway Analysis (IPA®) upstream regulators and summary network in bovine mammary tissue between heat-stressed (HT, n=6) and cooled (CL, n=6) dairy cattle during the dry period. Significant upstream regulators and network in the bovine mammary gland in HT vs. CL cows (relative to HT) at D7 relative to dry-off (D0). The DEG significance was set at FDR ≤ 5%, and upstream regulator significance of enrichment at p ≤ 0.05 with log2 fold change ≥|1.0|. (A) Upstream regulators are grouped by functional categories with log2 fold change (equivalent to expression log ratio) in blue bars, Z-score (activated: >2, inhibited: <-2) in orange bars, and significance of enrichment (–log10 P-value) in gray dots. (B) The summary network depicts the interactions between upstream regulators, downstream genes, and physiological functions impacted by heat stress. Red and green molecules indicate upregulated and downregulated genes, respectively, relative to HT at D7. Figure legend displays molecules and function symbol types and colors.

86
Figure 2-8. Validation of RNA-Sequencing results by quantitative RT-PCR. (A) Log2 fold
change comparison of RNA-Seq (dark blue bars) and quantitative real-time PCR (qRT-PCR, light blue bars) for five differentially expressed genes downregulated at D3 (LABLA, CSN2, CSN1S2, CSN1S1, SLC7A5; n=12) and five genes upregulated at D3 (MXRA5, SLC7A8, LBP, ANGPTL4, LOXL4; n=12) when comparing D3 vs. D-3 relative to dry-off (D0, ~ 46 d relative to calving). (B) Correlation between RNA-Seq and RT-PCR gene expression (R2 = 0.9386, p < 0.0001).

87
CHAPTER 3 GENERAL DISCUSSION AND SUMMARY
The importance of providing a dry period to dairy cows between consecutive
lactations is well-recognized, allowing for involution of the mammary gland
characterized by decreased milk secretion and increased cell death and immune
response24,26 followed by redevelopment through increased cell proliferation and
eventually colostrogenesis prior to calving.20 Recent research has shown that exposure
of dairy cows to environmental heat stress during the dry period can negatively alter
these important cellular processes and impact milk production.94,95,117 Thus, strategies
must be implemented to rescue mammary function if thermal stress occurs.
Recent literature has identified key factors involved in mammary involution in
mouse and bovine models,25,39,40 but none have collected multiple tissues from the
same animal across the full duration of the late-lactation and late-gestation dry period to
capture gene expression changes through involution and redevelopment. This thesis
research is the first to utilize RNA-Sequencing to deep-sequence the dry period
mammary transcriptome, providing insight into genes, pathways, and upstream
regulators that influence metabolism, cell turnover, and immune function. This study
also highlights the negative impact of chronic dry period heat stress on in vivo
mammary development and function at the transcriptomic level, particularly in ductal
development, metabolism, and stress response.
From the differentially expressed genes, pathways and upstream regulators over
time or under heat stress, RNA-Seq uncovered target genes that will undergo further
investigations and validation that will eventually serve to, for example, improve the dry
period cellular turnover during early involution and/or combat the negative alterations

88
caused by heat stress. From these, upstream regulators, including some transcription
factors, are ideal candidates with the potential to alter expression of key downstream
genes. Regulators central to metabolism, such as PPARGC1A and INSIG, were
significantly downregulated during early involution as milk component synthesis
decreased. Manipulation of these factors immediately prior to milk stasis may more
quickly downregulate their expression upon dry-off and allow the gland to produce less
milk after stasis, leading to reduced mammary pressure and potential for decreased
mammary infections (e.g. residual milk can serve as a nutrient source for bacteria).
Interestingly, both PPARGC1A and INSIG had increased expression in heat-stressed
cows (relative to cooled cows) at D7 of involution, and I speculate that this change in
gene expression is a positive physiological acclimation to heat stress to promote
thermotolerance. Other candidates for manipulation include pro-apoptotic regulators
such as IGFBP5, PTGES, and BACH2 that were upregulated during involution and
could be promoted in mammary tissue to accelerate cell death during involution,
potentially shortening the dry period to lend more days to milk production, particularly in
high producing cows to increase revenue.
Genes were identified with altered expression under dry period heat stress that
may also serve as targets to improve mammary development under stress and increase
milk production in the next lactation. Candidate genes include those in the Wnt pathway
and involved in ciliary formation that have been shown to play a role in ductal formation
during mammary development.191 Decreasing pathway inhibitors (WIF1) and increasing
expression of ciliary function genes such as LCA5 and MYO3B, all of which were
downregulated in heat stressed cows at D7, might promote mammary redevelopment

89
during the dry period. Other candidate genes include those involved in cellular death
and extracellular matrix breakdown. The gene IL20RB promotes mammary involution
and immune function by inducing STAT3 expression and was consistently upregulated
in heat-stressed cows, potentially as a mechanism of cell death for damaged cells. The
upstream regulator MMP7, involved in breakdown of the extracellular matrix as a
necessary step in completing the involution process, was downregulated at D7 in heat-
stressed cows. Manipulation of these target genes for down or upregulation,
respectively, may impact thermotolerance, promoting faster involution and removal of
damaged cells, both of which may improve milk production in the next lactation.
Another target area for exploration is long non-coding RNAs (lncRNA) and
microRNAs (miRNA) that regulate gene and protein expression through a variety of
modifications and are listed as non-annotated genes within this dataset. In particular,
RNA-Seq characterized one lncRNA with seed regions for seven miRNAs that was
downregulated in heat-stressed cows. These miRNAs were shown to target several key
downstream genes that play important roles in metabolism and involution. Targeting
these miRNAs for increased or decreased expression might influence downstream gene
expression to promote thermotolerance and mammary development.
While speculation can be made about targeting individual genes, non-coding
RNA or even entire pathways, caution must be taken that other aspects of the dry-cow
physiology like body maintenance and the developing fetus are not negatively affected
by manipulation of any of these factors, as many participate in functions outside of
mammary metabolism, apoptosis, and development. For example, IGFBP5 upregulation

90
leads to the downregulation of IGF1, a growth factor necessary for cellular proliferation
during the end of the dry period and an important factor for fetal development.
It is challenging to draw finite conclusions from RNA-Seq discoveries as this tool
generates a large amount of data by opening the “black box” that is the mammary
transcriptome. To narrow analysis and provide statistically sound data, I analyzed only
large statistical differences over time or between treatments but recognize that
employing strict cut-offs limits the expression analysis as some crucial biological
functions may have subtle statistical changes in time or treatment but can alter
mammary form and function. Another limitation from this study is the inability to fully
capture important changes in expression due to necessary duration between biopsies
within the same animal, with the added uncertainty of calving date to capture the
specific phases (e.g. redevelopment). I also recognize that biopsied mammary tissue is
a homogeneous tissue containing both parenchymal and stromal cells; cell-sorting may
be conducted in the future to address this matter. Another important consideration is
that the bioinformatics tools used in this experiment are based on human and/or mouse
literature (e.g. IPA® and TargetScan). I acknowledge that the findings from this work are
exploratory and warrant additional research and validation in the bovine model.
Even with these limitations, RNA-Seq proves to be a valuable tool for
transcriptomic discovery as a basis for more exhaustive research. By analyzing the full
landscape of the mammary transcriptome, I uncovered interesting and novel aspects to
both the dry period and heat stress that I will study in future experiments. In the future, I
plan to utilize in vitro culture systems to manipulate the previously discussed target
genes in bovine MECs. I hope to develop in vitro systems that represent a more chronic

91
heat-stressed environment versus the acute heat shock induced in previous literature87
by exposing cells to a lower temperature across days instead of hours. After in vitro
confirmation, I will move to in vivo models to determine the effect and feasibility of
manipulating candidate genes in a whole animal model. In the near future, I aim to
propose manipulations that can advance the efficiency of the dry period and impact
thermotolerance of the mammary gland to improve milk yield in the next lactation. As
global climate continues to pressure the dairy industry, solutions such as these will
prove to be vital complements of active cooling to rescue milk production.

92
APPENDIX TABLES IN LINKS
Object A-1. Differentially expressed genes D3 vs. D-3. (.xlsx file 288 KB)
Object A-2. Differentially expressed genes D7 vs. D3 (.xlsx file 84 KB)
Object A-3. miRNAs and target genes impacted by heat stress (.xlsx file 64 KB)
93
LIST OF REFERENCES
1. Capuco, A. V., Wood, D. L., Baldwin, R., Mcleod, K. & Paape, M. J. Mammary cell number, proliferation, and apoptosis during a bovine lactation: relation to milk production and effect of bST. J. Dairy Sci. 84, 2177–2187 (2001).
2. Capuco, A. V., Akers, R. M. & Smith, J. J. Mammary growth in holstein cows during the dry period: quantification of nucleic acids and histology. J. Dairy Sci. 80, 477–487 (1997).
3. Swanson, E. W. Comparing continuous milking with sixty-day dry periods in successive lactations. J. Dairy Sci. 48, 1205–1209 (1965).
4. Smith, A., Wheelock, J. V. & Dodd, F. H. Changes in the quantity and composition of mammary gland secretion in the dry period between lactations. II. The complete dry period. J. Dairy Res. 34, 13 (1967).
5. Rémond, B., Rouel, J., Pinson, N. & Jabet, S. An attempt to omit the dry period over three consecutive lactations in dairy cows. Ann. Zootech. 46, 399–408 (1997).
6. Schlamberger, G., Wiedemann, S., Viturro, E., Meyer, H. H. D. & Kaske, M. Effects of continuous milking during the dry period or once daily milking in the first 4 weeks of lactation on metabolism and productivity of dairy cows. J. Dairy Sci. 93, 2471–2485 (2010).
7. Arnold, P. T. D. & Becker, R. B. Influence of preceding dry period and of mineral supplement on lactation. J. Dairy Sci. 19, 257–266 (1936).
8. Coppock, C. E., Everett, R. W., Natzke, R. P. & Ainslie, H. R. Effect of dry period length on holstein milk production and selected disorders at parturition. J. Dairy Sci. 57, 712–718 (1974).
9. Sørensen, J. T. & Enevoldsen, C. Effect of dry period length on milk production in subsequent lactation. J. Dairy Sci. 74, 1277–1283 (1991).
10. Bachman, K. C. Milk production of dairy cows treated with estrogen at the onset of a short dry period. J. Dairy Sci. 85, 797–803 (2002).
11. Gulay, M. S. et al. Milk production and feed intake of holstein cows given short (30-d) or normal (60-d) dry periods. J. Dairy Sci. 86, 2030–2038 (2003).
12. Rastani, R. R. et al. Reducing dry period length to simplify feeding transition cows: milk production, energy balance, and metabolic profiles. J. Dairy Sci. 88, 1004–1014 (2005).
13. Annen, E. L., Collier, R. J., McGuire, M. A. & Vicini, J. L. Effects of dry period length on milk yield and mammary epithelial cells. J. Dairy Sci. 87, E66–E76 (2004).

94
14. Peaker, M. The effect of raised intramammary pressure on mammary function in the goat in relation to the cessation of lactation. J. Physiol. 301, 415–428 (1980).
15. Stelwagen, K., Davis, S. R., Farr, V. C., Prosser, C. G. & Sherlock, R. A. Mammary epithelial cell tight junction integrity and mammary blood flow during an extended milking interval in goats. J. Dairy Sci. 77, 426–432 (1994).
16. Wilde, C. J., Addey, C. V. P., Boddy, L. M. & Peaker, M. Autocrine regulation of milk secretion by a protein in milk Autocrine regulation of milk secretion by a protein in milk. Biochem J. 305, 51–58 (1995).
17. Wilde, C. J., Addey, C. V, Li, P. & Fernig, D. G. Programmed cell death in bovine mammary tissue during lactation and involution. Exp Physiol 82, 943–953 (1997).
18. Accorsi, P. A. et al. Leptin, GH, PRL, insulin and metabolic parameters throughout the dry period and lactation in dairy cows. Reprod. Domest. Anim. 40, 217–223 (2005).
19. Travers, M. T. et al. The role of prolactin and growth hormone in the regulation of casein gene expression and mammary cell survival: relationships to milk synthesis secretion. Endocrinology 137, 1530–1539 (1996).
20. Hurley, W. L. Mammary gland function during involution. J. Dairy Sci. 72, 1637–1646 (1989).
21. Holst, B. D., Hurley, W. L. & Nelson, D. R. Involution of the bovine mammary gland: histological and ultrastructural changes. J. Dairy Sci. 70, 935–944 (1987).
22. Nickerson, S. C., Akers, R. M. & Weinland, B. T. Cytoplasmic organization and quantitation of microtubules in bovine mammary epithelial cells during lactation and involution. Cell Tissue Res. 223, 421–430 (1982).
23. Stelwagen, K., Farr, V. C., McFadden, H. A., Prosser, C. G. & Davis, S. R. Time course of milk accumulation-induced opening of mammary tight junctions, and blood clearance of milk components. Am J Physiol 273, R379-86 (1997).
24. Hurley, W. L. Mammary function during the nonlactating period: enzyme, lactose, protein concentrations, and pH of mammary secretions. J. Dairy Sci. 70, 20–28 (1987).
25. Piantoni, P., Wang, P., Drackley, J. K., Hurley, W. L. & Loor, J. J. Expression of metabolic, tissue remodeling, oxidative stress, and inflammatory pathways in mammary tissue during involution in lactating dairy cows. Bioinform. Biol. Insights 4, 85–97 (2010).

95
26. Sørensen, M., Nørgaard, J. V., Theil, P. K., Vestergaard, M. & Sejrsen, K. Cell turnover and activity in mammary tissue during lactation and the dry period in dairy cows. J. Dairy Sci. 89, 4632–4639 (2006).
27. Todhunter, D. A. & Smith, K. L. The physiology of mammary glands during the dry period and the relationship to infection. in 21st Annu. Mtg. Natl. Mastitis Counc., Inc., 87 (1982).
28. Stein, T., Salomonis, N. & Gusterson, B. A. Mammary gland involution as a multi-step process. J. Mammary Gland Biol. Neoplasia 12, 25–35 (2007).
29. Green, K. A. & Streuli, C. H. Apoptosis regulation in the mammary gland. Cell. Mol. Life Sci. 61, 1867–1883 (2004).
30. Clarkson, R. W. E., Wayland, M. T., Lee, J., Freeman, T. & Watson, C. J. Gene expression profiling of mammary gland development reveals putative roles for death receptors and immune mediators in post-lactational regression. Breast Cancer Res. 6, R92-109 (2004).
31. Kritikou, E. A. A dual, non-redundant, role for LIF as a regulator of development and STAT3-mediated cell death in mammary gland. Development 130, 3459–3468 (2003).
32. Thangaraju, M. C/EBP is a crucial regulator of pro-apoptotic gene expression during mammary gland involution. Development 132, 4675–4685 (2005).
33. Tonner, E. et al. Insulin-like growth factor binding protein-5 (IGFBP-5) induces premature cell death in the mammary glands of transgenic mice. Development 129, 4547–4557 (2002).
34. Abell, K. & Watson, C. J. The Jak / Stat pathway: A novel way to regulate pi3k activity. Cell Cycle 4, 897–900 (2005).
35. Jerry, D. J. et al. Delayed involution of the mammary epithelium in BALB/c-p53null mice. Oncogene 17, 2305–2312 (1998).
36. Nguyen, A. V & Pollard, J. W. Transforming growth factor beta3 induces cell death during the first stage of mammary gland involution. Development 127, 3107–3118 (2000).
37. Humphreys, R. C. et al. Deletion of Stat3 blocks mammary gland involution and extends functional competence of the secretory epithelium in the absence of lactogenic stimuli. Endocrinology 143, 3641–3650 (2002).
38. Zinser, G. M. & Welsh, J. Accelerated mammary gland development during pregnancy and delayed postlactational involution in vitamin D3 receptor null mice. Mol. Endocrinol. 18, 2208–23 (2007).

96
39. Stein, T. et al. Involution of the mouse mammary gland is associated with an immune cascade and an acute-phase response, involving LBP, CD14 and STAT3. Breast Cancer Res. 6, R75–R91 (2004).
40. Singh, K. et al. cDNA microarray analysis reveals that antioxidant and immune genes are upregulated during involution of the bovine mammary gland. J. Dairy Sci. 91, 2236–2246 (2008).
41. Singh, K. et al. Cell survival signaling in the bovine mammary gland during the transition from lactation to involution. J. Dairy Sci. 99, 7523–7543 (2016).
42. Finucane, K. A., McFadden, T. B., Bond, J. P., Kennelly, J. J. & Zhao, F. Q. Onset of lactation in the bovine mammary gland: Gene expression profiling indicates a strong inhibition of gene expression in cell proliferation. Funct. Integr. Genomics 8, 251–264 (2008).
43. Bernabucci, U. et al. Metabolic and hormonal acclimation to heat stress in domesticated ruminants. Animal 4, 1167–1183 (2010).
44. Cole, S. & McCarthy, L. NASA, NOAA Find 2014 Warmest Year in Modern Record. NASA (2015). Available at: https://www.nasa.gov/press/2015/january/nasa-determines-2014-warmest-year-in-modern-record. (Accessed: 22nd February 2018)
45. IPCC. Climate Change 2007 Synthesis Report. Intergovernmental Panel on Climate Change [Core Writing Team IPCC (2007). doi:10.1256/004316502320517344
46. Collier, R. J., Dahl, G. E. & VanBaale, M. J. Major advances associated with environmental effects on dairy cattle. J. Dairy Sci. 89, 1244–1253 (2006).
47. St-Pierre, N. R., Cobanov, B. & Schnitkey, G. Economic losses from heat stress by US livestock industries. J. Dairy Sci. 86, E52–E77 (2003).
48. Ferreira, F. C., Gennari, R. S., Dahl, G. E. & De Vries, A. Economic feasibility of cooling dry cows across the United States. J. Dairy Sci. 99, 9931–9941 (2016).
49. McDowell, R. E. Improvement of livestock production in warm climates. (W. H. Freeman & Co., San Francisco., 1972).
50. Berman, A. et al. Upper critical temperatures and forced ventilation effects for high-yielding dairy cows in a subtropical climate. J. Dairy Sci. 68, 1488–1495 (1985).
51. Robertshaw, D. Thermal regulation and the thermal environment. in Dukes’ Physiology of Domestic Animals (ed. Reece, W. O.) 962–973 (Cornell University Press, 2004).

97
52. Yousef, M. K. Principle of bioclimatology and adaptation. in Bioclimatology and the adaptation of livestock (ed. Johnson, H. D.) 17–29 (Elsevier Science Publisher, 1987).
53. Gebremedhin, K. G. & Wu, B. A model of evaporative cooling of wet skin surface and fur layer. J. Therm. Biol. 26, 537–545 (2001).
54. Berman, A. Estimates of heat stress relief needs for Holstein dairy cows. J. Anim. Sci. 83, 1377–1384 (2005).
55. Zimbelman, R. B., Rhoads, R. P., Collier, R. J. & Duff, G. C. A re-evaluation of the impact of temperature humidity index (THI) and black globe humidity index (BGHI) on milk production in high producing dairy cows. in Proceedings of the Western Dairy Management Conference 158–169 (2009).
56. Horowitz, M. From molecular and cellular to integrative heat defense during exposure to chronic heat. Comp. Biochem. Physiol. - A Mol. Integr. Physiol. 131, 475–483 (2002).
57. Rhoads, M. L. et al. Effects of heat stress and plane of nutrition on lactating Holstein cows: I. Production, metabolism, and aspects of circulating somatotropin. J. Dairy Sci. 92, 1986–1997 (2009).
58. Maloyan, A., Palmon, A. & Horowitz, M. Heat acclimation increases the basal HSP72 level and alters its production dynamics during heat stress. Am. J. Physiol. 276, R1506-15 (1999).
59. Collier, R. J., Baumgard, L. H., Lock, A. L. & Bauman, D. E. Physiological limitations, nutrient partitioning. in Yield of farmed species. Constraints and opportunities in the 21st Century (eds. Sylvester-Bradley, R. & Wiseman, J.) 351–377 (2005).
60. Collier, R. J., Doelger, S. G., Head, H. H., Thatcher, W. W. & Wilcox, C. J. Effects of heat stress during pregnancy on maternal hormone concentrations, calf birth weight and postpartum milk yield of Holstein cows. J Anim Sci 54, 309–319 (1982).
61. Collier, R. J., Beede, D. K., Thatcher, W. W., Israel, L. A. & Wilcox, C. J. Influences of environment and its modification on dairy animal health and production. J. Dairy Sci. 65, 2213–2227 (1982).
62. Johnson, H. D. Depressed chemical thermogenesis and hormonal functions in heat. in Environmental physiology aging; heat and attitude (eds. Horvath, S. M. & Yousef, M. K.) 3–9 (Elsevier, 1980).
63. Ronchi, B. et al. Influence of heat stress or feed restriction on plasma progesterone , oestradiol-17 b , LH , FSH , prolactin and cortisol in Holstein heifers. Livest. Prod. Sci. 68, 231–241 (2001).
98
64. Beede, D. K. & Collier, R. J. Potential nutritional strategies for intensively managed cattle during thermal stress. in Management Strategies to Attenuate Environmental Stresses 543–554 (1986).
65. Gaughan, J. et al. Response of domestic animals to climate challenges. in Biometeorology for Adaptation to Climate Variability and Change (eds. McGregor, G. R. et al.) 131–171 (Springer Science, 2009). doi:10.1007/978-1-4020-8921-3_1
66. Dechow, C. D. & Goodling, R. C. Mortality, culling by sixty days in milk, and production profiles in high- and low-survival pennsylvania herds. J. Dairy Sci. 91, 4630–4639 (2008).
67. Vitali, A. et al. Seasonal pattern of mortality and relationships between mortality and temperature-humidity index in dairy cows. J. Dairy Sci. 92, 3781–3790 (2009).
68. Lacetera, N., Bernabucci, U., Ronchi, B. & Nardone, A. Body condition score, metabolic status and milk production of early lactating dairy cows exposed to warm environment. Riv. di Agric. Subtrop. e Trop. 90, 43–55 (1996).
69. Basiricò, L., Bernabucci, U., Morera, P., Lacetera, N. & Nardone, A. Gene expression and protein secretion of apolipoprotein B100 (ApoB100) in transition dairy cows under hot or thermoneutral environments. Ital. J. Anim. Sci. 8, 592–594 (2009).
70. Bernabucci, U., Ronchi, B., Lacetera, N. & Nardone, A. Markers of oxidative status in plasma and erythrocytes of transition dairy cows during hot season. J. Dairy Sci. 85, 2173–2179 (2002).
71. Mishra, M. et al. Effect of diet and ambient temperature-humidity on ruminal ph, oxidation reduction potential, ammonia and lactic acid in lactating cows. J. Anim. Sci. 30, 123–128 (1970).
72. Bernabucci, U., Bani, P., Ronchi, B., Lacetera, N. & Nardone, A. Influence of short- and long-term exposure to a hot environment on rumen passage rate and diet digestibility by Friesian heifers. J. Dairy Sci. 82, 967–973 (1999).
73. Bernabucci, U. et al. Influence of different periods of exposure to hot environment on rumen function and diet digestibility in sheep. Int. J. Biometeorol. 53, 387–395 (2009).
74. Kadzere, C. T., Murphy, M. R., Silanikove, N. & Maltz, E. Heat stress in lactating dairy cows: A review. Livest. Prod. Sci. 77, 59–91 (2002).
75. Giesecke, W. H. The effect of stress on udder health of dairy cows. J. Vet. Res. 52, 175–193. (1985).

99
76. Morse, D. et al. Climatic effects on occurrence of clinical mastitis. J. Dairy Sci. 71, 848–853 (1988).
77. Chirico, J., Jonsson, P., Kjellberg, S. & Thomas, G. Summer mastitis experimentally induced by Hydrotaea irritans exposed to bacteria. Med. Vet. Entomol. 11, 187–192 (1997).
78. Amundson, J. L., Mader, T. L., Rasby, R. J. & Hu, Q. S. Environmental effects on pregnancy rate in beef cattle. J. Anim. Sci. 84, 3415–3420 (2006).
79. Chebel, R. C. et al. Factors affecting conception rate after artificial insemination and pregnancy loss in lactating dairy cows. Anim. Reprod. Sci. 84, 239–255 (2004).
80. Hansen, P. J. Exploitation of genetic and physiological determinants of embryonic resistance to elevated temperature to improve embryonic survival in dairy cattle during heat stress. Theriogenology 68, 242–249 (2007).
81. Ravagnolo, O., Misztal, I. & Hoogenboom, G. Genetic component of heat stress in dairy cattle, development of heat index function. J. Dairy Sci. 83, 2120–2125 (2000).
82. Bouraoui, R., Lahmar, M., Majdoub, A., Djemali, M. & Belyea, R. The relationship of temperature-humidity index with milk production of dairy cows in a Mediterranean climate. Anim. Res. 51, 479–491 (2002).
83. Bohmanova, J., Misztal, I. & Cole, J. B. Temperature-humidity indices as indicators of milk production losses due to heat stress. J. Dairy Sci. 90, 1947–1956 (2007).
84. Johnson, H. D. Bioclimate and livestock. in Bioclimatology and the adaptation of livestock (ed. Johnson, H. D.) 3–16 (Elsevier Science Publisher, 1987).
85. Johnson, H. D. & Vanjonack, W. J. Effects of environmental and other stressors on blood hormone patterns in lactating animals. J. Dairy Sci. 59, 1603–1617 (1976).
86. West, J. W. Effects of heat-stress on production in dairy cattle. J. Dairy Sci. 86, 2131–2144 (2003).
87. Collier, R. J. et al. Use of gene expression microarrays for evaluating environmental stress tolerance at the cellular level in cattle1. J. Anim. Sci. 84, E1–E13 (2006).
88. Wheelock, J. B., Rhoads, R. P., VanBaale, M. J., Sanders, S. R. & Baumgard, L. H. Effects of heat stress on energetic metabolism in lactating Holstein cows1. J. Dairy Sci. 93, 644–655 (2010).
89. Baumgard, L. H. & Rhoads, R. P. The effects of hyperthermia on nutrient partitioning. in Proceedings of Cornell Nutritional Conference For Feed Manufacturers (ed. Overton, T.) 93–104 (2007).

100
90. Mallard, B. A. et al. Alteration in immune responsiveness during the peripartum period and its ramification on dairy cow and calf health. J. Dairy Sci. 81, 585–595 (1998).
91. Goff, J. P. & Horst, R. L. Physiological changes at parturition and their relationship to metabolic disorders. J. Dairy Sci. 80, 1260–1268 (1997).
92. Hahn, G. L. Dynamic responses of cattle to thermal heat loads. J. Anim. Sci. 77, 10–20 (1999).
93. Wolfenson, D., Flamenbaum, I. & Berman, A. Dry period heat stress relief effects on prepartum progesterone, calf birth weight, and milk production. J. Dairy Sci. 71, 809–818 (1988).
94. do Amaral, B. C. et al. Heat-stress abatement during the dry period: Does cooling improve transition into lactation? J. Dairy Sci. 92, 5988–5999 (2009).
95. Tao, S. et al. Effect of heat stress during the dry period on mammary gland development. J. Dairy Sci. 94, 5976–5986 (2011).
96. Avendaño-Reyes, L. et al. Effect of cooling Holstein cows during the dry period on postpartum performance under heat stress conditions. Livest. Sci. 105, 198–206 (2006).
97. Moore, R. B., Fuquay, J. W. & Drapala, W. J. Effects of late gestation heat stress on postpartum milk production and reproduction in dairy cattle. J. Dairy Sci. 75, 1877–1882 (1992).
98. Fabris, T. F. et al. Impact of heat stress during the early and late dry period on subsequent performance in dairy cattle. J. Dairy Sci. 100, 386 (2017).
99. do Amaral, B. C. et al. Heat stress abatement during the dry period influences metabolic gene expression and improves immune status in the transition period of dairy cows. J. Dairy Sci. 94, 86–96 (2011).
100. Wohlgemuth, S. E. et al. Short communication : Effect of heat stress on markers of autophagy in the mammary gland during the dry period. J. Dairy Sci. 99, 4875–4880 (2016).
101. Mejia, C. et al. Exposure of dairy cows to heat stress during late gestation or while in utero affects mammary gland microstructure. J. Dairy Sci. 100, 185 (2017).
102. Lough, D. S., Beede, D. L. & Wilcox, C. J. Effects of feed intake and thermal stress on mammary blood flow and other physiological measurements in lactating dairy cows. J Dairy Sci 73, 325–332 (1990).
103. do Amaral, B. C. do et al. Heat stress abatement during the dry period influences prolactin signaling in lymphocytes. Domest. Anim. Endocrinol. 38, 38–45 (2010).

101
104. Tao, S. & Dahl, G. E. Invited review: Heat stress effects during late gestation on dry cows and their calves. J. Dairy Sci. 96, 4079–4093 (2013).
105. Adin, G. et al. Effects of cooling dry cows under heat load conditions on mammary gland enzymatic activity, intake of food and water, and performance during the dry period and after parturition. Livest. Sci. 124, 189–195 (2009).
106. Fabris, T. F. et al. Effect of nutritional immunomodulation and heat stress during the dry period on subsequent performance of cows. J. Dairy Sci. 100, 6733–6742 (2017).
107. Urdaz, J. H., Overton, M. W., Moore, D. A. & Santos, J. E. P. Technical note: Effects of adding shade and fans to a feedbunk sprinkler system for preparturient cows on health and performance. J. Dairy Sci. 89, 2000–2006 (2006).
108. Tao, S. et al. Effect of cooling heat-stressed dairy cows during the dry period on insulin response. J. Dairy Sci. 95, 5035–5046 (2012).
109. Drackley, J. K., Overton, T. R. & Douglas, G. N. Adaptations of glucose and long-chain fatty acid metabolism in liver of dairy cows during the periparturient period. J. Dairy Sci. 84, E100–E112 (2001).
110. Tao, S., Monteiro, A. P. A., Thompson, I. M., Hayen, M. J. & Dahl, G. E. Effect of late-gestation maternal heat stress on growth and immune function of dairy calves. J. Dairy Sci. 95, 7128–7136 (2012).
111. Bauman, D. E. & Currie, W. B. Partitioning of nutrients during pregnancy and lactation: a review of mechanisms involving homeostasis and homeorhesis. J. Dairy Sci. 63, 1514–1529 (1980).
112. Thompson, I. M. & Dahl, G. E. Dry period seasonal effects on the subsequent lactation. Prof. Anim. Sci. 28, 628–631 (2012).
113. Lacetera, N. et al. Lymphocyte functions in dairy cows in hot environment. Int. J. Biometeorol. 50, 105–110 (2005).
114. Tao, S. et al. Short communication: Effect of heat stress during the dry period on gene expression in mammary tissue and peripheral blood mononuclear cells. J Dairy Sci 96, 378–383 (2013).
115. Lindquist, S. The heat-shock response. Annu. Rev. Biochem. 55, 1151–1191 (1986).
116. Parsell, D. The Function of Heat-Shock Proteins in Stress Tolerance: Degradation and reactivation of damaged proteins. Annu. Rev. Genet. 27, 437–496 (1993).

102
117. Collier, R. J., Collier, J. L., Rhoads, R. P. & Baumgard, L. H. Invited Review: Genes involved in the bovine heat stress response. J. Dairy Sci. 91, 445–454 (2008).
118. Sonna, L. A., Fujita, J., Gaffin, S. & Lilly, C. M. Effect of heat and cold stress on mammalian gene expression. J. Appl. Physiol. 92, 1725–1742 (2002).
119. Morimoto, R. I. Regulation of the heat shock transcriptional response: cross talk between a family of heat shock factors, molecular chaperones, and negative regulators. Genes Dev. 12, 3788–3796 (1998).
120. Sarge, K. D., Murphy, S. P. & Morimoto, R. I. Activation of heat shock gene transcription by heat shock factor 1 involves oligomerization, acquisition of DNA-binding activity, and nuclear localization and can occur in the absence of stress. Mol. Cell. Biol. 13, 1392–407 (1993).
121. Winter, A., Alzinger, A. & Fries, R. Assessment of the gene content of the chromosomal regions flanking bovine DGAT1. Genomics 83, 172–180 (2004).
122. Georgopoulos, C. Shock proteins as molecular chaperones. Annu. Rev. Cell Biol. 9, 601–634 (1993).
123. Otterbein, L. E. & Choi, M. Heme oxygenase: colors of defense against cellular stress. Am. J. Physiol. Lung Cell. Mol. Physiol. 279, 1029–1037 (2000).
124. Banks, A. D. Identification of single nucleotide polymorphisms within the promoter region of the bovine heat shock protein 70 gene and associations with pregnancy. (2004).
125. Adamowicz, T., Pers, E. & Lechniak, D. A new SNP in the 3′-UTR of the hsp 70-1 gene in Bos taurus and Bos indicus. Biochem. Genet. 43, 623–627 (2005).
126. Cheng, W. et al. Genetic polymorphism of Hsp70-1 gene and its correlation with resistance to mastitis in Chinese Holstein. Yi Chuan 31, 169–174 (2009).
127. Li, L. et al. The global effect of heat on gene expression in cultured bovine mammary epithelial cells. Cell Stress Chaperones 20, 381–389 (2015).
128. Weber, A. P. M. Discovering new biology through RNA-Seq. Plant Physiol. pp.01081.2015 (2015). doi:10.1104/pp.15.01081
129. Mortazavi, A., Williams, B. A., McCue, K., Schaeffer, L. & Wold, B. Mapping and quantifying mammalian transcriptomes by RNA-Seq. Nat. Methods 5, 621–628 (2008).
130. Cloonan, N. et al. Stem cell transcriptome profiling via massive-scale mRNA sequencing. Nat. Methods 5, 613–619 (2008).

103
131. Nagalakshmi, U. et al. The transcriptional landscape of the yeast genome defined by rna sequencing. Science 320, 1344–1350 (2008).
132. Wilhelm, B. T. et al. Dynamic repertoire of a eukaryotic transcriptome surveyed at single-nucleotide resolution. Nature 453, 1239–1243 (2008).
133. Nookaew, I. et al. A comprehensive comparison of RNA-Seq-based transcriptome analysis from reads to differential gene expression and cross-comparison with microarrays: A case study in Saccharomyces cerevisiae. Nucleic Acids Res. 40, 10084–10097 (2012).
134. Nolte, V. & Schlötterer, C. African Drosophila melanogaster and D. simulans populations have similar levels of sequence variability, suggesting comparable effective population sizes. Genetics 178, 405–412 (2008).
135. Weber, A. P. M., Weber, K. L., Carr, K., Wilkerson, C. & Ohlrogge, J. B. Sampling the Arabidopsis transcriptome with massively parallel pyrosequencing. Plant Physiol. 144, 32–42 (2007).
136. Yan, L. et al. Single-cell RNA-Seq profiling of human preimplantation embryos and embryonic stem cells. Nat. Struct. Mol. Biol. 20, 1131–1139 (2013).
137. Peng, Z. et al. Comprehensive analysis of RNA-Seq data reveals extensive RNA editing in a human transcriptome. Nat. Biotechnol. 30, 253–260 (2012).
138. Zhao, S., Fung-Leung, W. P., Bittner, A., Ngo, K. & Liu, X. Comparison of RNA-Seq and microarray in transcriptome profiling of activated T cells. PLoS One 9, (2014).
139. Wang, Z., Gerstein, M. & Snyder, M. RNA-seq: a revolutionary toll for transcriptomics. Nat. Rev. 10, 57–63 (2009).
140. Barbazuk, W. B., Emrich, S. J., Chen, H. D., Li, L. & Schnable, P. S. SNP discovery via 454 transcriptome sequencing. Plant J. 51, 910–918 (2007).
141. Vera, J. C. et al. Rapid transcriptome characterization for a nonmodel organism using 454 pyrosequencing. Mol. Ecol. 17, 1636–1647 (2008).
142. Emrich, S. J., Barbazuk, W. B., Li, L. & Schnable, P. S. Gene discovery and annotation using LCM-454 transcriptome sequencing. Genome Res. 17, 69–73 (2007).
143. Okoniewski, M. J. & Miller, C. J. Hybridization interactions between probesets in short oligo microarrays lead to spurious correlations. BMC Bioinformatics 7, 1–14 (2006).

104
144. Royce, T. E., Rozowsky, J. S. & Gerstein, M. B. Toward a universal microarray: Prediction of gene expression through nearest-neighbor probe sequence identification. Nucleic Acids Res. 35, 1–10 (2007).
145. Marioni, J. C., Mason, C. E., Mane, S. M., Stephens, M. & Gilad, Y. RNA-seq : An assessment of technical reproducibility and comparison with gene expression arrays. Genome Res. 18, 1509–1517 (2008).
146. Cánovas, A., Rincon, G., Islas-Trejo, A., Wickramasinghe, S. & Medrano, J. F. SNP discovery in the bovine milk transcriptome using RNA-Seq technology. Mamm. Genome 21, 592–598 (2010).
147. Wickramasinghe, S., Rincon, G., Islas-Trejo, A. & Medrano, J. F. Transcriptional profiling of bovine milk using RNA sequencing. BMC Genomics 13, (2012).
148. Li, Z., Liu, H., Jin, X., Lo, L. & Liu, J. Expression profiles of microRNAs from lactating and non-lactating bovine mammary glands and identification of miRNA related to lactation. BMC Genomics 13, (2012).
149. Cui, X. et al. Transcriptional profiling of mammary gland in Holstein cows with extremely different milk protein and fat percentage using RNA sequencing. BMC Genomics 15, 226 (2014).
150. Li, C. et al. RNA-Seq reveals 10 novel promising candidate genes affecting milk protein concentration in the Chinese Holstein population. Sci. Rep. 6, 1–11 (2016).
151. Cánovas, A. et al. Comparison of five different RNA sources to examine the lactating bovine mammary gland transcriptome using RNA-Sequencing. Sci. Rep. 4, 1–7 (2014).
152. Huang, W. & Khatib, H. 13-Comparison of transcriptomic landscapes of bovine embryos using RNA-Seq. BMC Genomics 11, 711 (2010).
153. Graf, A. et al. Fine mapping of genome activation in bovine embryos by RNA sequencing. Proc. Natl. Acad. Sci. 111, 4139–4144 (2014).
154. Peñagaricano, F. et al. Effect of maternal methionine supplementation on the transcriptome of bovine preimplantation embryos. PLoS One 8, (2013).
155. Chitwood, J. L., Rincon, G., Kaiser, G. G., Medrano, J. F. & Ross, P. J. RNA-seq analysis of single bovine blastocysts. BMC Genomics 14, (2013).
156. Driver, A. M. et al. RNA-Seq analysis uncovers transcriptomic variations between morphologically similar in vivo- and in vitro-derived bovine blastocysts. BMC Genomics 13, (2012).

105
157. McCabe, M. et al. RNA-seq analysis of differential gene expression in liver from lactating dairy cows divergent in negative energy balance. BMC Genomics 13, (2012).
158. Fatima, A., Lynn, D. J., O’Boyle, P., Seoighe, C. & Morris, D. The miRNAome of the postpartum dairy cow liver in negative energy balance. BMC Genomics 15, 279 (2014).
159. Schmitt-Ney, M., Happ, B., Hofer, P., Hynes, N. E. & Groner, B. Mammary gland-specific nuclear factor activity is positively regulated by lactogenic hormones and negatively by milk stasis. Mol. Endocrinol. 6, 1988–97 (1992).
160. Liu, X., Robinson, G. W. & Hennighausen, L. Activation of Stat5a and Stat5b by tyrosine phosphorylation is tightly linked to mammary gland differentiation. Mol. Endocrinol. 10, 1496–1506 (1996).
161. Tonner, E., Barber, M. C., Travers, M. T., Logan, A. & Flint, D. J. hormonal control of insulin-like growth factor- binding protein-5 production in the involuting mammary gland of the rat. Endocrinology 138, 5101–5107 (1997).
162. Farr, V. C. et al. An Improved Method for the Routine Biopsy of Bovine Mammary Tissue. J. Dairy Sci. 79, 543–549 (1996).
163. Kim, D. et al. TopHat2: accurate alignment of transcriptomes in the presence of insertions, deletions and gene fusions. Genome Biol. 14, R36 (2013).
164. Trapnell, C., Pachter, L. & Salzberg, S. L. TopHat: discovering splice junctions with RNA-Seq. Bioinformatics 25, 1105–1111 (2009).
165. Peñagaricano, F., Wang, X., Rosa, G. J. M., Radunz, A. E. & Khatib, H. Maternal nutrition induces gene expression changes in fetal muscle and adipose tissues in sheep. BMC Genomics 15, 1–13 (2014).
166. Trapnell, C. et al. Transcript assembly and quantification by RNA-Seq reveals unannotated transcripts and isoform switching during cell differentiation. Nat. Biotechnol. 28, 511–515 (2010).
167. Anders, S., Pyl, P. T. & Huber, W. HTSeq--a Python framework to work with high-throughput sequencing data. Bioinformatics 31, 166–169 (2015).
168. Robinson, M. D., McCarthy, D. J. & Smyth, G. K. edgeR: a Bioconductor package for differential expression analysis of digital gene expression data. Bioinformatics 26, 139–140 (2010).
169. Morota, G. et al. An application of MeSH enrichment analysis in livestock. Anim. Genet. 46, 381–387 (2015).

106
170. Young, M. D., Wakefield, M. J., Smyth, G. K. & Oshlack, A. Gene ontology analysis for RNA-seq: accounting for selection bias. Genome Biol. 11, R14 (2010).
171. Tsuyuzaki, K. et al. MeSH ORA framework: R/Bioconductor packages to support MeSH over-representation analysis. BMC Bioinformatics 16, 45 (2015).
172. Laporta, J., Keil, K. P., Vezina, C. M. & Hernandez, L. L. Peripheral serotonin regulates maternal calcium trafficking in mammary epithelial cells during lactation in mice. PLoS One 9, 1–9 (2014).
173. Untergasser, A. et al. Primer3-new capabilities and interfaces. Nucleic Acids Res. 40, 1–12 (2012).
174. Koressaar, T. & Remm, M. Enhancements and modifications of primer design program Primer3. Bioinformatics 23, 1289–1291 (2007).
175. Livak, K. J. & Schmittgen, T. D. Analysis of relative gene expression data using real-time quantitative PCR and the 2-ΔΔCT method. Methods 25, 402–408 (2001).
176. He, S. et al. MicroRNA-encoding long non-coding RNAs. BMC Genomics 9, 1–11 (2008).
177. Liu, X., He, S., Skogerbø, G., Gong, F. & Chen, R. Integrated sequence-structure motifs suffice to identify microrna precursors. PLoS One 7, 1–9 (2012).
178. Lewis, B. P., Burge, C. B. & Bartel, D. P. Conserved seed pairing, often flanked by adenosines, indicates that thousands of human genes are microRNA targets. Cell 120, 15–20 (2005).
179. Carroll, E. J., Murphy, F. A. & Aalund, O. Changes in whey proteins between drying and colostrum formation. J. Dairy Sci. 48, 1246–9 (1965).
180. Bequette, B. J., Kyle, C. E., Crompton, L. A., Anderson, S. E. & Hanigan, M. D. Protein metabolism in lactating goats subjected to the insulin clamp. J. Dairy Sci. 85, 1546–1555 (2002).
181. Rhoads, R. E. & Grudzien-Nogalska, E. Translational regulation of milk protein synthesis at secretory activation. J. Mammary Gland Biol. Neoplasia 12, 283–292 (2007).
182. Chapman, R. S. et al. The role of stat3 in apoptosis and mammary gland involution. in Biology of the Mammary Gland 129–138 (Kluwer Academic Publishers, 2002). doi:10.1007/0-306-46832-8_16
183. Stefanon, B., Colitti, M., Gabai, G., Knight, C. H. & Wilde, C. J. Mammary apoptosis and lactation persistency in dairy animals. J. Dairy Res. 69, 37–52 (2002).

107
184. Zarzynska, J. & Motyl, T. Apoptosis and autophagy in involuting bovine mammary gland. J. Physiol. Pharmacol. 59, 275–288 (2008).
185. Watson, C. J. & Kreuzaler, P. A. Remodeling mechanisms of the mammary gland during involution. Int J Dev Biol 55, 757–762 (2011).
186. Wilusz, J. E., Sunwoo, H. & Spector, D. L. Long noncoding RNAs : functional surprises from the RNA world Long noncoding RNAs : functional surprises from the RNA world. Genes Dev. 23, 1494–1504 (2009).
187. Do, D. N., Li, R., Dudemaine, P. L. & Ibeagha-Awemu, E. M. MicroRNA roles in signalling during lactation: An insight from differential expression, time course and pathway analyses of deep sequence data. Sci. Rep. 7, 1–19 (2017).
188. Li, Z. et al. Comparative Transcriptome Profiling of Dairy Goat MicroRNAs from Dry Period and Peak Lactation Mammary Gland Tissues. PLoS One 7, 1–12 (2012).
189. Wang, H. et al. MiR-145 Regulates Lipogenesis in Goat Mammary Cells Via Targeting INSIG1 and Epigenetic Regulation of Lipid-Related Genes. J. Cell. Physiol. 232, 1030–1040 (2017).
190. Wang, H. et al. MicroRNA-24 can control triacylglycerol synthesis in goat mammary epithelial cells by targeting the fatty acid synthase gene. J. Dairy Sci. 98, 9001–9014 (2015).
191. McDermott, K. M., Liu, B. Y., Tlsty, T. D. & Pazour, G. J. Primary cilia regulate branching morphogenesis during mammary gland development. Curr. Biol. 20, 731–737 (2010).
192. Campisi, J., Leem, T. H. & Fleshner, M. Stress-induced extracellular Hsp72 is a functionally significant danger signal to the immune system. Cell Stress Chaperones 8, 272–286 (2003).
193. Lee, W. C., Wen, H. C., Chang, C. P., Chen, M. Y. & Lin, M. T. Heat shock protein 72 overexpression protects against hyperthermia, circulatory shock, and cerebral ischemia during heatstroke. J. Appl. Physiol. 100, 2073–2082 (2006).
194. Collier, J. Prostaglandins A1 (PGA1) and E1 (PGE1) alter heat shock protein 70 (HSP-70) gene expression in bovine mammary epithelial cells (BMEC). in Journal of Animal Science (2007).
195. Nan, X. et al. Ratio of lysine to methionine alters expression of genes involved in milk protein transcription and translation and mTOR phosphorylation in bovine mammary cells. Physiol. Genomics 46, 268–275 (2014).
196. Bionaz, M. & Loor, J. J. Gene networks driving bovine mammary protein synthesis during the lactation cycle. Bioinform. Biol. Insights 5, 83–98 (2011).

108
197. Bionaz, M. & Loor, J. J. Identification of reference genes for quantitative real-time PCR in the bovine mammary gland during the lactation cycle. Physiol. Genomics 29, 312–319 (2007).

109
BIOGRAPHICAL SKETCH
Bethany M. Dado Senn was born in Lansing, Michigan, USA in 1993 to Rick and
Gwen Dado. In 2000, her family relocated to their family dairy farm, Four Hands
Holsteins, in Amery, Wisconsin, USA where she received her childhood education. She
attended the University of Wisconsin-Madison from August 2012 to May 2016, earning a
Bachelor of Science degree in dairy science and genetics (double major). In July 2016
she moved to Gainesville, Florida, USA to study for the Master of Science degree at the
University of Florida under the supervision of Dr. Jimena Laporta. She studied animal
molecular and cellular biology in the Department of Animal Molecular and Cellular
Biology and earned her degree in Spring 2018.