Vekony & Korneliussen (2016)
165
Norwegian School of Economics Immersive Virtual Reality in Destination Marketing Evidence From Lab and Field Experiments Master Thesis - Marketing and Brand Management David Vekony and Simen Korneliussen Supervised by Siv Skard This thesis was written as a part of the Master of Science in Economics and Business Administration at NHH. Please note that neither the institution nor the examiners are responsible — through the approval of this thesis — for the theories and methods used, or results and conclusions drawn in this work. Bergen, Fall 2016
-
Upload
david-andreas-vekony -
Category
Documents
-
view
59 -
download
1
Transcript of Vekony & Korneliussen (2016)
Norwegian School of Economics
Immersive Virtual Reality in
Destination Marketing
Evidence From Lab and Field Experiments
Master Thesis - Marketing and Brand Management
David Vekony and Simen Korneliussen
Supervised by
Siv Skard
This thesis was written as a part of the Master of Science in Economics and Business
Administration at NHH. Please note that neither the institution nor the examiners are
responsible — through the approval of this thesis — for the theories and methods used, or results
and conclusions drawn in this work.
Bergen, Fall 2016
s116070
Stamp
Abstract
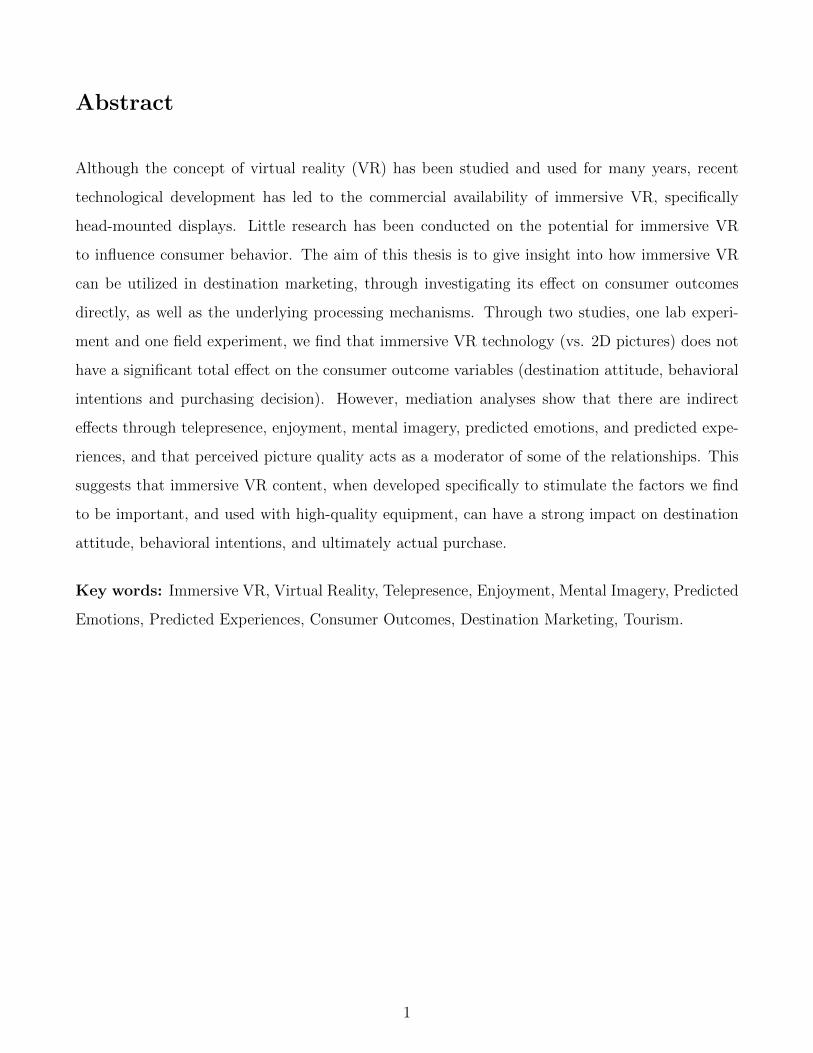
Although the concept of virtual reality (VR) has been studied and used for many years, recent
technological development has led to the commercial availability of immersive VR, specifically
head-mounted displays. Little research has been conducted on the potential for immersive VR
to influence consumer behavior. The aim of this thesis is to give insight into how immersive VR
can be utilized in destination marketing, through investigating its effect on consumer outcomes
directly, as well as the underlying processing mechanisms. Through two studies, one lab experi-
ment and one field experiment, we find that immersive VR technology (vs. 2D pictures) does not
have a significant total effect on the consumer outcome variables (destination attitude, behavioral
intentions and purchasing decision). However, mediation analyses show that there are indirect
effects through telepresence, enjoyment, mental imagery, predicted emotions, and predicted expe-
riences, and that perceived picture quality acts as a moderator of some of the relationships. This
suggests that immersive VR content, when developed specifically to stimulate the factors we find
to be important, and used with high-quality equipment, can have a strong impact on destination
attitude, behavioral intentions, and ultimately actual purchase.
Key words: Immersive VR, Virtual Reality, Telepresence, Enjoyment, Mental Imagery, Predicted
Emotions, Predicted Experiences, Consumer Outcomes, Destination Marketing, Tourism.
1
Acknowledgements
This study is part of our Master’s degrees in Marketing and Brand Management (MBM) at the
Norwegian School of Economics (NHH). After five years of studying business and administration,
this thesis marks the end of our education. Although the research process has been both demanding
and challenging, working with this thesis has been an exciting and rewarding process, and a great
learning opportunity.
We would like to thank Associate Professor at NHH, Siv Skard, for supervising our thesis. Her
guidance and advice has played a crucial part throughout the entire research process. Furthermore,
we would like to thank Associate Professor at NHH, Eirik Sjaholm Knudsen and PhD Candidate,
Hallgeir Sjastad, for valuable input during the planning phase prior to the two experiments and
for excellent feedback and counselling during the end of the writing process. Finally, we would like
to thank Lisbeth Bjerknes and Lisbeth Hjertas at Hurtigruten AS, as well as the staff on board
MS Nordkapp and MS Kong Harald for all the help, and The Center for Service Innovation (CSI)
at NHH for funding the research project.
Bergen, December 2016
David Vekony and Simen Korneliussen
2
Contents
Abstract . . . . . . . . . . . . . . . . . . . . . . . . . . . . . . . . . . . . . . . . . . 1
Acknowledgements . . . . . . . . . . . . . . . . . . . . . . . . . . . . . . . . . . . . 2
1 Introduction 8
1.1 Background . . . . . . . . . . . . . . . . . . . . . . . . . . . . . . . . . . . . . . . . 8
1.2 Purpose . . . . . . . . . . . . . . . . . . . . . . . . . . . . . . . . . . . . . . . . . . 9
1.3 Structure . . . . . . . . . . . . . . . . . . . . . . . . . . . . . . . . . . . . . . . . . 10
2 Literature Review 12
2.1 Literature Search Process . . . . . . . . . . . . . . . . . . . . . . . . . . . . . . . . 12
2.2 Main Focus of Previous Research . . . . . . . . . . . . . . . . . . . . . . . . . . . . 13
2.2.1 The Concept of Telepresence . . . . . . . . . . . . . . . . . . . . . . . . . . . 14
2.2.2 Research on Virtual Reality and Telepresence . . . . . . . . . . . . . . . . . 15
2.2.3 The Consumer Outcomes of Virtual Reality . . . . . . . . . . . . . . . . . . 16
2.2.4 The Indirect Effects of Virtual Reality . . . . . . . . . . . . . . . . . . . . . 18
2.2.5 Summing Up . . . . . . . . . . . . . . . . . . . . . . . . . . . . . . . . . . . 20
2.2.6 Our Contribution to the Literature . . . . . . . . . . . . . . . . . . . . . . . 21
3 Research Model and Hypotheses 25
3.1 Proposed Model . . . . . . . . . . . . . . . . . . . . . . . . . . . . . . . . . . . . . . 25
3.2 Hypotheses . . . . . . . . . . . . . . . . . . . . . . . . . . . . . . . . . . . . . . . . 26
3.2.1 Consumer Outcomes . . . . . . . . . . . . . . . . . . . . . . . . . . . . . . . 26
3.2.2 Telepresence . . . . . . . . . . . . . . . . . . . . . . . . . . . . . . . . . . . . 27
3.2.3 Enjoyment . . . . . . . . . . . . . . . . . . . . . . . . . . . . . . . . . . . . . 28
3.2.4 Mental Imagery . . . . . . . . . . . . . . . . . . . . . . . . . . . . . . . . . . 29
3.2.5 Predicted Emotions and Experiences . . . . . . . . . . . . . . . . . . . . . . 29
4 Study 1 32
4.1 Methodology . . . . . . . . . . . . . . . . . . . . . . . . . . . . . . . . . . . . . . . 32
3
4.1.1 Experimental Design . . . . . . . . . . . . . . . . . . . . . . . . . . . . . . . 32
4.1.2 Participants . . . . . . . . . . . . . . . . . . . . . . . . . . . . . . . . . . . . 33
4.1.3 Stimulus Development . . . . . . . . . . . . . . . . . . . . . . . . . . . . . . 33
4.1.4 Procedure . . . . . . . . . . . . . . . . . . . . . . . . . . . . . . . . . . . . . 35
4.1.5 Measurements . . . . . . . . . . . . . . . . . . . . . . . . . . . . . . . . . . . 41
4.1.6 Data Analysis . . . . . . . . . . . . . . . . . . . . . . . . . . . . . . . . . . . 46
4.2 Results . . . . . . . . . . . . . . . . . . . . . . . . . . . . . . . . . . . . . . . . . . . 47
4.2.1 Test of Assumptions . . . . . . . . . . . . . . . . . . . . . . . . . . . . . . . 47
4.2.2 Test of Main Effects (H1) . . . . . . . . . . . . . . . . . . . . . . . . . . . . 49
4.2.3 Test of Mediation Effects (H2-H7) . . . . . . . . . . . . . . . . . . . . . . . . 50
4.2.4 Summary of Findings . . . . . . . . . . . . . . . . . . . . . . . . . . . . . . . 54
4.3 Discussion and Further Analysis . . . . . . . . . . . . . . . . . . . . . . . . . . . . . 54
4.3.1 Similar Stimuli . . . . . . . . . . . . . . . . . . . . . . . . . . . . . . . . . . 54
4.3.2 The Role of the Mediators . . . . . . . . . . . . . . . . . . . . . . . . . . . . 55
4.3.3 Basis for Further Analyses . . . . . . . . . . . . . . . . . . . . . . . . . . . . 56
4.3.4 Alternative Indirect Effects - Serial Mediation . . . . . . . . . . . . . . . . . 56
4.3.5 Revised Model of Effects . . . . . . . . . . . . . . . . . . . . . . . . . . . . . 59
4.3.6 Discussion of Findings . . . . . . . . . . . . . . . . . . . . . . . . . . . . . . 60
4.3.7 Suggestions for Study 2 . . . . . . . . . . . . . . . . . . . . . . . . . . . . . . 61
5 Study 2 63
5.1 Methodology . . . . . . . . . . . . . . . . . . . . . . . . . . . . . . . . . . . . . . . 64
5.1.1 Experimental Design . . . . . . . . . . . . . . . . . . . . . . . . . . . . . . . 64
5.1.2 Participants . . . . . . . . . . . . . . . . . . . . . . . . . . . . . . . . . . . . 65
5.1.3 Stimuli . . . . . . . . . . . . . . . . . . . . . . . . . . . . . . . . . . . . . . . 65
5.1.4 Procedure . . . . . . . . . . . . . . . . . . . . . . . . . . . . . . . . . . . . . 66
5.1.5 Measurements . . . . . . . . . . . . . . . . . . . . . . . . . . . . . . . . . . . 69
5.1.6 Data Analysis . . . . . . . . . . . . . . . . . . . . . . . . . . . . . . . . . . . 72
5.2 Results . . . . . . . . . . . . . . . . . . . . . . . . . . . . . . . . . . . . . . . . . . . 73
5.2.1 Test of Assumptions . . . . . . . . . . . . . . . . . . . . . . . . . . . . . . . 73
5.2.2 Main Effects . . . . . . . . . . . . . . . . . . . . . . . . . . . . . . . . . . . . 74
4

5.2.3 Other Findings . . . . . . . . . . . . . . . . . . . . . . . . . . . . . . . . . . 77
5.2.4 Summary of Findings . . . . . . . . . . . . . . . . . . . . . . . . . . . . . . . 79
5.3 Discussion of Findings . . . . . . . . . . . . . . . . . . . . . . . . . . . . . . . . . . 80
5.3.1 Changes From T1 to T2 . . . . . . . . . . . . . . . . . . . . . . . . . . . . . 80
5.3.2 Technical Experience . . . . . . . . . . . . . . . . . . . . . . . . . . . . . . . 82
5.3.3 The Role of Perceived Picture Quality . . . . . . . . . . . . . . . . . . . . . 83
6 General Discussion and Conclusion 84
6.1 Discussion of Findings . . . . . . . . . . . . . . . . . . . . . . . . . . . . . . . . . . 84
6.2 Implications . . . . . . . . . . . . . . . . . . . . . . . . . . . . . . . . . . . . . . . . 86
6.2.1 Theoretical Implications . . . . . . . . . . . . . . . . . . . . . . . . . . . . . 86
6.2.2 Managerial Implications . . . . . . . . . . . . . . . . . . . . . . . . . . . . . 88
6.3 Limitations . . . . . . . . . . . . . . . . . . . . . . . . . . . . . . . . . . . . . . . . 90
6.4 Further Research . . . . . . . . . . . . . . . . . . . . . . . . . . . . . . . . . . . . . 92
6.5 Conclusion . . . . . . . . . . . . . . . . . . . . . . . . . . . . . . . . . . . . . . . . . 94
7 References 95
Appendices 101
A Literature Review 103
B Examples of Stimuli, Study 1 and Study 2 106
C Written Material, Study 1 109
D Written Material, Study 2 132
E Factor Analysis and Scale Reliability Check, Study 1 and Study 2 158
F Test of Assumptions, Study 1 and Study 2 162
5
List of Figures
2.1 The construct of telepresence (Steuer 1992) . . . . . . . . . . . . . . . . . . . . . . . 15
3.1 Proposed model of effects . . . . . . . . . . . . . . . . . . . . . . . . . . . . . . . . 25
4.1 Revised model of effects, Telepresence . . . . . . . . . . . . . . . . . . . . . . . . . . 59
4.2 Revised model of effects, Enjoyment . . . . . . . . . . . . . . . . . . . . . . . . . . 59
4.3 Revised model of effects, Mental Imagery . . . . . . . . . . . . . . . . . . . . . . . . 60
B.1 2D Picture of Nærøyfjorden . . . . . . . . . . . . . . . . . . . . . . . . . . . . . . . 106
B.2 2D Picture of Flamsbana . . . . . . . . . . . . . . . . . . . . . . . . . . . . . . . . . 106
B.3 2D Picture of Aurlandsfjorden . . . . . . . . . . . . . . . . . . . . . . . . . . . . . . 107
B.4 2D Picture of Leknes . . . . . . . . . . . . . . . . . . . . . . . . . . . . . . . . . . . 107
B.5 2D Picture of Geirangerfjorden . . . . . . . . . . . . . . . . . . . . . . . . . . . . . 108
B.6 2D Picture of Slogen . . . . . . . . . . . . . . . . . . . . . . . . . . . . . . . . . . . 108
6
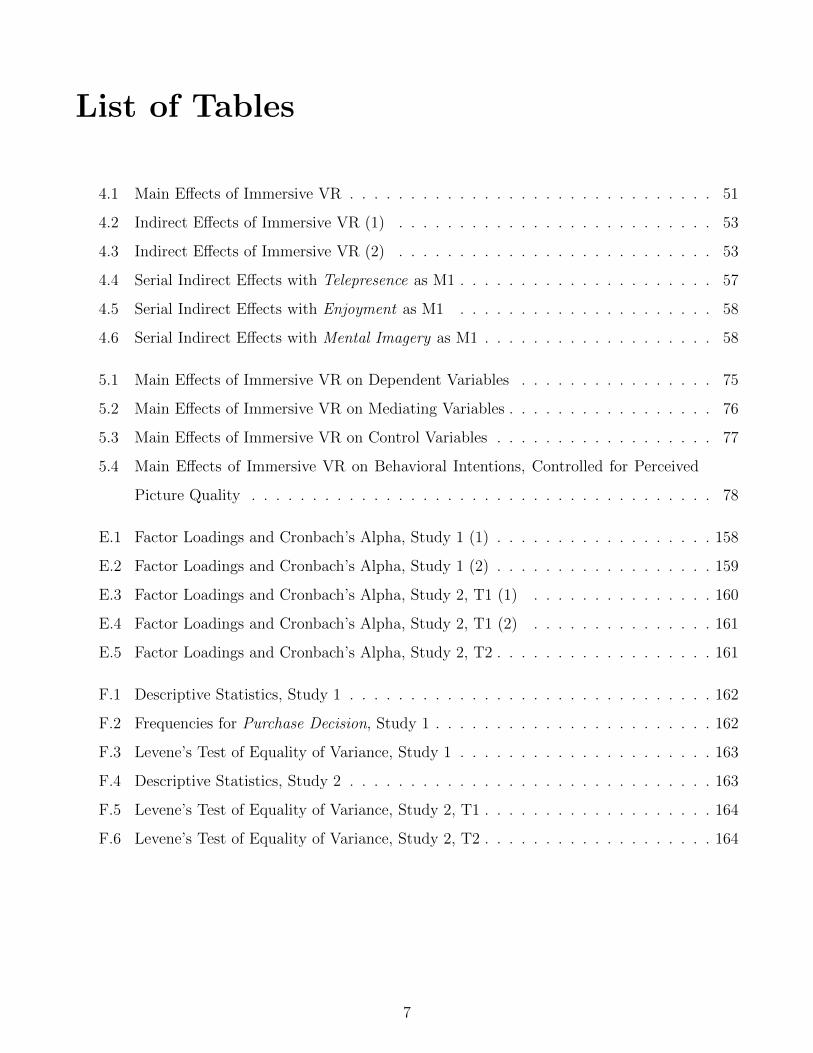
List of Tables
4.1 Main Effects of Immersive VR . . . . . . . . . . . . . . . . . . . . . . . . . . . . . . 51
4.2 Indirect Effects of Immersive VR (1) . . . . . . . . . . . . . . . . . . . . . . . . . . 53
4.3 Indirect Effects of Immersive VR (2) . . . . . . . . . . . . . . . . . . . . . . . . . . 53
4.4 Serial Indirect Effects with Telepresence as M1 . . . . . . . . . . . . . . . . . . . . . 57
4.5 Serial Indirect Effects with Enjoyment as M1 . . . . . . . . . . . . . . . . . . . . . 58
4.6 Serial Indirect Effects with Mental Imagery as M1 . . . . . . . . . . . . . . . . . . . 58
5.1 Main Effects of Immersive VR on Dependent Variables . . . . . . . . . . . . . . . . 75
5.2 Main Effects of Immersive VR on Mediating Variables . . . . . . . . . . . . . . . . . 76
5.3 Main Effects of Immersive VR on Control Variables . . . . . . . . . . . . . . . . . . 77
5.4 Main Effects of Immersive VR on Behavioral Intentions, Controlled for Perceived
Picture Quality . . . . . . . . . . . . . . . . . . . . . . . . . . . . . . . . . . . . . . 78
E.1 Factor Loadings and Cronbach’s Alpha, Study 1 (1) . . . . . . . . . . . . . . . . . . 158
E.2 Factor Loadings and Cronbach’s Alpha, Study 1 (2) . . . . . . . . . . . . . . . . . . 159
E.3 Factor Loadings and Cronbach’s Alpha, Study 2, T1 (1) . . . . . . . . . . . . . . . 160
E.4 Factor Loadings and Cronbach’s Alpha, Study 2, T1 (2) . . . . . . . . . . . . . . . 161
E.5 Factor Loadings and Cronbach’s Alpha, Study 2, T2 . . . . . . . . . . . . . . . . . . 161
F.1 Descriptive Statistics, Study 1 . . . . . . . . . . . . . . . . . . . . . . . . . . . . . . 162
F.2 Frequencies for Purchase Decision, Study 1 . . . . . . . . . . . . . . . . . . . . . . . 162
F.3 Levene’s Test of Equality of Variance, Study 1 . . . . . . . . . . . . . . . . . . . . . 163
F.4 Descriptive Statistics, Study 2 . . . . . . . . . . . . . . . . . . . . . . . . . . . . . . 163
F.5 Levene’s Test of Equality of Variance, Study 2, T1 . . . . . . . . . . . . . . . . . . . 164
F.6 Levene’s Test of Equality of Variance, Study 2, T2 . . . . . . . . . . . . . . . . . . . 164
7

Chapter 1: Introduction
1.1 Background
Technology is becoming an increasingly important part of people’s everyday lives. It’s estimated
that people in the US spend 5,6 hours engaged with digital media every day (Chaffey 2016).
Modern computers and hand held devices such as smart pones and tablets can process enormous
amounts of data and have become an important way for companies to communicate with the
consumers. The proliferation of advanced technologies has led companies to search for new ways
to utilize their potential, and one of the latest trends is the implementation of virtual reality (VR)
in marketing.
Imagine that you want to book a hotel room for your upcoming vacation, but you don’t know
which hotel to choose. They all look the same in the pictures, and you have been unlucky with
your choice of accommodation on several occasions in the past. Imagine that you could put on a
head mounted display that lets you embark on a virtual tour around the hotel facilities, investigate
the different rooms in 3D, and look at the view from the hotel room window. What effect would
this have on your attitudes towards the hotel and your choice of hotels. Furthermore, could this
virtual experience influence how satisfied you will be with your choice after you get back from your
vacation? In order to answer these questions, one needs to understand the concept of VR.
Steuer (1992) argues that virtual reality should be defined in terms of human experiences, and
that the key to do this is the concept of telepresence, which refers to the sense of “being there” in
a computer-mediated environment. Hence, Steuer (1992, p. 7) defines VR as “a real or simulated
environment in which a perceiver experiences telepresence”.
Web-based stores have adapted VR elements by making vivid and interactive VR interfaces that
can generate virtual product experiences, which is defined as “the psychological and emotional
states that consumers undergo while interacting with products in a 3D enivironment” (Dobrowolski
8
et al. 2014, p. 1). Research has shown that virtual experiences with brands positively influence
product knowledge, brand attitudes, and purchasing intentions (Dobrowolski et al. 2014). The
use of VR in tourism and destination marketing has also been studied. Tourism products are
experientially demanding, and experiential product attributes are best evaluated through actual
use of the product (Hyun, S. Lee, and Hu 2009). Traditionally, the most effective information
channels regarding tourism marketing have been word-of-mouth and previous travel experiences,
because they are based on direct experience (Gartner 1994). Since actual product trial of a
tourism product is impossible, a virtual destination experience can provide a substitute for direct
destination experience, because it enables consumers to vividly imagine a destination (W. Lee
and Gretzel 2012). Furthermore, virtual destination experiences can provide potential consumers
with a tool to translate experiential attributes into “objective” evaluation criteria (Cho, Wang,
and Fesenmaier 2002). In addition, Suh and Y. E. Lee (2005) found that VR exposure has more
impact on consumers’ brand attitudes, purchasing intentions, and brand knowledge when used to
promote products who’s most salient attributes are experiential.
The implications are clear – virtual reality in marketing has great potential, and marketers should
learn how to utilize its full potential by understanding the psychological mechanisms involved in
VR exposure of marketing material.
1.2 Purpose
The purpose of this study is to investigate how virtual reality technology can be used as a marketing
tool to promote tourist destinations more effectively than the prevailing tools commonly used today.
In order to make a significant contribution to the literature on VR in marketing and consumer
behavior, this thesis examines how the use of VR influences potential tourists’ attitude towards
destinations, intention to travel and purchasing decision, both directly and indirectly. This means
that it also examines the processing mechanisms behind these relationships. Previous research has
studied how VR can influence consumers in different ways (e.g. Nah, Eschenbrenner, and DeWester
2011), but the impact on the actual purchasing decision is relatively unexplored. Furthermore,
investigating the mediated relationship between VR exposure and consumer outcomes should be
9
of great value to marketers. Virtual reality hardware is now commercially available, and the
technology is advancing rapidly (Terdiman 2016). Hence, a clear understanding of the underlying
effects and processes that occur when exposed to VR could help marketers utilize the full potential
of the technology by uncovering what is important to keep in mind when developing VR related
marketing material. Thus, both study 1 and study 2 were designed to capture as much data
as possible related to potential mediating and moderating variables. Although some of the data
collected in our experiments are concerned with theoretical constructs that are beyond the scope of
this thesis, they can be used in future research, making the data collection a valuable contribution
in in itself.
Moreover, it would be interesting to investigate how the use of VR in marketing can influence
consumers’ predicted emotions and experiences prior to direct product experience, and how this
would affect their actual product experience. Despite the great value of such knowledge, this has
been largely ignored in the literature, and hence, we will examine these relationships. Furthermore,
we will examine how the relationship between immersive VR exposure and consumer outcomes is
mediated by predicted emotions and experiences.
The majority of previous research related to VR in marketing focuses on the use of non-immersive
VR, which refers to a VR experience in which the user is exposed to the virtual environment on a
monitor, meaning that their vision is not completely enclosed in the virtual environment (Mills and
Noyes 1999). In the current study, we will examine how destination attitude, behavioral intentions
and purchasing decision are influenced by immersive VR, which involves the use of a head-mounted
display where the user is completely enclosed in a virtual environment (Mills and Noyes 1999).
1.3 Structure
This master thesis starts with a review of the literature related to VR in marketing and consumer
behavior. We will present the literature search process and identify the main ares of VR related
research. Furthermore, the review will examine what is the main focus of the research by investi-
gating the dependent, independent, and mediating variables commonly studied in the experiments.
10
We will present important findings, in addition to theories related to the underlying mechanisms
and processes involved in the research. This is followed by a discussion of the research field in
order to reveal gaps in the literature. Secondly, the proposed research model and the development
of hypotheses used in this thesis are described. After this, the methodology and findings of study
1 and study 2 are presented and discussed. Finally, a general discussion will present implications
of our findings, the limitations of our research and suggestions for further research in the field of
VR in marketing and consumer behavior.
11

Chapter 2: Literature Review
There is a lot of theory and research related to different aspects of virtual reality (VR). Although
the literature covers a wide range of topics such as the technical aspects of VR hardware, and the
use of this technology in the field of medicine, this review will focus on the use of VR in marketing,
and how this affects consumer behavior. In this context, three major themes emerged repeatedly
throughout the literature reviewed, namely the application and effects of virtual reality in tourism
marketing, virtual product experience, and online shopping. The literature review is summarized
in appendix A.
We start by presenting a short description of the literature search process, followed by an overview
of the main areas of research related to VR in marketing and consumer behavior. In order to gain
insight into the mechanisms and processes involved in VR exposure, we proceed by examining
what is typically the focus of the research. Furthermore, we will investigate the results of relevant
research, before discussing our contribution by uncovering gaps in the existing literature.
2.1 Literature Search Process
In order to get an overview of the literature related to VR in marketing and consumer behavior,
we started out by searching for articles in the Business Source Complete database. Our first
search, which contained the words “Virtual Reality” and “Marketing”, gave 899 results, whereof
266 were peer reviewed. In the second search, we used the words “Virtual Reality” and “Consumer
Behavior”. This gave 94 results, whereof 67 were peer reviewed. Finally we combined the two
previous searches by using the words “Virtual Reality, “Marketing”, and “Consumer Behavior”.
This gave 53 results, and 42 of these were peer reviewed articles. Based on these three searches,
we had a broad overview of the field. We later conducted several more searches with more specific
targets, but they were all based on what we found during the first search session.
12
We proceeded by working through all of the articles that were categorized as Peer Reviewed by
systematically reading the abstracts while taking notes.
2.2 Main Focus of Previous Research
Based on the three first literature searches, we found that the literature related to VR in marketing
and consumer behavior can be divided into three contextual themes: online shopping, virtual prod-
uct experience, and tourism marketing. Out of these, VR related research in the context of online
shopping has received the most attention (Suh and Chang 2006; Tomaseti, Ruiz, and Reynolds
2009; Jin 2009). The effects of implementing VR elements in web-stores, such as interactive and
vivid 3D advertising, are also frequently studied (Li, Daugherty, and Biocca 2002; Suh and Y. E.
Lee 2005; Klein 2003). Furthermore, VR related research in the context of tourism marketing and
virtual product experiences are somewhat overlapping. In tourism marketing, research is often
related to the effects of virtual tours and virtual destinations (Cho, Wang, and Fesenmaier 2002).
Research related to virtual product experiences is more concerned with the effects of virtual prod-
uct trial in VR interfaces and virtual environments (Daugherty, Li, and Biocca 2008; Dobrowolski
et al. 2014). This means that much of the VR related research in both of these contexts is related
to virtual experiences, which can be defined as “a psychological and emotional state consumers un-
dergo while interacting with 3D visual products in a computer-mediated environment” (Daugherty,
Li, and Biocca 2008, p. 570).
Though some of the relevant literature is of a descriptive nature, the vast majority is based upon
experiments. The experimental designs vary, but the most common design is between-subject lab
experiments. This experimental design is suitable to identify and measure direct and indirect
effects of stimuli because it’s conducted in a controlled environment. This means that other
possible explanations can more easily be ruled out, because contamination by extraneous factors
are minimized. Only two of the studies in the literature are based upon immersive VR technology
(Schubert, Friedmann, and Regenbrecht 2001; Ahn and Bailenson 2011), which involves the use
of a head-mounted display (HMD) where the user is completely enclosed in a virtual environment
(Mills and Noyes 1999). This means that most of the relevant research is based upon non-immersive
13

VR technology, which refers to a more limited VR experience in which the user is exposed to the
virtual environment on a monitor, meaning that their vision is not completely enclosed in the
virtual environment.
The context of the research varies, but the mechanisms involved and the dependent variables are
surprisingly similar across the different studies. The majority of the literature is concerned with
how non-immersive VR can influence brand attitudes, behavioral intentions and brand knowledge
both directly and indirectly. The most striking similarity across the literature is that most of the
research is based upon, or integrates, the concept of telepresence.
2.2.1 The Concept of Telepresence
According to Steuer (1992), telepresence can be defined as the sense of “being there” in a mediated
environment. Furthermore, the Transparent Telepresence Research Group defines telepresence as
“the experience or impression of being present at a location remote from one’s own immediate
environment” (Suh and Chang 2006, p. 100). The level of telepresence an individual experiences
when exposed to a virtual reality environment is determined by two major factors, vividness and
interactivity (Steuer 1992).
Vividness refers to a technology’s ability to produce sensory rich mediated environments. In
other words, telepresence is affected by how a mediated environment presents information to the
senses. Furthermore, the vividness of a mediated environment is affected by a number of different
factors, but the two most important ones are sensory breadth and sensory depth. Sensory breadth
commonly refers to the number of sensory dimensions simultaniously presented by a communication
medium (visual, auditory, touch, taste and smell), and sensory depth is defined as “the resolution
within each of these perceptual channels” (Steuer 1992, p. 11).
Interactivity is defined as “the extent to which users can participate in modifying the form and
content of a mediated environment in real-time” (Steuer 1992, p. 14). The level of interactivity
can be examined by three components, namely speed, range, and mapping (Steuer 1992). Speed
refers to the rate at which input can be assimilated into the mediated environment. Real-time
14
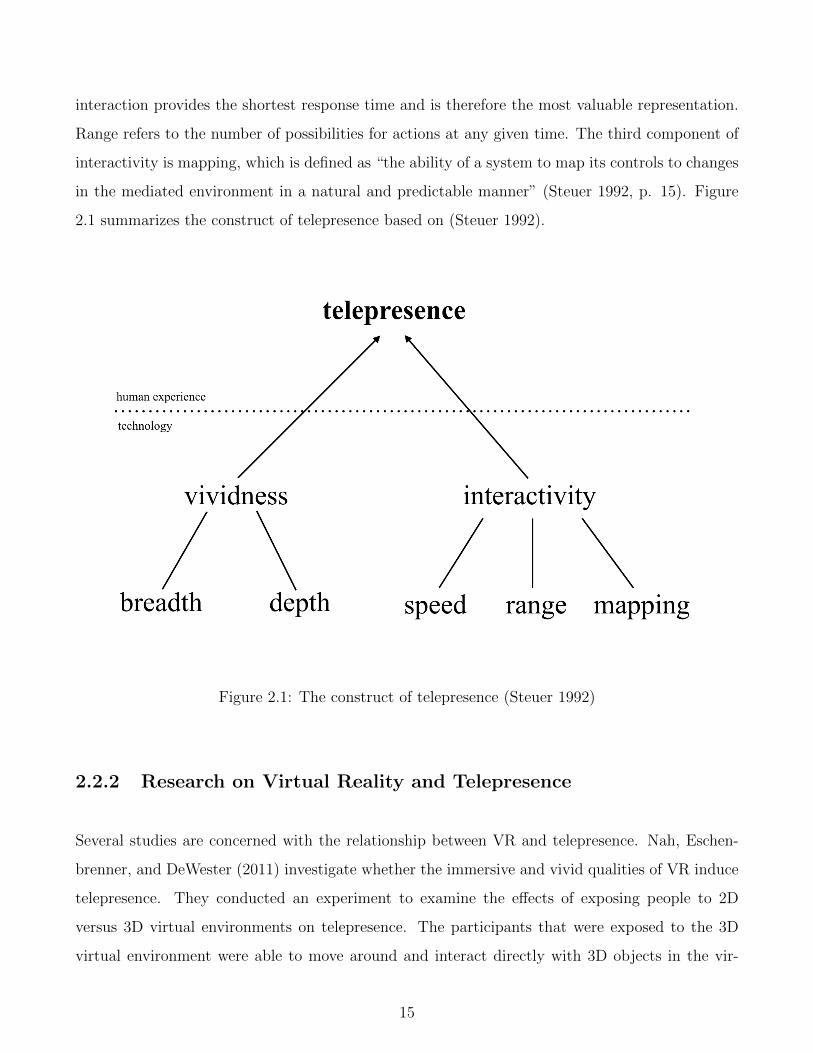
interaction provides the shortest response time and is therefore the most valuable representation.
Range refers to the number of possibilities for actions at any given time. The third component of
interactivity is mapping, which is defined as “the ability of a system to map its controls to changes
in the mediated environment in a natural and predictable manner” (Steuer 1992, p. 15). Figure
2.1 summarizes the construct of telepresence based on (Steuer 1992).
Figure 2.1: The construct of telepresence (Steuer 1992)
2.2.2 Research on Virtual Reality and Telepresence
Several studies are concerned with the relationship between VR and telepresence. Nah, Eschen-
brenner, and DeWester (2011) investigate whether the immersive and vivid qualities of VR induce
telepresence. They conducted an experiment to examine the effects of exposing people to 2D
versus 3D virtual environments on telepresence. The participants that were exposed to the 3D
virtual environment were able to move around and interact directly with 3D objects in the vir-
15
tual environment, whereas the people in the 2D condition were exposed to static pictures of the
same virtual environment. The higher number of sensory inputs and outputs in the 3D virtual
environment made it more vivid and interactive than the 2D environment. Increased vividness
and interactivity in turn led to higher levels of telepresence. Furthermore, Li, Daugherty, and
Biocca (2002) studied the impact of 3D advertising. They found that consumers exposed to a VR
interface, specifically 3D advertising in an online store, experienced higher levels of telepresence
than consumers exposed to 2D advertising of the same product. These findings are in line with
Steuer’s model of telepresence.
The level of telepresence increases when people are engaged with a medium that’s both vivid and
interactive (Suh and Chang 2006). However, previous research related to telepresence proposes that
both vividness and interactivity are necessary to generate high levels of telepresence, meaning that
one of the elements alone is not enough (Klein 2003). Suh and Chang (2006), further investigate
this proposition. By manipulating different features related to interactivity and vividness for a web
interface, they were able to compare a VR interface (highly vivid and interactive) with a highly
vivid (but not interactive) web interface, and a highly interactive (but not vivid) web interface.
They found that the VR interface generated significantly higher levels of telepresence than the two
other web interfaces, which were equal to each other.
2.2.3 The Consumer Outcomes of Virtual Reality
Due to its highly vivid and interactive qualities, virtual reality can be a valuable marketing tool.
The concept of VR has gained a lot of attention in marketing related research, and the most
frequently studied effects are related to how VR can influence consumer outcomes like brand
attitudes, brand knowledge, and purchasing intentions. Furthermore, the indirect effects of VR
on consumer outcomes are frequently investigated in the literature, and the three most important
mediators are telepresence, mental imagery and enjoyment (Suh and Y. E. Lee 2005; Suh and
Chang 2006; Schlosser 2003; Li, Daugherty, and Biocca 2002).
The technological advances of the 21st century make it possible to provide consumers with highly
vivid and interactive 3D images of products, thus facilitating telepresence (Klein 2003; Steuer
16
1992). Li, Daugherty, and Biocca (2002) investigate whether 3D advertising (vivid and interactive)
has a stronger impact on consumers’ brand attitudes, brand knowledge, and purchasing intentions
than 2D advertising (not vivid and interactive). The experiment was based upon a website and
designed as a between-subject lab experiment. Participants exposed to 3D advertising were able
interact with the advertised product by zooming in and out, and moving it in all directions for
detailed inspection. In the 2D condition, participants were exposed to static pictures, meaning
that they were unable to interact with the product. The results were that 3D advertising led to
more positive brand attitudes and product knowledge than did 2D advertising. However, there
were no significant difference in purchasing intention between 2D and 3D advertising.
Suh and Y. E. Lee (2005) also investigate how VR interfaces in online stores influence consumers’
product knowledge, attitudes towards products, and purchasing intentions. Furthermore, the study
examines whether the impact of VR is different for virtually high experiential (VHE) products
than for virtually low experiential (VLE) products. Suh and Y. E. Lee (2005, p. 680-681) define
VHE products as “products whose attributes are mainly virtually experiential” and VLE products
as “products whose salient attributes are not mainly virtually experiential”. They found that
participants exposed to the VR interface reported significantly more positive attitudes towards
the product than those exposed to the static interface. Furthermore, participants also reported
significantly higher scores for both perceived and actual product knowledge in the VR treatment.
These results are in line with previous research (Li, Daugherty, and Biocca 2002). However,
purchasing intentions for VHE products were also significantly higher in the VR treatment. The
same was not true for VLE products. This contradicts the results of Li, Daugherty, and Biocca
(2002). Furthermore, Suh and Y. E. Lee (2005) found that the VR interface more effectively
influenced perceived product knowledge, product attitudes, and purchasing intentions for VHE
products. This implies product type has an important impact on the effectiveness of the interface
designs.
17

2.2.4 The Indirect Effects of Virtual Reality
A lot of studies in the literature are related to the indirect effects of non-immersive VR on brand at-
titudes, product knowledge, and purchasing intentions. In addition to telepresence, two mediating
variables emerge repeatedly in the literature, namely mental imagery and enjoyment.
Mental Imagery
Mental imagery processing is related to high elaboration processing that involves the representation
of nonverbal information in working memory (D. J. MacInnis and Price 1987). Furthermore, K. A.
Lutz and R. J. Lutz (1978, p. 611) define mental imagery processing as “a mental event involving
visualization of a concept or relationship”. Mental imagery theory suggests that when people
mentally imagine something, the mental images are based on previous experiences and/or available
information (W. Lee and Gretzel 2012). Mental images vary in terms of vividness and quality, and
are often an important source of information. Research has shown that mental imagery processing
has the potential to influence consumers decision making process (L. A. Babin and Burns 1997).
Due to the high elaboration processing involved, attitudes that are based on mental imagery tend
to be stronger and more stable, last longer, and be more resistant to persuasion (Petty, Haugtvedt,
and Smith 1995).
According to Gartner (1994), the components of mental images, specifically virtual destination
images, are cognition, affect and conation. Hyun and O’Keefe (2012) argue that the formation of
cognitive images can facilitate the formation of affective images, which in turn influence conation
or the intention to act according to mental images. Furthermore, Hyun and O’Keefe (2012) find
in an study related to mental images and telepresence that there is a direct relationship between
telepresence and conation, and an indirect relationship through cognitive images.
VR related research in the context of tourism marketing suggests that a virtual destination in a 3D
virtual world (3DVW) environment can affect tourists’ trip planning, destination image, and atti-
tudes towards the destination if the 3D virtual world is equipped with the appropriate visualization
components necessary to make the virtual experience interactive and vivid (Williams and Hobson
1995). This means that a virtual tourist destination in a 3DVW environment has the potential to
18
attract real-world tourists, and that the attraction potential of the virtual destination is related to
telepresence. Cho, Wang, and Fesenmaier (2002) point out that virtual destination experiences,
such as virtual tours in a web-mediated virtual environment, make it easier for potential travellers
to efficiently search for information, resulting in increased confidence of expectation and increased
satisfaction with their destination of choice. Virtual destination experiences also provide extensive
and rich information for the consumers, resulting in better quality of their destination image (Cho,
Wang, and Fesenmaier 2002). A strong and recognizable destination image can help potential
travelers to differentiate between different destinations. If the destination image is favorable, it
will have a positive effect on the probability of a destination being chosen (Hyun and O’Keefe
2012).
Enjoyment
Enjoyment is closely related to telepresence. Heeter (1995) found that the users of a virtual
reality system who experienced high levels of telepresence also reported significantly higher levels
of enjoyment. Furthermore, Chen (2006) found that the illusion of “being there” in a virtual
environment can trigger a sense of engagement, which leads to enjoyment. In a study related to
consumers’ intention to shop in a virtual environment, Domina, S.-E. Lee, and MacGillivray (2012)
found that perceived enjoyment positively influenced their shopping intentions. Furthermore,
Pantano and Naccarato (2010) found that an engaging and exciting shopping experience can
positively influence consumers shopping behavior. In addition, studies related to acceptance of new
technologies confirm the significant role that enjoyment plays in influencing the users’ attitudes
and behavioral intentions (Kim, Jin Ma, and J. Park 2009).
Telepresence and enjoyment are also closely related to research on virtual experiences. Dobrowolski
et al. (2014) found that virtual experiences, specifically virtual test drives of cars, had a positive
effect on the consumers’ attitudes towards the car brand if the virtual experience, or test drive,
was perceived as easy. The easy driving condition also scored significantly higher on enjoyment.
Furthermore, Daugherty, Li, and Biocca (2008) found that a virtual product experience, namely
being able to interact with a 3D product in a website, exceeded indirect product experiences (mag-
azine ad) in affecting brand knowledge, attitudes and purchasing intentions. The virtual product
experience also worked well together with both direct and indirect product experiences, when the
19
exposure happened in the right order. The brand knowledge was highest when a direct product
experience was followed by the virtual one, whereas the brand attitudes and intentions where most
favorable when the virtual product experience was followed by a direct product experience. How-
ever, for the virtual product experience to lead to real world purchasing intentions, there needs to
be channel congruence, which directly affects purchasing intentions, but is also mediated through
brand attitudes (Gabisch and Gwebu 2011).
Huang et al. (2016) investigate the effects of offering potential travellers the opportunity to visit and
explore tourist destinations in the 3DVW environment. The study examines how perceived ease
of use and usefulness influence potential travellers’ enjoyment of visiting the virtual destination,
and their behavioral intentions related to visiting the destination in real life. They found that
perceived ease of use and usefulness of the 3DVW environment positively influenced the potential
travellers’ experience of enjoyment and their behavioral intentions to visit the destination in real
life. This indicates that enjoyment has a mediating effect on the relationship between the use of
VR interfaces and behavioral intentions.
2.2.5 Summing Up
This review reveals that literature and research related to virtual reality in marketing and con-
sumer behavior can be divided into three contextual themes, namely online shopping, virtual
experiences, and tourism marketing. Studies have established that VR can facilitate telepresence
due to its vivid and interactive qualities. Vivid and interactive websites, online stores, virtual des-
tinations, virtual product experiences, and virtual tours have been shown to have a positive effect
on brand/destination attitudes, and brand knowledge. The impact of VR on purchasing intention
has yielded contradicting results in the literature. However, research suggests that VR positively
influences purchasing intentions for VHE products (Suh and Chang 2006). Some of the research
investigates how VR can influence behavior, but most of these are theoretical and descriptive.
Whether or not VR can influence purchasing behavior is relatively unexplored in the literature.
Several mediators have been shown to impact the relationship between VR and consumer outcomes.
The most frequently studied is the mediating effect of telepresence, closely followed by enjoyment
20

and mental imagery.
In summary, we see that VR can have a significant impact on brand knowledge, brand attitudes
and purchasing intention, through many different mediators. This goes to show that there are
many ways to influence consumers through the implementation of VR elements in marketing, and
makes it interesting to explore which are the most efficient.
2.2.6 Our Contribution to the Literature
In the previous sections, we have examined the relevant literature related to VR in marketing and
consumer behavior. We have investigated the findings and gained insight into some of the under-
lying mechanisms that make VR such a valuable marketing tool. Several studies have established
that the use of VR in marketing can influence consumers’ attitudes towards brands, purchasing
intentions, and brand knowledge. However, apart from the mediating effects of mental imagery,
enjoyment, and telepresence, the indirect effects and the processing mechanisms involved in the
use of VR in marketing are relatively unknown. Furthermore, the effect VR exposure has on actual
purchasing decision is also fairly unexplored. This implies that there are some gaps in the existing
literature. In order to make a significant contribution to the literature we will investigate these
gaps.
Our study investigates the effects of using immersive VR in tourism and destination marketing.
Tourism products are experientially demanding, meaning that they are evaluated based on their
experiential attributes. The best way to evaluate products whose attributes are mainly experiential,
such as a tourist destination, is by actually going there (Hyun, S. Lee, and Hu 2009). Suh and Y. E.
Lee (2005) found that VR exposure has more impact on consumers’ brand attitudes, purchasing
intentions, and brand knowledge when used to promote products who’s most salient attributes are
experiential. Furthermore, the affective dimension of a tourism product, meaning the feelings that
are generated by visiting a destination, is an important part of how tourists evaluate their vacation
after visiting a tourist destination (Sanchez et al. 2006). This implies that consumers’ predicted
emotions (affective forecasts) could play a vital role when deciding where to travel. Affective
forecasting (or predicted emotions) theory has not been granted much attention in the literature.
21
Considering the high relevance of affective forecasts in consumer behavior and marketing, this is
somewhat surprising.
Affective forecasting can be defined as the prediction of one’s emotional state (affect) in the future
(V. M. Patrick and D. J. MacInnis 2006). Research suggests that affective forecasts influence
consumers’ decision making process (V. M. Patrick and D. J. MacInnis 2006). Furthermore,
affective forecasts can be a predictor of choice because people often make decisions based on the
affect they think will arise from a specific choice (V. M. Patrick and D. J. MacInnis 2006). Affective
forecasting involves that people mentally imagine a future event and their affective response to this
event (D. J. MacInnis and Price 1987). D. J. MacInnis (1987) Argues that affective forecasts may
be influenced by peoples individual ability to generate mental images. Seeing as how VR can aid the
formation of mental images, affective forecasting theory is highly relevant for VR related research.
By investigating how the relationship between immersive VR exposure and consumer outcomes
is mediated by affective forecasts (predicted emotions), we provide a valuable contribution to the
literature. Moreover, we will examine whether immersive VR can influence how tourists evaluate
their actual emotions after experiencing a destination in real life.
The rationale behind affective forecasting theory can also be applied to predicted experiences. If
affective forecasts have the ability to influence choice (V. M. Patrick and D. J. MacInnis 2006),
the same should be true for other dimensions of predicted experiences. Every choice we make
is, to a varying degree, based on the expected outcomes of that choice. For example, standard
economic theory involves that people choose the alternative that yields the highest predicted
value (DellaVigna 2009). A student chooses to prepare for an exam because he predicts that this
will result in a better grade. When a tourist predicts that a certain destination will result in a
better vacation (experience) than another destination, it’s natural to assume that this prediction
influences his choice of destination.
Predicted experiences are also related to emotions, in that one of the four dimensions of brand
experiences presented by Brakus, Schmitt, and Zarantonello (2009) is the affective dimension.
The other dimensions are the sensory, intellectual and behavioral dimensions. However, none of
these focus on specific emotions or thoughts, but rather the valence of the different dimensions,
meaning to what degree the consumer experiences emotions, thoughts etc.. Seeing as how tourism
22
products are experiential goods, it’s interesting not only to look at predicted emotions, but also
include other experience dimensions. Product experiences can be direct or indirect. A direct
product experience refers to actual consumption of a product. An indirect product experience,
however, refers to how consumers experience products through advertising, commercials and other
marketing material (Brakus, Schmitt, and Zarantonello 2009). Thus, indirect product experiences
can provide consumers with information that helps them predict direct product experiences. For
example, seeing a commercial that shows the softness of a bed sheet (indirect product experience)
can help consumers predict the actual softness of the bed sheet. VR technology can provide
indirect product experiences in the form of vivid and interactive marketing material that simulates
direct product experiences. This is referred to as virtual product experience (Daugherty, Li, and
Biocca 2008). We contribute to the literature by investigating how immersive VR exposure of a
tourist destination affects travellers predicted experiences of actually going there. Furthermore,
we examine how immersive VR affects their actual experience with the destination. I addition, we
will investigate whether predicted experiences have a mediating effect on the relationship between
immersive VR exposure and the consumer outcomes.
Previous studies related to VR in marketing and consumer behavior have firmly established that
VR leads to telepresence because of its vivid and interactive qualities. Furthermore, the use of VR
in marketing can influence consumers’ attitudes towards brands, behavioral intentions and brand
knowledge both directly and indirectly. As previously stated, most of the existing literature is
concerned with how non-immersive VR affects consumer outcomes. However, the technological
advances of the 21st century have given rise to the commercial availability of VR hardware such as
head-mounted displays. We contribute to the literature by investigating the effects of this new and
advanced technology on consumer outcomes. Furthermore, most previous research investigates
the consumer outcomes of VR by comparing highly interactive and vivid 3D material with static
pictures, or traditional print media. In recent years however, handheld devices such as smartphones
and tablets have become one of the main marketing channels for many companies (Chaffey 2016).
These devices are capable of delivering ads in the form of high quality pictures. Even though
these pictures may be static, users can easily switch between them, zoom in and out on them and
manipulate them by changing colors, contrast, brightness etc.. From a marketing perspective it is
therefore valuable to gain insight into how immersive VR compares to these technologies in terms
23

of influencing brand attitudes, brand knowledge, and behavioral intentions.
In relation to this, one of our most important contributions to the literature is that, unlike most
research related to VR in marketing, we not only investigate how VR influences consumers’ be-
havioral intentions, but also how it affects the actual purchasing decision. With little research on
whether behavioral intentions actually lead to actions in the relevant literature, it’s important to
investigate this as well, as the relationship should not be taken for granted.
Finally, most of the relevant studies are based upon lab experiments, thus ensuring the internal
validity of the results. However, this often comes at the cost of external validity, because the
mechanisms aren’t studied in a real-life environment, with a sample representative of the entire
relevant population. In order to ensure a more accurate representation of how VR can influences
the consumer outcomes, we will conduct both a lab experiment and a field experiment.
24
Chapter 3: Research Model and
Hypotheses
In this section we will present the proposed research model and hypotheses we will use to answer
our research question, which is derived from the main purpose of this study. Our research question
is as follows:
RQ: How does the use of immersive VR in destination marketing affect consumers’ destination
attitude, behavioral intentions, and purchasing decision, and what are the mechanisms involved in
this process?
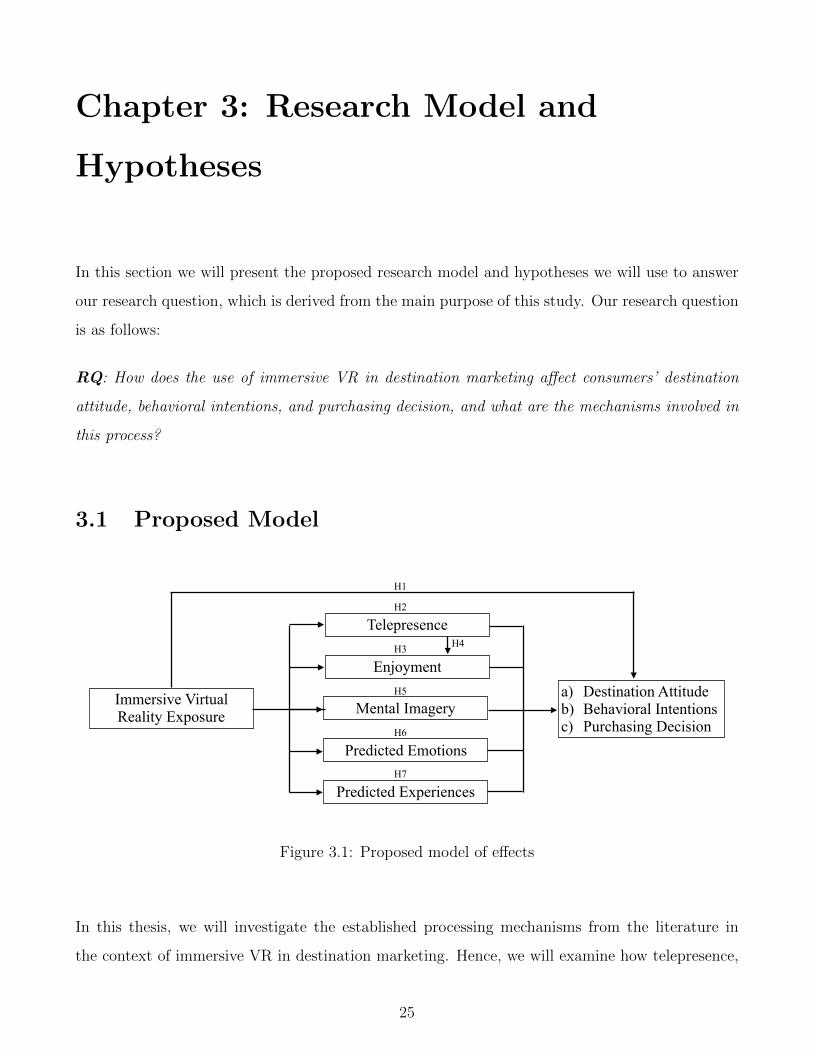
3.1 Proposed Model
Telepresence
Mental Imagery
Predicted Emotions
Enjoyment
Predicted Experiences
a) Destination Attitude b) Behavioral Intentions c) Purchasing Decision
H1
H2
H7
H6
H3
H5
H4
Immersive Virtual Reality Exposure
Figure 3.1: Proposed model of effects
In this thesis, we will investigate the established processing mechanisms from the literature in
the context of immersive VR in destination marketing. Hence, we will examine how telepresence,
25
mental imagery and enjoyment affect the relationship between immersive VR and the consumer
outcomes stated in the research question. In addition, we will look into two new processing
mechanisms, not previously investigated, namely predicted emotions and predicted experiences.
Figure 3.1 is a visual representation of our hypotheses, aiming to investigate the aforementioned
relationships. It shows the hypothesized effects from the independent variable on the dependent
variables, both directly and indirectly through five mediators. We propose that exposure to im-
mersive VR will have a positive influence on the consumer outcomes a) destination attitude, b)
behavioral intentions and c) purchasing decision. We believe this effect to be direct, as well as
mediated through telepresence, mental imagery, enjoyment, predicted emotions and predicted ex-
periences. Furthermore, we propose that the effect of immersive VR exposure on the consumer
outcomes is serially mediated, first through telepresence, followed by enjoyment.
3.2 Hypotheses
In order to answer our research question, we propose seven hypotheses. The first hypothesis
(H1) aims to test the direct effects of immersive VR exposure on destination attitude, behavioral
intentions, and purchasing decision, which will be referred to as consumer outcomes. The following
six hypotheses (H2-H7) are related to the second part of our decision problem, namely how the
relationship between immersive VR exposure and consumer outcomes is mediated.
With these seven hypotheses, we should be able to answer our decision problem, and get new
insight into the use of immersive VR in marketing.
3.2.1 Consumer Outcomes
As previously mentioned, consumer outcomes refers to our three dependent variables, namely
destination attitude, behavioral intentions and purchasing decision.
Previous research related to virtual reality has established that different types of virtual experiences
26
can lead to more favorable brand attitudes and purchasing intentions (e.g. Nah, Eschenbrenner,
and DeWester 2011; Li, Daugherty, and Biocca 2002; Suh and Y. E. Lee 2005). Though most of
this research is related to the exposure of non-immersive VR, the results should be similar when
exposed to immersive VR. This is because both immersive and non-immersive VR technology is
able to provide vividness and interactivity, which are the two main components of a successful
virtual experience (Steuer 1992).
We will investigate how the use of immersive VR technology, specifically a head-mounted display
(HMD), fits into the already established literature. Specifically we want to look at how a tourist
destination can be promoted using this technology. Because of the high levels of interactivity
and vividness we expect to achieve with the immersive VR headset, there is reason to believe
that the findings will be in line with previous research, namely that VR exposure positively influ-
ences attitudes towards the destination and behavioral intentions. Seeing as how immersive VR
exposure could potentially facilitate an even more vivid and interactive virtual experience than
non-immersive VR exposure, we believe that using a head-mounted display could also lead to an
increase in actual purchasing decision, not only purchasing intention.
This leads us to our first hypothesis:
H1: Immersive VR exposure of tourist destinations will have a positive
impact on a) destination attitude, b) behavioral intentions
and c) purchasing decision compared with 2D exposure.
3.2.2 Telepresence
Research has firmly established that vivid and interactive VR exposure, such as virtual experiences
and virtual tours, can induce telepresence (Hyun and O’Keefe 2012; Li, Daugherty, and Biocca
2002; Nah, Eschenbrenner, and DeWester 2011). Furthermore, telepresence, or the sense of “being
there” in a virtual environment, can influence both brand attitudes and behavioral intentions
(Cho, Wang, and Fesenmaier 2002). The mediating effect of telepresence has been investigated
in previous research, but with varying results. Nevertheless, telepresence is commonly believed to
27

have a mediating effect on the relationship between VR exposure on one side, and brand attitudes
and behavioral intentions on the other (Hyun and O’Keefe 2012).
Telepresence as a mediator between VR exposure and purchasing decision is relatively unexplored.
One reason for this may be the increased complexity of conducting an experiment on actual decision
making compared to attitudes and intentions. Alternately, the mediating role of telepresence on
the relationship between VR exposure and decision making, might simply be taken for granted.
Nevertheless, there is a logical connection between purchasing intention and purchasing decision.
We therefore hypothesize the following:
H2: The impact of immersive VR exposure on a) destination attitude, b) behavioral
intentions, and c) purchasing decision is mediated by telepresence.
3.2.3 Enjoyment
According to Huang et al. (2016), the construct of perceived enjoyment is useful to understand
users experience when exposed to computer-mediated virtual environments. Venkatesh (2000, p.
351) defines perceived enjoyment as “the extent to which the activity of using a specific system
is perceived to be enjoyable in its own right, aside from any performance consequence resulting
from system use”. Domina, S.-E. Lee, and MacGillivray (2012) found that perceived enjoyment
positively influenced consumers’ intention to shop in a virtual environment. Therefore, it’s natu-
ral to believe that immersive VR exposure indirectly influences the consumer outcomes through
enjoyment. Thus, we hypothesize the following.
H3: The impact of immersive VR exposure on a) destination attitude, b) behavioral
intentions, and c) purchasing decision is mediated by enjoyment.
Telepresence and Enjoyment
Lombard and Ditton (1997) argue that telepresence can be considered as a psychological process
where enjoyment is one of the outcomes. Seeing as how a vivid and interactive VR experience in-
duces telepresence (Nah, Eschenbrenner, and DeWester 2011), we hypothesize that the relationship
28
between immersive VR exposure and consumer outcomes is serially mediated through telepresence,
followed by enjoyment.
H4: The impact of immersive VR exposure on a) destination attitude,
b) behavioral intentions, and c) purchasing decision is serially
mediated through telepresence (M1), followed by enjoyment (M2).
3.2.4 Mental Imagery
When mental imagery is encouraged through vivid product information, it significantly influences
consumers attitudes towards the brand (McGill and Anand 1989). Furthermore, research has
shown that attitudes that are formed based on mental imagery processing tend to be stronger,
more stable, and more resistant (Petty, Haugtvedt, and Smith 1995). It has also been shown
in previous research that mental imagery processing can influence consumers’ decision making
process (L. A. Babin and Burns 1997). Immersive VR technology is able to provide vivid and
interactive virtual experiences such as virtual tours, virtual destinations and virtual product trial,
thus facilitating mental imagery processing for consumers. We therefore hypothesize the following:
H5: The impact of immersive VR exposure on a) destination attitude, b) behavioral
intentions, and c) purchasing decision is mediated by mental imagery.
3.2.5 Predicted Emotions and Experiences
According to D. J. MacInnis, V. M. Patrick, and C. W. Park (2006), predicted emotions (affective
forecasts) can be a predictor of choice. Furthermore, predicted emotions involves that people
mentally imagine a future event and their affective response to this event. It’s fair to assume that
there is causality between anticipating positive emotions in experiencing a tourist destination,
and positive attitudes and intentions to travel to the destination, which again could lead to a
purchasing decision (Gilbert, Gill, and Wilson 2002; Hsee and Hastie 2006).
29

V. Patrick and D. MacInnis (2003) find in their study that people tend to overestimate their
predicted emotions when they focus only on one specific event, in this case the vacation they
were supposed to imagine. Participants who also considered the consequences of going on the
vacation, had more accurate predictions. This is consistent with the results of Wilson et al.
(2000), who find that making subjects think about how much time they would spend on other
future activities, makes predictions about one specific event more accurate. Since the marketing
material we will expose our subjects to focuses on beautiful nature, we believe that the more
immersive VR condition will make people focus less on consequences of going on this trip than the
less immersive 2D condition will, and that they will therefore anticipate more positive emotions in
the immersive VR condition.
Thus, the vivid and interactive qualities of immersive VR may help facilitate peoples predicted
emotions, and this way, influence their attitudes towards the destination, intentions to travel, and
purchasing decision. These findings are the basis of our sixth hypothesis:
H6: The impact of immersive VR exposure on a) destination attitude, b) behavioral
intentions, and c) purchasing decision is mediated by predicted emotions.
Predicted experiences are similar to predicted emotions in that both are related to a prediction of
the future. However, predicted experiences also include other experiential dimensions in addition
to emotions. According to Brakus, Schmitt, and Zarantonello (2009), a product experience, or
in our case a destination experience involves sensory, intellectual, and behavioral dimensions in
addition to affect. These dimensions do not focus on specific emotions or thoughts, but rather to
what extent people experience emotions, thoughts etc.. Furthermore, this implies that product
experiences don’t measure whether the affective, sensory, intellectual and behavioral experiences
are positive or negative. However, in the context of our study, we believe that the participants
predicted experiences will be positive because they are exposed to immersive VR material of
beautiful Norwegian nature. Brakus, Schmitt, and Zarantonello (2009) also find in their study
that consumer satisfaction and loyalty are positively affected by brand experiences.
We will focus on the affective, sensory and intellectual dimensions in our research. The behavioral
dimension is not as relevant for our type of product, seeing as how this would concern itself with
30
which specific activities travelers will do on the trip, not the view of the destination itself. The
construct of predicted experiences will thus consist of the first three dimensions, although it is
referred to simply as predicted experiences when this is possible.
Product experiences don’t only have to be direct, in the form of actually consuming the product,
but can also be indirect, in the form of advertising and other marketing material (Brakus, Schmitt,
and Zarantonello 2009). This means that the participants in our study should be able to use the
experience they are having while being exposed to the destinations to predict how the experience
would be if they actually traveled to the destinations. Seeing as how telepresence should be higher
with a more interactive and vivid medium (Steuer 1992), we also believe that the immersive VR
condition will lead to a higher degree of predicted experiences, making this a mediator for the
impact of immersive VR exposure on consumer outcomes. This is also in line with the findings
of Daugherty, Li, and Biocca (2008), who state that virtual product experiences are better than
other indirect product experiences when it comes to influencing consumer attitudes and intentions.
Hence, we hypothesize the following:
H7: The impact of immersive VR exposure on a) destination attitude, b) behavioral
intentions, and c) purchasing decision is mediated by predicted experiences.
31
Chapter 4: Study 1
Study 1 was designed to test the proposed research hypotheses. In order to do this, a five day lab
experiment was conducted at The Norwegian School of Economics (NHH) in September 2016. A
team of four researchers were responsible for conducting the experiment, with the counsel of two
associate professors and a PhD candidate at NHH.
4.1 Methodology
4.1.1 Experimental Design
The experiment was designed as a between-subject lab experiment. This experimental design is
suitable to identify and measure direct and indirect effects of stimuli because it’s conducted in a
controlled environment. This means that other possible explanations can more easily be ruled out,
because contamination by extraneous factors is minimized.
The independent variable used was exposure to pictures of destinations either on a smartphone
screen in 2D, or with an immersive VR headset in 3D. The dependent variables were destination
attitude, behavioral intentions and purchasing decision.
The participants were randomly assigned to the different experimental conditions. The experiment
sessions started with a briefing, followed by the exposure. After that, the participants filled out a
questionnaire, and were in turn offered to buy tickets to the destinations they had been exposed
to at a discounted price. Finally, they were debriefed. The details of the experimental procedure
will be covered later in this section.
32
4.1.2 Participants
In total, 136 subjects took part in the experiment. All participants were students at The Norwegian
School of Economics (NHH). As the experiment was carried out in Norwegian, all the participants
were either Norwegian or Norwegian speakers. There were both master students and bachelor
students, with a majority being bachelor students.
33 observations were omitted from the final data, changing the number of observations from n =
136 to n = 103. There were two reasons for doing this. First, the order of the pictures shown
to the participants in the 2D condition was changed temporarily, halfway through conducting the
experiment. The order was changed back the same day, but seeing as how we could not be certain
that this didn’t have any impact on how the participants reacted, we had to omit these observations.
Second, because of illness among the experimenters the same day, some of the participants had
to wait around 10-15 minutes before they could take part in the experiment, seeing as how three
experimenters had to handle four participants at times. There is a possibility that having to wait
could have affected the participants’ mood, changing how they reacted to the pictures they were
shown. For this reason, all observations that day were omitted from the data.
4.1.3 Stimulus Development
The two different stimuli, namely 2D versus immersive VR exposure of the tourist destination,
had to satisfy three important criteria. First, since the study aims to investigate the effect of
using an immersive VR experience in destination marketing, the stimulus in the treatment group
had to provide this. Second, the two stimuli had to be as similar as possible, except for the one
difference that we were testing the effects of. Third, the stimulus used in the control group had
to be a realistic representation of the actual alternative to the stimulus in the treatment group.
This means that the stimulus in the control group had to be representative of what is actually
used to view advertisements today. This last criterion serves as a way to make the findings in
the experiment more applicable to the real world, which increases the external validity of the
experiment.
33
We decided to use the Samsung Gear VR headset as the stimulus in the treatment group, and
the Samsung Galaxy S7 edge smart phone as the stimulus in the control group. Together, these
devices satisfy all the criteria mentioned. Samsung Gear VR is a mobile immersive VR headset,
that let’s users see vivid 3D images. It also provides interactivity, by enabling them to maneuver
freely in the virtual environment, by moving their heads in all directions. Samsung Gear VR uses
a Samsung smart phone as the screen, and optic lenses to create the 3D effect (Samsung n.d.(b)).
Thus, it works well to create an immersive VR experience, stated in the first criterion. Samsung
Galaxy S7 edge is a smartphone with a 5,5 inch screen, stretching to the very edges on the side of
the phone, whereas the Samsung Galaxy S7 has a 5,1 inch screen, without these edges (Samsung
n.d.(a)). We used a Samsung Galaxy S7 in the VR headset in the treatment group, and a Samsung
Galaxy S7 edge in the control group. The reason that we didn’t use the exact same model was
simply that the phones that Samsung lent us were different from the ones we had bought, but as
they were only different versions of the same model, we didn’t see this as a problem. Seeing as
how we used almost the same phone in the VR headset and in the control group, the vividness and
interactivity of the VR headset were the only real equipment differences between the two groups,
satisfying the second criterion. When it comes to the third criterion, this was also satisfied by
using the Samsung Galaxy S7 edge in the control group, as this is a popular phone, and because
many ads are now viewed on a smart phone (Mawston 2016; Blair 2016).
The pictures shown to the participants also had to meet these three criteria. In the treatment
group, we used pictures produced by Making View, a company that produces 360 degree pictures
and videos, which can be used with a VR headset (Making View n.d.). There were three 360-
pictures, each depicting a destination in Western Norway, specifically Nærøyfjorden, Flamsbana
and Aurlandsfjorden. These destinations are all part of the same day-trip called Norway In A
Nutshell, organized by Fjordtours (Fjordtours n.d.). As these pictures were marketing material
for the trip, and could be viewed with the immersive VR headset, the first criterion was satisfied.
Using these pictures also made it possible to connect the exposure to the purchasing decision, as
participants were later given the opportunity to buy tickets for the Norway In A Nutshell-trip.
For the control group, we needed to convert these 360-pictures into regular pictures. We divided
them into three pictures each, that combined showed the same main motives as the 360-pictures.
This way both the second and third criteria were also satisfied. For examples of the pictures used
34

in the experiment, see appendix B.
4.1.4 Procedure
In this section, we describe the procedure of conducting the experiment in study 1. In order to
make the experiment replicable, every step will be described in detail. Furthermore, we will explain
the reasoning behind the different measures that were taken, as this pertains to the internal validity
of the experiment.
Price Pretest
In order to avoid any floor- or ceiling effects, we conducted a pretest to ensure the right price level
for the offer to purchase tickets. We used a convenience sample consisting of master students at
NHH, who answered a short survey, where they were asked if they were willing to buy tickets for
the Norway In A Nutshell-trip at different price levels. The survey contained information regarding
the original price, which was NOK 1.320 for one ticket and NOK 2.640 for two tickets. Based on
the results from the pretest, we set the price to NOK 440 for one ticket and NOK 880 for two
tickets as the discounted price in the experiment.
In order to prevent that the validity of the experiment was contaminated by pre-experimental
knowledge, the people who participated in the pretest were not allowed to take part in the actual
experiment.
Test of Equipment and Rehearsal
It was also important to test the equipment prior to the experiment, in order to prevent any
technical difficulties during the experiment sessions. In addition, we had to adjust and rehearse
our experiment manuscript, so that we were certain not to say anything that could influence
the results or lead to any significant differences in how the four experimenters conducted the
sessions. Furthermore, this would also minimize the occurrence of any differences between how the
experiment was conducted at the beginning and end of the week, because of practice.
35
The tests were conducted with employees at The Department of Strategy and Management, at
NHH. Practicing with the equipment also gave us a chance to calibrate the scales between the
experimenters, reporting how much the participants moved and talked, and how enthusiastic they
were. Hence, we ensured that the reporting would be similar across all experimenters.
Recruitment
To recruit participants we wrote an invitation (see appendix C.1) explaining the general topic of the
experiment, without giving away information that could prime the subjects, like specifically what
we were testing. The invitation was first distributed on the internal web pages for two different
courses at NHH, where every student participating in that course would see it. In addition, a short
presentation was given during a lecture in both courses, inviting participants. Seeing as how this
only reached out to a small part of the students, we also collaborated with the administration at
NHH, to send an e-mail with the invitation to every student at NHH. Several reasons were given
as incentives for students to take part in the study, like the fact that they would help the research
and teaching at NHH, among others. In addition, the students were informed that participants
could take part in a draw, where the prize was two universal gift certificates that could be used in
stores all over Bergen, with a value of NOK 3000 each. Seeing as how most students have restricted
financial budgets, NOK 3000 should be enough to serve as an incentive. It should also counteract
any selection bias, because it makes the experiment appealing to those who weren’t intrinsically
motivated to participate as well, and the fact that they are universal gift certificates make them
equally appealing to everyone.
Students who wanted to take part in the study could register in a system designed for experiment
registration, called Expmotor. With this system, they were able to see a list of available time slots,
and could easily select a day and time that worked for them, during the five days we conducted
the experiment. They would then receive an e-mail telling them to confirm by clicking on a link,
at which point they would receive a final e-mail with the time and place the experiment would
take place. Seeing as how we were four experimenters conducting the experiment, there were also
four participant spots in each time slot. The experimenters could see a list of participants at the
different times, but the participants themselves could only see how many of the four available spots
in each time slot were filled. After a time slot was completely filled, that option disappeared from
36
the registration form, so there was no possibility of double booking.
After some of the registered participants didn’t show up the first day, we started sending out text
messages to all the participants who were scheduled the following day, reminding them of their
appointment. This was repeated every day, which led to an increase in the attendance rate from
day one.
Randomization
In order to ensure that the participants were randomly assigned to either the immersive VR
condition or the 2D condition, they were instructed to choose one of four cards. Each of these cards
contained a number (1-4) written on the back, and the participants were guided to the room with
the corresponding number. Due to the fact that the four rooms were not identical, we made sure
that the “atmosphere” of each room did not affect the results, by switching the condition conducted
in that room daily. This means that if a room was assigned to the immersive VR condition one
day, it would be assigned to the 2D condition the following day. Furthermore, we also switched
condition for the experimenters each day. This way we ensured that the experimenters personality
and the “atmosphere” of the rooms did not systematically affect the result, thus strengthening
the internal validity of the experiment. Exceptions to the randomization were made only if a
particular participant knew one of the experimenters personally. That experimenter would then
remove his number from the draw, and the participant would be randomly assigned to one of the
other experimenters. Each experimenter had approximately the same number of sessions in each
room and with each condition. By randomizing the participants, any observable and unobservable
differences between the two conditions should be eliminated, meaning that the only difference was
the treatment the participants received. This gives us the opportunity to prove causal effects,
instead of just correlations.
Anonymization
In a study like ours, where the participants need to be face to face with the experimenter, some
participants might feel that the experiment isn’t completely anonymous. This is hard to counteract,
but because the problem applies to the participants in both conditions, it shouldn’t change the
37

results between the two conditions. The recruitment system, with which the participants could
sign up for the experiment, did only contain information about available time slots, meaning that
participants were unable to see who else had signed up. Information, such as name, telephone
number, email address, and scheduled time could only be seen by the experimenters.
The questionnaire that the participants had to fill out, was completed without the participants
needing to register any identifying information. Afterwards, the participants had to write their e-
mail address on the consent form, if they wanted to be part of the draw to win the gift certificates.
It was, however, made clear to the participants that this piece of paper would not be paired with
the answers in the questionnaire, as the two were stored separately.
Because the experimenters had to be in the room during the experiment, divisive screens were put
up in two of the rooms, between the experimenter and the participants filling out the questionnaire.
In the other two rooms, the participants and the experimenter sat on opposite sides of a table.
Both layouts made it impossible for the experimenter to see what the participants answered while
completing the questionnaire.
Briefing
Throughout the experiment, everything the experimenters said was from a manuscript, to make
sure that there were no discrepancies in what the different experimenters said (see appendix C.2).
The experimenters started by explaining that the experiment was completely voluntary and anony-
mous. The participants then had to sign a consent form, acknowledging that they had understood
this (see appendix C.3). The experimenters then explained that the participants would see some
pictures, either on the smart phone in the control group, or with the VR headset in the treatment
group. Instructions were given as to how to use the different devices, and although the instructions
had to be slightly more detailed for the VR headset, the differences were kept to a minimum, to
make the two conditions as similar as possible. The rest of the manuscript was identical across
the two conditions.
The participants were told that they did not have to memorize anything or focus on anything
specific, as there would be no questions about this. The reason for this was that the pretest had
38

revealed that the subjects were likely to try to memorize different things in the pictures, because
they thought that there would be some sort of test of their abilities afterwards. We discussed the
possibility that telling the participants not to focus on this would in fact make them focus more
on it, if they hadn’t thought about it before. However, the feedback from the pretest made it clear
that it was more likely that this information made the participants relax and look at the pictures
without focusing on anything in particular.
Exposure
In order to ensure interactivity in the immersive VR condition, the participants sat in a rotatable
chair with the VR headset on. The chair was placed in such a way that the participants could
turn freely in all directions. The participants were instructed to say “next” when they wanted
to switch between the pictures. The experimenter would then switch to the next picture and
ask “did a new picture appear?”. Ideally, they should be able to do this themselves, but the
“next”-button on the headset was made in such a way that it could easily cause the participants to
quit the slideshow application if not used correctly. This would interrupt the exposure and could
potentially contaminate the data. For the same reason, the participants were asked not to touch
the side of the headset with the button during the session. Furthermore, the participants were
instructed to let the experimenter know when they were finished.
During the exposure, the experimenters took notes, on a scale from 1-5, as to how much the
participants talked about the technology and what they saw, and the level of movement, enthusiasm
and technical problems. The experimenters also registered whether or not the participants normally
wore eye glasses, and if they were wearing them during the exposure, as we wanted to make sure
that the results weren’t impacted by participants’ eyesight. In addition, the VR headset could be
perceived as uncomfortable when used with eye glasses underneath, which could also affect the
results.
In the 2D condition, the participants were instructed to look at nine different pictures. As men-
tioned, the pictures were screenshots made from the VR material. This way we ensured that
the participants in both conditions were exposed to the same photo material, and that the only
difference was whether or not they saw the pictures with an HMD or on a smartphone. The exper-
39

imenters did not talk, if not talked to, during the exposure in both the immersive VR condition
and the 2D condition, to not distract the participants or affect the experience in any way.
It was important for the internal validity of the experiment that participants did not see each other
during the exposure, seeing as how they were assigned to different treatments. It’s likely that the
participants in the control group would be less excited to see pictures on a smartphone if they
knew that another participant was seeing pictures with a VR headset, especially if they had not
tried this technology yet. Conversely, participants in the treatment group could have experienced
more joy of getting to see pictures with the VR headset if they knew that other participants
were not getting the same opportunity. There could also be other effects that we didn’t predict,
and thus couldn’t control for. Because of this, the glass walls in the rooms that were used for
the experiment were covered, so it was impossible to see what was happening inside. This also
strengthened anonymity.
Questionnaire
After the exposure, the participants had to complete a questionnaire (see appendix C.4). They
were told that they were going to answer some questions regarding what they had just seen, and
that there were no right or wrong answers to the questions. The questionnaire was based on
questions from previous research, and the measurements will be discussed in more detail later.
The participants filled out the questionnaire on a computer, and were encouraged to ask if they
had any questions or if anything was unclear. This turned out not to be an issue, as there were
not many questions asked. As mentioned, in two of the rooms the questionnaire was filled out
behind a divisive screen, whereas the experimenter and participants were sitting on different sides
of a table in the two other rooms.
The questionnaire consisted of two parts, namely one for the participant and one for the ex-
perimenter. After the participants had completed their part, and eventually left the room, the
experimenters filled out their part, plotting the things they had registered during the exposure,
regarding movement etc.. The two parts were separated by two messages, telling the participants
that they had completed the questionnaire, to make sure that they would not see that we were
registering their behavior. This was to prevent any kind of impact on the rest of the experiment.
40

Offer to Purchase Tickets
After the participants had completed the questionnaire, they were offered to buy up to two tickets
to the Norway In A Nutshell-trip at a discounted price (see appendix C.5). The price for one ticket
was NOK 440 (originally NOK 1.320), and NOK 880 (originally NOK 2.640) for two tickets. The
offer was binding and the participants had to decide before the session was concluded. If they
decided to purchase the ticket(s) they could choose freely when to use them. If one ticket was
purchased, it could only be used by the participant that bought it. If two tickets were purchased,
both had to be used on the same tour, and one had to be used by the participant that purchased it.
The reason for this was to avoid that the ticket(s) were bought as a gift because of the discounted
price, thus contaminating the results due to deviant purchasing decision motives. The participants
who accepted the offer were given a form that contained information about the Norway In A
Nutshell-trip and payment instructions. The tickets had to be payed before the end of the week.
Debriefing
Before the session was concluded, the participants were told not to talk about what they had
experienced, and the offer they had received before the the following week. The reason for this
was ensure the internal validity of the experiment by avoiding that participants scheduled for later
sessions could form expectations or consider the offer to purchase tickets prior to the session.
4.1.5 Measurements
The questionnaire that the participants answered was designed to give a nuanced picture of how
the participants experienced the exposure, and how it affected them. The different items used in
the questionnaire, and their theoretical basis, are presented in the following section.
Dependent Variables
Destination attitude. To test the attitudes toward the destinations the participants were exposed
to, a five-item, 11-point Likert scale was used. The questions were based on Li, Daugherty, and
Biocca (2002), and measured the attitudes by letting the participants choose a point on the scale
41
between “very bad/very good”, “not appealing/very appealing”, “very unpleasant/very pleasant”,
“very unattractive/very attractive” and “very boring/very interesting”.
Behavioral intentions. The behavioral intentions we wanted to test were related to the participants’
intention to visit the destinations and to recommend them. This was done with a three-item, 11-
point Likert scale, with questions based on Nah, Eschenbrenner, and DeWester (2011), and the
wording of the scale was “completely disagree/completely agree”.
Purchasing decision. The purchasing decision was measured simply with an ordinal scale, were the
participants answered verbally to the experimenters after receiving the offer. The experimenters
later registered the response in the second part of the questionnaire.
Mediating Variables
Telepresence. A three-item, 11-point Likert scale with the extremes “completely disagree/completely
agree” was used to measure the participants’ experienced level of telepresence. The first item was
based on Hyun and O’Keefe (2012), whereas the second and third item was based on Klein (2003)
and Nah, Eschenbrenner, and DeWester (2011).
Enjoyment. The degree of enjoyment while looking at the pictures was measured using a three-
item, 11-point Likert scale, with questions based on Nah, Eschenbrenner, and DeWester (2011).
The extremes on the scales were “completely disagree/completely agree”.
Mental imagery. When it comes to mental imagery, W. Lee and Gretzel (2012) was the basis for
the three-item, 11-point Likert scale used to measure it. The questions were answered on a scale
with the extremes “not at all/to a high degree”.
Predicted emotions. The participants were asked to imagine that they traveled to the destinations
in the pictures, and their predicted emotions were measured using a five-item, 11-point Likert
scale based on Gilbert, Gill, and Wilson (2002) and Wilson et al. (2000). The extremes on the
scales were “not happy/very happy”, “no admiration/strong admiration”, “not meaningful/very
meaningful”, “little impression/strong impression” and “not satisfied/very satisfied”.
42

Predicted experiences. The participants’ predictions regarding three different experiential dimen-
sions based on Brakus, Schmitt, and Zarantonello (2009), were measured using a nine-item, 11-
point Likert scale. These dimensions were the sensory, affective and intellectual dimension, and
the extremes on the scales were “completely disagree/completely agree”.
Control Variables
In addition to the dependent variables and mediating variables, a number of control variables were
measured, for use in the analyses. By controlling for different effects that aren’t the focus of this
study, we can perhaps better establish the relationships we are interested in looking at.
Optimum Stimulation Level (OSL). The Optimum Stimulation Level (OSL) is a term that describes
the preferred level of stimulation of an organism (Zuckerman 1971). This can be measured by using
a self-report scale called AST-II (Mehrabian 1978), from which we used some items to be able to
assess our participants’ OSL. Specifically, we used a five-item, 11-point Likert scale to measure
this, with the anchors of the scale being “to a very small degree/to a very high degree”. This
measurement was used to control for personality traits in the analyses, in case this had an impact
on the results.
Prior travel experience. We wanted to control for previous experience with the destinations, as
well as existing plans to visit them and knowledge about them. The first two were measured using
a two-item scale, with the answers “Yes”, “No” and “Don’t know”. The latter was measured with
a single-item, 11-point Likert scale with the scale anchors “no knowledge/a lot of knowledge”.
Prior VR experience. We also wanted to control for previous experience with, and knowledge
about, VR technology. The first was done with items asking if participants had tried a VR headset
before and if the had seen an advertisement with one. The answers were in the form of “Yes”,
“No” and “Don’t know”. To test knowledge about VR technology, the participants indicated their
level of knowledge on a single-item, 11-point Likert scale, with the scale anchors again being “very
little knowledge/a lot of knowledge”. These measurements were only done in the immersive VR
condition, as we did not want to reveal to the control group that we were using a VR headset.
Experience with the VR headset. An important control variable was the participants’ experience
43

with the exposure itself, namely with using the VR headset. This was measured by asking if they
felt nauseated, uncomfortable and dizzy, with answers on a three-item, 11-point Likert scale, and
the wording “not at all/to a very high degree”. We also measured the participants’ perceived
quality of the pictures they had seen, on a single-item, 11-point Likert scale with the wording
“very poor quality/very good quality”. The three first items were only measured in the immersive
VR condition, whereas the perceived quality item was measured in both groups.
Demographic variables. Being a relatively homogeneous sample of students at NHH, the only
demographic variables we needed were age, gender and whether they were bachelor students or
master students.
Hypothesis guessing. We asked the participants what they thought we were testing in the experi-
ment. This way we could control for hypothesis guessing, if that were to be an issue.
Other Variables
Several other variables related to the participants’ behavior during the exposure were also registered
in both conditions. This was done to see if there were differences in how the two technologies were
used during the exposure, and if this had an impact on the results of the experiment.
Time spent. The experimenters registered how much time the participants spent viewing pictures.
The measurements were made in 30 second intervals.
Movement. This was registered on a single-item, 5-point Likert scale, with the scale anchors being
“very little/very much”. This variable was registered only in the immersive VR condition.
Talking and enthusiasm. The degree to which the participants talked about both the technology
and what they saw in the pictures was also registered, as was their degree of enthusiasm. Again, this
was measured on a three-item, 5-point Likert scale, with the scale anchors being “very little/very
much” and “very little enthusiastic/very much enthusiastic”. The degree to which they talked
about the technology was only registered in the immersive VR condition, whereas the two others
were measured in both.
44
Technical issues. Seeing as how the VR headset was more complicated to use than the smartphone,
we also registered whether there were any technical issues during the exposure in both conditions.
This was done using a single-item, 3-point scale, with the answers being “no issues”, “some issues”
and “significant issues”.
Eye Glasses. We also registered if the participants were using eye glasses on a regular basis, and
if they were wearing them during the exposure. The variable was measured using a single-item,
3-point scale, with the answers “yes, wearing them during exposure”, “yes, but not wearing them
during exposure” and “no”.
Other reasons for omission from data. Finally, the experimenters registered whether there were
any other reasons that a particular observation should be omitted from the data.
Factor Analysis and Scale Reliability Check
It’s fair to assume that the theoretical constructs in our model are correlated, and hence, we
performed a factor analysis with oblimin rotation, which is an oblique rotation method that allows
correlated factors (Hair et al. 2006). By performing the factor analysis, we can look for underlying
patterns for the variables, and possibly condense the information into a smaller set of factors (Hair
et al. 2006), which also gives us an image of how the variables fit the data (Pett, Lackey, and
Sullivan 2003). When performing the factor analysis, we considered factor loadings above .50 to
be significant, and did not include factors with factor loadings below this in the factor solution.
According to Hair et al. (2006), an appropriate acceptance level for a sample size around 100,
like ours, would be .55, but seeing as how we had a reasonably high number of variables (31), we
decided to lower this threshold.
We extracted eight factors with an eigenvalue > 1. After reviewing the data, we split one of the
proposed factors into two, namely the grouping of items measuring the affective and intellectual
dimension of Brakus, Schmitt, and Zarantonello (2009)’s brand experience scale. The reason for
doing this, was that these are theoretical constructs that are linked, and therefore expected to be
interrelated, but still are shown to measure different things (Brakus, Schmitt, and Zarantonello
2009). Thus, we ended up with nine factors. The second item in the predicted emotions scale
45
was excluded due to cross loading, as well as the third item in the intellectual experiences scale
and the first two items in the attitude scale. Of the remaining factors, there were 4/27 items with
factor loadings < .60, which according to Hair et al. (2006) is the level at which a factor loading
is considered to be high, whereas the rest had factor loadings > .60. This result indicates that the
variables are an acceptable fit with the data.
Furthermore, we performed a scale reliability check to control the internal consistency of the scales,
using the reliability coefficient, Cronbach’s alpha (α). All the extracted factors reached values >
.70, which is the generally agreed upon lower limit for Cronbach’s alpha (Hair et al. 2006). In fact
only the intention measurement reached a value < .80, which is considered to be a preferable value
(Pallant 2010). In addition, none of the scales have more than four items, which makes it clear that
there is no problem of higher Cronbach’s alpha values because of many items in the scale (Hair
et al. 2006). Although several of the scales would have reached a higher Cronbach’s alpha if one of
the items in the scale were to be deleted, most of the scales we use are already established scales,
and removing items would make it harder to compare findings to the previous research (Pallant
2010). We have reported detailed results from the factor analysis and scale reliability check in
tables E.1 and E.2 in appendix E.
4.1.6 Data Analysis
Main Effect
To test the hypothesis regarding main effects from immersive VR on consumer outcomes, we used
independent-samples t-tests. The reason for this, is that we have one independent variable with
two levels (treatments), and therefore wanted to compare the means between these two groups of
participants for three different dependent variables. However, seeing as how purchasing decision is
an ordinal variable, we needed to use a Mann-Whitney U test on this particular variable (Pallant
2010).
46
Mediated Effects
Preacher and Hayes (2008) state that the most common method of testing hypotheses about
mediation is the causal step strategy by Baron and Kenny (1986). In recent times, it has, however,
been questioned whether this method is really the best one for assessing mediated effects, and
several weaknesses of the method have been brought up (Preacher and Hayes 2004; Preacher
and Hayes 2008; Hayes 2009). Besides the method being among the lowest in statistical power,
Hayes (2009) also mentions the fact that this method claims that there can’t be any indirect effects
between the independent variable and the dependent variable unless there is a direct effect between
them. According to Hayes (2009), this does not have to be the case, because the direct effect could
be non-significant due to indirect effects working in opposite directions. Instead of using the causal
step strategy, we therefore used a bootstrapping procedure with 5000 bootstrap samples to test the
mediated effects of immersive VR on consumer outcomes. This method has no assumption of
normality, being a non-parametric resampling procedure, which makes it an appropriate method
for our analysis, as the distribution of scores in the measurements of the indirect effects might not
be normal (Preacher and Hayes 2008). The procedure samples from the data set repeatedly, and
estimates the indirect effect in each resampled data set (Preacher and Hayes 2008).
4.2 Results
Descriptive Statistics
Descriptive statistics for the nine factors can be seen in table F.1 in appendix F, and frequencies
for the ordinal variable purchasing decision can be seen in table F.2 in appendix F. There were 52
observations in the immersive VR condition and 51 observations in the 2D condition.
4.2.1 Test of Assumptions
Parametric tests make a number of assumptions that need to be satisfied in order not to influence
the results, namely random samples, independence of observation, normality and homogeneity of
47

variance (Hair et al. 2006; Pallant 2010). Although some techniques are more robust, meaning
that they are less affected by violating assumptions, some of the assumptions have to be satisfied,
making it important to ensure that they are (Hair et al. 2006). We also used a non-parametric
technique on the purchasing decision variable. Non-parametric techniques only assume random
samples and independent observations, but we have to control this as well (Pallant 2010).
Independence of Observations
The need for independence of observations means that no observation or measurement can be
influenced by another observation. Seeing as how we randomized the participants into treatments,
and that they didn’t have contact with anyone but the experimenter during the experiment, this
shouldn’t be a problem. The experiment was also anonymous, and the participants were given
clear instructions not to speak to anyone about what they had done in the experiment before it
was concluded.
Normal Distribution
In order to assess the normality of the distribution of the sample data, we used the descriptive
statistics to check the skewness and kurtosis values (see descriptive statistics in table F.1 in ap-
pendix F). The skewness value indicates whether the scores are clustered to either side of the
distribution, whereas the kurtosis value indicates how peaked the distribution is, meaning if it’s
concentrated around one score (Pallant 2010). A negative skewness value indicates scores clus-
tered at the low levels, whereas positive skewness values indicate the opposite. Positive kurtosis
values indicate a peaked distribution, and vice versa for negative kurtosis values (Pallant 2010).
Values between -1 and 1 indicate that the scores are normally distributed. In total, four of our
nine factors had kurtosis values above |1|, all of them positive. Three of these factors also had
a skewness value above |1|, all of these negative. This means that our scores do not satisfy the
assumption of normality, as some scores are peaked and clustered around the high levels of the
scales. However, according to Pallant (2010, p. 206), “most of the techniques are reasonably
‘robust’ or tolerant of violations of this assumption. With large enough sample sizes (e.g. 30+),
the violation of this assumption should not cause any major problems”. Seeing as how we have a
sample size of n = 103, the lack of normality should not be a big problem, but to be certain, we
48
conducted non-parametric tests to control the results of the parametric tests.
Homogeneity of Variance
We conducted Levene’s test to see if the assumption of homogeneity of variance was satisfied.
In this test, a significant result is unwanted, as this shows that the assumption is not satisfied,
because the variances of the two groups are not equal (Pallant 2010). The results of the tests were
that none of the test values were significant, meaning that there is homogeneity of variance in all
the factors. The results of the test are shown in table F.3 in appendix F.
4.2.2 Test of Main Effects (H1)
The aim of our first hypothesis (H1) was to investigate the main effects of immersive VR on a)
destination attitude, b) behavioral intentions and c) purchasing decision, predicting that there was
a positive effect on all three consumer outcomes. H1a and H1b were tested using independent-
samples t-tests, whereas H1c was tested with the non-parametric Mann-Whitney U test. The
results of H1a and H1b were also confirmed with this test. The results can be seen in table 4.1,
which presents mean scores for destination attitude and behavioral intentions in both conditions
and corresponding p-values. For purchasing decision it only shows whether or not to reject the
null hypothesis – which was that the distribution of purchasing decision scores was the same for
both conditions – and the corresponding p-value.
The results show that there were no significant differences in means for destination attitude,
behavioral intentions or purchasing decision between the two conditions. This means that we were
not able to show any direct effects of being exposed to a destination in immersive VR compared
to 2D. The independent-samples t-test showed that H1a and H1b were not supported. The Mann-
Whitney U test also confirmed this, in addition to retaining the null hypothesis in H1c, meaning
that there were no significant differences between the two conditions for any of the dependent
variables. The results regarding main effects on the dependent variables can be seen in table 4.1.
49
Control Variables
We have suggested several control variables to be used as covariates in the analyses. However,
the dependent variables and the covariates must be correlated as a requirement for covariance
analysis (Hair et al. 2006). This is not the case for most of our control variables. Only four
of the control variables were correlated with two of the dependent variables. The participants’
gender and one of the personality traits were correlated with destination attitude, and type of
study (bachelor/master) and experience with VR was correlated with purchasing decision. After
repeating the analyses while controlling for these, the results remained the same.
4.2.3 Test of Mediation Effects (H2-H7)
Main effects of immersive VR were also tested for the five mediators, although these are not
specifically hypothesized. However, for there to be indirect effects through these variables, there
must also be a main effect from immersive VR on them. The results show that there was a
significant difference between the two conditions for Telepresence (diff. = 2.24233, p = .000),
Enjoyment (diff. = 1.84842, p = .000) and Mental Imagery (diff. = 1.04387, p = .002). Mean
scores in both conditions and p-values for the five proposed mediators are included in table 4.1.
50
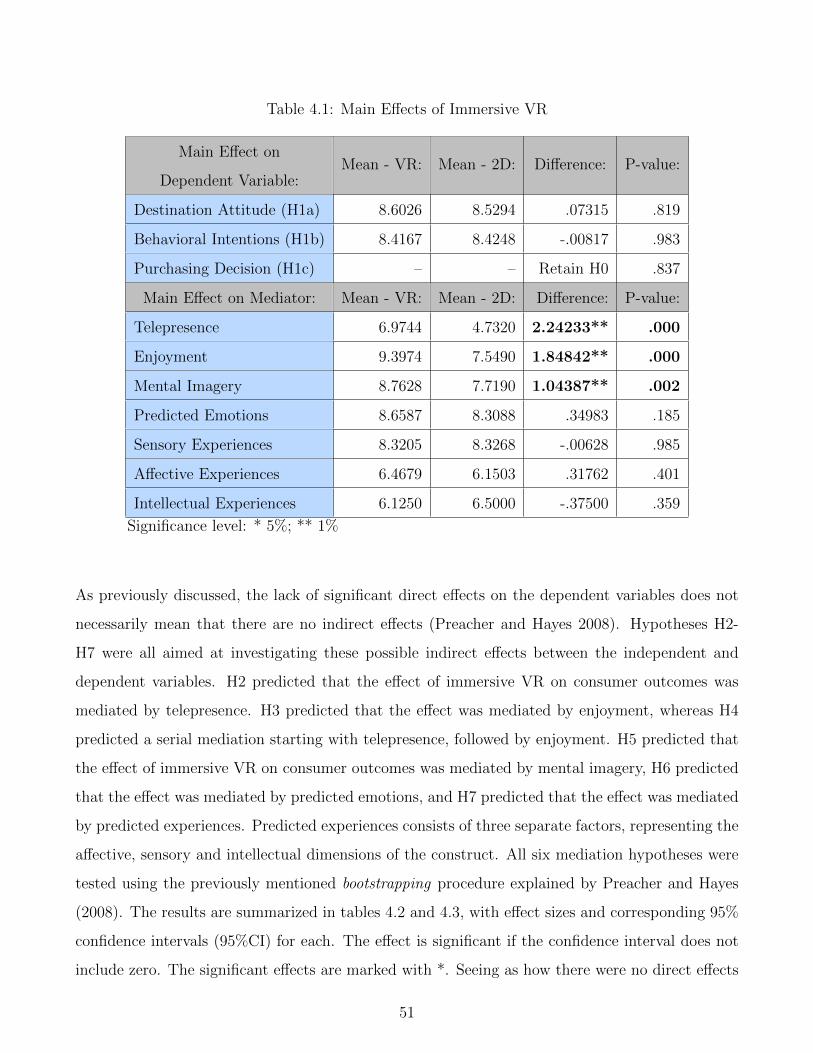
Table 4.1: Main Effects of Immersive VR
Main Effect on
Dependent Variable:Mean - VR: Mean - 2D: Difference: P-value:
Destination Attitude (H1a) 8.6026 8.5294 .07315 .819
Behavioral Intentions (H1b) 8.4167 8.4248 -.00817 .983
Purchasing Decision (H1c) – – Retain H0 .837
Main Effect on Mediator: Mean - VR: Mean - 2D: Difference: P-value:
Telepresence 6.9744 4.7320 2.24233** .000
Enjoyment 9.3974 7.5490 1.84842** .000
Mental Imagery 8.7628 7.7190 1.04387** .002
Predicted Emotions 8.6587 8.3088 .34983 .185
Sensory Experiences 8.3205 8.3268 -.00628 .985
Affective Experiences 6.4679 6.1503 .31762 .401
Intellectual Experiences 6.1250 6.5000 -.37500 .359
Significance level: * 5%; ** 1%
As previously discussed, the lack of significant direct effects on the dependent variables does not
necessarily mean that there are no indirect effects (Preacher and Hayes 2008). Hypotheses H2-
H7 were all aimed at investigating these possible indirect effects between the independent and
dependent variables. H2 predicted that the effect of immersive VR on consumer outcomes was
mediated by telepresence. H3 predicted that the effect was mediated by enjoyment, whereas H4
predicted a serial mediation starting with telepresence, followed by enjoyment. H5 predicted that
the effect of immersive VR on consumer outcomes was mediated by mental imagery, H6 predicted
that the effect was mediated by predicted emotions, and H7 predicted that the effect was mediated
by predicted experiences. Predicted experiences consists of three separate factors, representing the
affective, sensory and intellectual dimensions of the construct. All six mediation hypotheses were
tested using the previously mentioned bootstrapping procedure explained by Preacher and Hayes
(2008). The results are summarized in tables 4.2 and 4.3, with effect sizes and corresponding 95%
confidence intervals (95%CI) for each. The effect is significant if the confidence interval does not
include zero. The significant effects are marked with *. Seeing as how there were no direct effects
51

of immersive VR on consumer outcomes, the mediators discussed in the following are all part of
the indirect effects.
There was no significant indirect effect of using immersive VR on any of the consumer outcomes
through telepresence (H2), nor was there one through predicted emotions (H6) or any of the
three dimensions of predicted experiences (H7). This means that H2, H6 and H7 are all rejected.
However, when extracting the item regarding predicted happiness from the predicted emotions
factor, there was a significant indirect effect of immersive VR through this item, on both destination
attitude (effect = .3816; 95%CI = .1125, .8323) and behavioral intentions (effect = .2975; 95%CI
= .0690, .6831). Predicted happiness has been established as an important item in affective
forecasting research (Wilson et al. 2000), which is why we tested for this separately.
There was a significant indirect effect on two of the consumer outcomes through enjoyment ,
namely destination attitude (effect = .6222; 95%CI = .3219, 1.0231) and behavioral intentions
(effect = .4279; 95%CI = .0601, .9162). This means that H3 is partly supported, seeing as how there
was no indirect effect on purchasing decision. In addition, we found a significant serial mediation in
accordance with H4a, with an indirect effect of immersive VR on destination attitude, first through
telepresence (M1) and secondly through enjoyment (effect = .2642; 95%CI = .2642, .1122).
There was also a significant indirect effect on behavioral intentions, through mental imagery
(effect = .2697; 95%CI = .0559, .6628), but no significant indirect effect on destination attitude
and purchasing decision, which means that H5 is also partly supported.
52
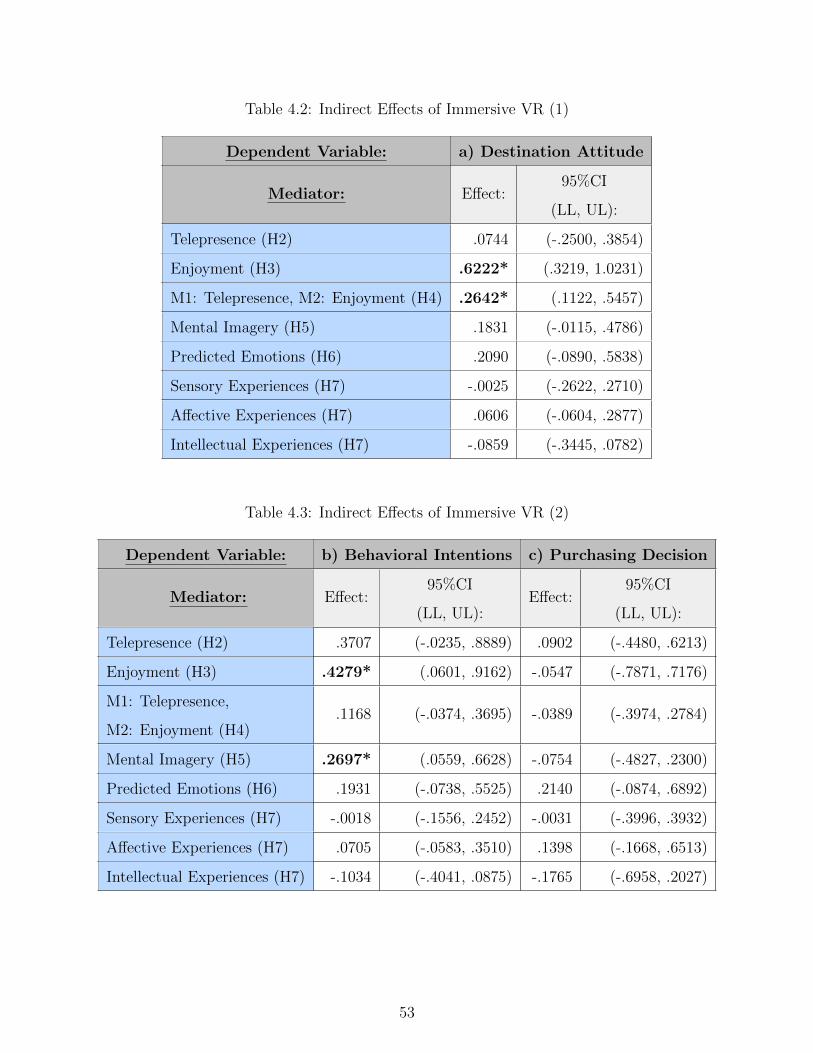
Table 4.2: Indirect Effects of Immersive VR (1)
Dependent Variable: a) Destination Attitude
Mediator: Effect:95%CI
(LL, UL):
Telepresence (H2) .0744 (-.2500, .3854)
Enjoyment (H3) .6222* (.3219, 1.0231)
M1: Telepresence, M2: Enjoyment (H4) .2642* (.1122, .5457)
Mental Imagery (H5) .1831 (-.0115, .4786)
Predicted Emotions (H6) .2090 (-.0890, .5838)
Sensory Experiences (H7) -.0025 (-.2622, .2710)
Affective Experiences (H7) .0606 (-.0604, .2877)
Intellectual Experiences (H7) -.0859 (-.3445, .0782)
Table 4.3: Indirect Effects of Immersive VR (2)
Dependent Variable: b) Behavioral Intentions c) Purchasing Decision
Mediator: Effect:95%CI
(LL, UL):Effect:
95%CI
(LL, UL):
Telepresence (H2) .3707 (-.0235, .8889) .0902 (-.4480, .6213)
Enjoyment (H3) .4279* (.0601, .9162) -.0547 (-.7871, .7176)
M1: Telepresence,
M2: Enjoyment (H4).1168 (-.0374, .3695) -.0389 (-.3974, .2784)
Mental Imagery (H5) .2697* (.0559, .6628) -.0754 (-.4827, .2300)
Predicted Emotions (H6) .1931 (-.0738, .5525) .2140 (-.0874, .6892)
Sensory Experiences (H7) -.0018 (-.1556, .2452) -.0031 (-.3996, .3932)
Affective Experiences (H7) .0705 (-.0583, .3510) .1398 (-.1668, .6513)
Intellectual Experiences (H7) -.1034 (-.4041, .0875) -.1765 (-.6958, .2027)
53
4.2.4 Summary of Findings
Study 1 showed that there were no direct effects on the dependent variables of using immersive VR
compared to 2D. However, there were some indirect effects, namely on destination attitude through
enjoyment and on behavioral intentions through mental imagery. In addition, there was a serial
indirect effect on destination attitude, through telepresence (M1), followed by enjoyment (M2).
There were no effects of immersive VR on purchasing decision. As such, the results differed from
what the hypotheses predicted for the most part. While there were some significant indirect effects
in the simple mediation analyses, these effects disappeared when performing a parallel mediation
analysis. This indicates that there could be some causal relationships between mediators, which
is also shown to be true for telepresence and enjoyment. Therefore, we will look more into serial
indirect effects with further analyses in the next section.
4.3 Discussion and Further Analysis
4.3.1 Similar Stimuli
As plenty of research has previously established a relationship between vivid and interactive stimuli
and consumer outcomes, both with and without mediators (e.g. Ahn and Bailenson 2011; Suh
and Y. E. Lee 2005; Schlosser 2003), it was surprising not to find any direct effects of immersive
VR on consumer outcomes in our study. One reason for this lack of effect could be the similarity
of stimuli in our two conditions. Seeing as how we wanted the stimulus in the control group to
be representative of what is currently used to view advertisements and information, a Samsung
smartphone was a natural choice. However, the Samsung Galaxy S7 edge has a high resolution
display with vivid colors, which is evident when comparing perceived picture quality in the two
groups, where the control group scored significantly higher. Because the participants were also
able to zoom in and out to inspect the pictures, the two conditions perhaps became too similar.
This is necessary, however, for the study to have external validity, as the research aims to give
insight into possible implications of using immersive VR in marketing. Simply developing a control
54

stimulus which is artificially primitive to inflate differences between the conditions, would not give
an accurate image of the current market, and the insight would thus be less useful.
4.3.2 The Role of the Mediators
As previously discussed, the lack of a significant direct effect does not necessarily mean that there
are no indirect effects (Preacher and Hayes 2008). The fact that enjoyment acts as a mediator in
the indirect effect from immersive VR on both attitude and intentions, tells us that the experience
the participants have while viewing the pictures is important. The participants enjoyed looking
at the pictures more with the VR headset than with the smartphone, and enjoyment led to more
favorable attitudes towards the destinations, as well as behavioral intentions. This indirect effect,
together with the others we have uncovered, indicate that there are other factors that we have not
measured, that counteract these effects, explaining the lack of a direct effect. It might be because
the dependent variables are not sensitive enough to a one-time exposure like ours, and that other
factors thus have too strong of an impact to see any changes.
Predicted happiness is part of a significant indirect effect on both destination attitude and be-
havioral intentions alone, but predicted emotions as a whole, is not. This shows that consumer
happiness is important to keep in mind when developing VR material. Mental imagery is also
part of a significant indirect effect on behavioral intentions, meaning that the VR headset led to
creation of more mental images, which again led to the destinations seeming like places the par-
ticipants would like to travel to. It’s interesting that this is not the case for telepresence, as these
concepts are related. However, telepresence acted as a mediator in the indirect effect when it also
went through enjoyment. This indicates that telepresence in itself doesn’t lead to more favorable
attitudes and intentions, but that it can lead to other effects, which again lead to consumer out-
comes. In that regard, telepresence acts like a facilitator for other effects, but does not actually
impact consumer outcomes in itself.
55
4.3.3 Basis for Further Analyses
Seeing as how there were significant indirect effects in simple mediation analyses, but not in a
parallel mediation analysis, we believe there to be causal relationships between mediators. We
have also shown that telepresence has an effect on enjoyment, which again impacts attitudes, so
it’s interesting to investigate telepresence as the first mediator in a serial indirect effect further.
This way, we can see if there are any other of our initially proposed mediators that have a significant
effect on consumer outcomes when they are first affected by telepresence. The two other variables
that were directly affected by immersive VR were mental imagery and enjoyment, so these will
also be investigated further as first mediators in serial indirect effects. However, telepresence was
the variable with the largest difference in means in the two conditions, making it natural to use
this as a starting point.
4.3.4 Alternative Indirect Effects - Serial Mediation
To further investigate the relationship between immersive VR and consumer outcomes, we per-
formed several analyses with serial mediation, using the previously mentioned bootstrapping pro-
cedure. As the only mediators which had a direct effect of immersive VR were telepresence,
enjoyment and mental imagery (see table 4.1), we used these respectively as the first mediator
(M1) in a number of serial mediation analyses. The second mediators (M2) were the remaining
four variables, predicted emotions, sensory experiences, affective experiences and intellectual expe-
riences, respectively. This resulted in four tests of indirect effects on the three different consumer
outcomes for each first mediator (M1), meaning 36 different tests. By doing this, we were able to
thoroughly map the indirect relationship between immersive VR and consumer outcomes. We will
now describe the results for each first mediator (M1) separately, starting with telepresence.
Telepresence as the First Mediator (M1)
In testing the indirect sequences VR –> Telepresence (M1) –> M2 –> Consumer Outcomes, we
found many significant indirect effects. In fact, the only relationship which was not significant was
the indirect effect on behavioral intentions with affective experiences as M2. Thus, immersive VR’s
56
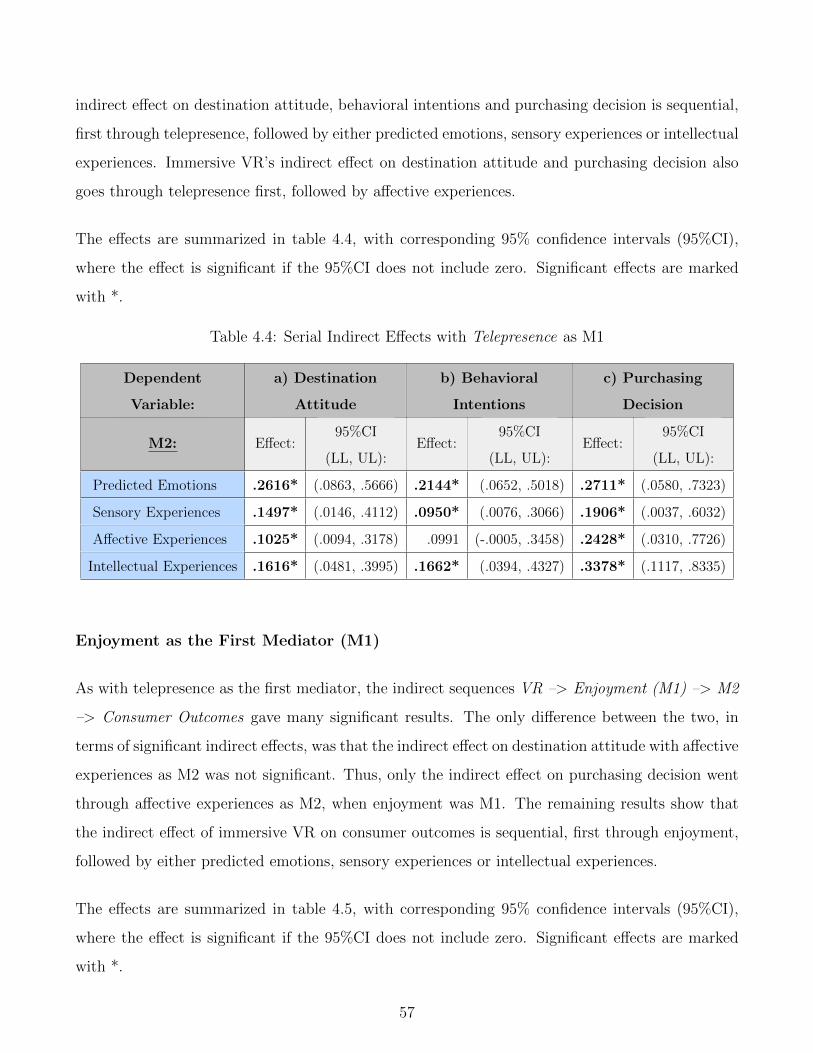
indirect effect on destination attitude, behavioral intentions and purchasing decision is sequential,
first through telepresence, followed by either predicted emotions, sensory experiences or intellectual
experiences. Immersive VR’s indirect effect on destination attitude and purchasing decision also
goes through telepresence first, followed by affective experiences.
The effects are summarized in table 4.4, with corresponding 95% confidence intervals (95%CI),
where the effect is significant if the 95%CI does not include zero. Significant effects are marked
with *.
Table 4.4: Serial Indirect Effects with Telepresence as M1
Dependent
Variable:
a) Destination
Attitude
b) Behavioral
Intentions
c) Purchasing
Decision
M2: Effect:95%CI
(LL, UL):Effect:
95%CI
(LL, UL):Effect:
95%CI
(LL, UL):
Predicted Emotions .2616* (.0863, .5666) .2144* (.0652, .5018) .2711* (.0580, .7323)
Sensory Experiences .1497* (.0146, .4112) .0950* (.0076, .3066) .1906* (.0037, .6032)
Affective Experiences .1025* (.0094, .3178) .0991 (-.0005, .3458) .2428* (.0310, .7726)
Intellectual Experiences .1616* (.0481, .3995) .1662* (.0394, .4327) .3378* (.1117, .8335)
Enjoyment as the First Mediator (M1)
As with telepresence as the first mediator, the indirect sequences VR –> Enjoyment (M1) –> M2
–> Consumer Outcomes gave many significant results. The only difference between the two, in
terms of significant indirect effects, was that the indirect effect on destination attitude with affective
experiences as M2 was not significant. Thus, only the indirect effect on purchasing decision went
through affective experiences as M2, when enjoyment was M1. The remaining results show that
the indirect effect of immersive VR on consumer outcomes is sequential, first through enjoyment,
followed by either predicted emotions, sensory experiences or intellectual experiences.
The effects are summarized in table 4.5, with corresponding 95% confidence intervals (95%CI),
where the effect is significant if the 95%CI does not include zero. Significant effects are marked
with *.
57
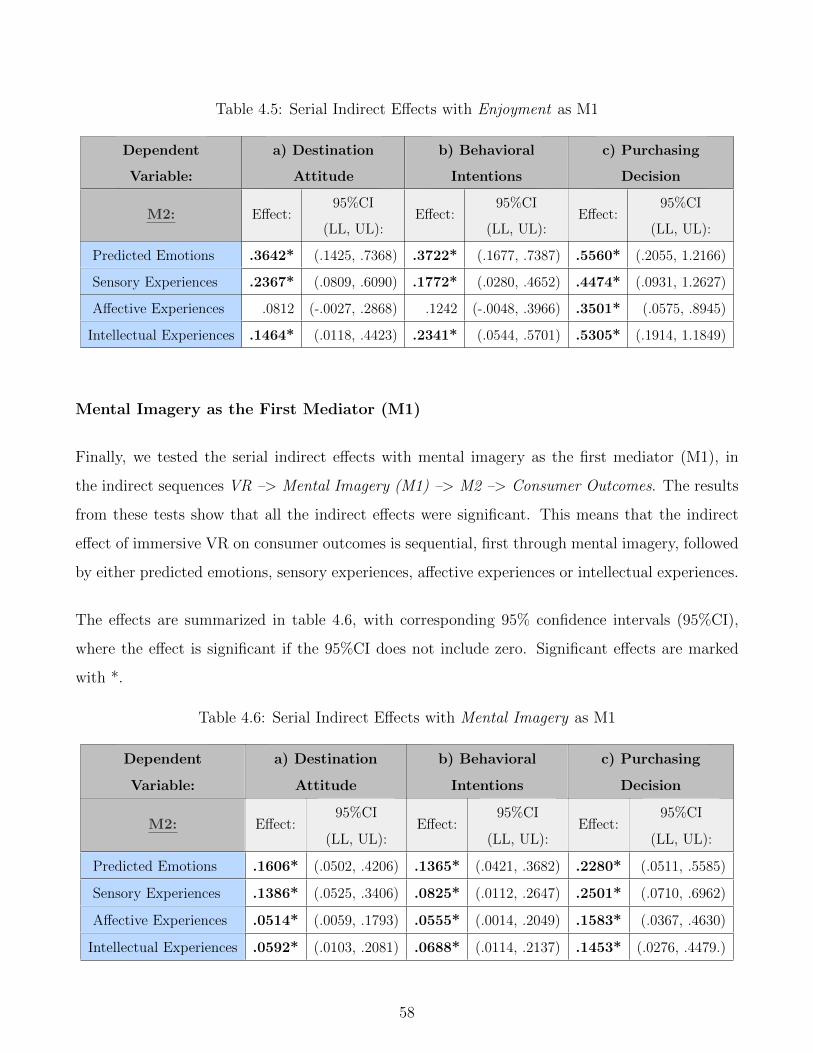
Table 4.5: Serial Indirect Effects with Enjoyment as M1
Dependent
Variable:
a) Destination
Attitude
b) Behavioral
Intentions
c) Purchasing
Decision
M2: Effect:95%CI
(LL, UL):Effect:
95%CI
(LL, UL):Effect:
95%CI
(LL, UL):
Predicted Emotions .3642* (.1425, .7368) .3722* (.1677, .7387) .5560* (.2055, 1.2166)
Sensory Experiences .2367* (.0809, .6090) .1772* (.0280, .4652) .4474* (.0931, 1.2627)
Affective Experiences .0812 (-.0027, .2868) .1242 (-.0048, .3966) .3501* (.0575, .8945)
Intellectual Experiences .1464* (.0118, .4423) .2341* (.0544, .5701) .5305* (.1914, 1.1849)
Mental Imagery as the First Mediator (M1)
Finally, we tested the serial indirect effects with mental imagery as the first mediator (M1), in
the indirect sequences VR –> Mental Imagery (M1) –> M2 –> Consumer Outcomes. The results
from these tests show that all the indirect effects were significant. This means that the indirect
effect of immersive VR on consumer outcomes is sequential, first through mental imagery, followed
by either predicted emotions, sensory experiences, affective experiences or intellectual experiences.
The effects are summarized in table 4.6, with corresponding 95% confidence intervals (95%CI),
where the effect is significant if the 95%CI does not include zero. Significant effects are marked
with *.
Table 4.6: Serial Indirect Effects with Mental Imagery as M1
Dependent
Variable:
a) Destination
Attitude
b) Behavioral
Intentions
c) Purchasing
Decision
M2: Effect:95%CI
(LL, UL):Effect:
95%CI
(LL, UL):Effect:
95%CI
(LL, UL):
Predicted Emotions .1606* (.0502, .4206) .1365* (.0421, .3682) .2280* (.0511, .5585)
Sensory Experiences .1386* (.0525, .3406) .0825* (.0112, .2647) .2501* (.0710, .6962)
Affective Experiences .0514* (.0059, .1793) .0555* (.0014, .2049) .1583* (.0367, .4630)
Intellectual Experiences .0592* (.0103, .2081) .0688* (.0114, .2137) .1453* (.0276, .4479.)
58
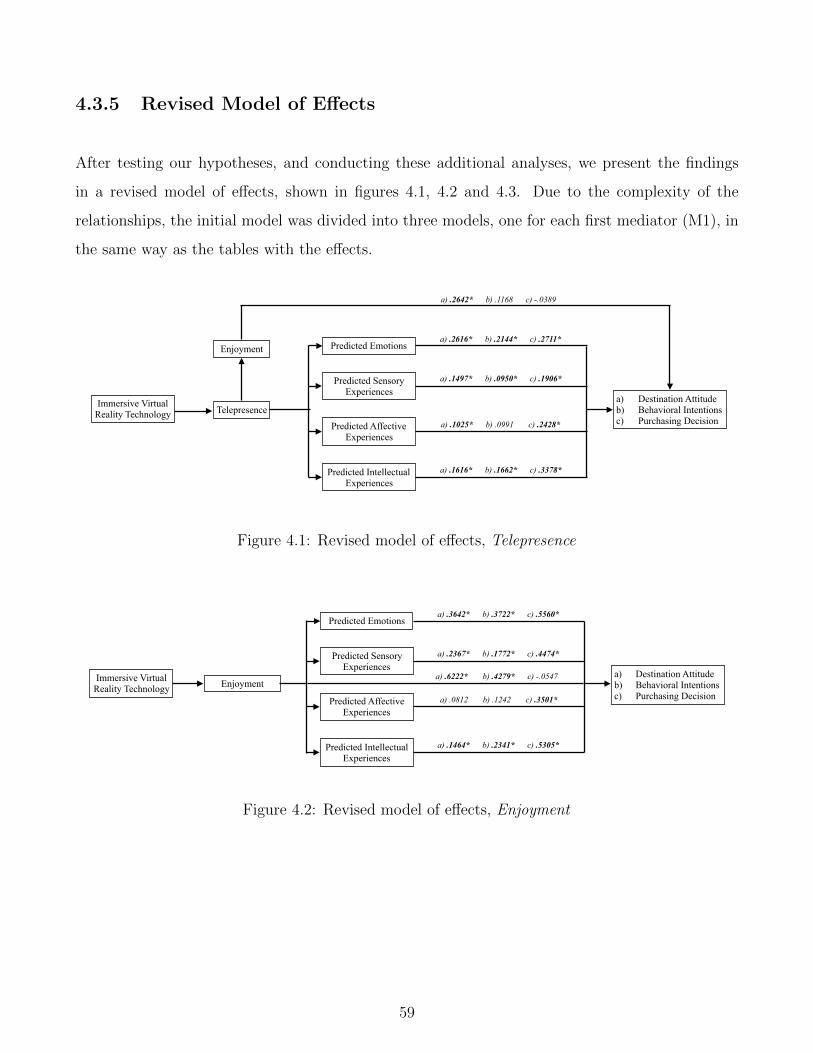
4.3.5 Revised Model of Effects
After testing our hypotheses, and conducting these additional analyses, we present the findings
in a revised model of effects, shown in figures 4.1, 4.2 and 4.3. Due to the complexity of the
relationships, the initial model was divided into three models, one for each first mediator (M1), in
the same way as the tables with the effects.
Immersive Virtual Reality Technology Telepresence
Predicted Emotions
Predicted Sensory Experiences
a) Destination Attitude b) Behavioral Intentions c) Purchasing DecisionPredicted Affective
Experiences
Predicted Intellectual Experiences
a) .2616* b) .2144* c) .2711*
a) .1497* b) .0950* c) .1906*
a) .1025* b) .0991 c) .2428*
a) .1616* b) .1662* c) .3378*
Enjoyment
a) .2642* b) .1168 c) -.0389
Figure 4.1: Revised model of effects, Telepresence
Immersive Virtual Reality Technology Enjoyment
Predicted Emotions
Predicted Sensory Experiences
a) Destination Attitude b) Behavioral Intentions c) Purchasing DecisionPredicted Affective
Experiences
Predicted Intellectual Experiences
a) .3642* b) .3722* c) .5560*
a) .2367* b) .1772* c) .4474*
a) .0812 b) .1242 c) .3501*
a) .1464* b) .2341* c) .5305*
a) .6222* b) .4279* c) -.0547
Figure 4.2: Revised model of effects, Enjoyment
59
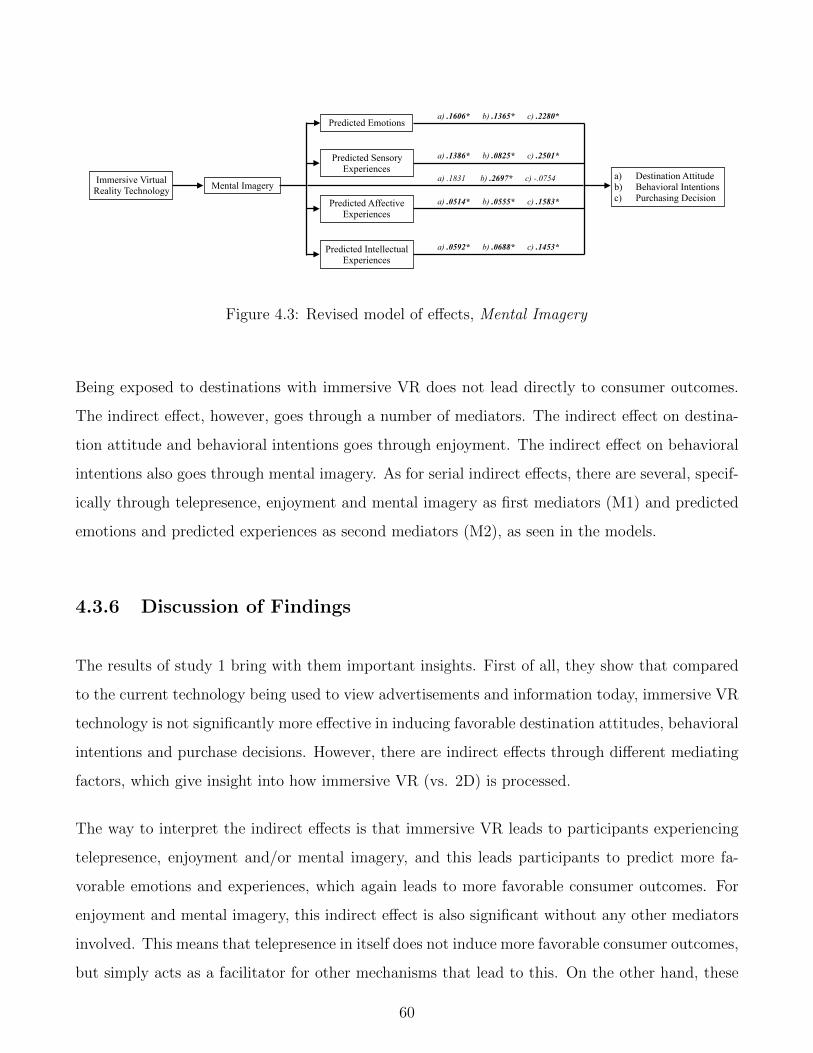
Immersive Virtual Reality Technology Mental Imagery
Predicted Emotions
Predicted Sensory Experiences
a) Destination Attitude b) Behavioral Intentions c) Purchasing DecisionPredicted Affective
Experiences
Predicted Intellectual Experiences
a) .1606* b) .1365* c) .2280*
a) .1386* b) .0825* c) .2501*
a) .0514* b) .0555* c) .1583*
a) .0592* b) .0688* c) .1453*
a) .1831 b) .2697* c) -.0754
Figure 4.3: Revised model of effects, Mental Imagery
Being exposed to destinations with immersive VR does not lead directly to consumer outcomes.
The indirect effect, however, goes through a number of mediators. The indirect effect on destina-
tion attitude and behavioral intentions goes through enjoyment. The indirect effect on behavioral
intentions also goes through mental imagery. As for serial indirect effects, there are several, specif-
ically through telepresence, enjoyment and mental imagery as first mediators (M1) and predicted
emotions and predicted experiences as second mediators (M2), as seen in the models.
4.3.6 Discussion of Findings
The results of study 1 bring with them important insights. First of all, they show that compared
to the current technology being used to view advertisements and information today, immersive VR
technology is not significantly more effective in inducing favorable destination attitudes, behavioral
intentions and purchase decisions. However, there are indirect effects through different mediating
factors, which give insight into how immersive VR (vs. 2D) is processed.
The way to interpret the indirect effects is that immersive VR leads to participants experiencing
telepresence, enjoyment and/or mental imagery, and this leads participants to predict more fa-
vorable emotions and experiences, which again leads to more favorable consumer outcomes. For
enjoyment and mental imagery, this indirect effect is also significant without any other mediators
involved. This means that telepresence in itself does not induce more favorable consumer outcomes,
but simply acts as a facilitator for other mechanisms that lead to this. On the other hand, these
60
mechanisms are not directly affected by the use of immersive VR, making it important to induce
a high level of telepresence. To ensure favorable predicted emotions and experiences, the virtual
experience needs to be designed in a way that also induces these favorable predictions. We will
discuss suggestions for how this can be done, as well as how to possibly induce more telepresence
when discussing implications in the general discussion section.
When it comes to enjoyment, the results show that the perception of the virtual experience is
important for consumer outcomes, seeing as how there is an indirect effect through enjoyment to
both destination attitude and behavioral intentions. This means that the virtual experience has
to be enjoyable for the viewer, which should be relatively easy to ensure, e.g. with a VR headset
that is comfortable to wear and exciting/pleasurable pictures and music.
It’s interesting that the indirect effects of immersive VR on purchasing decision were significant
when going serially through the previously mentioned indirect sequences, but not with simple
indirect effects through enjoyment, mental imagery or predicted happiness, which had an effect on
other consumer outcomes. This shows that simply creating an enjoyable virtual experience which
induces mental images and predicted happiness is not enough to make consumers take the extra
step from having the intention to purchase tickets for the trip, to actually purchasing tickets. The
virtual experience also has to be designed in a way that will suppress predictions of unfavorable
emotions and experiences and accentuate predictions of favorable ones.
4.3.7 Suggestions for Study 2
Although our control stimulus is developed to help with the external validity of the findings,
resembling the current alternative to immersive VR technology, our experiment sample is not
necessarily representative of the target group of advertisements of this kind. Destination marketing
is perhaps more aimed at a target group with more money, and to a certain extent more time,
than students. This could make the findings in an experiment with only students as participants
less generalizable and apt for application in real world circumstances. To see if the results of this
experiment apply for participants closer to the target group of destination marketing, study 2
should aim to investigate the same relationships with participants that are perhaps older, have a
61

more established life and are in the market for traveling. In addition, it would be interesting to
see how results might differ in an other setting than in the lab, for participants who have already
purchased tickets to a destination. The fact that the participants will already have bought the
tickets and are closer to experiencing the destination in real life, might influence how effectively
immersive VR exposure can change their destination attitude and behavioral intentions. A final
interesting point to explore, is whether the actual experience of traveling to the destination in the
pictures is different after seeing pictures of the destinations in either immersive VR or in 2D.
62
Chapter 5: Study 2
Study 2 was conducted in a more exploratory manner than study 1, as a field experiment. The
hypotheses presented in Chapter 3 were still the basis for the research, but they were treated more
as research questions than strict hypotheses. However, seeing as how this was a field experiment,
some of the measurements were removed, to prevent respondent fatigue. In addition to the existing
hypotheses, we also added a research question regarding how the actual experience of traveling to
the destination would be affected by whether the participants were exposed to immersive VR or
2D beforehand.
The field experiment was conducted during two trips on board Hurtigruten, with passengers trav-
eling at least from Bergen to Trondheim. Hurtigruten is a cruise line along Norway’s western and
northern coast between Bergen and Kirkenes, which ships both passengers and freight, and visits
famous fjords and other nature sites along the way (Hurtigruten 2015). Conducting the experiment
on board Hurtigruten ensured a sample group in the target group for destination marketing, as
they had already purchased tickets to a trip to see Norwegian nature. More importantly, this also
meant that the situation in which the experiment was conducted was very different from in the lab
experiment. The destination that the participants were exposed to was much closer, both physi-
cally and psychologically, for participants in this study, which likely impacted how they predicted
the emotions and experiences. Because the passengers on this trip were mostly foreign tourists,
we sent all the written material that we were going to use to a professional translating service
called Allegro, which is the translation service used by The Norwegian School of Economics. The
material was translated into English, German and French, which was deemed as sufficient to reach
most passengers.
Conducting a field experiment has both benefits and disadvantages, namely in the degree of validity
of the experiment. There is no consensus regarding whether field or lab experiments are best suited
for extrapolation of findings to other populations. Some state that the controlled environment of
the lab gives more reliable results, whereas others argue that the realism of a field experiment
makes it more relevant to the real implications of the findings (Falk and Heckman 2009). The
63
controlled environment of the lab provides more certainty that the manipulation is the only factor
that is changed, and the internal validity is its greatest strength. On the other hand, the realism
of the field provides insight into what effects apply for a more generalizable sample, making the
external validity the greatest strength of the field experiment. One could argue that we in fact
conducted a lab experiment in the field, in trying to recreate the lab experiment in a more natural
environment, while still ensuring internal validity. However, not everything in the field was possible
to control to the same extent as in the lab.
5.1 Methodology
5.1.1 Experimental Design
The experimental design was very similar to that of the experiment in study 1, as a between-subject
field experiment, but this time we also had a pre-post design, with a second questionnaire after
experiencing the destination in real life. Our independent variable was the same, namely exposure
to pictures of a destination either on a smartphone screen in 2D, or with an immersive VR headset,
but the pictures were different. There was also no measurement of purchasing decision, seeing as
how participants had already purchased tickets for the trip they were on. Destination attitude and
behavioral intentions were still the dependent variables.
The participants were assigned to the different experimental conditions depending on available ca-
pacity of the given condition, as there were no appointments as to when the participants showed up
in this experiment. The experiment started with brief instructions about the equipment, followed
by exposure of participants to the pictures of the destinations. After that, participants answered a
questionnaire and received information about when and where they could fill out the second part
of the questionnaire the next day. The next day, they answered a short second questionnaire. The
details of the experimental procedure will be covered later in this section.
64

5.1.2 Participants
A total of 71 subjects took part in the experiment, all of them passengers on board Hurtigruten,
traveling from Bergen to Trondheim or further. The participants were passengers from across the
world, with a majority being native German or English speakers, most of them over the age of
50. The experiment was carried out without need for much verbal communication between the
experimenters and participants, with written material in Norwegian, English, German and French.
Five observations were omitted from the final data, making the final number of observations n =
65. One of these was a young girl who had answered more than one option in several questions.
This made us doubt the legitimacy of other children’s answers, so we also removed the answers
of three more children at the age of 14, 12 and 10, which we deemed to be to young to fully
understand what they were answering. Finally, there was one participant in the 2D condition
who filled out a questionnaire meant for the immersive VR condition. This included questions
regarding the experience with the VR headset, potentially making the participant aware that we
were using a VR headset. Hence, we were uncertain if this could have affected the participant’s
responses, like previously discussed, and therefore excluded the observations from the analysis.
5.1.3 Stimuli
The stimuli used in the different experimental conditions were very similar to those in study 1. The
devices used to view the pictures were the same, but the pictures themselves were different. In stead
of pictures of Nærøyfjorden, Flamsbana and Aurlandsfjorden, the pictures were of Geirangerfjorden
and Hjørundfjorden. The reason for changing the pictures was that the relevant destination to test
attitudes and intentions towards was different in study 2 than the ones in study 1. In the fall,
Hurtigruten’s ships sail into Hjørundfjorden on the trip from Bergen to Trondheim, and let the
passengers experience this particular fjord. Hence, to test the effects of immersive VR on attitudes
and intentions before and after visiting this destination, the pictures had to be changed. For
examples of the pictures used in the experiment, see appendix B.
65
5.1.4 Procedure
As with study 1, we will describe the procedure of conducting the experiment in this section. The
steps will be explained in detail, to make the experiment replicable, and the reasoning behind
different measures that were taken will also be explained.
Recruitment
The recruitment of participants was done with an invitation that was handed out to passengers of
Hurtigruten at the terminal before they entered the ship. On the first trip, the different translations
of the invitation were printed in separate versions, making the process of handing them out difficult,
as we first had to ask passengers what language they spoke, before handing out the invitation.
Learning from this, we redesigned the invitation for the second trip, fitting all four translations
on the same piece of paper (see appendix D.1). This enabled us to distribute the invitations
by getting the staff at the terminal to include the invitation when handing out the passengers’
boarding passes.
The invitation included a brief description of the general purpose of the study, without revealing
information that could affect the results. In addition, it included information about when and
where the experiment would be conducted, as well as the fact that participants in the study would
be included in a draw to win five gift certificates of NOK 500, which could be used on board the
ship.
When the experiment itself started, we also tried to recruit passengers who walked past us, to get
as many participants as possible, for better statistical power.
Randomization
Randomization was more challenging in the field experiment than in the lab experiment, because
we didn’t have any scheduled time slots for specific participants to be assigned to. This meant that
we didn’t have control over when participants would show up, or how many would show up overall.
We therefore had to assign participants to whichever condition was vacant at the moment, while
simultaneously trying to keep the number of participants in each condition more or less balanced
66
at all times, in case the participants suddenly stopped coming. However, it seems unlikely that
there was any pattern in what order passengers approached us, making the fact that they came
at random times a form of randomization in itself. To prevent couples from revealing the details
of the different conditions to each other, we also felt it necessary to expose couples to the same
condition, although this was at the expense of proper randomization.
Anonymization
On the first trip, the exposure and completion of the two questionnaires were conducted in the
ship’s conference hall. Unfortunately, this was not possible to close off, but it was divided into
two parts, where we kept the 2D and immersive VR conditions separated. We also put up small
booths in the corners of the conference hall, where the participants could be exposed to the pictures
privately. The questionnaires were answered individually at several tables we had put up in the
other end of the conference hall. On the second trip, we were lent two spacious cabins, where we
could conduct the experiment. This ensured a higher degree of anonymity in the exposure part.
The questionnaires were, however, answered at three tables that we had put up near the ship’s
lobby, to minimize waiting time for the exposure part.
To be able to draw winners of the gift certificates, and be able to pair participants’ questionnaires
from the two days, participants had to write their name and cabin number on the front of the
questionnaires. However, they were notified that this information would not be paired with their
answers in the data, and that these pages would be removed as soon as we had paired the two
questionnaires.
In summary, in a field experiment like this, we had more trouble securing full anonymity for the
participants than in the lab, which is to be expected. Most importantly, however, was to ensure
that the participants could not be identified in the data, which we did by removing their identifying
information from the two questionnaires after pairing them.
Briefing
To eliminate problems with language barriers between the experimenters and the participants,
short written instructions as to what to do and how to use the equipment were given to the
67
participants in all four languages previously mentioned (see appendix D.2). The participants
could then read the instructions in their preferred language, and look at the pictures themselves.
The instructions had to be somewhat shorter than in the lab experiment, to make them easier
to understand, but they were efficient in instructing the participants, resulting in few difficulties
during the exposure.
Exposure
As previously mentioned, the exposure took place in the conference hall on the first trip, and in two
separate cabins on the second trip. The participants in the 2D and immersive VR conditions did
not see each other during the exposure, of which the importance has previously been discussed. On
the first trip, rotating chairs were not available, so the participants in the immersive VR condition
were not able to freely turn around. However, many of them did manage to turn their heads
and bodies almost 360 degrees in the chair. Still, there was a visible difference in how much the
participants turned around in the two experiments. This could also be due to the less detailed
descriptions or the fact that the students in the lab experiment were better at adapting to the
new technology used. On the second trip the participants in the immersive VR condition sat in a
rotatable chair.
Like in the lab experiment, the participants in the immersive VR condition did not switch between
the pictures themselves, so that they didn’t press any unwanted buttons that would interrupt the
exposure. Instead, the experimenters switched the pictures when prompted.
Questionnaire 1
The first questionnaire was very similar to the one in the lab experiment, with some alterations to
fit the field setting better. Some of the items were removed, to prevent respondent fatigue. The
measurements will be discussed in detail in a later section.
The questionnaires were printed in the four languages previously mentioned, and were filled out
on paper instead of on a computer. The full Norwegian questionnaire is shown in appendix D.3,
along with the first page of the English, German and French versions. With the questionnaire, the
participants were also given instructions on how to answer the questions, and also the time of the
68
follow-up questionnaire the next day (see appendix D.4). The participants put the questionnaires
in a box on their way out.
Questionnaire 2
After the participants had experienced the destination they had seen pictures of the day before,
they were asked to fill out a second questionnaire (see appendix D.5). The aim of these questions
was to see how the actual emotions and experiences were compared to the predicted ones. Most
importantly we wanted to see if there were any differences in these relationships between those who
had been exposed to the pictures in immersive VR and 2D. There were also questions regarding
destination attitude and behavioral intentions, to see how the measurements had changed after
the actual experience, and if there were any differences between the two groups.
The second questionnaire was filled out in the same place as the first one, with participants putting
it in the same box as they had the previous day.
5.1.5 Measurements
The questionnaire in the field experiment was shortened to make it easier to answer for passenger
who had planned other activities on the ship, by removing one or more items in several of the
different measurements. A second questionnaire was also answered, with many of the same items,
only in retrospective phrasings. These measurements will be marked with T2 in the following,
representing that they were measured at Time 2, meaning after the participants had actually
experienced the destination. The variables that were measured before the actual experience are
similarly marked with T1. Seeing as how the measurements in many cases were identical across
the lab and field experiment, we only report changes in the measurements in this section.
Dependent Variables
Destination attitude T1. Two items were removed from this measurement for the field experiment,
namely the scales with the anchors “uncomfortable/comfortable” and “boring/interesting”. The
remaining three items were unchanged.
69
Behavioral intentions T1. Participants own intentions to travel were removed, as they were already
on a trip. Thus, this measurement only included whether or not they would recommend the trip
to others.
Purchasing Decision. This measurement was removed, as participants had already purchased the
trip with Hurtigruten.
Destination attitude T2. Destination attitude was measured with the same scale as at T1, but
with retrospective phrasing.
Behavioral intentions T2. At T2, the behavioral intentions were measured on a three-item, 11-point
Likert scale, with questions regarding recommendation of Hurtigruten to friends, whether they had
mostly positive things to say about the trip, and intention to travel with Hurtigruten again. The
anchors of the scale were “very unlikely/very likely” and “completely disagree/completely agree”.
Mediating Variables
Predicted emotions T1. The item measuring to what degree the trip would feel meaningful was
removed to shorten the questionnaire.
Predicted experiences T1. The three items measuring predicted sensory experiences were removed,
as well as one item from both predicted affective and intellectual experiences.
Actual emotions T2. The participants’ actual emotions after visiting the destination were measured
on the same four-item, 11-point Likert scale as the predicted emotions in T1, only with retrospective
phrasing.
Actual experiences T2. The same is true for measuring the participants actual experiences after
visiting the destination, with the same four-item, 11-point Likert scale measuring two items of
both affective and intellectual experiences, but not sensory ones.
Satisfaction. A new item was measured, to see how satisfied the participants were with the trip.
The item was measured on an 11-point scale, ranging from -5 (worse than expected) to +5 (better
than expected).
70
Control Variables
Optimum Stimulation Level (OSL). This measurement was removed to make the questionnaire
shorter.
Prior travel experience. Whether or not the participants had previously traveled with Hurtigruten
or been to the destination before, was measured with a three-point scale with the answers “Yes”,
“No” and “Don’t know”.
Prior VR experience. As in the lab experiment, participants’ prior experience with and knowledge
about VR technolgy was measured. In addition, their general experience with new technology was
measured on a single-item, 11-point Likert scale, with the scale anchors “very little experience/very
much experience”.
Experience with the VR headset. Whether or not the participants became nauseated or dizzy, and
if the experience was uncomfortable, was measured the same way as in the lab experiment. This
was also the case for the perceived quality.
Other Variables
The experimenters did not register the participants’ behavior during the exposure in the field
experiment, as they had other assignments during the exposure.
Factor Analysis and Scale Reliability Check
Again, we assumed that the theoretical constructs in our model are correlated, and performed a
factor analysis with oblimin rotation. We considered factor loadings above .60 to be significant,
and did not include variables with factor loadings below this in the final factor solution. With
a sample size between 60 and 70, like ours, an appropriate threshold would be .70 (Hair et al.
2006). However, because this was a field experiment with less control, and because we again had
a reasonably high number of variables, we decided to lower this threshold.
We did separate factor analyses on the variables from T1 and T2, as these cannot be combined in
a factor solution. In the factor analysis from T1, we extracted five factors with an eigenvalue > 1.
71

Like in the lab experiment, we divided some factors, where the variables are different theoretical
constructs that have been previously established, namely the predicted emotions variables and
the affective dimension of predicted experiences, as well as the mental imagery and enjoyment
variables. Thus, we ended up with seven factors. The first item in the predicted emotions scale
was excluded due to cross loading, as well as the third item in the enjoyment scale. Two of the
included variables had factor loadings below the previously mentioned .70, but the remaining had
factor loadings > .70.
In the factor analysis from T2, we extracted four factors with an eigenvalue > 1, but divided the
actual emotions and attitude variables, making it five factors. The second and third item in the
actual emotions scale were excluded due to cross loadings. Two of the included variables had factor
loadings < .70, but again the remaining had factor loadings > .70.
In the scale reliability check, all the extracted factors reached Cronbach’s alpha (α) values > .70.
The predicted emotions (T1), enjoyment, actual emotions (T2) and behavioral intentions (T2)
scales reached Cronbach’s alpha values < .80, which is considered to be a preferable value (Pallant
2010). The remaining scales reached values > .80. Again, two of the scales would have reached
a higher Cronbach’s alpha value if one item had been deleted, but removing items would make
it harder to compare findings to previous research (Pallant 2010). None of the scales have more
than four items, which speaks against an inflated Cronbach’s alpha value because of many items
in the scale (Hair et al. 2006). Detailed results from the factor analysis and scale reliability check
for both T1 and T2 are reported in tables E.3, E.4 and E.5 in appendix E.
5.1.6 Data Analysis
The statistical techniques used to examine the collected data were the same as in the analysis of
the data from the lab experiment, and are explained in chapter 4.
72
5.2 Results
Descriptive Statistics
Descriptive statistics for the combined twelve factors from T1 and T2 are reported in table F.4 in
appendix F. There were 36 observations in the immersive VR condition and 30 observations in the
2D condition.
5.2.1 Test of Assumptions
Independence of Observations
In the field experiment, there was a larger risk of observations influencing each other, because
many of the participants were couples, who potentially could talk about the experiment before it
was ended. This was especially problematic because it lasted over two days. To counteract this, we
tried to assign couples to the same condition, so participants in the different conditions wouldn’t
hear about the other condition from their partner.
Normal Distribution
We checked for skewness and kurtosis levels in the descriptive statistics (see table F.4 in appendix
F), to check for normality. There were 7/12 factors with skewness levels > |1|, all of them negative,
indicating clustering around the high levels of the scale. In addition 7/12 factors had kurtosis levels
> |1|, most of them positive, indicating that these were peaked around certain values. This means
that the assumption of normality is not satisfied. Since we have a sample size which is larger than
30, and most of the test are relatively tolerant to violation of this assumption (Pallant 2010), we
still used parametric tests for the main effects.
Homogeneity of Variance
Levene’s test showed no significant values for any of the factors, meaning that the variance in the
two groups can be viewed as equal (Pallant 2010). The results of the test are shown in tables F.5
73
and F.6 in appendix F.
5.2.2 Main Effects
We first tested for main effects of being exposed to the destination in immersive VR as opposed to
2D. We did this by testing if there were any differences in means between the two groups for both
the dependent variables, mediating variables and control variables, using an independent-samples
t-test. The findings are presented in tables 5.1, 5.2 and 5.3, and explained in the following sections.
Seeing as how this was a field experiment, where circumstances are harder to control, and because
we had a smaller sample size this time, we tested the data with 90% confidence intervals, meaning
that results with p-values < .10 are regarded as significant. This should be kept in mind when
examining the results of the experiment.
Main Effects on Dependent Variables
For the dependent variables, the only significant effect of immersive VR (vs. 2D), was on behavioral
intentions (T2)(diff. = -.67593, p = .080), meaning the second time the participants were asked,
after traveling to the destination. This factor includes whether the participants would recommend
the trip with Hurtigruten to others, had mostly positive things to say about it, as well as whether
they were likely to travel with Hurtigruten again. However, contrary to our predictions, the
difference in means between the two groups was negative, meaning that the participants in the 2D
condition had more favorable intentions than those in the immersive VR condition. This difference
was significant at the 10% level. The complete results can be seen in table 5.1.
There was, however, no significant effect on the item regarding whether the participants would
recommend the trip (T2), meaning that the change from T1 to T2 was caused by the two addi-
tional items added to the behavioral intentions factor at T2. Testing these items for main effects
separately reveals that the only significant effect is on the item regarding if the participants were
likely to travel with Hurtigruten again (diff = -1.367, p = .034). This means that it was this
specific item that was responsible for the negative effect on behavioral intentions (T2), and not the
74
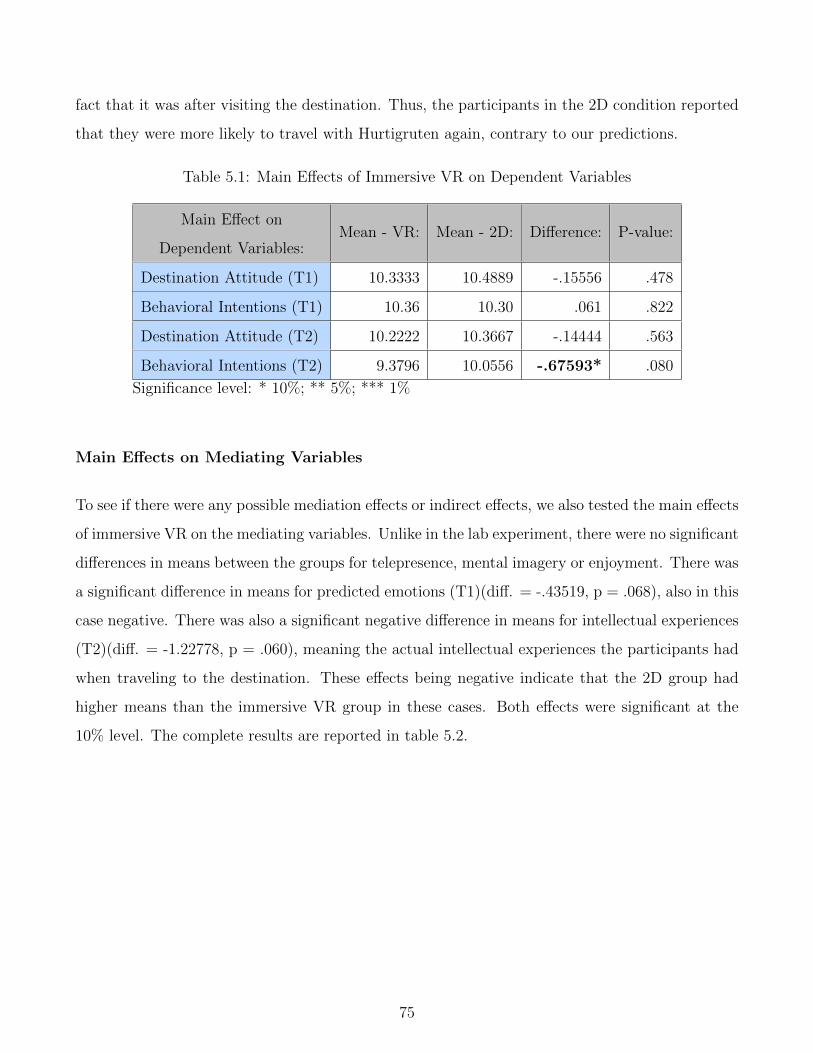
fact that it was after visiting the destination. Thus, the participants in the 2D condition reported
that they were more likely to travel with Hurtigruten again, contrary to our predictions.
Table 5.1: Main Effects of Immersive VR on Dependent Variables
Main Effect on
Dependent Variables:Mean - VR: Mean - 2D: Difference: P-value:
Destination Attitude (T1) 10.3333 10.4889 -.15556 .478
Behavioral Intentions (T1) 10.36 10.30 .061 .822
Destination Attitude (T2) 10.2222 10.3667 -.14444 .563
Behavioral Intentions (T2) 9.3796 10.0556 -.67593* .080
Significance level: * 10%; ** 5%; *** 1%
Main Effects on Mediating Variables
To see if there were any possible mediation effects or indirect effects, we also tested the main effects
of immersive VR on the mediating variables. Unlike in the lab experiment, there were no significant
differences in means between the groups for telepresence, mental imagery or enjoyment. There was
a significant difference in means for predicted emotions (T1)(diff. = -.43519, p = .068), also in this
case negative. There was also a significant negative difference in means for intellectual experiences
(T2)(diff. = -1.22778, p = .060), meaning the actual intellectual experiences the participants had
when traveling to the destination. These effects being negative indicate that the 2D group had
higher means than the immersive VR group in these cases. Both effects were significant at the
10% level. The complete results are reported in table 5.2.
75
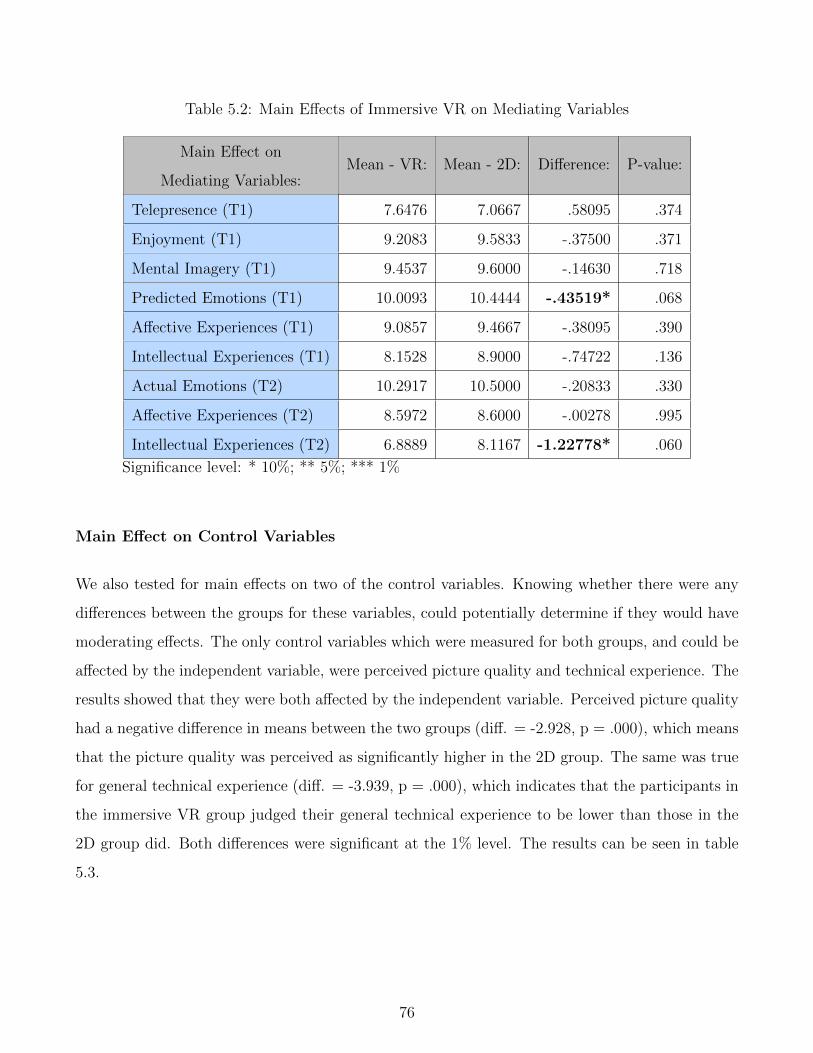
Table 5.2: Main Effects of Immersive VR on Mediating Variables
Main Effect on
Mediating Variables:Mean - VR: Mean - 2D: Difference: P-value:
Telepresence (T1) 7.6476 7.0667 .58095 .374
Enjoyment (T1) 9.2083 9.5833 -.37500 .371
Mental Imagery (T1) 9.4537 9.6000 -.14630 .718
Predicted Emotions (T1) 10.0093 10.4444 -.43519* .068
Affective Experiences (T1) 9.0857 9.4667 -.38095 .390
Intellectual Experiences (T1) 8.1528 8.9000 -.74722 .136
Actual Emotions (T2) 10.2917 10.5000 -.20833 .330
Affective Experiences (T2) 8.5972 8.6000 -.00278 .995
Intellectual Experiences (T2) 6.8889 8.1167 -1.22778* .060
Significance level: * 10%; ** 5%; *** 1%
Main Effect on Control Variables
We also tested for main effects on two of the control variables. Knowing whether there were any
differences between the groups for these variables, could potentially determine if they would have
moderating effects. The only control variables which were measured for both groups, and could be
affected by the independent variable, were perceived picture quality and technical experience. The
results showed that they were both affected by the independent variable. Perceived picture quality
had a negative difference in means between the two groups (diff. = -2.928, p = .000), which means
that the picture quality was perceived as significantly higher in the 2D group. The same was true
for general technical experience (diff. = -3.939, p = .000), which indicates that the participants in
the immersive VR group judged their general technical experience to be lower than those in the
2D group did. Both differences were significant at the 1% level. The results can be seen in table
5.3.
76

Table 5.3: Main Effects of Immersive VR on Control Variables
Main Effect on
Control Variables:Mean - VR: Mean - 2D: Difference: P-value:
Perceived Picture Quality 7.47 10.40 -2.928*** .000
Technical Experience 4.53 8.47 -3.939*** .000
Significance level: * 10%; ** 5%; *** 1%
5.2.3 Other Findings
Because of the exploratory nature of this study and the number of different possible relationships
between the factors, we will only report significant findings in this section. The findings are related
to perceived picture quality as a control variable and a moderator.
Main Effects Controlled for Perceived Picture Quality
When testing main effects of immersive VR on the dependent variables, while controlling for
perceived picture quality, we found that there was a significant difference between the means of
the two groups for behavioral intentions (T1)(diff. = .737, p = .021). This effect was positive,
meaning that it was more likely that the participants would recommend the trip to others if they
had seen the pictures in immersive VR than in 2D, when controlling for perceived picture quality.
The perceived picture quality was evaluated at the mean score of 8.80. The results can be seen in
table 5.4
This effect was not found for behavioral intentions (T2), where there was no significant difference
when controlling for perceived picture quality. However, this factor consists of more items than
behavioral intentions (T1), namely whether the participants had mostly positive things to say
about the trip, and if they would travel with Hurtigruten again. Therefore, we also tested the
effect of immersive VR on the item regarding whether the participants would recommend the trip
to others (T2) separately, while controlling for perceived picture quality. This did not yield any
significant results either.
77
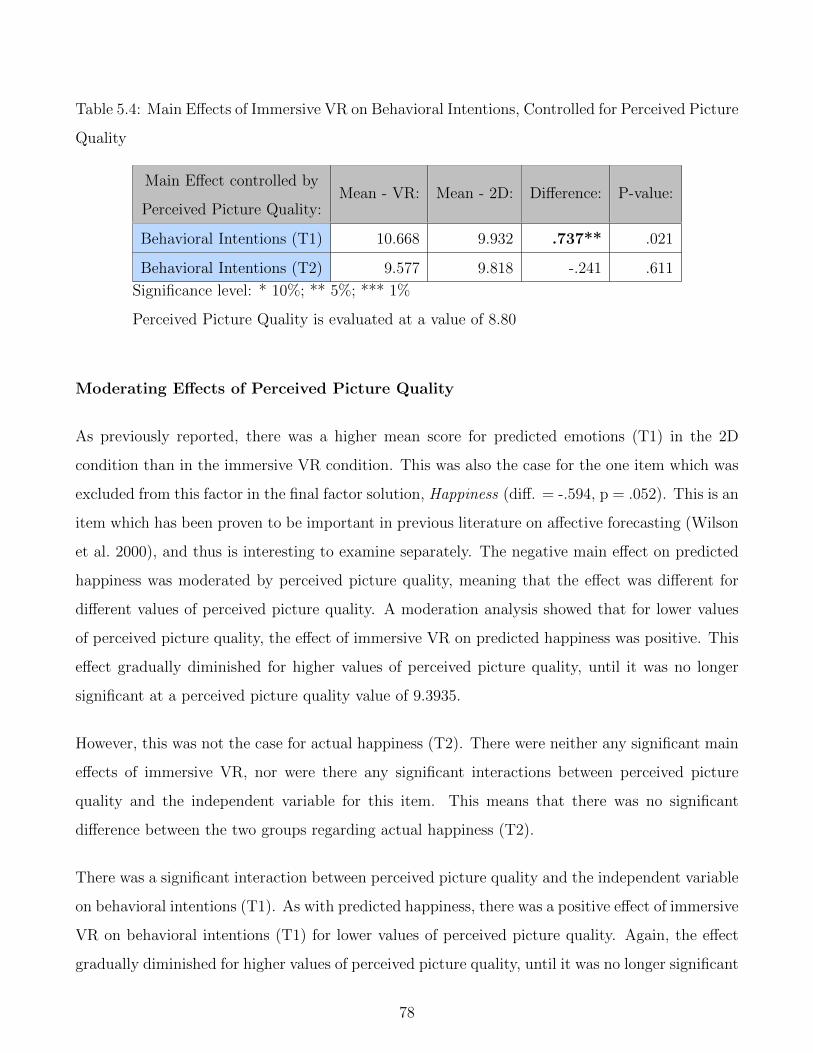
Table 5.4: Main Effects of Immersive VR on Behavioral Intentions, Controlled for Perceived Picture
Quality
Main Effect controlled by
Perceived Picture Quality:Mean - VR: Mean - 2D: Difference: P-value:
Behavioral Intentions (T1) 10.668 9.932 .737** .021
Behavioral Intentions (T2) 9.577 9.818 -.241 .611
Significance level: * 10%; ** 5%; *** 1%
Perceived Picture Quality is evaluated at a value of 8.80
Moderating Effects of Perceived Picture Quality
As previously reported, there was a higher mean score for predicted emotions (T1) in the 2D
condition than in the immersive VR condition. This was also the case for the one item which was
excluded from this factor in the final factor solution, Happiness (diff. = -.594, p = .052). This is an
item which has been proven to be important in previous literature on affective forecasting (Wilson
et al. 2000), and thus is interesting to examine separately. The negative main effect on predicted
happiness was moderated by perceived picture quality, meaning that the effect was different for
different values of perceived picture quality. A moderation analysis showed that for lower values
of perceived picture quality, the effect of immersive VR on predicted happiness was positive. This
effect gradually diminished for higher values of perceived picture quality, until it was no longer
significant at a perceived picture quality value of 9.3935.
However, this was not the case for actual happiness (T2). There were neither any significant main
effects of immersive VR, nor were there any significant interactions between perceived picture
quality and the independent variable for this item. This means that there was no significant
difference between the two groups regarding actual happiness (T2).
There was a significant interaction between perceived picture quality and the independent variable
on behavioral intentions (T1). As with predicted happiness, there was a positive effect of immersive
VR on behavioral intentions (T1) for lower values of perceived picture quality. Again, the effect
gradually diminished for higher values of perceived picture quality, until it was no longer significant
78
at a perceived picture quality value of 10.4631.
Again, this was not the case for behavioral intentions (T2). However, seeing as how the factor
behavioral intentions (T1) only consists of one item, whether the participants would recommend
the trip to others, we also tested if there was a moderating effect of perceived picture quality
on that item from behavioral intentions (T2). There turned out to be a significant interaction
between perceived picture quality and the independent variable for whether the participants would
recommend the trip (T2). This means that quality acted as a moderator for the effect of immersive
VR on this item, like it did for the same item in T1. The effect was positive for low values of
perceived picture quality, before it gradually diminished for higher values of perceived picture
quality, until it was no longer significant at a value of 9.6509.
5.2.4 Summary of Findings
There was a significant negative main effect of immersive VR on behavioral intentions (T2), but
not (T1). There was also a significant negative main effect of immersive VR on actual intellec-
tual experiences (T2), but not predicted intellectual experiences (T1). Conversely, there was a
significant negative main effect of immersive VR on predicted emotions (T1), but not for actual
emotions (T2). In addition, there were significant negative main effects on the control variables
perceived picture quality and technical experience.
When controlling for perceived picture quality, there was a positive significant effect of immersive
VR on whether the participants would recommend the trip to others (T1), but not on the same
item at T2.
Perceived picture quality moderated the relationship between immersive VR and whether the
participants would recommend the trip to others (T1), with a positive effect for lower values of
perceived picture quality. This was also the case for the same item at T2, contrary to when
controlling for quality.
Finally, perceived picture quality moderated the relationship between immersive VR and predicted
79
happiness, also with a positive effect for lower values of perceived picture quality, but this was not
the case for actual happiness (T2).
5.3 Discussion of Findings
Most of the significant effects in study 2 were in the opposite direction of what we had predicted,
and also in the opposite direction of what study 1 had shown. Somewhat surprisingly, it seems
that exposure to the destination in 2D was more effective in inducing different effects than im-
mersive VR, in this study, with a different sample and a different experiment setting. As one of
the objectives of the second study was to investigate whether the effects from study 1 also applied
for a sample closer to the target group of destination marketing, these findings are very interest-
ing. Even more important was the fact that the field experiment was conducted in a completely
different setting than the lab experiment, where the relevant destination was both physically and
psychologically much closer for the participants in this experiment. It seems that immersive VR
does not have the same effects in this situation, which indicates that the physical and psycho-
logical distance to the destination has an impact on how participants predict their emotions and
experiences. While the students in study 1 were at their place of study, trying to predict what it
would be like to go on a hypothetical trip some unspecified time in the future, the participants in
study 2 were actually on the ship taking them to this destination the next day. This could be one
of the reasons for the different findings in the two studies, and brings forth important implications
regarding the effectiveness of immersive VR in different situations. However, it seems that some of
the differences in the effects can also be explained by the importance of perceived picture quality
in this sample, which will be discussed in a later section.
5.3.1 Changes From T1 to T2
In this exploratory field study, we did not observe many large differences between before and after
the participants had visited the destination. There was a difference in behavioral intentions for
the two times, but this difference was caused by new items in the factor at T2, specifically by
80

whether the participants were likely to travel with Hurtigruten again. This effect was negative,
meaning that those who saw the pictures in 2D stated that they were more likely to travel with
Hurtigruten again than those who saw the pictures in immersive VR. It’s difficult to draw any
conclusions as to what was the reason for this discrepancy, but one possibility could be that the
participants were more disappointed by the actual destination after seeing it in immersive VR.
This was not the case, however, as the item measuring satisfaction with the trip did not show any
significant differences between the two conditions. Another possible explanation could be that the
participants felt that the VR headset was somewhat complicated and unfamiliar, unconsciously
making them less willing to recommend the trip. This also seems unlikely, as this would probably
affect satisfaction as well, which we have seen is not significantly different for the two groups. It’s
possible that there were other influencing factors, unrelated to the experiment itself, like the fact
that the participants didn’t like their cabin or the food on board the ship. However, these factors
should not cause any differences between the groups, because the participants were randomly
assigned to the different groups, and the sample size was substantial. Still, it’s possible that our
assumption of two equal groups might not be satisfied, and that with even more participants and
a better system for randomization, the difference would be evened out between the groups.
There was a significant difference between the two groups for predicted emotions (T1), but not for
actual emotions (T2). By inspecting table 5.2, we see that the difference in predicted emotions
(T1) compared to actual emotions (T2) is caused by the fact that the value increased for the
immersive VR group from T1 to T2. This means that they predicted less favorable emotions after
seeing the pictures in immersive VR, than those who saw them in 2D, but when seeing the actual
destination, they reported the same feelings as the other group. This indicates that it was not
how the participants experienced the actual destination after viewing it with different technologies
that was different, as they had the same experience of the actual destination.
When it comes to the difference between the groups in actual intellectual experiences (T2), as
opposed to no difference in predicted intellectual experiences (T1), this was caused by the fact
that this value decreased in the immersive VR condition from T1 to T2. This means that the
participants in the 2D condition had a more or less accurate prediction of what they would actually
experience, whereas the participants in the immersive VR condition didn’t. Interestingly, it’s not
81
that the participants in the immersive VR condition made a higher prediction than those in the
2D condition, but rather reported lower values for the actual experiences (T2). Again, it’s not
clear what caused this effect, but a possible explanation is that participants in the immersive VR
condition already had had some of these intellectual experiences while viewing the pictures. This
could have led to less of an intellectual experience when seeing the actual destination, resulting
in a “been there done that”-effect. Seeing as how the other effects in the experiment point to 2D
having a greater impact overall, however, this might not be the case.
Another interesting aspect of this study is the weather conditions. The weather in the pictures
shown to the participants was very good, which was also the case for the weather on both of
the trips we took with Hurtigruten. Had the actual weather been significantly worse, making the
actual experience less enjoyable and memorable, there might have been more pronounced effects
of the manipulation, seeing as how the participants might have remembered that experience more
than the real one.
5.3.2 Technical Experience
The fact that the participants in the immersive VR condition reported significantly lower scores
for their general technical experience is also an interesting finding. Assuming that the groups were
in fact equal for all other factors than our manipulation, this difference is an effect of exposure to
the destination in immersive VR as opposed to 2D. The degree of previous technical experience
should, in theory, not have been affected by any treatment, as of course, the treatments were not
able to affect experience retroactively. However, it seems that the participants in the immersive
VR condition might have been primed by the fact that the VR headset was a new and perhaps
unfamiliar technology, making them estimate their previous technical experience at a lower level.
As such, there was a difference with immersive VR as a reference point, compared to 2D. This
has potential implications for the other measurements, if the participants in the immersive VR
condition found the technology to be technically challenging, and thus less enjoyable. However,
there was no difference in enjoyment between the two groups. Still, there could be other, unknown
implications, that affect the results.
82
5.3.3 The Role of Perceived Picture Quality
When it comes to the role of perceived picture quality, we see that it had an important impact on
how effective the different stimuli were in affecting different variables. It seems that the quality
of the immersive VR pictures, which was perceived as poor relative to the 2D pictures, to some
extent was what reduced the effects. Both for whether the participants would recommend the
trip and predicted happiness, quality played a crucial role in how the results turned out. Had the
quality of the immersive VR pictures been better, the effects would be reversed, and immersive
VR would have had a more sizable effect than 2D.
In summary, the results of this experiment partly contradict the results from the previous exper-
iment. However, it’s evident that the quality of the immersive VR headset display was not good
enough to compete with the smartphone’s display, and that this had more of an impact on the
test subjects in this experiment than on the students in the lab experiment, perhaps because of
the different situation they were in. There was a significantly lower mean score for quality in the
immersive VR group also in the lab experiment, but this didn’t seem to have the same impact on
the results as in study 2. This brings forth implications for how to use immersive VR, which will
be discussed in chapter 6.
83
Chapter 6: General Discussion and
Conclusion
6.1 Discussion of Findings
The main goal of this thesis was to examine how immersive VR technology can be utilized in
destination marketing. We did this by investigating how immersive VR can influence consumer
outcomes both directly and indirectly. In our study, the consumer outcomes referred to are atti-
tudes towards a destination, intentions to purchase/travel to the destination, and the consumers’
actual decision to purchase tickets to the destination. Though no direct effects of immersive VR
exposure on the consumer outcomes were significant, our research reveals that immersive VR ex-
posure affects the consumer outcomes indirectly, through different important mediators, but is also
held back by poor quality, compared to today’s existing alternatives.
Study 1 showed that immersive VR was not more effective in creating favorable destination atti-
tudes, behavioral intentions and purchasing decision than 2D pictures on a smartphone, with the
technology and marketing material we used. However, we found indirect effects through five differ-
ent mediators, namely telepresence, enjoyment, mental imagery, predicted emotions and predicted
experiences. Both enjoyment and mental imagery acted as mediators in the positive indirect effect
of immersive VR on destination attitude and behavioral intentions on their own, whereas the other
three mediators were only part of an indirect effect when in a serial mediation. Predicted emotions
and predicted experiences were not affected by immersive VR itself. However, as second mediators
(M2), with either telepresence, enjoyment or mental imagery as first mediators (M1), they had a
positive impact on all the consumer outcomes, even purchasing decision. As for telepresence, this
means that it did not work as a mediator in the indirect effect of immersive VR on the consumer
outcomes alone, because it had no direct effect on consumer outcomes. Instead, it worked as a
facilitator for the effects of predicted emotions and experiences, making it a crucial factor never-
84
theless. As mentioned, there was an indirect effect of immersive VR on destination attitude and
behavioral intentions through enjoyment and mental imagery, but these factors did not influence
actual purchasing decision, which is perhaps the most important consumer outcome. In order to be
part of a positive indirect effect on the actual purchasing decision, moving the consumers from just
having an intention to purchase to actually purchasing, they needed to also go through predicted
emotions and predicted experiences. This accentuates the importance of predicted emotions and
predicted experiences as factors. Thus, all five mediators were important for immersive VR to have
a substantial indirect impact on consumer outcomes. These findings bring forth clear implications
for how to best develop marketing material for immersive VR technology, in order to make this an
effective marketing tool, which will be discussed in the next section.
While study 1 was conducted with students at The Norwegian School of Economics (NHH) as
participants, study 2 aimed to test if the findings were true also in a more realistic setting, with
participants in the target group for destination marketing. An even more important difference
was the fact that the participants had already purchased tickets and were on the ship taking them
to the destination. This meant that the psychological and physical distance to the destination
that immersive VR exposure was supposed to create predictions for, was far less than for the
participants in study 1. Thus, study 2 also aimed to examine if the findings from study 1 applied
for participants in a completely different situation than in the lab experiment, much closer to the
destination they were seeing pictures of. The results showed that this was not the case. The direct
effects of immersive VR on consumer outcomes were either non-existing or negative, meaning that
the 2D pictures had more impact on these outcomes. However, the big difference was how much the
participants in this setting were affected by what was viewed to be poor quality of the immersive
VR pictures. When controlling for perceived picture quality or including it as a moderator, several
of the negative effects became non-significant, and several other effects emerged as positive. This
shows that the relatively poor picture quality of the immersive VR pictures is indeed an important
reason for why the findings were different than in study 1. In addition, the reported previous
technical experience was lower for those in the immersive VR condition, which could mean that
the VR headset was perceived as being a new and unfamiliar technology, making participants
adjust their reference point and report less previous technical experience. These findings show
that immersive VR technology could be more successful if the quality was better, which also
85
brings forth important implications for marketers. These will also be discussed in the next section.
In summary, our research shows that immersive VR has the potential to influence consumer out-
comes, but that the right conditions need to be in place for this to happen.
6.2 Implications
In the following, we will discuss implications of our findings. We will begin with theoretical im-
plications, meaning the implications our findings have for the literature related to virtual reality
in marketing and consumer behavior. We will then move on to discussing the managerial impli-
cations, meaning the practical implications our findings have for marketers and decision-makers,
and what our findings can provide of insight when making decisions about the use of immersive
VR technology in marketing.
6.2.1 Theoretical Implications
The results of our research bring forth several theoretical implications. First, the vast majority
of previous research is concerned with the role of telepresence as an explanatory mechanism of
the relationship between VR exposure and consumer outcomes. Our research provides a more
nuanced picture of how telepresence actually affects the consumer outcomes. Contrary to previous
research (e.g. Suh and Y. E. Lee 2005; Suh and Chang 2006; Li, Daugherty, and Biocca 2002),
our research suggests that telepresence in itself does not affect the consumer outcomes. The
indirect effects of immersive VR exposure on the consumer outcomes were actually a result of
subsequent mechanisms facilitated by telepresence. However, this does not mean that telepresence
is not important. Telepresence facilitates enjoyment, predicted emotions and predicted experiences,
which means that telepresence is an important mediator in the processing mechanisms of immersive
VR exposure. Secondly, we contribute to the literature by investigating other possible mechanisms
that can explain the indirect relationship between immersive VR exposure and the consumer
outcomes. Previous research has studied the mediating role of enjoyment and mental imagery on
86

the relationship between VR exposure and brand attitudes and purchasing intentions (Cho, Wang,
and Fesenmaier 2002; Hyun and O’Keefe 2012; Dobrowolski et al. 2014). However, our research
suggests that although enjoyment and mental imagery affect destination attitude and behavioral
intentions, they don’t lead to actual purchase. This leads us to our most important contribution to
the literature, which is the importance of predicted emotions and predicted experiences. In order
for consumers to go from intending to purchase to actually purchasing, the indirect effect also has
to go through predicted emotions and predicted experiences.
This means that an important part of immersive VR in marketing is its ability to indirectly affect
peoples predicted emotions (affective forecasts) and predicted experiences through telepresence,
enjoyment and mental imagery, which is a novel contribution to the literature. Both predicted
emotions and experiences were drivers of choice, meaning that they could influence purchasing
decision (ref: tables 4.4, 4.5 and 4.6). Thus, our research reveals that both predicted emotions and
predicted experiences are important mediators in the indirect relationship between immersive VR
and the consumer outcomes. Moreover, we contribute to the literature, as one of the first studies
in the research field to show the processing mechanisms leading to actual purchase.
Our research has also uncovered that the indirect effects of immersive VR exposure are not equal
across different settings, as the results were different in the field experiment than in the lab exper-
iment. This implies that participants who are closer to the destination they are seeing pictures of,
both physically and psychologically, do not respond to immersive VR exposure the same way as
participants in the lab, which is also an important contribution to the literature.
Another important contribution to the literature is the fact that we have uncovered a hierarchy
of effects. The previously researched telepresence, enjoyment and mental imagery were connected
mainly to the channel experience, whereas the newly uncovered predicted emotions and predicted
experiences were connected directly to the attitude object. This again underlines the importance
of predicted emotions and predicted experience, because they have the power to actually influence
the consumer outcomes.
Finally, our study revealed that the quality of the immersive VR material, meaning the resolution
of the pictures and the precision of the movement tracking, moderated the relationship between
87
immersive VR exposure and the consumer outcomes. Steuer (1992) refers to the resolution of a
sensory channel as sensory depth, which is an important part of vividness. Therefore it makes sense
that low perceived quality of immersive VR material has a moderating effect on the relationship
between immersive VR and consumer outcomes.
6.2.2 Managerial Implications
As mentioned, the findings in the two studies also give rise to several managerial implications.
First, it’s important for marketers and companies that are considering investing in developing
marketing material for use in immersive VR headsets, to be aware that the broadly available
equipment might not provide sufficient quality at this point. There are different immersive VR
headsets on the market, with different quality, but headsets with superior quality, like the HTC Vive
(Eadicicco 2016), are still expensive, and thus not available to the majority of consumers as of yet.
In addition, they often need to be connected to a powerful, expensive computer (Eadicicco 2016),
making them impractical. The VR headset used in this study was the Samsung Gear VR, which
does not need a cable connecting it to a computer, as it uses a smartphone to create the images.
This, however makes the quality suffer, not just in terms of resolution, but also in the degree to
which there are lags in the movement, when the users move their heads (Eadicicco 2016). However,
the VR industry is fast-growing, and advances in the technology happen fast (Terdiman 2016).
For instance, Google have started developing their own VR headsets (Google n.d.), which could
help develop the technology and make it more available to the mainstream market. PlayStation
has also started selling VR headsets with their gaming consoles, that are of high quality, compared
to the Samsung Gear VR (Prasuethsut 2016), which is potentially making higher-quality VR
headsets more available to people. This could be a good place to start with destination marketing
efforts, with immersive VR demos that are downloadable from the PlayStation Store. However, the
consumers using PlayStation VR might not be in the target group of most destination marketing.
It’s important to remember that the main target group for most destination marketing might not
be a group that is good at adapting to new technology. In study 2, we found that the group who
were exposed to the destination in immersive VR reported a lower score for previous technical
88
experience. Seeing as how the exposure to the destination shouldn’t have had any retroactive
effects, there shouldn’t have been a difference between the groups for this measurement, assuming
that the sample size was large enough and that the participants were randomly assigned to the
groups. Therefore, this finding indicates that the exposure to the destination in immersive VR
made the participants underestimate how much technical experience they had, compared to the
other group, implying that they found the VR headset to be somewhat technically advanced. This
is relevant for marketers, as this means that it’s important that improvement of the quality the
equipment produces doesn’t lead to the equipment getting overly advanced, so the target group
doesn’t use it.
In addition, the differences in study 1 and study 2 uncovered that immersive VR exposure might
not be as effective in situations where the consumers are physically and psychologically closer to
the destination they are seeing pictures of. This could potentially be because the pictures are more
impressive when the consumers haven’t already formed a clear expectation of what it would be like
to visit the destinations, which also brings forth important implications regarding for what type
of advertising immersive VR technology should be used. Based on our findings, marketers should
direct immersive VR advertising at consumers who are not physically and psychologically close to
the destinations being advertised, meaning that it can best be applied in consumers’ everyday life,
where immersive VR content makes a destination seem more attractive.
Based on the findings of study 1, we also provide several recommendations for marketers, in regards
to how they should design marketing material for use with immersive VR technology. The content
should stimulate the five different factors which we found to be important mediators, so the effect
of these indirect paths can be strong enough to counteract whatever was reducing the direct effect
in our study.
First of all, the three first mediators (M1) in our findings need to be stimulated. Enjoyment is
very important, meaning that marketers must develop content that is enjoyable for the consumer
to watch. This can be done by making sure that the equipment is comfortable to wear and
that the quality and movement tracking is good, reducing negative impulses. In addition, the
pictures or videos should be enjoyable, either by being pleasant and agreeable or exciting and
thrilling, depending on the type of destination being advertised. Furthermore, the immersive
89

VR experience needs to stimulate telepresence, which can be done by ensuring a high degree of
vividness and interactivity (Hyun, S. Lee, and Hu 2009). There are many measures that can help
this, for instance using videos instead of pictures, preferably using a personal point of view, making
the consumers feel like they are in the destinations themselves. Headphones with sound can also be
utilized, to block out the real world even more. Interactivity can be helped by enabling people to
maneuver to different places and angles by looking at that point for a given number of seconds, or
even with technology that allows the user to physically move around, like the HTC Vive (Eadicicco
2016). Mental imagery must also be induced, by utilizing the capacity of immersive VR to provide
information, through rich pictures and videos, accurately depicting the destination. In addition,
seeing as how mental imagery is related to telepresence (Hyun and O’Keefe 2012) many of the
same measures apply.
The second mediators (M2) in our findings must also be stimulated, namely predicted emotions and
predicted experiences. This is because although some of the first mediators mentioned above led
to favorable destination attitudes and behavioral intentions, they did not affect actual purchasing
decision, which predicted emotions and predicted experiences did. To stimulate favorable predicted
emotions and experiences, the pictures and videos should have appealing motives. Depending on
the type of destination being advertised, the marketing material should also highlight the prominent
features of the destination to make consumers focus only on this, and not on consequences of going
on the vacation, in accordance with V. Patrick and D. MacInnis (2003). In addition, these second
mediators would be enhanced by stimulating the first mediators preceding them.
In short, the quality of immersive VR headsets available to the mass market needs to improve,
and marketers need to develop content that stimulates the aforementioned factors, for immersive
VR to be an effective marketing tool.
6.3 Limitations
There are potential limitations as to how the two experiments were conducted, specifically re-
garding whether the external validity of the lab experiment and the internal validity of the field
90

experiment were properly ensured. The lab experiment was thoroughly controlled, and thus the
internal validity was quite good. Using a realistic alternative to immersive VR as the control stim-
ulus contributed to the external validity as well. However, the sample group consisting of students
might not have been representative for the target group for most destination marketing, seeing
as how students often don’t have much space in their budget for traveling. The sample group in
the field experiment was more representative, as they were actual passengers on Hurtigruten, but
being a field experiment, the degree of control was somewhat lower. For instance, the participants
in the VR condition could have talked about their experiences with the VR headset to people they
were traveling with, making these want to participate only to try this technology, and there could
also have been word of an experiment involving VR on the ship. However, we tried to counteract
this by giving the participants strict notice not to speak to anyone about the experiment and by
assigning couples to the same condition, as mentioned. In addition, we conducted the field experi-
ment very similarly as the lab experiment, trying to ensure internal validity in the field experiment
as well, with only minor differences in how segregated participants in the same condition were, as
well as the in randomization process.
Another possible limitation with our research is the scope of the study, specifically that we tested
for a wide array of components in the same experiment. As mentioned in the introduction, the
two experiments were more comprehensive than what we have reported in this thesis. In addition
to questions regarding the mediators and dependent variables we have reported in this thesis, the
questionnaires also contained questions regarding connectedness to nature, self-concept connection,
positive uncertainty, availability and anticipated regret. Although the fact that we only reported
the measurements relevant to our research question is not a problem in itself, measuring many
different things could have influenced the results of the measurements relevant to us, because of
respondent fatigue. However, the questionnaires were completed in 10-15 minutes, which makes it
unlikely that the respondents couldn’t answer the questions properly because of fatigue.
91

6.4 Further Research
Despite the fact that there is a lot of research related to the use of VR in marketing, only a limited
number of studies investigate the effects of immersive VR. Immersive VR technology is able to
provide a much more sensory rich virtual environment than non-immersive VR technology because
the user is completely enclosed in the virtual environment (Mills and Noyes 1999). Thus, more
research is needed in order to establish whether immersive VR technology is more effective than
non-immersive VR technology when it comes to influencing consumers’ brand attitudes, behavioral
intentions, brand knowledge, and purchasing decisions. This could be done by replicating previous
research, but using immersive/non-immersive VR as the independent variable.
Corroborating findings would further establish the credibility of our research, and strengthen the
literature on VR related marketing in general. The fact that our findings are inconsistent with
previous research in the sense that we did not find any significant direct effects of immersive VR
exposure on destination attitudes and purchasing intentions, calls for further investigation to un-
cover why that is. Furthermore, the equipment used in our experiments did not allow for dynamic
movement, meaning that the participants could not move around in the virtual environment as
their movement was restricted to turning their head in all directions. It would be interesting to see
whether the results would be different if a more sophisticated immersive VR technology was used.
We therefore suggest replicating both Study 1 and Study 2, but using a different head-mounted
display that allows the participants to move around and interact with 3D objects in the virtual en-
vironment, for instance the HTC Vive. This would increase both the quality and the interactivity
of the virtual experience (Steuer 1992).
Further research should investigate how the consumer outcomes are affected by manipulating
different aspects of the immersive VR experience (content), in stead of only comparing immersive
VR with non-immersive VR. This could potentially yield valuable insight into which dimensions
of the immersive VR experience are most important when it comes to influencing brand attitudes,
behavioral intentions and purchasing decision. For instance, future research could try to stimulate
more telepresence by including more dimensions, such as sound, video with a personal point of
view and responsive gloves. By using a multi-factor experimental design to assess the individual
92
impact of each sensory dimension, as well as the combined effects, researchers would gain insight
into which dimensions are most important in creating vivid and interactive content for immersive
VR. This would further expand the theoretical framework of telepresence (Steuer 1992). Although
such experiments would be expensive, the benefit of this knowledge would likely outweigh the cost.
As previously mentioned, some of the data collected in the two experiments are related to theoret-
ical constructs that are beyond the scope of this thesis. However, exploring these constructs could
also yield further insight into the relationship between immersive VR and consumer behavior, thus
contributing to a deeper understanding of this relationship. For instance, it would be interesting
to investigate to what extent immersive VR technology can stimulate connectedness to nature,
seeing as how new technology generally is perceived as a contrast to pure and untouched nature.
In addition to telepresence and mental imagery, the perceived availability of a destination could
also be affected by immersive VR exposure, meaning the perceived psychological distance to the
destination. Positive uncertainty could potentially work against the effectiveness of immersive VR
technology, if the consumers value the excitement of not knowing what the destination is like be-
fore traveling there. Thus, studies should be conducted to examine whether the highly vivid and
interactive qualities could have a negative effect in tourism marketing because of a “been there
done that” effect, where the consumers don’t feel the need to visit a destination because they have
already experienced it virtually. The potential impact of these constructs on the relationship be-
tween immersive VR and consumer outcomes should be explored further in future research, along
with other potential mediators.
Apart from our study, the impact of VR exposure on actual purchasing decision is relatively un-
known. Hence, more research is needed to fully understand how immersive VR can influence actual
purchasing decision. In addition, the context of our study is tourism and destination marketing.
Since tourism products are experientially demanding (Hyun, S. Lee, and Hu 2009), further research
is needed to investigate how consumer outcomes are affected by immersive VR exposure for prod-
ucts whose most salient attributes are functional or symbolic, rather than experiential. Previous
research suggests that the effect of VR on attitudes, intentions and knowledge are stronger for
experiential products than for functional products (Suh and Y. E. Lee 2005), but this research is
based on the use of non-immersive VR.
93
Our research is among the first to investigate the effects of predicted emotions and predicted
experiences, facilitated by immersive VR exposure. These variables have not previously been
established as important mediators in VR related research, meaning that further research is needed
in order to firmly establish the impact of predicted emotions and predicted experiences related to
VR in marketing.
6.5 Conclusion
The purpose of this study was to investigate if and how marketers can use immersive VR to effec-
tively advertise tourist destinations. More specifically, the aim was to investigate how exposure to
a destination in immersive VR impacts destination attitude, behavioral intentions and purchasing
decision. The effects we wanted to investigate were both the direct effects and the underlying
processing mechanisms, namely telepresence, enjoyment, mental imagery, predicted emotions and
predicted experiences. Through our research, we have found that the indirect effects of immersive
VR on consumers’ destination attitude, behavioral intentions and actual purchasing decision are
stronger than those of the common technology used today, when the indirect effect goes through
telepresence, enjoyment and mental imagery, followed by predicted emotions and predicted ex-
periences. These findings provide new insight into how VR exposure is processed by consumers,
specifically by uncovering two new processing mechanisms in predicted emotions and predicted ex-
periences, and mapping how these work together with telepresence, enjoyment and mental imagery.
This is important knowledge to marketers and decision-makers today. In addition, our research
provides a more nuanced perspective on telepresence as a mediating mechanism than what has
previously been uncovered in the literature.
Our conclusion is that immersive VR technology potentially can become a powerful marketing
tool in destination marketing, but isn’t quite ready yet. However, with better quality and content
developed specifically to stimulate the five factors we have shown to be mediators in the indirect
effect, immersive VR technology can be used as a more effective medium to advertise tourist
destinations, than today’s prevailing technology.
94
Chapter 7: References
Ahn, Sun Joo and Jeremy N Bailenson (2011). “Self-endorsing versus other-endorsing in virtual
environments”. In: Journal of Advertising 40.2, pp. 93–106.
Babin, Laurie A and Alvin C Burns (1997). “Effects of print ad pictures and copy containing
instructions to imagine on mental imagery that mediates attitudes”. In: Journal of Advertising
26.3, pp. 33–44.
Baron, Reuben M and David A Kenny (1986). “The moderator–mediator variable distinction in
social psychological research: Conceptual, strategic, and statistical considerations.” In: Journal
of personality and social psychology 51.6, p. 1173.
Blair, Ian (2016). Three Mobile Marketing Trends That Are Dominating 2016. url: http://www.
forbes.com/sites/theyec/2016/03/23/three- mobile- marketing- trends- 2016/4/
#6d675130536a.
Brakus, J Josko, Bernd H Schmitt, and Lia Zarantonello (2009). “Brand experience: what is it?
How is it measured? Does it affect loyalty?” In: Journal of marketing 73.3, pp. 52–68.
Chaffey, Dave (2016). Mobile Marketing Statistics compilation. url: http://www.smartinsights.
com/mobile-marketing/mobile-marketing-analytics/mobile-marketing-statistics/.
Chen, Hsiang (2006). “Flow on the net–detecting Web users’ positive affects and their flow states”.
In: Computers in human behavior 22.2, pp. 221–233.
Cho, Yong-Hyun, Youcheng Wang, and Daniel R Fesenmaier (2002). “Searching for experiences:
The web-based virtual tour in tourism marketing”. In: Journal of Travel & Tourism Marketing
12.4, pp. 1–17.
Daugherty, Terry, Hairong Li, and Frank Biocca (2008). “Consumer learning and the effects of vir-
tual experience relative to indirect and direct product experience”. In: Psychology & Marketing
25.7, pp. 568–586.
DellaVigna, Stefano (2009). “Psychology and economics: Evidence from the field”. In: Journal of
Economic literature 47.2, pp. 315–372.
Dobrowolski, Pawel et al. (2014). “The Effects of Virtual Experience on Attitudes Toward Real
Brands”. In: Cyberpsychology, Behavior, and Social Networking 17.2, pp. 125–128.
95
Domina, Tanya, Seung-Eun Lee, and Maureen MacGillivray (2012). “Understanding factors af-
fecting consumer intention to shop in a virtual world”. In: Journal of retailing and consumer
services 19.6, pp. 613–620.
Eadicicco, Lisa (2016). Virtual Reality Buyer’s Guide: Oculus Rift vs. HTC Vive vs. Samsung Gear
VR. url: http://time.com/4277763/virtual-reality-buyers-guide/.
Falk, Armin and James J Heckman (2009). “Lab experiments are a major source of knowledge in
the social sciences”. In: science 326.5952, pp. 535–538.
Fjordtours. Den klassiske Norge i et nøtteskall R© turen. url: https://www.norwaynutshell.
com/no/klassisk-norway-in-a-nutshell/.
Gabisch, Jason A and Kholekile L Gwebu (2011). “Impact of virtual brand experience on purchase
intentions: the role of multichannel congruence”. In: Journal of Electronic Commerce Research
12.4, p. 302.
Gartner, William C (1994). “Image formation process”. In: Journal of travel & tourism marketing
2.2-3, pp. 191–216.
Gilbert, Daniel T, Michael J Gill, and Timothy D Wilson (2002). “The future is now: Temporal
correction in affective forecasting”. In: Organizational Behavior and Human Decision Processes
88.1, pp. 430–444.
Google. Google VR. url: https://vr.google.com/.
Hair, Joseph F et al. (2006). Multivariate data analysis (Vol. 6).
Hayes, Andrew F (2009). “Beyond Baron and Kenny: Statistical mediation analysis in the new
millennium”. In: Communication monographs 76.4, pp. 408–420.
Heeter, Carrie (1995). “Communication research on consumer VR”. In: Communication in the age
of virtual reality, pp. 191–218.
Hsee, Christopher K and Reid Hastie (2006). “Decision and experience: why don’t we choose what
makes us happy?” In: Trends in cognitive sciences 10.1, pp. 31–37.
Huang, Yu Chih et al. (2016). “Exploring the Implications of Virtual Reality Technology in Tourism
Marketing: An Integrated Research Framework”. In: International Journal of Tourism Research
18.2, pp. 116–128.
Hurtigruten (2015). About Us. url: https://www.hurtigruten.com/about-us/.
96
Hyun, Martin Yongho, Seoki Lee, and Clark Hu (2009). “Mobile-mediated virtual experience in
tourism: concept, typology and applications”. In: Journal of Vacation Marketing 15.2, pp. 149–
164.
Hyun, Martin Yongho and Robert Martin O’Keefe (2012). “Virtual destination image: Testing a
telepresence model”. In: Journal of Business Research 65.1, pp. 29–35.
Jin, Seung-A Annie (2009). “The roles of modality richness and involvement in shopping behavior
in 3D virtual stores”. In: Journal of Interactive Marketing 23.3, pp. 234–246.
Kim, Jihyun, Yoon Jin Ma, and Jihye Park (2009). “Are US consumers ready to adopt mobile
technology for fashion goods? An integrated theoretical approach”. In: Journal of Fashion
Marketing and Management: An International Journal 13.2, pp. 215–230.
Klein, Lisa R (2003). “Creating virtual product experiences: The role of telepresence”. In: Journal
of interactive Marketing 17.1, pp. 41–55.
Lee, Woojin and Ulrike Gretzel (2012). “Designing persuasive destination websites: A mental
imagery processing perspective”. In: Tourism management 33.5, pp. 1270–1280.
Li, Hairong, Terry Daugherty, and Frank Biocca (2002). “Impact of 3-D advertising on product
knowledge, brand attitude, and purchase intention: The mediating role of presence”. In: Journal
of advertising 31.3, pp. 43–57.
Lombard, Matthew and Theresa Ditton (1997). “At the heart of it all: The concept of presence”.
In: Journal of Computer-Mediated Communication 3.2, pp. –.
Lutz, Kathy A and Richard J Lutz (1978). “Imagery-eliciting strategies: Review and implications
of research”. In: NA-Advances in Consumer Research Volume 05.
MacInnis, Deborah J (1987). “Constructs and measures of individual differences in imagery pro-
cessing: A review”. In: NA-Advances in Consumer Research Volume 14.
MacInnis, Deborah J, Vanessa M Patrick, and C Whan Park (2006). “Looking Through the Crystal
Ball”. In: Review of Marketing Research (Review of Marketing Research, Volume 2) Emerald
Group Publishing Limited 2, pp. 43–80.
MacInnis, Deborah J and Linda L Price (1987). “The role of imagery in information processing:
Review and extensions”. In: Journal of consumer research 13.4, pp. 473–491.
Making View. Making View. url: http://www.makingview.com/.
Mawston, Neil (2016). Samsung Galaxy S7 edge Was World’s Top-Selling Android Smartphone in
H1 2016, says Strategy Analytics. url: https://www.strategyanalytics.com/strategy-
97
analytics/news/strategy-analytics-press-releases/strategy-analytics-press-
release/2016/08/01/strategy-analytics-samsung-galaxy-s7-edge-was-world’s-top-
selling-android-smartphone-in-h1-2016#.WDxG5KIrI_U.
McGill, Ann L and Punam Anand (1989). “The effect of imagery on information processing strategy
in a multiattribute choice task”. In: Marketing Letters 1.1, pp. 7–16.
Mehrabian, Albert (1978). “Characteristic individual reactions to preferred and unpreferred envi-
ronments1”. In: Journal of Personality 46.4, pp. 717–731.
Mills, Stella and Jan Noyes (1999). “Virtual reality: an overview of user-related design issues
revised paper for special issue on “Virtual reality: User Issues” in Interacting with Computers,
May 1998”. In: Interacting with computers 11.4, pp. 375–386.
Nah, Fiona Fui-Hoon, Brenda Eschenbrenner, and David DeWester (2011). “Enhancing brand
equity through flow and telepresence: A comparison of 2D and 3D virtual worlds”. In: MIs
Quarterly 35.3, pp. 731–747.
Pallant, Julie (2010). SPSS survival manual, 4th edition. McGraw-Hill Education (UK).
Pantano, Eleonora and Giuseppe Naccarato (2010). “Entertainment in retailing: The influences of
advanced technologies”. In: Journal of Retailing and Consumer Services 17.3, pp. 200–204.
Patrick, Vanessa M and Deborah J MacInnis (2006). “Why feelings stray: sources of affective
misforecasting in consumer behavior”. In: Advances in Consumer Research 33, p. 49.
Patrick, VM and DJ MacInnis (2003). “How will I feel about it? Affective misforecasting in con-
sumer behavior”. In: ADVANCES IN CONSUMER RESEARCH, VOL 30 30, pp. 145–145.
Pett, Marjorie A, Nancy R Lackey, and John J Sullivan (2003). Making sense of factor analysis:
The use of factor analysis for instrument development in health care research. Sage.
Petty, Richard E, Curtis P Haugtvedt, and Stephen M Smith (1995). “Elaboration as a determi-
nant of attitude strength: Creating attitudes that are persistent, resistant, and predictive of
behavior”. In: Attitude strength: Antecedents and consequences 4, pp. 93–130.
Prasuethsut, Lily (2016). PlayStation VR v Samsung Gear VR: Is mobile or console VR best for
you? url: https://www.wareable.com/vr/playstation-vr-vs-samsung-gear-vr.
Preacher, Kristopher J and Andrew F Hayes (2004). “SPSS and SAS procedures for estimating
indirect effects in simple mediation models”. In: Behavior research methods, instruments, &
computers 36.4, pp. 717–731.
98
Preacher, Kristopher J and Andrew F Hayes (2008). “Asymptotic and resampling strategies for
assessing and comparing indirect effects in multiple mediator models”. In: Behavior research
methods 40.3, pp. 879–891.
Samsung. Samsung Galaxy S7 edge. url: http://www.samsung.com/global/galaxy/galaxy-
s7/.
— Samsung Gear VR. url: http://www.samsung.com/global/galaxy/gear-vr/.
Sanchez, Javier et al. (2006). “Perceived value of the purchase of a tourism product”. In: Tourism
management 27.3, pp. 394–409.
Schlosser, Ann E (2003). “Experiencing products in the virtual world: the role of goal and imagery
in influencing attitudes versus purchase intentions”. In: Journal of consumer research 30.2,
pp. 184–198.
Schubert, Thomas, Frank Friedmann, and Holger Regenbrecht (2001). “The experience of presence:
Factor analytic insights”. In: Presence 10.3, pp. 266–281.
Steuer, Jonathan (1992). “Defining virtual reality: Dimensions determining telepresence”. In: Jour-
nal of communication 42.4, pp. 73–93.
Suh, Kil-Soo and Sunhye Chang (2006). “User interfaces and consumer perceptions of online stores:
The role of telepresence”. In: Behaviour & information technology 25.2, pp. 99–113.
Suh, Kil-Soo and Young Eun Lee (2005). “The effects of virtual reality on consumer learning: an
empirical investigation”. In: Mis Quarterly, pp. 673–697.
Terdiman, Daniel (2016). VR Will Be A $38 Billion Industry By 2026: Report. url: https:
//www.fastcompany.com/3065227/tech-edge/vr-will-be-a-38-billion-industry-by-
2026-report.
Tomaseti, Eva, Salvador Ruiz, and Nina Reynolds (2009). “Flow and attitude toward the website
on the evaluation of products present by means of virtual reality: A conceptual model”. In:
NA-Advances in Consumer Research Volume 36.
Venkatesh, Viswanath (2000). “Determinants of perceived ease of use: Integrating control, intrin-
sic motivation, and emotion into the technology acceptance model”. In: Information systems
research 11.4, pp. 342–365.
Williams, Paul and JS Perry Hobson (1995). “Virtual reality and tourism: fact or fantasy?” In:
Tourism Management 16.6, pp. 423–427.
99
Wilson, Timothy D et al. (2000). “Focalism: a source of durability bias in affective forecasting.”
In: Journal of personality and social psychology 78.5, p. 821.
Zuckerman, Marvin (1971). “Dimensions of sensation seeking.” In: Journal of consulting and clin-
ical psychology 36.1, p. 45.
100

Appendices
101
Contents
A Literature Review 103
B Examples of Stimuli, Study 1 and Study 2 106
B.1 Examples of Stimuli, Study 1 . . . . . . . . . . . . . . . . . . . . . . . . . . . . . . 106
B.2 Examples of Stimuli, Study 2 . . . . . . . . . . . . . . . . . . . . . . . . . . . . . . 107
C Written Material, Study 1 109
C.1 Invitation . . . . . . . . . . . . . . . . . . . . . . . . . . . . . . . . . . . . . . . . . 109
C.2 Manuscript . . . . . . . . . . . . . . . . . . . . . . . . . . . . . . . . . . . . . . . . 111
C.3 Consent Form . . . . . . . . . . . . . . . . . . . . . . . . . . . . . . . . . . . . . . . 116
C.4 Questionnaire . . . . . . . . . . . . . . . . . . . . . . . . . . . . . . . . . . . . . . . 118
C.5 Offer to Purchase Tickets . . . . . . . . . . . . . . . . . . . . . . . . . . . . . . . . . 130
D Written Material, Study 2 132
D.1 Invitation . . . . . . . . . . . . . . . . . . . . . . . . . . . . . . . . . . . . . . . . . 132
D.2 Instructions . . . . . . . . . . . . . . . . . . . . . . . . . . . . . . . . . . . . . . . . 135
D.3 Questionnaire 1 . . . . . . . . . . . . . . . . . . . . . . . . . . . . . . . . . . . . . . 138
D.4 Information with Questionnaire 1 . . . . . . . . . . . . . . . . . . . . . . . . . . . . 150
D.5 Questionnaire 2 . . . . . . . . . . . . . . . . . . . . . . . . . . . . . . . . . . . . . . 152
E Factor Analysis and Scale Reliability Check, Study 1 and Study 2 158
F Test of Assumptions, Study 1 and Study 2 162
102
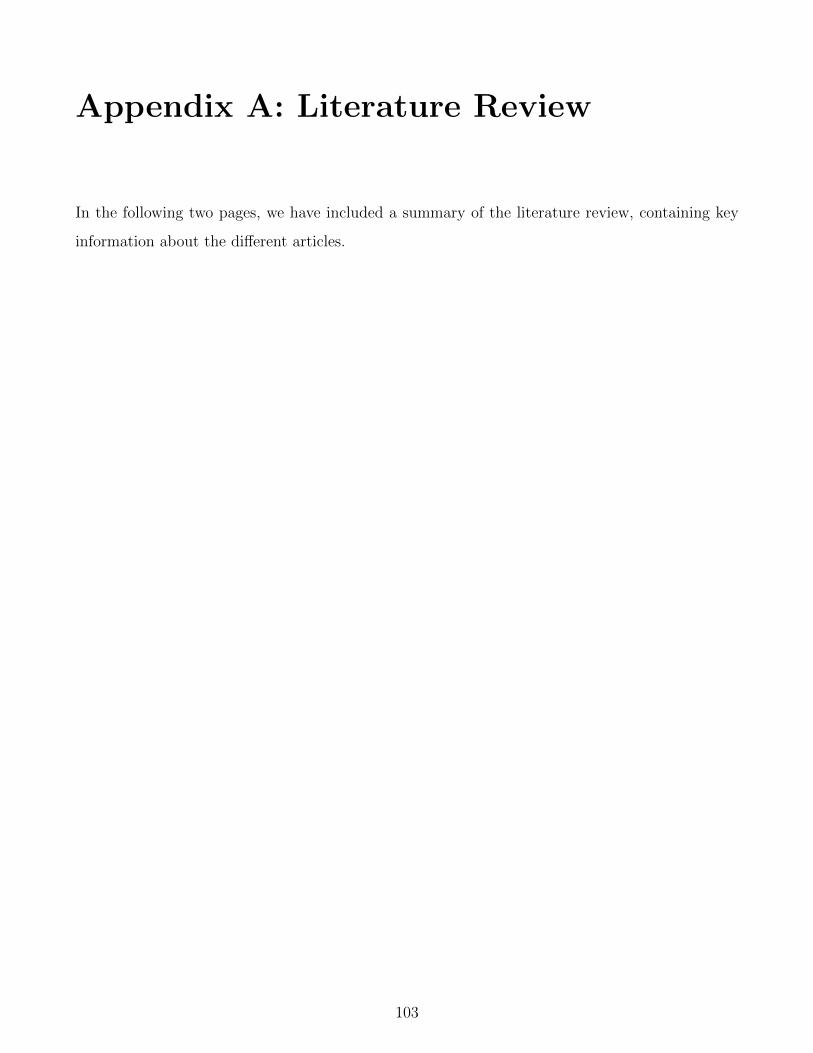
Appendix A: Literature Review
In the following two pages, we have included a summary of the literature review, containing key
information about the different articles.
103
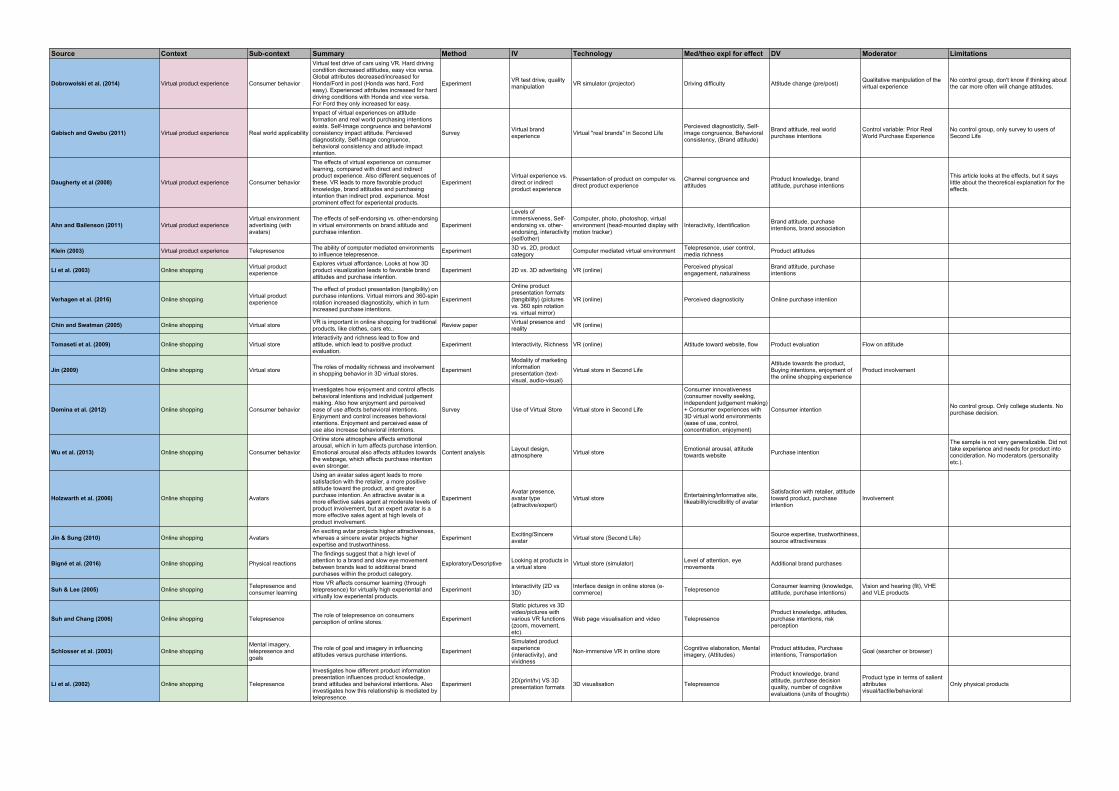
Source Context Sub-context Summary Method IV Technology Med/theo expl for effect DV Moderator Limitations
Dobrowolski et al. (2014) Virtual product experience Consumer behavior
Virtual test drive of cars using VR. Hard driving condition decreased attitudes, easy vice versa. Global attributes decreased/increased for Honda/Ford in post (Honda was hard, Ford easy). Experienced attributes increased for hard driving conditions with Honda and vice versa. For Ford they only increased for easy.
Experiment VR test drive, quality manipulation VR simulator (projector) Driving difficulty Attitude change (pre/post) Qualitative manipulation of the
virtual experienceNo control group, don't know if thinking about the car more often will change attitudes.
Gabisch and Gwebu (2011) Virtual product experience Real world applicability
Impact of virtual experiences on attitude formation and real world purchasing intentions exists. Self-Image congruence and behavioral consistency impact attitude. Percieved diagnosticity, Self-Image congruence, behavioral consistency and attitude impact intention.
Survey Virtual brand experience Virtual "real brands" in Second Life
Percieved diagnosticity, Self-image congruence, Behavioral consistency, (Brand attitude)
Brand attitude, real world purchase intentions
Control variable: Prior Real World Purchase Experience
No control group, only survey to users of Second Life
Daugherty et al (2008) Virtual product experience Consumer behavior
The effects of virtual experience on consumer learning, compared with direct and indirect product experience. Also different sequences of these. VR leads to more favorable product knowledge, brand attitudes and purchasing intention than indirect prod. experience. Most prominent effect for experiental products.
ExperimentVirtual experience vs. direct or indirect product experience
Presentation of product on computer vs. direct product experience
Channel congruence and attitudes
Product knowledge, brand attitude, purchase intentions
This article looks at the effects, but it says little about the theoretical explanation for the effects.
Ahn and Bailenson (2011) Virtual product experienceVirtual environment advertising (with avatars)
The effects of self-endorsing vs. other-endorsing in virtual environments on brand attitude and purchase intention.
Experiment
Levels of immersiveness, Self-endorsing vs. other-endorsing, interactivity (self/other)
Computer, photo, photoshop, virtual environment (head-mounted display with motion tracker)
Interactivity, Identification Brand attitude, purchase intentions, brand association
Klein (2003) Virtual product experience Telepresence The ability of computer mediated environments to influence telepresence. Experiment 3D vs. 2D, product
category Computer mediated virtual environment Telepresence, user control, media richness Product attitudes
Li et al. (2003) Online shopping Virtual product experience
Explores virtual affordance. Looks at how 3D product visualization leads to favorable brand attitudes and purchase intention.
Experiment 2D vs. 3D advertising VR (online) Perceived physical engagement, naturalness
Brand attitude, purchase intentions
Verhagen et al. (2016) Online shopping Virtual product experience
The effect of product presentation (tangibility) on purchase intentions. Virtual mirrors and 360-spin rotation increased diagnosticity, which in turn increased purchase intentions.
Experiment
Online product presentation formats (tangibility) (pictures vs. 360 spin rotation vs. virtual mirror)
VR (online) Perceived diagnosticity Online purchase intention
Chin and Swatman (2005) Online shopping Virtual store VR is important in online shopping for traditional products, like clothes, cars etc.. Review paper Virtual presence and
reality VR (online)
Tomaseti et al. (2009) Online shopping Virtual storeInteractivity and richness lead to flow and attitude, which lead to positive product evaluation.
Experiment Interactivity, Richness VR (online) Attitude toward website, flow Product evaluation Flow on attitude
Jin (2009) Online shopping Virtual store The roles of modality richness and involvement in shopping behavior in 3D virtual stores. Experiment
Modality of marketing information presentation (text-visual, audio-visual)
Virtual store in Second LifeAttitude towards the product, Buying intentions, enjoyment of the online shopping experience
Product involvement
Domina et al. (2012) Online shopping Consumer behavior
Investigates how enjoyment and control affects behavioral intentions and individual judgement making. Also how enjoyment and perceived ease of use affects behavioral intentions. Enjoyment and control increases behavioral intentions. Enjoyment and perceived ease of use also increase behavioral intentions.
Survey Use of Virtual Store Virtual store in Second Life
Consumer innovativeness (consumer novelty seeking, independent judgement making) + Consumer experiences with 3D virtual world environments (ease of use, control, concentration, enjoyment)
Consumer intention No control group. Only college students. No purchase decision.
Wu et al. (2013) Online shopping Consumer behavior
Online store atmosphere affects emotional arousal, which in turn affects purchase intention. Emotional arousal also affects attitudes towards the webpage, which affects purchase intention even stronger.
Content analysis Layout design, atmosphere Virtual store Emotional arousal, attitude
towards website Purchase intention
The sample is not very generalizable. Did not take experience and needs for product into concideration. No moderators (personality etc.).
Holzwarth et al. (2006) Online shopping Avatars
Using an avatar sales agent leads to more satisfaction with the retailer, a more positive attitude toward the product, and greater purchase intention. An attractive avatar is a more effective sales agent at moderate levels of product involvement, but an expert avatar is a more effective sales agent at high levels of product involvement.
ExperimentAvatar presence, avatar type (attracitve/expert)
Virtual store Entertaining/informative site, likeability/credibility of avatar
Satisfaction with retailer, attitude toward product, purchase intention
Involvement
Jin & Sung (2010) Online shopping AvatarsAn exciting avtar projects higher attractiveness, whereas a sincere avatar projects higher expertise and trustworthiness.
Experiment Exciting/Sincere avatar Virtual store (Second Life) Source expertise, trustworthiness,
source attractiveness
Bigné et al. (2016) Online shopping Physical reactions
The findings suggest that a high level of attention to a brand and slow eye movement between brands lead to additional brand purchases within the product category.
Exploratory/Descriptive Looking at products in a virtual store Virtual store (simulator) Level of attention, eye
movements Additional brand purchases
Suh & Lee (2005) Online shopping Telepresence and consumer learning
How VR affects consumer learning (through telepresence) for virtually high experiental and virtually low experiental products.
Experiment Interactivity (2D vs 3D)
Interface design in online stores (e-commerce) Telepresence Consumer learning (knowledge,
attitude, purchase intentions)Vision and hearing (fit), VHE and VLE products
Suh and Chang (2006) Online shopping Telepresence The role of telepresence on consumers perception of online stores. Experiment
Static pictures vs 3D video/pictures with various VR functions (zoom, movement, etc).
Web page visualisation and video TelepresenceProduct knowledge, attitudes, purchase intentions, risk perception
Schlosser et al. (2003) Online shoppingMental imagery, telepresence and goals
The role of goal and imagery in influencing attitudes versus purchase intentions. Experiment
Simulated product experience (interactivity), and vividness
Non-immersive VR in online store Cognitive elaboration, Mental imagery, (Attitudes)
Product attitudes, Purchase intentions, Transportation Goal (searcher or browser)
Li et al. (2002) Online shopping Telepresence
Investigates how different product information presentation influences product knowledge, brand attitudes and behavioral intentions. Also investigates how this relationship is mediated by telepresence.
Experiment 2D(print/tv) VS 3D presentation formats 3D visualisation Telepresence
Product knowledge, brand attitude, purchase decision quality, number of cognitive evaluations (units of thoughts)
Product type in terms of salient attributes visual/tactile/behavioral
Only physical products
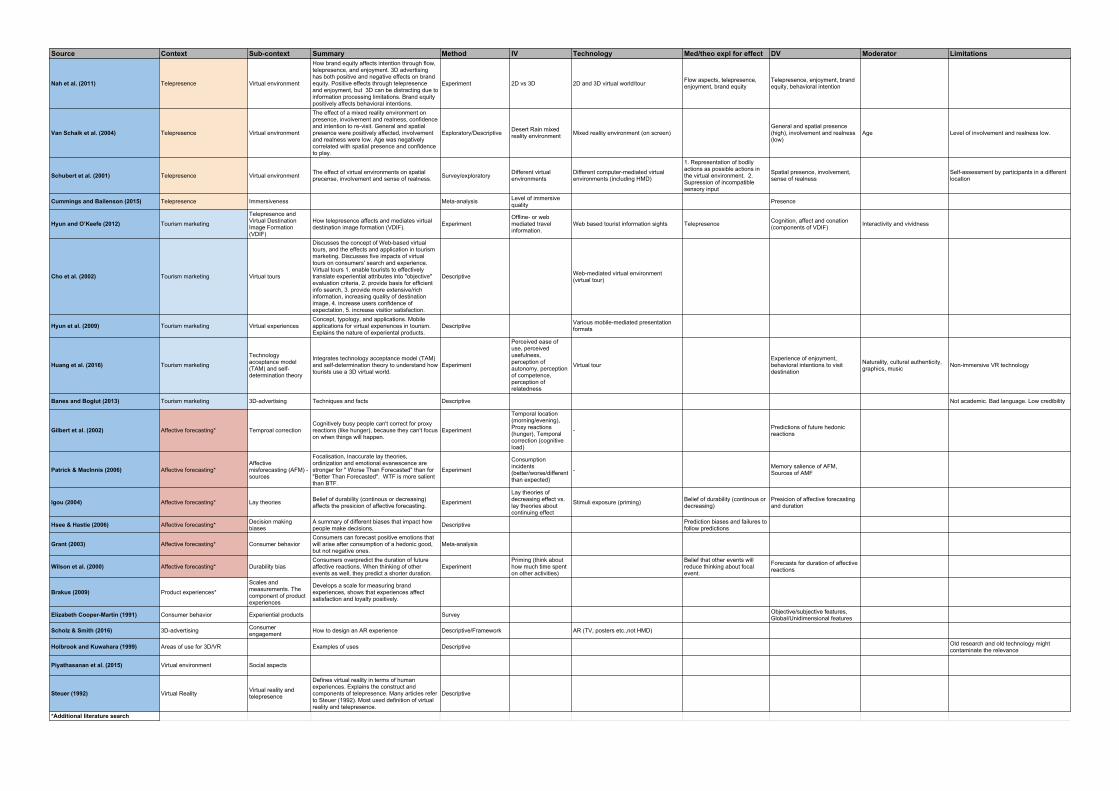
Source Context Sub-context Summary Method IV Technology Med/theo expl for effect DV Moderator Limitations
Nah et al. (2011) Telepresence Virtual environment
How brand equity affects intention through flow, telepresence, and enjoyment. 3D advertising has both positive and negative effects on brand equity. Positive effects through telepresence and enjoyment, but 3D can be distracting due to information processing limitations. Brand equity positively affects behavioral intentions.
Experiment 2D vs 3D 2D and 3D virtual world/tour Flow aspects, telepresence, enjoyment, brand equity
Telepresence, enjoyment, brand equity, behavioral intention
Van Schaik et al. (2004) Telepresence Virtual environment
The effect of a mixed reality environment on presence, involvement and realness, confidence and intention to re-visit. General and spatial presence were positively affected, involvement and realness were low. Age was negatively correlated with spatial presence and confidence to play.
Exploratory/Descriptive Desert Rain mixed reality environment Mixed reality environment (on screen)
General and spatial presence (high), involvement and realness (low)
Age Level of involvement and realness low.
Schubert et al. (2001) Telepresence Virtual environment The effect of virtual environments on spatial precense, involvement and sense of realness. Survey/exploratory Different virtual
environmentsDifferent computer-mediated virtual environments (including HMD)
1. Representation of bodily actions as possible actions in the virtual environment. 2. Supression of incompatible sensory input
Spatial presence, involvement, sense of realness
Self-assessment by participants in a different location
Cummings and Bailenson (2015) Telepresence Immersiveness Meta-analysis Level of immersive quality Presence
Hyun and O’Keefe (2012) Tourism marketing
Telepresence and Virtual Destination Image Formation (VDIF)
How telepresence affects and mediates virtual destination image formation (VDIF). Experiment
Offline- or web mediated travel information.
Web based tourist information sights Telepresence Cognition, affect and conation (components of VDIF) Interactivity and vividness
Cho et al. (2002) Tourism marketing Virtual tours
Discusses the concept of Web-based virtual tours, and the effects and application in tourism marketing. Discusses five impacts of virtual tours on consumers' search and experience. Virtual tours 1. enable tourists to effectively translate experiential attributes into "objective" evaluation criteria, 2. provide basis for efficient info search, 3. provide more extensive/rich information, increasing quality of destination image, 4. increase users confidence of expectation, 5. increase visitior satisfaction.
Descriptive Web-mediated virtual environment (virtual tour)
Hyun et al. (2009) Tourism marketing Virtual experiencesConcept, typology, and applications. Mobile applications for virtual experiences in tourism. Explains the nature of experiental products.
Descriptive Various mobile-mediated presentation formats
Huang et al. (2016) Tourism marketing
Technology acceptance model (TAM) and self-determination theory
Integrates technology acceptance model (TAM) and self-determination theory to understand how tourists use a 3D virtual world.
Experiment
Perceived ease of use, perceived usefulness, perception of autonomy, perception of competence, perception of relatedness
Virtual tour Experience of enjoyment, behavioral intentions to visit destination
Naturality, cultural authenticity, graphics, music Non-immersive VR technology
Banes and Boglut (2013) Tourism marketing 3D-advertising Techniques and facts Descriptive Not academic. Bad language. Low credibility
Gilbert et al. (2002) Affective forecasting* Temproal correctionCognitively busy people can't correct for proxy reactions (like hunger), because they can't focus on when things will happen.
Experiment
Temporal location (morning/evening), Proxy reactions (hunger), Temporal correction (cognitive load)
- Predictions of future hedonic reactions
Patrick & MacInnis (2006) Affective forecasting*Affective misforecasting (AFM) - sources
Focalisation, Inaccurate lay theories, ordinization and emotional evanescence are stronger for " Worse Than Forecasted" than for "Better Than Forecasted". WTF is more salient than BTF.
Experiment
Consumption incidents (better/worse/different than expected)
- Memory salience of AFM, Sources of AMF
Igou (2004) Affective forecasting* Lay theories Belief of durability (continous or decreasing) affects the presicion of affective forecasting. Experiment
Lay theories of decreasing effect vs. lay theories about continuing effect
Stimuli exposure (priming) Belief of durability (continous or decreasing)
Presicion of affective forecasting and duration
Hsee & Hastie (2006) Affective forecasting* Decision making biases
A summary of different biases that impact how people make decisions. Descriptive Prediction biases and failures to
follow predictions
Grant (2003) Affective forecasting* Consumer behaviorConsumers can forecast positive emotions that will arise after consumption of a hedonic good, but not negative ones.
Meta-analysis
Wilson et al. (2000) Affective forecasting* Durability biasConsumers overpredict the duration of future affective reactions. When thinking of other events as well, they predict a shorter duration.
ExperimentPriming (think about how much time spent on other activities)
Belief that other events will reduce thinking about focal event.
Forecasts for duration of affective reactions
Brakus (2009) Product experiences*
Scales and measurements. The component of product experiences
Develops a scale for measuring brand experiences, shows that experiences affect satisfaction and loyalty positively.
Elizabeth Cooper-Martin (1991) Consumer behavior Experiential products Survey Objective/subjective features, Global/Unidimensional features
Scholz & Smith (2016) 3D-advertising Consumer engagement How to design an AR experience Descriptive/Framework AR (TV, posters etc.,not HMD)
Holbrook and Kuwahara (1999) Areas of use for 3D/VR Examples of uses Descriptive Old research and old technology might contaminate the relevance
Piyathasanan et al. (2015) Virtual environment Social aspects
Steuer (1992) Virtual Reality Virtual reality and telepresence
Defines virtual reality in terms of human experiences. Explains the construct and components of telepresence. Many articles refer to Steuer (1992). Most used definition of virtual reality and telepresence.
Descriptive
*Additional literature search
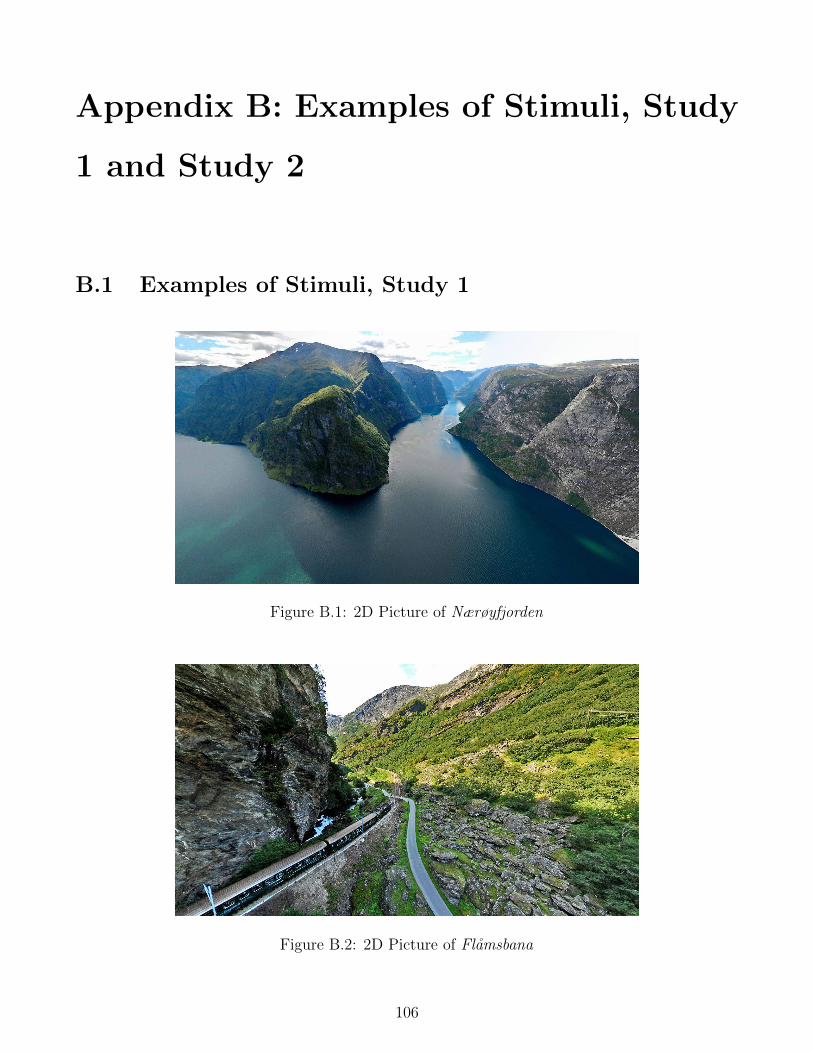
Appendix B: Examples of Stimuli, Study
1 and Study 2
B.1 Examples of Stimuli, Study 1
Figure B.1: 2D Picture of Nærøyfjorden
Figure B.2: 2D Picture of Flamsbana
106

Figure B.3: 2D Picture of Aurlandsfjorden
B.2 Examples of Stimuli, Study 2
Figure B.4: 2D Picture of Leknes
107
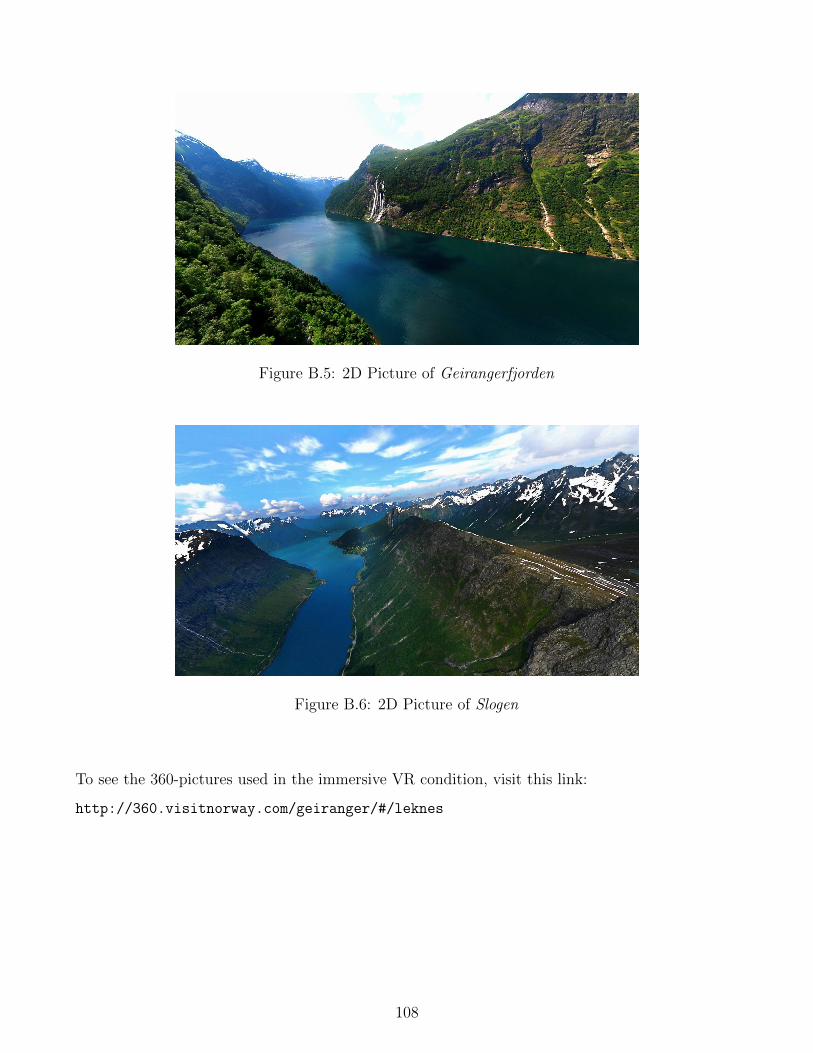
Figure B.5: 2D Picture of Geirangerfjorden
Figure B.6: 2D Picture of Slogen
To see the 360-pictures used in the immersive VR condition, visit this link:
http://360.visitnorway.com/geiranger/#/leknes
108

Appendix C: Written Material, Study 1
C.1 Invitation
The invitation to the lab experiment that was sent out to all students at The Norwegian School
of Economics is included below.
109

*This message is for Norwegian speaking students only*
Informasjonsskriv om undersøkelse
Kjære student,
Vi ønsker med dette å invitere deg til å delta i en undersøkelse om reiseopplevelser i Norge.
Undersøkelsen tar ca. 20 minutter, og ved å delta er du med i trekning av 2 byGavekort til en verdi av 3000 kroner hver. Gavekortene kan brukes i butikker og restauranter i hele Bergen.
Undersøkelsen vil finne sted på SOL-instituttet på NHH (3. etasje i nybygget), og man kan selv velge dag og tidspunkt som passer best i løpet av neste uke (uke 38).
Du kan følge denne lenken dersom du ønsker å delta: http://thomas.nhh.no/dj/expmotor/new_participant/8/
Det vil ikke lagres noen personsensitive data i forbindelse med undersøkelsen, og deltakelse er frivillig. For å kunne delta i trekningen av gavekort vil vi imidlertid trenge å ta vare på din kontaktinformasjon til trekningen er over.
Vi håper å se deg neste uke!
Vennlig hilsen,
Center for Service Innovation (CSI), NHH
C.2 Manuscript
The manuscripts which the experimenters used in the experiment are included below. Both the
manuscript for the VR condition and for the 2D condition are included, as they are slightly
different.
111

Eksperimentskript (2D):
Innledning: ● Velkommen til denne undersøkelsen. Den utføres i forbindelse med forskning på
reiselivsopplevelser, for Center for Service Innovation ved NHH.
● Undersøkelsen er helt anonym. Vi trenger kun e-postadressen din for å ta kontakt med vinneren av gavekortene i ettertid.
● Før vi begynner vil vi gjerne at du signerer et samtykkeskjema. Ved å signere samtykker
du til at du har forstått at du er her av fri vilje og at den gjennomføres anonymt.
Forklaring - 2D: ● Du vil nå få se bilder av norsk vestlandsnatur, som kan besøkes på en dagstur fra
Bergen. ● Bildene vil du få se på denne mobiltelefonen. Du kan bytte mellom bildene ved å sveipe
mot venstre og høyre. ● Ta deg den tiden du trenger til å få sett ordentlig på hvert bilde. Du har god tid. Du kan
også se bildene så mange ganger du vil. ● Det vil ikke komme noen memoreringsspørsmål eller kunnskapsspørsmål etterpå, så
ikke tenk på det. (Eksponering med mobil) Forklaring - Undersøkelse: ● Vi vil nå begynne med en spørreundersøkelse. ● Den inneholder noen spørsmål du skal svare på. Det er ingen riktige eller gale svar. Du
skal huke av for det alternativet som best representerer hva du mener og føler. ● Når du kommer til siden hvor det står at du er ferdig, skal du henvende deg til meg. ● For å være med i trekningen av to ByGavekort til en verdi av 3000 kr hver må du etterpå
fylle ut et skjema med mailadresse. (Begynn med surveyen)
Tilbud (etter utfylt survey): ● Som takk for at du deltok vil vi nå gi deg et tilbud om å kjøpe to rabatterte billetter til en
dagstur fra Bergen til de stedene du har sett bilder av. Tilbudet er beskrevet her. Bare spør meg hvis det er noe ved tilbudet du lurer på.
Debrief: ● For å være med i trekningen av to byGavekort til en verdi av 3000 kr hver, kan du nå
skrive mailadressen din nederst på dette skjemaet. ● Det er svært viktig at du ikke snakker med noen om noe av det som har skjedd i denne
undersøkelsen før neste uke. Det gjelder både hva du ble spurt om, hva du har blitt vist og tilbudet du har fått. Dette er for å unngå at resultatene blir endre på noen som helst måte. Neste uke kan du fritt diskutere alt om undersøkelsen.
Eksperimentskript (VR): Innledning:
● Velkommen til denne undersøkelsen. Den utføres i forbindelse med forskning på reiselivsopplevelser, for Center for Service Innovation ved NHH.
● Undersøkelsen er helt anonym. Vi trenger kun e-postadressen din for å ta kontakt med
vinneren av gavekortene i ettertid.
● Før vi begynner vil vi gjerne at du signerer et samtykkeskjema. Ved å signere samtykker du til at du har forstått at du er her av fri vilje og at den gjennomføres anonymt.
Forklaring - VR:
● Du vil nå få se tre 360-graders bilder av norsk vesltlandsnatur, som kan besøkes på en dagstur fra Bergen.
● Du skal straks få ta på deg dette headsetet for å se på bildene. Med dette kan du se i
alle retninger, og snu hodet fritt. Du kan også bruke stolen til å snu deg rundt, men bli sittende.
● Hvis bildene ikke er fokusert kan du selv endre fokus med dette hjulet på toppen. Still
gjerne inn fokus på det så skarpt som du får det første bildet før du begynner, men bruk venstre hånd. Hvis du bruker briller med mye styrke kan det være lurt å ha disse på under.
● Prøv å ikke komme nær siden av headsetet. Gi beskjed når du ønsker å skifte bilde.
Dette gjør vi for deg ved å trykke på en knapp på selve VR-brillen.
● Ta deg den tiden du trenger til å få sett ordentlig på hvert bilde. Du har god tid. Du kan også se bildene så mange ganger du vil.
● Det vil ikke komme noen memoreringsspørsmål eller kunnskapsspørsmål etterpå, så
ikke tenk på det. (Eksponering med VR-briller)
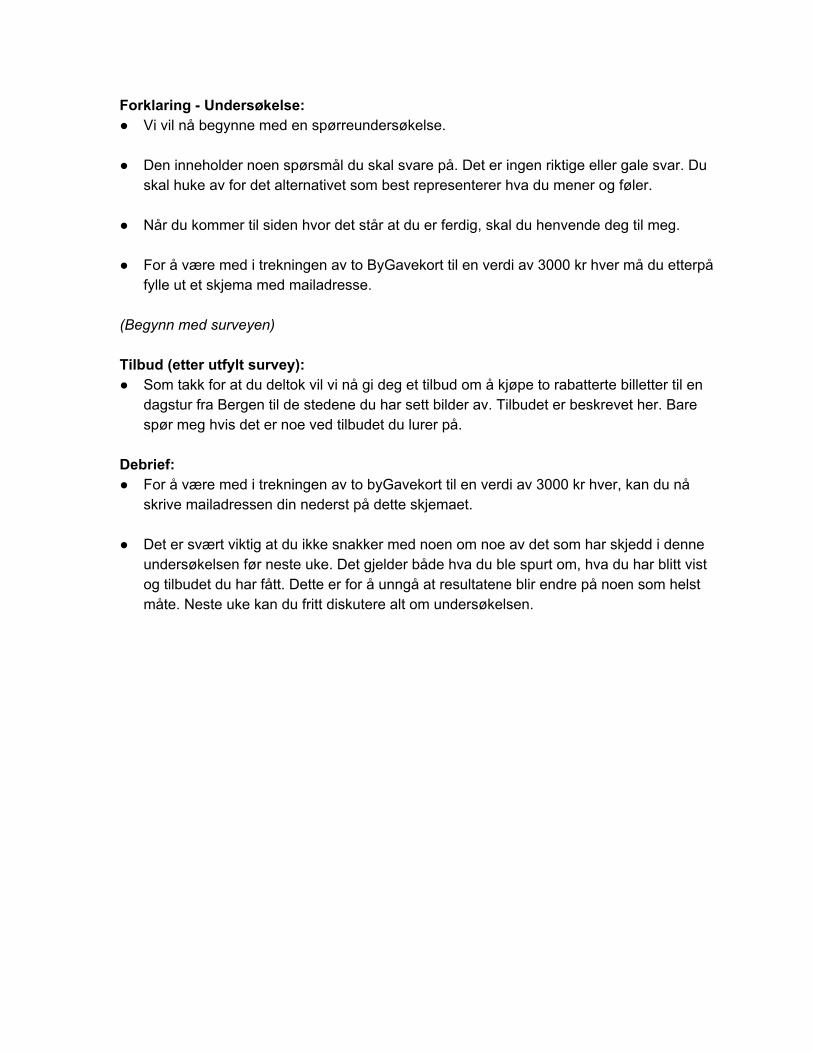
Forklaring - Undersøkelse: ● Vi vil nå begynne med en spørreundersøkelse. ● Den inneholder noen spørsmål du skal svare på. Det er ingen riktige eller gale svar. Du
skal huke av for det alternativet som best representerer hva du mener og føler. ● Når du kommer til siden hvor det står at du er ferdig, skal du henvende deg til meg. ● For å være med i trekningen av to ByGavekort til en verdi av 3000 kr hver må du etterpå
fylle ut et skjema med mailadresse. (Begynn med surveyen) Tilbud (etter utfylt survey): ● Som takk for at du deltok vil vi nå gi deg et tilbud om å kjøpe to rabatterte billetter til en
dagstur fra Bergen til de stedene du har sett bilder av. Tilbudet er beskrevet her. Bare spør meg hvis det er noe ved tilbudet du lurer på.
Debrief: ● For å være med i trekningen av to byGavekort til en verdi av 3000 kr hver, kan du nå
skrive mailadressen din nederst på dette skjemaet. ● Det er svært viktig at du ikke snakker med noen om noe av det som har skjedd i denne
undersøkelsen før neste uke. Det gjelder både hva du ble spurt om, hva du har blitt vist og tilbudet du har fått. Dette er for å unngå at resultatene blir endre på noen som helst måte. Neste uke kan du fritt diskutere alt om undersøkelsen.
C.3 Consent Form
Included below is the consent form that participants had to sign before commencing with the
experiment.
116

Samtykkeskjema
Formålet med undersøkelsen er å undersøke reiselivsopplevelser.
Informasjonen du oppgir er konfidensiell. Det samles ikke inn personlig informasjon somkan kobles til svarene du gir.
Din deltagelse i denne undersøkelsen er helt frivillig. Du kan avbryte undersøkelsen nårsom helst, men vil i så tilfelle ikke være med i trekningen av premie.
Jeg har lest og forstår overnevnte informasjon, og samtykker herved til å delta i denne undersøkelsen.
——————————————— —————————————————-
Navn Signatur

C.4 Questionnaire
In the following eleven pages, the questionnaire from study 1 is included. This questionnaire was
answered on a computer. The questionnaire given to respondents in the 2D condition was slightly
different in that question 15 and half of question 16 were excluded, seeing as how these were VR
related.
118

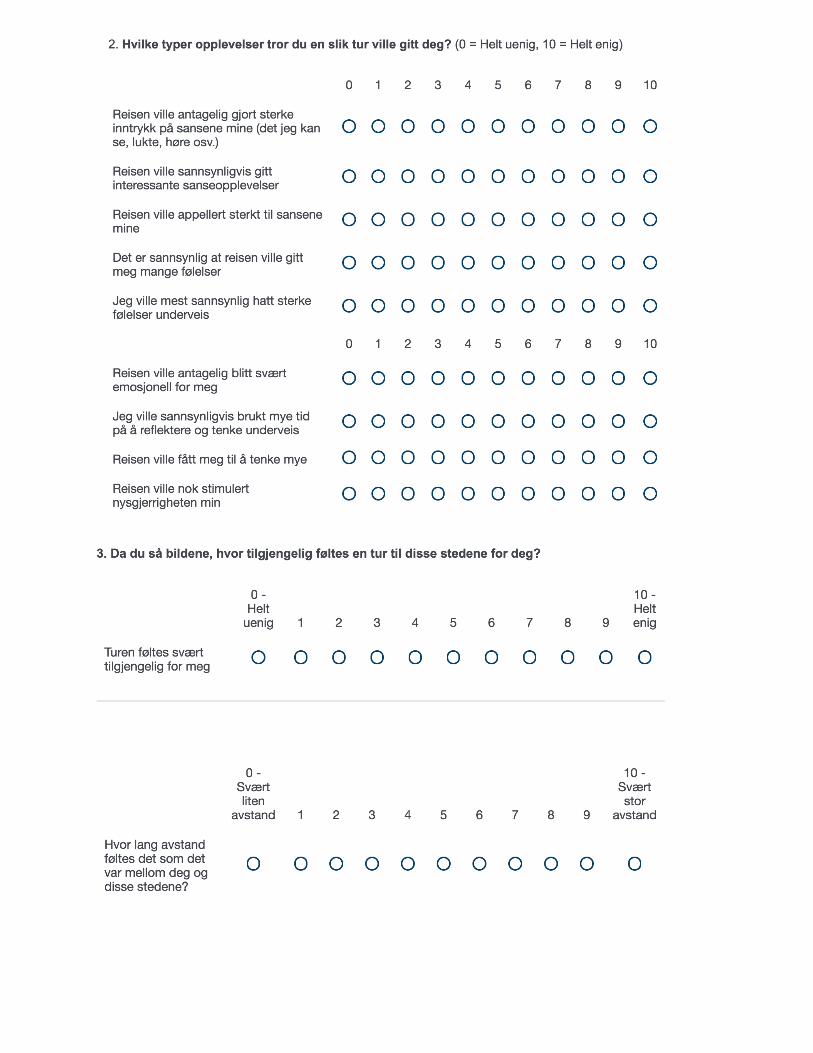
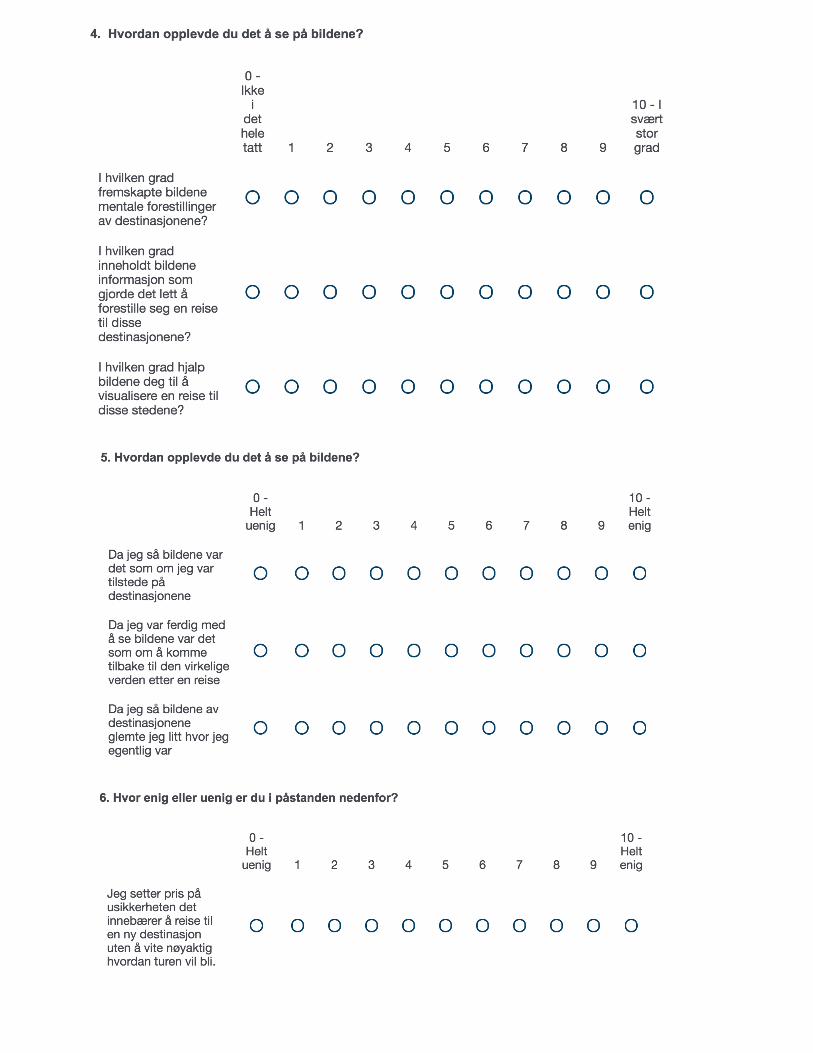

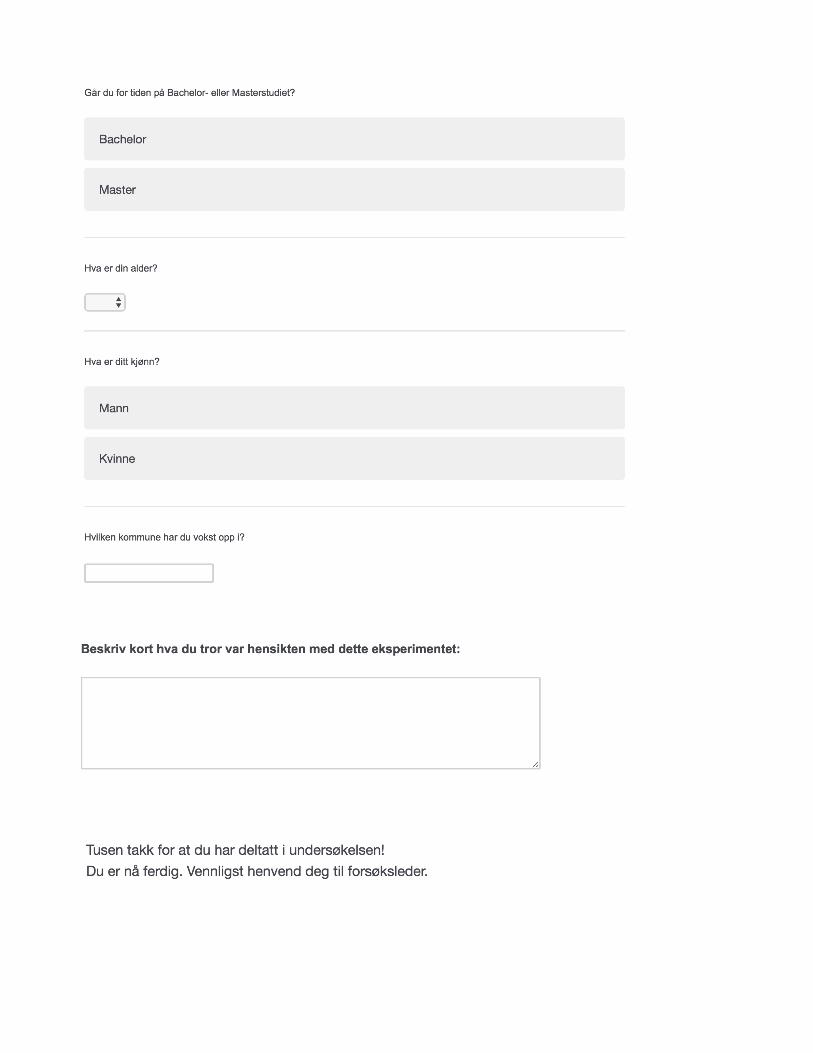
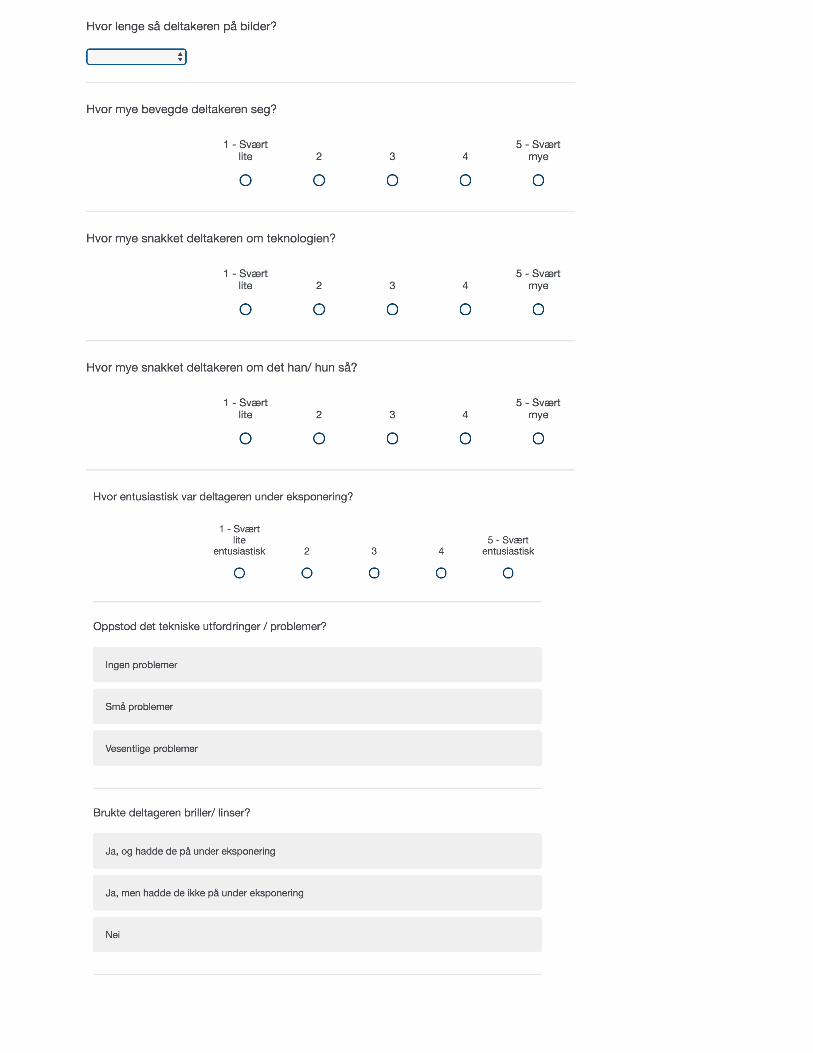


C.5 Offer to Purchase Tickets
The offer to purchase tickets to the Norway In A Nutshell-trip is included below.
130
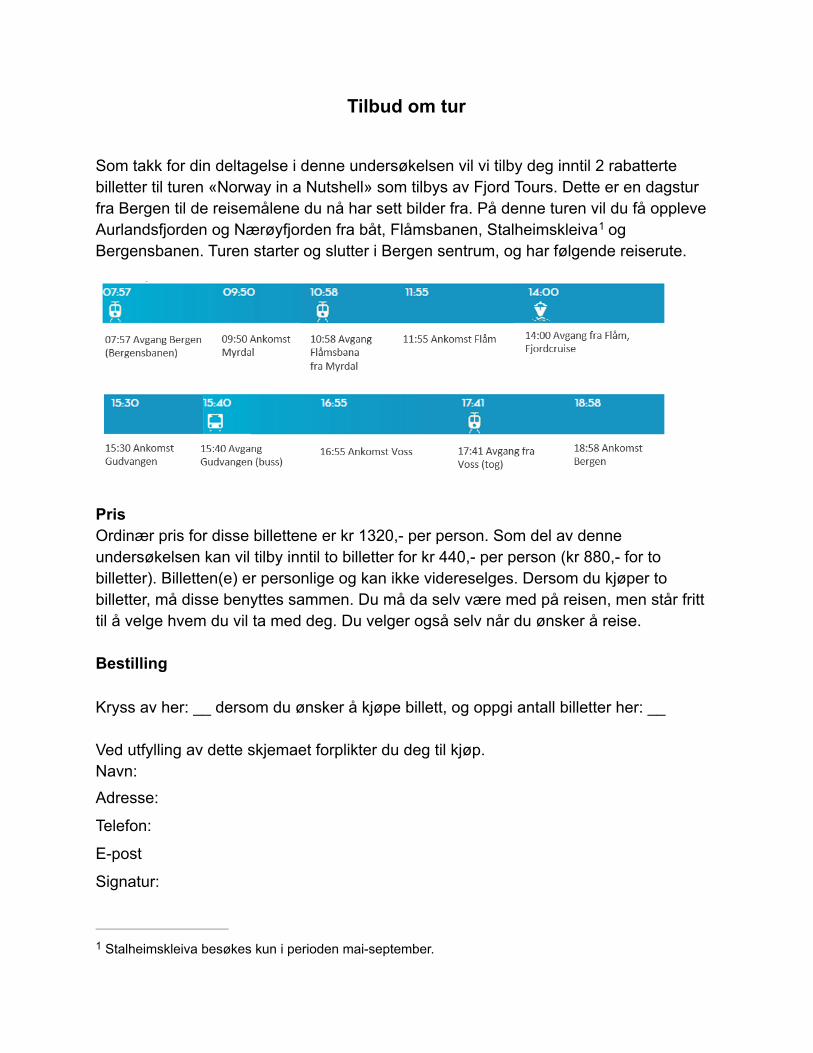
Tilbud om tur
Som takk for din deltagelse i denne undersøkelsen vil vi tilby deg inntil 2 rabatterte billetter til turen «Norway in a Nutshell» som tilbys av Fjord Tours. Dette er en dagstur fra Bergen til de reisemålene du nå har sett bilder fra. På denne turen vil du få oppleve Aurlandsfjorden og Nærøyfjorden fra båt, Flåmsbanen, Stalheimskleiva og 1
Bergensbanen. Turen starter og slutter i Bergen sentrum, og har følgende reiserute.
!
Pris Ordinær pris for disse billettene er kr 1320,- per person. Som del av denne undersøkelsen kan vil tilby inntil to billetter for kr 440,- per person (kr 880,- for to billetter). Billetten(e) er personlige og kan ikke videreselges. Dersom du kjøper to billetter, må disse benyttes sammen. Du må da selv være med på reisen, men står fritt til å velge hvem du vil ta med deg. Du velger også selv når du ønsker å reise.
Bestilling
Kryss av her: __ dersom du ønsker å kjøpe billett, og oppgi antall billetter her: __
Ved utfylling av dette skjemaet forplikter du deg til kjøp. Navn: Adresse:
Telefon:
E-post
Signatur:
Stalheimskleiva besøkes kun i perioden mai-september. 1
Appendix D: Written Material, Study 2
D.1 Invitation
The full version of the invitation to take part in the field experiment is included in the following,
with all four languages represented. The invitation was printed two-sided, including all languages
on one sheet, which was handed out to all the passengers.
132

Can you help Hurtigruten to be even better?
The Norwegian School of Economics (NHH) is carrying out a survey for Hurtigruten. The purpose of the survey is to provide even better experiences to those travelling on Hurtigruten.
The survey will only take 10 minutes and will be conducted between 16.00 and 22.00 today (12 Oct.). To participate in the survey, you can come to the reception on deck 4 at any time during the given times above.
The survey will give you a taste of the places you are going to see on your journey, and you will have to answer two questionnaires to be included in the draw.
We will draw the names of five (5) participants who will receive a gift voucher to the value of NOK 500, which can be used in the ship’s shop.
We appreciate if you want to help us with this survey!
Enjoy your journey!
__________________________
Können sie Hurtigruten helfen noch besser zu werden?
Die Norwegische Handelshochschule (NHH) wird auf dieser Reise eine Umfrage für passagiere mit Hurtigruten duchführen. Die Untersuchung bezweckt, den Passagieren der Hurtigruten noch schönere Erlebnisse bieten zu können.
Die Umfrage wird nur 10 Minuten dauern, und findet heute zwischen 16 und 22 Uhr statt (12. Oct). Wenn Sie teilnehmen möchten, kommen Sie bitte im angegebenen Zeitraum in die Rezeption auf Deck 4.
In der Umfrage werden Ihnen Bilder der Orte gezeigt, die Sie im Laufe der Reise sehen werden. Um an der Verlosung der Gutscheine teilnehmen zu können, müssen Sie danach die Fragen auf zwei kurze Fragebögen beantworten.
Unter den Teilnehmern der Umfrage verlosen wir fünf Geschenkgutscheine im Wert von jeweils 500 NOK, die an Bord des Schiffes eingelöst werden können.
Wir wünschen Ihnen eine angenehme Reise!
_____________________ ______________________
Helge Thorbjørnsen Lisbeth Hjertås
Professor / Vice rector for Research, NHH Guest Arrival Manager, Hurtigruten
Kan du hjelpe Hurtigruten å bli enda bedre?
Norges Handelshøyskole (NHH) vil på denne turen gjennomføre en kundeundersøkelse for reisende med Hurtigruten. Formålet med undersøkelsen er å tilby enda bedre opplevelser for dere reisende.
Undersøkelsen tar kun 10 minutter, og utføres i dag fra kl. 16:00 til 22:00. For å delta, møt opp ved resepsjonen på dekk 4 innenfor det gitte tidsrommet.
I undersøkelsen vil du få en smakebit av steder du vil se i løpet av turen, og i etterkant svare på to korte spørreskjemaer.
Vi trekker ut fem (5) av deltakerne som får et gavekort til verdi av 500 kr, som kan brukes her om bord på båten.
Vi setter stor pris på om du vil hjelpe oss med denne undersøkelsen!
God tur! __________________________
Pouvez-vous aider Hurtigruten à devenir encore mieux?
L’Ecole supérieure de commerce de Norvège (Norges Handelshøyskole - NHH) effectue une enquête pour Hurtigruten. L’objectif de cette enquête est de pouvoir améliorer les expériences proposées à ceux qui voyagent avec Hurtigruten.
L’enquête ne dure que 10 minutes se déroulera entre 16 h et 22 h aujourd’hui (12.10). Pour participer à l’enquête, vous pouvez vous présenter à la réception au pont 4 à n’importe quel moment à l’intérieur des plages horaires indiquées.
Au cours de l’enquête, nous vous présenterons des sites que vous verrez durant la croisière, et vous répondrez ensuite à deux questionnaires pour participer au tirage au sort et, peut-être, gagner des prix.
Nous tirerons au sort cinq (5) participants qui recevront un bon-cadeau d’une valeur de 500 NOK, qui peut être utilisé dans la boutique à bord du bateau.
Nous apprécierions si vous vouliez nous aider dans cette enquête!
Bonne croisière!
_____________________ ______________________
Helge Thorbjørnsen Lisbeth Hjertås
Professor / Vice rector for Research, NHH Guest Arrival Manager, Hurtigruten
D.2 Instructions
Included in the following, are Norwegian instructions for the participants, for how to use the
equipment in the experiment. The first instructions are the instructions for the VR condition, and
the second instructions are for the 2D condition. The English, German and French versions are
not included.
135
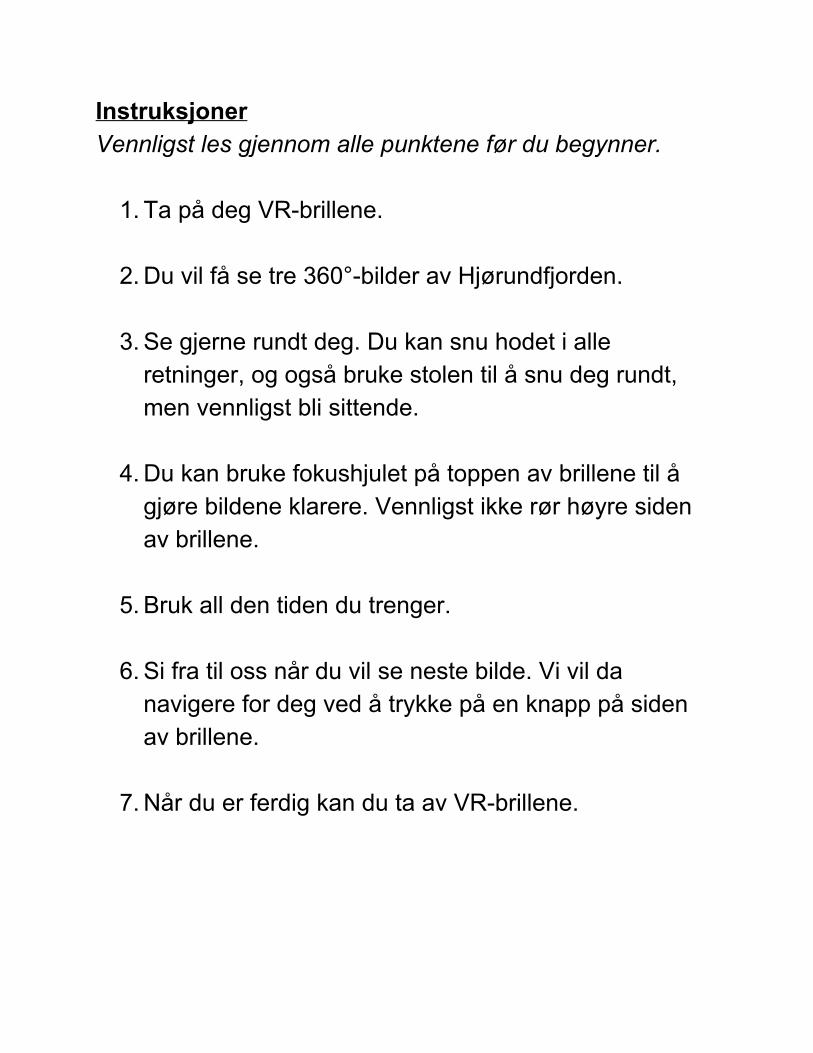
Instruksjoner Vennligst les gjennom alle punktene før du begynner.
1. Ta på deg VR-brillene.
2. Du vil få se tre 360°-bilder av Hjørundfjorden.
3. Se gjerne rundt deg. Du kan snu hodet i alle retninger, og også bruke stolen til å snu deg rundt, men vennligst bli sittende.
4. Du kan bruke fokushjulet på toppen av brillene til å
gjøre bildene klarere. Vennligst ikke rør høyre siden av brillene.
5. Bruk all den tiden du trenger.
6. Si fra til oss når du vil se neste bilde. Vi vil da
navigere for deg ved å trykke på en knapp på siden av brillene.
7. Når du er ferdig kan du ta av VR-brillene.

Instruksjoner Vennligst les gjennom alle punktene før du begynner.
1. Du vil få se bilder av Hjørundfjorden på denne telefonen.
2. Du kan navigere mellom frem og tilbake mellom
bildene ved å dra fingeren frem og tilbake på skjermen.
3. Se gjennom alle bildene og bruk all den tiden du
trenger.
D.3 Questionnaire 1
In the following, the full Norwegian version of the first questionnaire in study 2 is included. The
included questionnaire is the one given to respondents in the VR condition. In the questionnaire
given to respondents in the 2D condition, questions 13-15 from the included form were excluded.
In addition, the front page of the English, German and French versions are included.
138

Spørreskjema #1
Fullt navn:
___________________________________________________________________________
Lugarnummer:
___________________________________________________________________________
Skjema #1 Hurtigruten
Det er ikke noe riktig eller galt svar på spørsmålene nedenfor. Vi vil at du skal svare nøyaktig slik
du føler det.
1. I løpet av reisen vil du se og oppleve alle de stedene vi har vist deg bilder av.
- Hvor glad tror du at du blir når du kommer til disse stedene?
(0 = Ikke glad, 10 = Svært glad)
Ikke glad Svært glad
0 1 2 3 4 5 6 7 8 9 10
- Hvor mye vil du føle på en beundring for naturen underveis på reisen?
(0 = Ingen beundring, 10 = Sterk beundring)
Ingen beundring
Sterk beundring
0 1 2 3 4 5 6 7 8 9 10
- Hvor sterkt inntrykk tror du at denne type reiseopplevelse ville gjort på deg?
(0 = Lite inntrykk, 10 = Sterkt inntrykk)
Lite inntrykk
Sterkt inntrykk
0 1 2 3 4 5 6 7 8 9 10
- Hvor fornøyd tror du at du vil føle deg i ettertid med at du dro på denne reisen?
(0 = Ikke fornøyd, 10 = Svært fornøyd)
Ikke fornøyd
Svært fornøyd
0 1 2 3 4 5 6 7 8 9 10
2. Hvilke typer opplevelser tror du at denne turen vil gi deg? (0 = Helt uenig, 10 = Helt enig)
- Det er sannsynlig at reisen vil gi meg mange følelser
Helt uenig Helt enig
0 1 2 3 4 5 6 7 8 9 10
- Jeg vil mest sannsynlig få sterke følelser underveis
Helt uenig Helt enig
0 1 2 3 4 5 6 7 8 9 10
- Jeg vil sannsynligvis bruke mye tid på å reflektere og tenke underveis
Helt uenig Helt enig
0 1 2 3 4 5 6 7 8 9 10
- Reisen vil nok få meg til å tenke mye
Helt uenig Helt enig
0 1 2 3 4 5 6 7 8 9 10
- Denne turen kommer til å skille seg veldig fra alle andre turer jeg har vært på
Helt uenig Helt enig
0 1 2 3 4 5 6 7 8 9 10
- Turen kommer nok til å gi meg helt unike opplevelser
Helt uenig Helt enig
0 1 2 3 4 5 6 7 8 9 10
3. Vi vil nå stille deg noen spørsmål om hvordan du opplevde bildene du så (0 = Ikke i det hele
tatt, 10 = I svært stor grad)
- I hvilken grad fremskapte bildene mentale forestillinger av destinasjonene som du er på vei
til nå?
Ikke I det hele tatt
I svært stor grad
0 1 2 3 4 5 6 7 8 9 10
- I hvilken grad inneholdt bildene informasjon som gjorde det lett å forestille seg hvordan det
blir å komme til disse destinasjonene?
Ikke I det hele tatt
I svært stor grad
0 1 2 3 4 5 6 7 8 9 10
- I hvilken grad hjalp bildene deg til å visualisere disse stedene?
Ikke I det hele tatt
I svært stor grad
0 1 2 3 4 5 6 7 8 9 10
4. Hvordan opplevde du det å se på bildene? (0 = Helt uenig, 10 = Helt enig)
- Da jeg så bildene var det som om jeg allerede var tilstede på destinasjonene Helt uenig Helt enig
0 1 2 3 4 5 6 7 8 9 10
- Da jeg var ferdig med å se bildene var det som om å komme tilbake til den virkelige verden
etter en reise Helt uenig Helt enig
0 1 2 3 4 5 6 7 8 9 10
- Da jeg så bildene av destinasjonene glemte jeg litt hvor jeg egentlig var Helt uenig Helt enig
0 1 2 3 4 5 6 7 8 9 10
5. Hva synes du om billedserien i seg selv? (0 = Helt uenig, 10 = Helt enig)
- Jeg synes det å se på bildene var underholdende Helt uenig Helt enig
0 1 2 3 4 5 6 7 8 9 10
- Jeg synes bildene var interessante Helt uenig Helt enig
0 1 2 3 4 5 6 7 8 9 10
- Jeg synes det var gøy å se på bildene
Helt uenig Helt enig
0 1 2 3 4 5 6 7 8 9 10
6. Hva tenker du om den reisen du har foran deg? (0 = Helt uenig, 10 = Helt enig)
- Jeg tror reisen vil stimulere nysgjerrigheten min
Helt uenig Helt enig
0 1 2 3 4 5 6 7 8 9 10
- Jeg setter pris på det å reise til nye steder uten å vite helt sikkert hva som kommer til å
skje
Helt uenig Helt enig
0 1 2 3 4 5 6 7 8 9 10
7. Sier reisen du skal på noe om deg som person? (0 = Helt uenig, 10 = Helt enig)
- Det å reise til slike destinasjoner reflekterer hvem jeg er som person Helt uenig Helt enig
0 1 2 3 4 5 6 7 8 9 10
- Det å reise til slike destinasjoner hjelper meg å bli den type person som jeg ønsker å være
Helt uenig Helt enig
0 1 2 3 4 5 6 7 8 9 10
8. Vi vil gjerne vite litt om ditt forhold til naturen slik du føler det akkurat nå. (0 = Helt uenig,
10 = Helt enig)
- Jeg tenker på naturen rundt meg som et samfunn som jeg tilhører
Helt uenig Helt enig
0 1 2 3 4 5 6 7 8 9 10
- Jeg føler meg ofte i ett med naturen
Helt uenig Helt enig
0 1 2 3 4 5 6 7 8 9 10
- Jeg har en dyp forståelse for hvordan mine handlinger påvirker naturen
Helt uenig Helt enig
0 1 2 3 4 5 6 7 8 9 10
- På samme måte som et tre kan være en del av en skog, så føler jeg meg som en liten del av
naturen som helhet
Helt uenig Helt enig
0 1 2 3 4 5 6 7 8 9 10
9. Hva er ditt generelle inntrykk av den turen du skal på?
- Dårlig (0)/ bra (10) Dårlig Bra
0 1 2 3 4 5 6 7 8 9 10
- Ikke appellerende (0)/ apellerende (10) Ikke
appellerende Appellerende
0 1 2 3 4 5 6 7 8 9 10
- Lite attraktivt (0)/ attraktivt (10) Lite
attraktivt Attraktivt
0 1 2 3 4 5 6 7 8 9 10
10. Ville du anbefalt Hurtigruten til en kollega eller en venn? (0 = Helt usannsynlig, 10 = Svært
sannsynlig)
Helt usannsynlig
Svært sannsynlig
0 1 2 3 4 5 6 7 8 9 10
11. Har du reist med Hurtigruten tidligere? (Ja/Nei/Vet ikke)
Ja Nei Vet ikke

12. Har du vært på noen av de stedene vi viste deg bilder av tidligere? (Ja/Nei/Vet ikke)
Ja Nei Vet ikke
13. Har du brukt/prøvd VR-briller tidligere? (Ja/Nei/Vet ikke)
Ja Nei Vet ikke
14. Hvor stor kunnskap hadde du om VR før denne undersøkelsen? (0 = Svært lite kunnskap, 10
= Svært mye kunnskap)
Svært lite kunnskap
Svært mye kunnskap
0 1 2 3 4 5 6 7 8 9 10
15. I hvilken grad opplevde du følelsene nedenfor da du så på bildene med VR-brillene på? (0 = Ikke i det hele tatt, 10 = I svært stor grad)
- Kvalm
Ikke I det hele tatt
I svært stor grad
0 1 2 3 4 5 6 7 8 9 10
- Ukomfortabel
Ikke I det hele tatt
I svært stor grad
0 1 2 3 4 5 6 7 8 9 10
- Svimmel
Ikke I det hele tatt
I svært stor grad
0 1 2 3 4 5 6 7 8 9 10
16. Hvordan dynes du kvaliteten på bildene var? (0 = Svært dårlig kvalitet, 10 = Svært god
kvalitet)
Svært dårlig kvalitet
Svært god kvalitet
0 1 2 3 4 5 6 7 8 9 10
17. Generelt, hvor mye erfaring har du med ny teknologi? (0 = Svært lite erfaring, 10 = Svært
mye erfaring)
Svært lite erfaring
Svært mye erfaring
0 1 2 3 4 5 6 7 8 9 10
Til slutt trenger vi litt bakgrunnsinformasjon om deg
Kjønn
□ Kvinne
□ Mann
Alder: __________
Nasjonalitet: __________________

Questionnaire #1
Full name:
___________________________________________________________________________
Cabin number:
___________________________________________________________________________
Fragebogen #1
Voller Name: ———————————————————————————————————————————————————
Kabinennummer: ———————————————————————————————————————————————————
Ques%onnaire n° 1
Nom complete:______________________________________________
Numéro de cabine:__________________________________________
D.4 Information with Questionnaire 1
The Norwegian version of the information on how to fill out the questionnaire and when and where
the second questionnaire should be filled out, is included in the following.
150
Informasjon til spørreskjemaet
● Du vil nå bli bedt om å svare på noen spørsmål. Under hvert av spørsmålene finner du informasjon om hvordan det skal besvares.
● Skriv lugarnummer og navnet ditt med blokkbokstaver i feltet på forsiden av
spørreskjemaet. Undersøkelsen er anonym, men vi trenger navn og lugarnummer for å trekke vinnere av gavekort. Alle personlige opplysninger vil bli makulert, og svarene anonymisert.
● Når du har svart på alle spørsmålene plasseres skjemaet i den angitte esken
med forsiden ned.
● For å sikre at resultatene fra undersøkelsen skal være gyldige, er det viktig at du ikke snakker med andre reisende om hva du har gjort og svart på i undersøkelsen, før reisen er over.
● For å være med i trekningen av gavekort må du også fylle ut et kort
spørreskjema en gang i tidsrommet 15:00 - 20:00 i morgen (09.10). Dette vil finne sted her i konferansesalen på Dekk 4.

D.5 Questionnaire 2
The Norwegian version of the second questionnaire in study 2 is included in the following.
152
Spørreskjema #2
Fullt navn:
___________________________________________________________________________
Lugarnummer:
___________________________________________________________________________

Skjema #2 Hurtigruten
Det er ikke noe riktig eller galt svar på spørsmålene nedenfor. Vi vil at du skal svare nøyaktig slik
du føler det.
1. Du har nå sett og besøkt alle de stedene vi viste deg bilder av i går. Vi lurer på hvordan du
opplevde dette
- Hvor glad følte du deg? (0 = Ikke glad, 10 = Veldig glad) Ikke glad Svært glad
0 1 2 3 4 5 6 7 8 9 10
- Hvor mye følte du på en beundring for naturen underveis?
(0 = Ingen beundring, 10 = Sterk beundring) Ingen
beundring Sterk
beundring
0 1 2 3 4 5 6 7 8 9 10
- Hvor sterkt inntrykk gjorde reisen på deg? (0 = Lite inntrykk, 10 = Sterkt inntrykk) Lite
inntrykk Sterkt
inntrykk
0 1 2 3 4 5 6 7 8 9 10
- Hvor fornøyd er det med at du reiste på denne turen? (0 = Ikke fornøyd, 10 = Svært fornøyd) Ikke
fornøyd Svært
fornøyd
0 1 2 3 4 5 6 7 8 9 10
2. Hvilke typer opplevelser hadde du underveis? (0 = Helt uenig, 10 = Helt enig)
- Reisen gav meg mange følelser
Helt uenig Helt enig
0 1 2 3 4 5 6 7 8 9 10
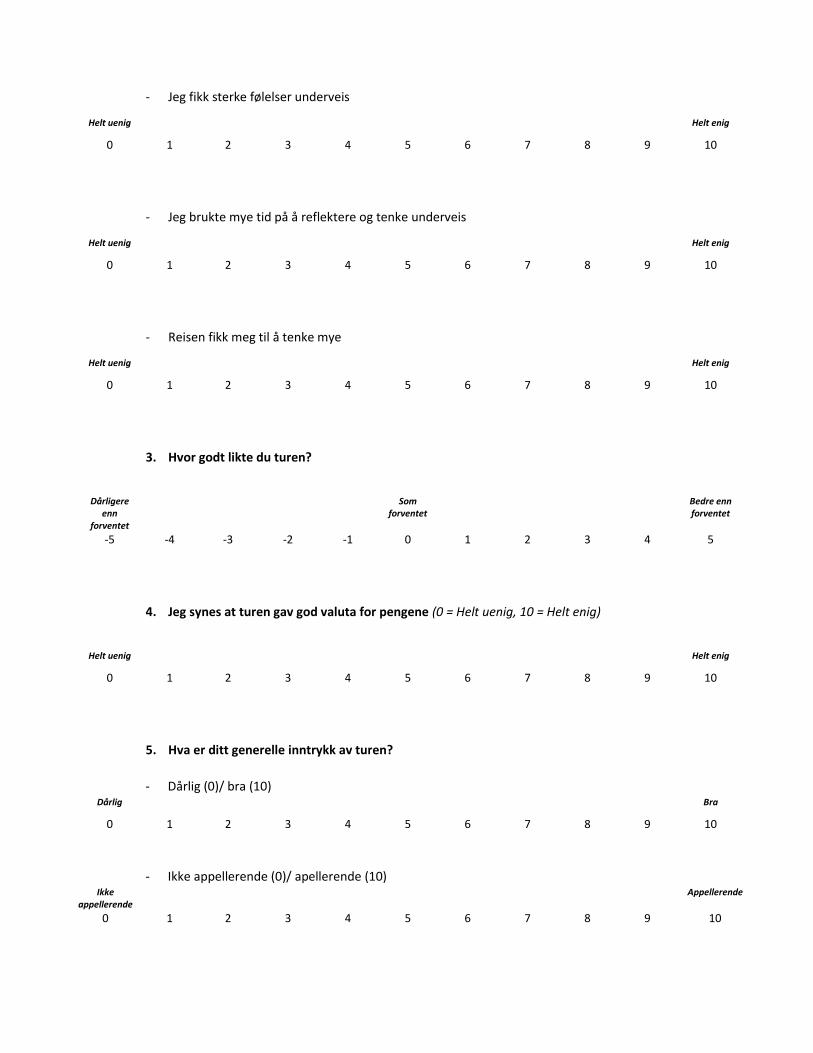
- Jeg fikk sterke følelser underveis
Helt uenig Helt enig
0 1 2 3 4 5 6 7 8 9 10
- Jeg brukte mye tid på å reflektere og tenke underveis
Helt uenig Helt enig
0 1 2 3 4 5 6 7 8 9 10
- Reisen fikk meg til å tenke mye
Helt uenig Helt enig
0 1 2 3 4 5 6 7 8 9 10
3. Hvor godt likte du turen?
Dårligere enn
forventet
Som forventet
Bedre enn forventet
-5 -4 -3 -2 -1 0 1 2 3 4 5
4. Jeg synes at turen gav god valuta for pengene (0 = Helt uenig, 10 = Helt enig)
Helt uenig Helt enig
0 1 2 3 4 5 6 7 8 9 10
5. Hva er ditt generelle inntrykk av turen?
- Dårlig (0)/ bra (10) Dårlig Bra
0 1 2 3 4 5 6 7 8 9 10
- Ikke appellerende (0)/ apellerende (10) Ikke
appellerende Appellerende
0 1 2 3 4 5 6 7 8 9 10

- Lite attraktivt (0)/ attraktivt (10) Lite
attraktivt Attraktivt
0 1 2 3 4 5 6 7 8 9 10
6. Hva synes du om Hurtigruten?
- Jeg ville anbefalt Hurtigruten til en kollega eller en venn (0 = Helt usannsynlig, 10 = Svært
sannsynlig) Helt
usannsynlig Svært
sannsynlig
0 1 2 3 4 5 6 7 8 9 10
- Dersom noen spør, har jeg flest positive ting å si om denne turen med Hurtigruten (0 = Helt
uenig, 10 = Helt enig) Helt uenig Helt enig
0 1 2 3 4 5 6 7 8 9 10
- Det er sannsynlig at jeg kommer til å reise på tur med Hurtigruten igjen i fremtiden (0 = Helt
uenig, 10 = Helt enig)
Helt uenig Helt enig
0 1 2 3 4 5 6 7 8 9 10
7. Til slutt vil vi gjerne stille deg noen spørsmål om innholdet fra denne turen
- Utsikten var spektakulær flere steder underveis (0 = Helt uenig, 10 = Helt enig)
Helt uenig Helt enig
0 1 2 3 4 5 6 7 8 9 10
- Jeg følte jeg fikk et panoramaperspektiv av norsk natur (0 = Helt uenig, 10 = Helt enig)
Helt uenig Helt enig
0 1 2 3 4 5 6 7 8 9 10
- Det var god sikt underveis (0 = Helt uenig, 10 = Helt enig)
Helt uenig Helt enig
0 1 2 3 4 5 6 7 8 9 10

- Det var godt vær underveis (0 = Helt uenig, 10 = Helt enig)
Helt uenig Helt enig
0 1 2 3 4 5 6 7 8 9 10
- Det var behagelig temperatur underveis (0 = Helt uenig, 10 = Helt enig)
Helt uenig Helt enig
0 1 2 3 4 5 6 7 8 9 10

Appendix E: Factor Analysis and Scale
Reliability Check, Study 1 and Study 2
Table E.1: Factor Loadings and Cronbach’s Alpha, Study 1 (1)
Items:Factor 1:
Telepresence
Factor 2:
Enjoyment
Factor 3:
Mental
Imagery
Factor 4:
Predicted
Emotions
Cronbach’s α:
Telepresence 1 .680
Telepresence 2 .832
Telepresence 3 .786 .845
Entertaining -.771
Interesting -.741
Fun -.844 .903
Mental Imagery 1 -.603
Mental Imagery 2 -.825
Mental Imagery 3 -.793 .804
Predicted Happiness .621
Predicted Meaningfulness .794
Predicted Impression .748
Predicted Saitisfaction .855 .846
Eigenvalues: 3.526 1.372 1.267 10.282
Note: Factor loadings below .50 were suppressed
(The factor solution continues on the next page)
158

Table E.2: Factor Loadings and Cronbach’s Alpha, Study 1 (2)
Items:
Factor 5:
Sensory
Experiences
Factor 6:
Affective
Experiences
Factor 7:
Intellectual
Experiences
Factor 8:
Destination
Attitude
Factor 9:
Behavioral
Intentions
Cronbach’s α:
Sensory Experiences 1 .879
Sensory Experiences 2 .755
Sensory Experiences 3 .701 .898
Affective Experiences 1 -.504
Affective Experiences 2 -.563
Affective Experiences 3 -.736 .839
Intellectual Experiences 1 -.885
Intellectual Experiences 2 -.849 .946
Comfortable .852
Attractive .593
Interesting .562 .844
Behavioral Intentions 1 .820
Behavioral Intentions 2 .668
Behavioral Intentions 3 .931 .786
Eigenvalues: 1.019 2.754* 2.754* 1.072 1.989
* These factors were originally one factor, before they were separated
Note: Factor loadings below .50 were suppressed
159
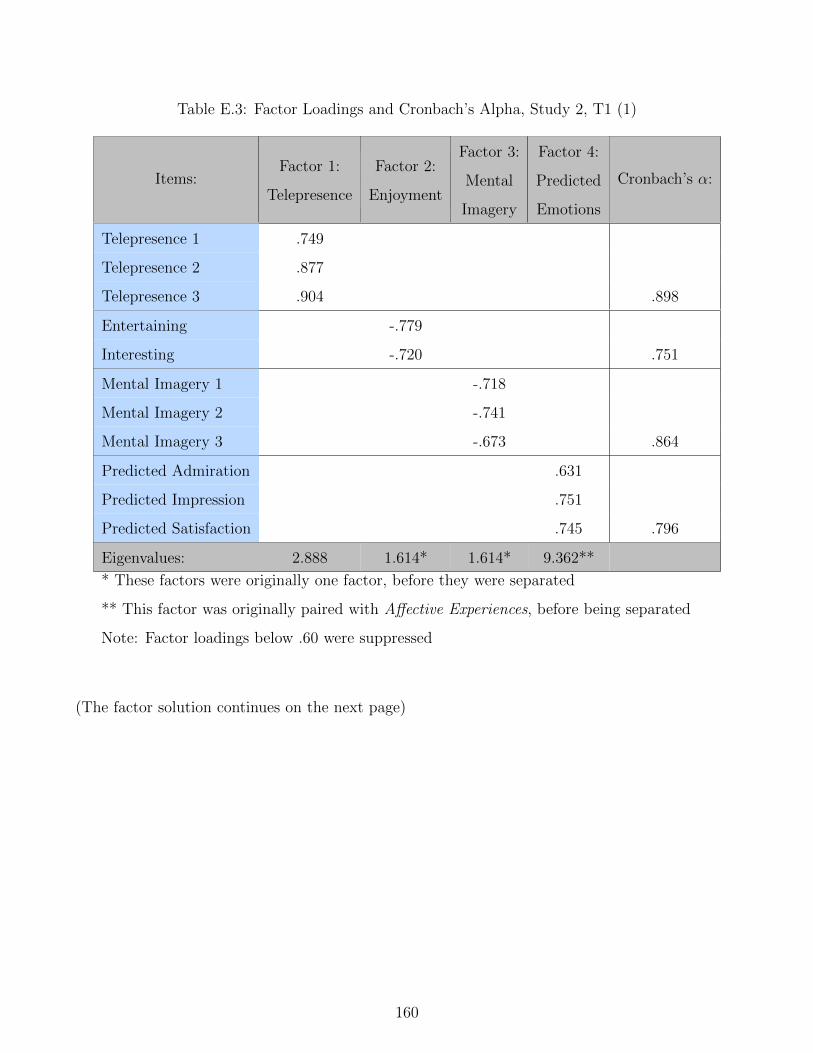
Table E.3: Factor Loadings and Cronbach’s Alpha, Study 2, T1 (1)
Items:Factor 1:
Telepresence
Factor 2:
Enjoyment
Factor 3:
Mental
Imagery
Factor 4:
Predicted
Emotions
Cronbach’s α:
Telepresence 1 .749
Telepresence 2 .877
Telepresence 3 .904 .898
Entertaining -.779
Interesting -.720 .751
Mental Imagery 1 -.718
Mental Imagery 2 -.741
Mental Imagery 3 -.673 .864
Predicted Admiration .631
Predicted Impression .751
Predicted Satisfaction .745 .796
Eigenvalues: 2.888 1.614* 1.614* 9.362**
* These factors were originally one factor, before they were separated
** This factor was originally paired with Affective Experiences, before being separated
Note: Factor loadings below .60 were suppressed
(The factor solution continues on the next page)
160
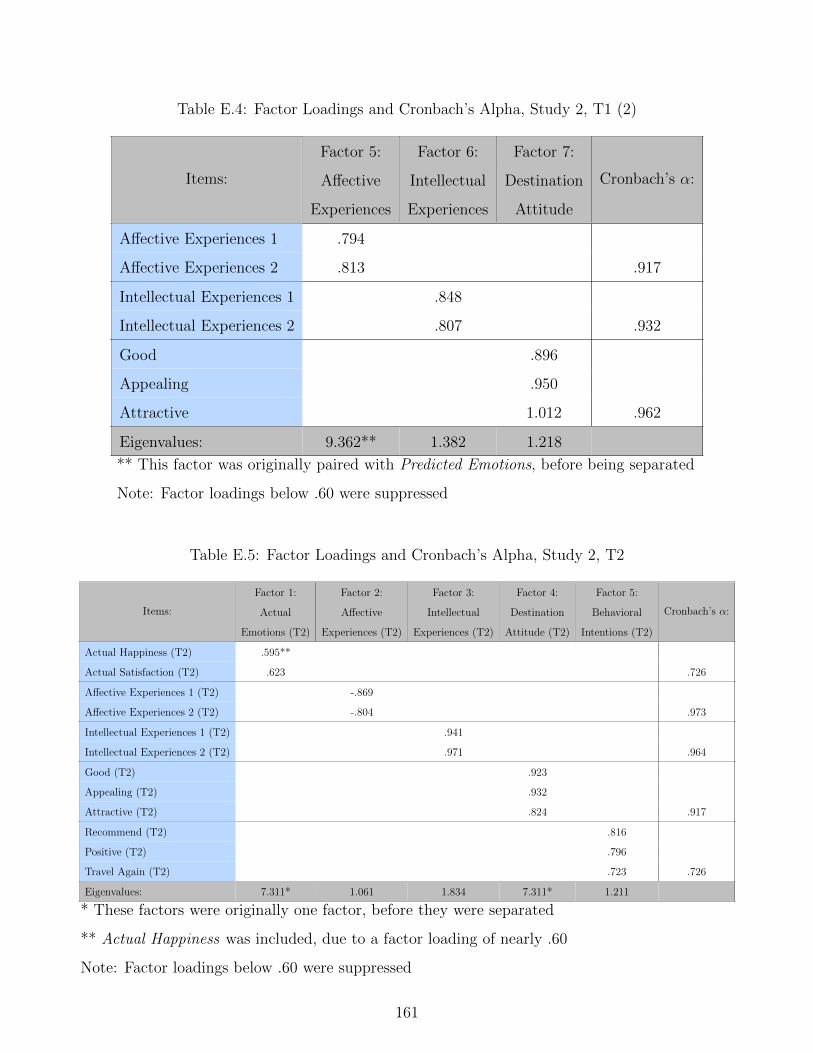
Table E.4: Factor Loadings and Cronbach’s Alpha, Study 2, T1 (2)
Items:
Factor 5:
Affective
Experiences
Factor 6:
Intellectual
Experiences
Factor 7:
Destination
Attitude
Cronbach’s α:
Affective Experiences 1 .794
Affective Experiences 2 .813 .917
Intellectual Experiences 1 .848
Intellectual Experiences 2 .807 .932
Good .896
Appealing .950
Attractive 1.012 .962
Eigenvalues: 9.362** 1.382 1.218
** This factor was originally paired with Predicted Emotions, before being separated
Note: Factor loadings below .60 were suppressed
Table E.5: Factor Loadings and Cronbach’s Alpha, Study 2, T2
Items:
Factor 1:
Actual
Emotions (T2)
Factor 2:
Affective
Experiences (T2)
Factor 3:
Intellectual
Experiences (T2)
Factor 4:
Destination
Attitude (T2)
Factor 5:
Behavioral
Intentions (T2)
Cronbach’s α:
Actual Happiness (T2) .595**
Actual Satisfaction (T2) .623 .726
Affective Experiences 1 (T2) -.869
Affective Experiences 2 (T2) -.804 .973
Intellectual Experiences 1 (T2) .941
Intellectual Experiences 2 (T2) .971 .964
Good (T2) .923
Appealing (T2) .932
Attractive (T2) .824 .917
Recommend (T2) .816
Positive (T2) .796
Travel Again (T2) .723 .726
Eigenvalues: 7.311* 1.061 1.834 7.311* 1.211
* These factors were originally one factor, before they were separated
** Actual Happiness was included, due to a factor loading of nearly .60
Note: Factor loadings below .60 were suppressed
161
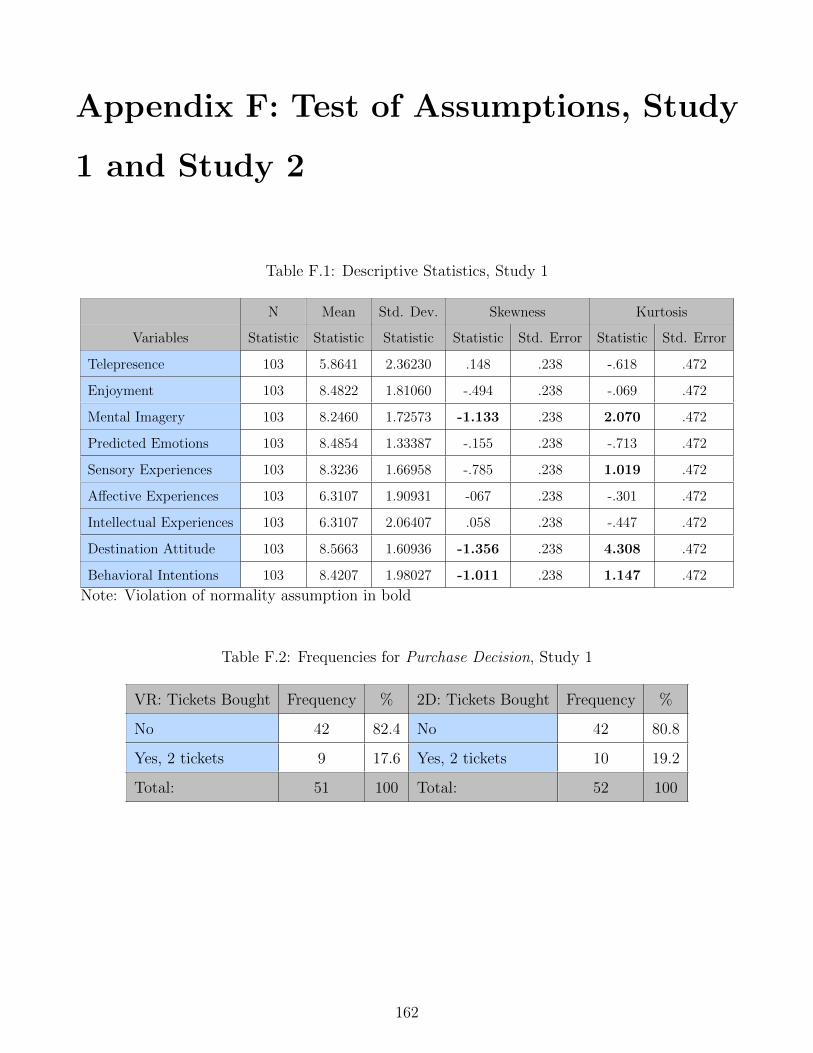
Appendix F: Test of Assumptions, Study
1 and Study 2
Table F.1: Descriptive Statistics, Study 1
N Mean Std. Dev. Skewness Kurtosis
Variables Statistic Statistic Statistic Statistic Std. Error Statistic Std. Error
Telepresence 103 5.8641 2.36230 .148 .238 -.618 .472
Enjoyment 103 8.4822 1.81060 -.494 .238 -.069 .472
Mental Imagery 103 8.2460 1.72573 -1.133 .238 2.070 .472
Predicted Emotions 103 8.4854 1.33387 -.155 .238 -.713 .472
Sensory Experiences 103 8.3236 1.66958 -.785 .238 1.019 .472
Affective Experiences 103 6.3107 1.90931 -067 .238 -.301 .472
Intellectual Experiences 103 6.3107 2.06407 .058 .238 -.447 .472
Destination Attitude 103 8.5663 1.60936 -1.356 .238 4.308 .472
Behavioral Intentions 103 8.4207 1.98027 -1.011 .238 1.147 .472
Note: Violation of normality assumption in bold
Table F.2: Frequencies for Purchase Decision, Study 1
VR: Tickets Bought Frequency % 2D: Tickets Bought Frequency %
No 42 82.4 No 42 80.8
Yes, 2 tickets 9 17.6 Yes, 2 tickets 10 19.2
Total: 51 100 Total: 52 100
162
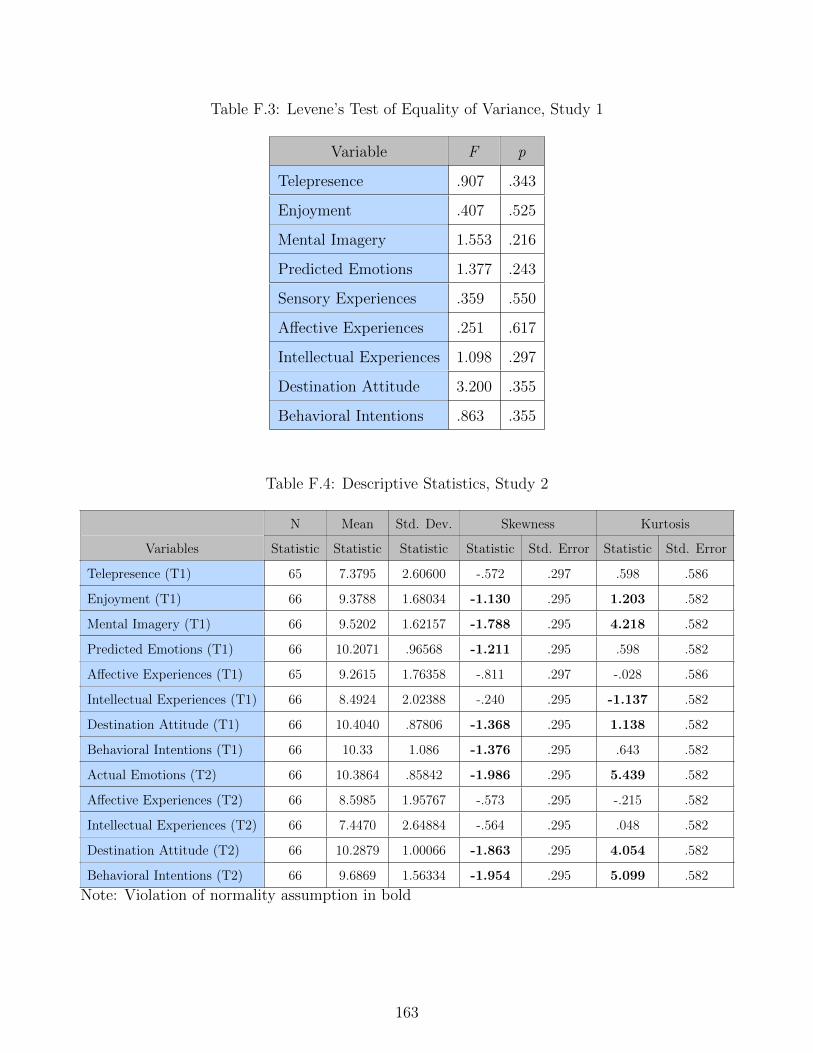
Table F.3: Levene’s Test of Equality of Variance, Study 1
Variable F p
Telepresence .907 .343
Enjoyment .407 .525
Mental Imagery 1.553 .216
Predicted Emotions 1.377 .243
Sensory Experiences .359 .550
Affective Experiences .251 .617
Intellectual Experiences 1.098 .297
Destination Attitude 3.200 .355
Behavioral Intentions .863 .355
Table F.4: Descriptive Statistics, Study 2
N Mean Std. Dev. Skewness Kurtosis
Variables Statistic Statistic Statistic Statistic Std. Error Statistic Std. Error
Telepresence (T1) 65 7.3795 2.60600 -.572 .297 .598 .586
Enjoyment (T1) 66 9.3788 1.68034 -1.130 .295 1.203 .582
Mental Imagery (T1) 66 9.5202 1.62157 -1.788 .295 4.218 .582
Predicted Emotions (T1) 66 10.2071 .96568 -1.211 .295 .598 .582
Affective Experiences (T1) 65 9.2615 1.76358 -.811 .297 -.028 .586
Intellectual Experiences (T1) 66 8.4924 2.02388 -.240 .295 -1.137 .582
Destination Attitude (T1) 66 10.4040 .87806 -1.368 .295 1.138 .582
Behavioral Intentions (T1) 66 10.33 1.086 -1.376 .295 .643 .582
Actual Emotions (T2) 66 10.3864 .85842 -1.986 .295 5.439 .582
Affective Experiences (T2) 66 8.5985 1.95767 -.573 .295 -.215 .582
Intellectual Experiences (T2) 66 7.4470 2.64884 -.564 .295 .048 .582
Destination Attitude (T2) 66 10.2879 1.00066 -1.863 .295 4.054 .582
Behavioral Intentions (T2) 66 9.6869 1.56334 -1.954 .295 5.099 .582
Note: Violation of normality assumption in bold
163

Table F.5: Levene’s Test of Equality of Variance, Study 2, T1
Variable F p
Telepresence (T1) .002 .962
Enjoyment (T1) .542 .464
Mental Imagery (T1) .029 .865
Predicted Emotions (T1) 1.062 .307
Affective Experiences (T1) .289 .593
Intellectual Experiences (T1) 3.011 .088
Destination Attitude (T1) .421 .519
Behavioral Intentions (T1) .100 .753
Table F.6: Levene’s Test of Equality of Variance, Study 2, T2
Variable F p
Actual Emotions (T2) .744 .391
Affective Experiences (T2) 2.539 .116
Intellectual Experiences (T2) .001 .976
Destination Attitude (T2) .014 .906
Behavioral Intentions (T2) 3.455 .068
164