Vedr. bestillingen: ”Undersøgelse af forbrugeradfærd i...
123
DCA - Nationalt Center for Fødevarer og Jordbrug Aarhus Universitet Blichers Allé 20 8830 Tjele Tlf.: 8715 6000 Fax: 8715 6076 E-mail: [email protected] http://dca.au.dk/ DCA - Nationalt Center for Fødevarer og Jordbrug Ulla Sonne Bertelsen Specialkonsulent Dato 22.02.2018 Direkte tlf.: 87 15 76 85 Mobiltlf.: 93 50 85 68 E-mail: [email protected] Afs. CVR-nr.: 31119103 Journal 2017-760-000178 AARHUS UNIVERSITET DCA - NATIONALT CENTER FOR FØDEVARER OG JORDBRUG Til Fødevarestyrelsen Vedr. bestillingen: ”Undersøgelse af forbrugeradfærd i relation til madspild” Fødevarestyrelsen har i bestillingen fremsendt d. 24. marts 2017 bedt DCA – Natio- nalt Center for Fødevarer og Jordbrug – om en rapport, der skal belyse den madspild der foregår hos forbrugerne. Rapporten har før levering været sendt til kommentering hos Fødevarestyrelsen, som har leveret konstruktive kommentarer, der har bidraget til, at rapporten er blevet mere fyldestgørende og læsevenlig. Nedenfor følger besvarelsen med titlen ”Consumer food waste in Denmark”. Rappor- ten er udarbejdet af Post Doc Violeta Stancu og Professor Liisa Lähteenmäki, og den er fagfællebedømt af Professor Klaus G. Grunert, alle fra MAPP Centret i Institut for Virksomhedsledelse, Aarhus Universitet. Besvarelsen er udarbejdet som led i ”Rammeaftale mellem Miljø- og Fødevaremini- steriet og Aarhus Universitet om forskningsbaseret myndighedsbetjening af Miljø- og Fødevareministeriet med underliggende styrelser 2017-2020”. Venlig hilsen Ulla Sonne Bertelsen
Transcript of Vedr. bestillingen: ”Undersøgelse af forbrugeradfærd i...

DCA - Nationalt Center for Fødevarer og Jordbrug Aarhus Universitet Blichers Allé 20 8830 Tjele
Tlf .: 8715 6000 Fax: 8715 6076 E-mail: [email protected] http://dca.au.dk/
DCA - Nationalt Center for Fødevarer og Jordbrug Ulla Sonne Bertelsen Specialkonsulent Dato 22.02.2018
Direkte tlf. : 87 15 76 85 Mobiltlf .: 93 50 85 68 E-mail: [email protected] Afs. CVR-nr.: 31119103
Journal 2017-760-000178
AARHUS UNIVERSITET DCA - NATIONALT CENTER FOR FØDEVARER OG JORDBRUG
Til Fødevarestyrelsen
Vedr. bestillingen: ”Undersøgelse af forbrugeradfærd i relation til madspild”
Fødevarestyrelsen har i bestillingen fremsendt d. 24. marts 2017 bedt DCA – Natio-nalt Center for Fødevarer og Jordbrug – om en rapport, der skal belyse den madspild der foregår hos forbrugerne. Rapporten har før levering været sendt til kommentering hos Fødevarestyrelsen, som har leveret konstruktive kommentarer, der har bidraget til, at rapporten er blevet mere fyldestgørende og læsevenlig. Nedenfor følger besvarelsen med titlen ”Consumer food waste in Denmark”. Rappor-ten er udarbejdet af Post Doc Violeta Stancu og Professor Liisa Lähteenmäki, og den er fagfællebedømt af Professor Klaus G. Grunert, alle fra MAPP Centret i Institut for Virksomhedsledelse, Aarhus Universitet. Besvarelsen er udarbejdet som led i ”Rammeaftale mellem Miljø- og Fødevaremini-steriet og Aarhus Universitet om forskningsbaseret myndighedsbetjening af Miljø- og Fødevareministeriet med underliggende styrelser 2017-2020”. Venlig hilsen Ulla Sonne Bertelsen

DCA – Nationalt Center for Fødevarer og Jordbrug, 20. februar 2018
Consumer food waste in Denmark
Authors:
Violeta Stancu and Liisa Lähteenmäki
The MAPP Centre, Department of Management, BSS, AU
Reviewed by Klaus G. Grunert

2
Summary
Background and aim
Across the food supply chain, a large fraction of the food produced for human consumption is
lost or wasted. The vast amounts of food waste have significant monetary, environmental and
social impacts. The food waste generated by households is one of the main contributors to the
high levels of food waste across the food supply chain. Thus, it is relevant to try and tackle the
food waste at the household level. There is, however, a need to gain a better understanding of
consumers’ perceptions and behaviours related to food waste in order to inform potential
attempts to limit consumer food waste. The present project aimed to study consumer food waste
with an emphasis on consumer perceptions and practices related to food waste.
Methods
This report is based on data from an online questionnaire conducted in Denmark. The
questionnaire was completed by 508 respondents. The measures included in the questionnaire
referred to consumer self-reported food waste behaviour, perceptions and understanding of food
waste, perceptions regarding food edibility, food-related practices and skills, as well as
individual characteristics and socio-demographics. Consumers’ perceptions and behaviours are
described based on descriptive statistics. Moreover, logistic regression was used to investigate
the associations between individual characteristics and self-reported food waste.
Results
In general, participants were well aware of the issue of food waste, yet, some respondents did not
have a clear understanding of the whole concept of food waste. Most respondents reported that in
their household little food is discarded. Respondents varied in their perceptions of the edibility of
certain foods or parts of foods. There were also some differences in how people deal with food
products when they have doubts about food safety or when the products have passed their
expiration date. At large, respondents reported that they engage often in food waste preventing
practices at the different stages in the household food provisioning. On the other hand, the food
waste promoting practices were less frequent. In terms of individual characteristics, respondents

3
were highly motivated to reduce food waste. One of the most important incentives to motivate
people to reduce food waste was saving money. Consumers’ motivation to reduce food waste
and their thrifty consumer identity have the potential to help limit food waste. On the other hand,
consumers’ impulsive buying tendency and their disgust sensitivity can be seen as barriers
towards reducing food waste.

4
Contents
1. Introduction ........................................................................................................................... 7
2. Conceptual framework of consumer food waste .............................................................. 11
3. Method .................................................................................................................................. 14
3.1. Study design ................................................................................................................... 14
3.2. Participants ..................................................................................................................... 14
3.3. Questionnaire measures.................................................................................................. 18
Consumer understanding and awareness of food waste ........................................................ 20
Self-reported food waste behaviour ....................................................................................... 20
Consumer perceptions of food edibility and assessment of edibility .................................... 20
Food-related practices in the households ............................................................................... 21
Food-related skills in the households .................................................................................... 22
Individual characteristics and food waste .............................................................................. 22
3.4. Data analyses .................................................................................................................. 24
4. Results ................................................................................................................................... 25
4.1. Consumer understanding and awareness of food waste ................................................. 25
Consumer understanding of food waste ................................................................................ 25
Consumer awareness of food waste....................................................................................... 26
Consumer awareness of food waste consequences................................................................ 27
Consumer perception of food fed to pets/animals ................................................................. 28
Section summary - Consumer understanding and awareness of food waste ......................... 29
4.2. Self-reported food waste behaviour ............................................................................... 29
Food waste by food categories .............................................................................................. 29
Food waste by functional categories ..................................................................................... 31
Food waste scenarios ............................................................................................................. 32
Section summary - Self-reported food waste behaviour ....................................................... 39
4.3. Food waste and household characteristics ..................................................................... 39
Section summary - Food waste and household characteristics .............................................. 41
4.4. Consumer perceptions of food edibility and assessment of edibility ............................. 41

5
Consumer perceptions of food edibility ................................................................................ 41
Consumer strategies for assessing the edibility of food ........................................................ 43
Section summary - Consumer perceptions of food edibility and assessment of edibility ..... 47
4.5. Food-related practices in the households ....................................................................... 47
Food-related practices in the Planning & Shopping stage ..................................................... 47
Food-related practices in the Storage stage ........................................................................... 48
Food-related practices in the Cooking and preparing food stage .......................................... 49
Food-related practices and norms in the Eating stage ........................................................... 50
Coordination of household food-related practices ................................................................. 51
Section summary - Food-related practices in the households ............................................... 52
4.6. Food-related skills in the households ............................................................................. 53
4.7. Individual characteristics and food waste ...................................................................... 53
Motivation to reduce food waste ........................................................................................... 53
Relationships between individual characteristics and the food waste clusters ...................... 56
Section summary - Individual characteristics and food waste .............................................. 57
4.8. Socio-demographic characteristics and food waste ....................................................... 58
Section summary - Socio-demographic characteristics and food waste ................................ 61
5. Discussion and Conclusions ................................................................................................ 61
5.1. Consumer understanding and awareness of food waste ................................................. 61
5.2. Self-reported food waste behaviour ............................................................................... 62
5.3. Food waste and household characteristics ..................................................................... 62
5.4. Consumer perceptions of food edibility and assessment of edibility ............................. 62
5.5. Food-related practices in the households ....................................................................... 63
5.6. Individual characteristics and food waste ...................................................................... 64
5.7. Future research ............................................................................................................... 65
5.8. Summary of main implications ...................................................................................... 66
5.9. Conclusion ...................................................................................................................... 70
References ..................................................................................................................................... 71
Appendices .................................................................................................................................... 74
Appendix 1 ................................................................................................................................ 75
6
Appendix 2 ................................................................................................................................ 85
Appendix 3 ................................................................................................................................ 88
Appendix 4 .............................................................................................................................. 108
Appendix 5 .............................................................................................................................. 110
Appendix 6 .............................................................................................................................. 112
7
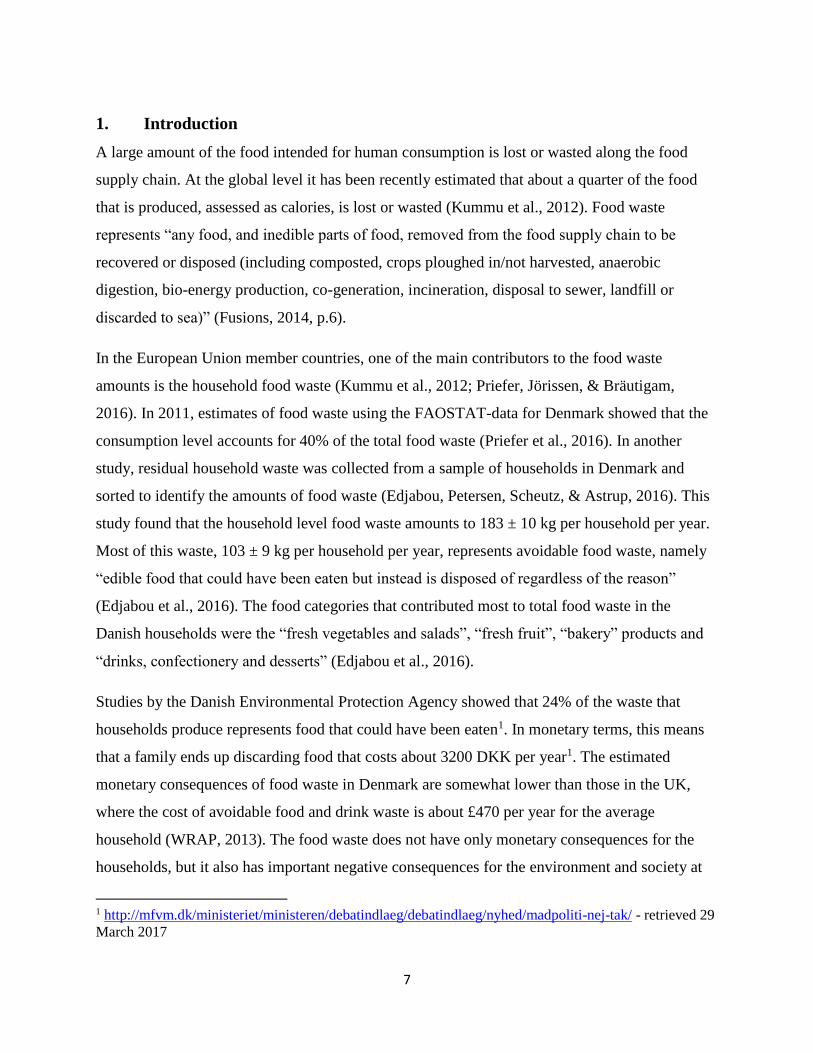
1. Introduction
A large amount of the food intended for human consumption is lost or wasted along the food
supply chain. At the global level it has been recently estimated that about a quarter of the food
that is produced, assessed as calories, is lost or wasted (Kummu et al., 2012). Food waste
represents “any food, and inedible parts of food, removed from the food supply chain to be
recovered or disposed (including composted, crops ploughed in/not harvested, anaerobic
digestion, bio-energy production, co-generation, incineration, disposal to sewer, landfill or
discarded to sea)” (Fusions, 2014, p.6).
In the European Union member countries, one of the main contributors to the food waste
amounts is the household food waste (Kummu et al., 2012; Priefer, Jörissen, & Bräutigam,
2016). In 2011, estimates of food waste using the FAOSTAT-data for Denmark showed that the
consumption level accounts for 40% of the total food waste (Priefer et al., 2016). In another
study, residual household waste was collected from a sample of households in Denmark and
sorted to identify the amounts of food waste (Edjabou, Petersen, Scheutz, & Astrup, 2016). This
study found that the household level food waste amounts to 183 ± 10 kg per household per year.
Most of this waste, 103 ± 9 kg per household per year, represents avoidable food waste, namely
“edible food that could have been eaten but instead is disposed of regardless of the reason”
(Edjabou et al., 2016). The food categories that contributed most to total food waste in the
Danish households were the “fresh vegetables and salads”, “fresh fruit”, “bakery” products and
“drinks, confectionery and desserts” (Edjabou et al., 2016).
Studies by the Danish Environmental Protection Agency showed that 24% of the waste that
households produce represents food that could have been eaten1. In monetary terms, this means
that a family ends up discarding food that costs about 3200 DKK per year1. The estimated
monetary consequences of food waste in Denmark are somewhat lower than those in the UK,
where the cost of avoidable food and drink waste is about £470 per year for the average
household (WRAP, 2013). The food waste does not have only monetary consequences for the
households, but it also has important negative consequences for the environment and society at
1 http://mfvm.dk/ministeriet/ministeren/debatindlaeg/debatindlaeg/nyhed/madpoliti-nej-tak/ - retrieved 29
March 2017

8
large (Aschemann-Witzel, de Hooge, Amani, Bech-Larsen, & Oostindjer, 2015). Food waste
impacts the environment due to, for instance, greenhouse gas emissions as well as waste of
resources that are used to produce food that ends up being discarded (Priefer et al., 2016; WRAP,
2013). Moreover, when food is wasted at the consumption level, the environmental impacts are
even higher as they accumulate throughout the stages of the supply chain (Priefer et al., 2016).
Finally, reducing food waste would mean that more people could be fed, and thus, higher food
security could be achieved globally (Kummu et al., 2012).
Given that the food waste amounts are rather large and that food waste has serious consequences,
it is worth to try and tackle the issue of food waste at the household level. In order to inform
attempts to reduce consumer food waste, there is a need for more knowledge about consumer
perceptions and practices related to food waste. Currently, the published academic literature (for
reviews see: Aschemann-Witzel et al., 2015; Canali et al., 2017) and reports from Danish
authorities in the area of consumer food waste related behaviour are still limited. The previous
studies on consumer food waste show that there are a variety of drivers of food waste, however,
many of the studies are qualitative. Moreover, the few existing quantitative studies measure only
a limited amount of factors and their relation to food waste. Thus, there is a need to deepen the
knowledge regarding consumers’ perceptions and behaviours related to food waste.
The current project aimed to study consumer food waste with a focus on consumer perceptions
and practices related to food waste. The insights related to consumer food waste can contribute to
identify ways to reduce food waste at the consumption level. More specifically, the aims of this
project were to study:
1) how consumers understand food waste,
2) practices and skills related to the household food provisioning promoting or preventing
food waste,
3) characteristics of the individuals (e.g. socio-demographics, individual tendencies or
values) and households (e.g. household stability) associated with food waste.

9
There are expert definitions of food waste but, it is still not clear what consumers understand by
food waste and to what extent they are aware of food waste related issues. Moreover, some
definitions of food waste make a reference to food that was edible prior to disposal (e.g. WRAP,
2009). Thus, the concept of food waste is closely linked to the edibility of food. Yet, from the
consumer perspective, there are some differences between people regarding what foods or parts
of foods they perceive as edible and how they assess whether foods are edible (Blichfeldt,
Mikkelsen, & Gram, 2015; Miljøstyrelsen, 2016; Van Boxstael, Devlieghere, Berkvens,
Vermeulen, & Uyttendaele, 2014). These different views can reflect in consumers’ perceptions
and understanding of food waste. Therefore, consumer understanding of food waste and
perceptions related to food waste were considered in this study.
At the household level, food waste represents the last step of the household food provisioning
system. This means that food waste will be influenced by other food-related behaviours in
previous steps of the system (e.g. planning, shopping, storing, cooking). Previous studies show
that people’s food-related practices at home are some of the main drivers of food waste (Farr-
Wharton, Foth, & Choi, 2014; Miljøstyrelsen, 2016; Stancu, Haugaard, & Lähteenmäki, 2016).
Yet, only few quantitative studies have linked such behaviours to food waste and these looked
only at some of the steps in the food provisioning system. There is a need to investigate more in
depth the types of food-related practices that can prevent or promote food waste. Closely linked
to the food-related practices at home are people’s food-related skills. The extent to which people
are skilled in dealing with the food-related activities at home can in turn play a role in food
waste. Indeed, people’s lack of skills to cook with what they have is seen as a barrier to reduction
of food waste (Miljøstyrelsen, 2016). In addition, having the skills to assess the edibility of foods
is important when making the decisions of using or throwing away foods (Miljøstyrelsen, 2016).
Furthermore, in some cases lack of coordination between the household members in relation to
the food practices can lead to food waste (Miljøstyrelsen, 2016). Therefore, food-related
practices and skills to deal with them were considered in this study.
Another set of factors that can have an impact on consumer food waste are related to
characteristics of the individuals and households (Aschemann-Witzel et al., 2015). One of the
closest indicators of consumers’ behaviour is their motivation to engage in the behaviour. The

10
extent to which people are motivated to reduce food waste in their household can explain their
food waste in part. Moreover, people may be motivated to reduce their food waste due to various
incentives, like saving money or feelings of satisfaction with self (Miljøstyrelsen, 2016). In
addition, people’s values and other individual tendencies (e.g. impulsive buying, identities) can
be linked to food waste (Visschers, Wickli, & Siegrist, 2016). Regarding household
characteristics, the household size is consistently found to play a role in how much food people
waste (Koivupuro et al., 2012). However, the stability of the household size (i.e. is there always
the same number of household members living at home) or the distribution of labour (e.g. is one
person responsible for food-related activities or is the responsibility shared) may also play a role
in food waste. Furthermore, it seems that households that rely a lot on convenience food, waste
more food (Mallinson, Russell, & Barker, 2016). Yet, it is less clear if cooking from scratch
would be linked to less food waste. Finally, people’s buying behaviour is one of the main causes
of food waste (Brook Lyndhurst, 2007), thus, the frequency of grocery shopping in households
may be linked to food waste. Such factors, related to the individual and household
characteristics, were considered in this study.
Self-reported measures of consumer food waste were used in the present study. Such measures
are feasible for large surveys and they are frequently used in prior literature on consumer food
waste (Neff, Spiker, & Truant, 2015; Stancu et al., 2016; Visschers et al., 2016). Self-reported
measures do have some weaknesses though, as they are vulnerable to social desirability and
under-reporting. The purpose of the present study was not to estimate the amounts of consumer
food waste, thus, we used self-reported measures to get a relative indication of consumer food
waste and whether respondents are at the high or low end of it. A recent study compared
different measures of consumer food waste and found that self-reported measures are correlated
with food waste amounts measured using diaries or actual collection of waste (van Herpen et al.,
2016). The latter types of methods though are not feasible for large studies among representative
samples as they require a lot of effort from the participants.
In the following, the conceptual framework of the study will be described. This will be followed
by a section regarding the methods used in the present study. Then the results will be detailed
and, finally, there will be a section for discussion and conclusions.

11
2. Conceptual framework of consumer food waste
Understanding the factors that play a role in consumers’ food waste behaviour is of critical
importance to support attempts to tackle consumer food waste. Prior literature in the area of
consumer food waste has identified several factors as relevant antecedents of food waste.
First, several psychographic factors (i.e. attitudes, interests or lifestyle) related to the individual
consumers have been shown to influence food waste (Aschemann-Witzel et al., 2015; Stancu et
al., 2016; Visschers et al., 2016). The main psychographic factors are related to consumers’
motivation to reduce food waste. The important role of motivational factors as close drivers of
behaviour is supported by the Theory of Planned Behaviour (Ajzen, 1991). This theory suggests
that the main determinant of consumer behaviour is the intention to engage in the behaviour,
namely the motivation or willingness to perform the behaviour. Higher motivation to reduce food
waste is linked to lower self-reported food waste. However, other motivational factors play a role
as well. Consumer self-identities, namely how people see themselves, give people motivation to
act in line with their perception of who they are (van der Werff, Steg, & Keizer, 2013; Visschers
et al., 2016). Moreover, people’s values are related to their self-identities which in turn give
people motivation to engage in behaviours that are in line with their values (van der Werff et al.,
2013).
In addition to motivational factors, consumers’ perceived ability to engage in a certain behaviour
determines the likelihood that people will engage in that behaviour (Ajzen, 1991; Bandura,
1977). In the consumer food waste research, prior studies find that people’s perceived ability to
reduce food waste plays an important role above and beyond motivational factors (Stancu et al.,
2016; Visschers et al., 2016).
Finally, some psychographic factors can act as barriers to reduction of food waste. Two
individual tendencies have been included in the conceptual framework, as they were deemed
relevant in the study of consumer food waste. First, purchasing too much food is strongly linked
to food waste (Stancu et al., 2016) and individuals’ impulsive buying tendency can explain why
some people are more prone to engage in impulse buying (Verplanken & Herabadi, 2001).
Therefore, impulsive buying tendency can act as a barrier towards avoidance of food waste.

12
Moreover, avoidance of food waste is in part related to people’s willingness to eat leftovers or
products that start to show signs of decay. For example, a recent study shows that reuse of
leftovers is important in avoiding food waste (Stancu et al., 2016). People differ in their
perceptions of which foods are edible. The way people make judgements about edibility is
ultimately linked to feelings of disgust (Blichfeldt et al., 2015). Individuals’ disgust sensitivity is
an individual trait in which people differ. It captures people’s tendency to be more or less easily
disgusted by specific food-related cues like signs of decay, and may contribute to unwillingness
to eat foods that are perceived as having quality flaws (Hartmann & Siegrist, 2018). Therefore,
this individual tendency may act as a barrier towards avoidance of food waste for some
consumers.
In addition to individual-related psychographics, the household food-related practices and
skills in food provisioning are found to explain the self-reported food waste behaviour
(Aschemann-Witzel et al., 2015; Stancu et al., 2016). Food waste is interlinked with other food-
related behaviours in the household food provisioning, like shopping or cooking. Therefore, the
practices and skills that households have around food can promote or prevent food waste
(Aschemann-Witzel et al., 2015; Stancu et al., 2016).
Finally, socio-demographic factors and household characteristics can help explain consumer
food waste (Aschemann-Witzel et al., 2015). Some of the main socio-demographics with a role
in food waste are the age and household size (Aschemann-Witzel et al., 2015; Koivupuro et al.,
2012; Visschers et al., 2016). Younger consumers and larger households produce more waste.
Moreover, the types of foods consumed by households can impact their food waste (Mallinson et
al., 2016). A strong preference for fresh food may lead to higher stocks of perishable foods,
while reliance on convenience foods can lead to food waste.
The conceptual framework of consumer food waste for the present study covers these three sets
of factors that play a role in food waste (See Figure 1).

13
Figure 1. Conceptual framework of consumer food waste

14
3. Method
3.1. Study design
The data for this study was collected by an online questionnaire in Denmark in September 2017.
The sample of respondents was provided by the market agency YouGov, from their panel. The
median time for completing the survey was 26 minutes.
3.2. Participants
The online questionnaire was targeted towards a representative sample (on gender, age, and
region) of people above 18 years old from Denmark. Overall, a total of 508 participants
completed the survey.
The respondents were aged between 18 and 86 years old, with a mean age of 49 years old. There
was almost equal distribution on gender, with 51% of respondents being males. The vast
majority of our respondents came from households that have a stable number of household
members. Only 11% of participants came from households where the number of people living in
the household changes over a typical two-weeks period (for example, due to shared custody of
kids, frequent travelling in relation to work).
In stable households, most respondents come from households with two members. Furthermore,
most of the respondents who come from households with a stable size, have no children under 16
years old living in their household (see Table 1). Among the respondents coming from flexible
size households, 56% reported having at least one child under 16 years old living in the
household at least sometimes. Overall, the average number of members living at home most of
the time in flexible size households was similar to that of the stable size households (see Table
2).
Table 1. Household size in households with a stable number of members
0 1 2 3 4 or more
Household size 31% 45% 11% 13%
Children under 16
years old
82% 9% 8% 1% 0%

15
Table 2. Average household size for stable and flexible size households
Mean N
Flexible size households 54
Lowest number of people who live in the household 1.8
How many of them are children (under 16 years old) 0.4
Highest number of people in total who live in the household 3.2
How many of them are children (under 16 years old) 1.1
Number of people in total who live in the household for the
most part of the time 2.3
How many of them are children (under 16 years old) 0.6
Stable size households 454
Number of people in total who live in the household 2.1
How many of them are children (under 16 years old) 0.3
In the whole sample, about 22% of respondents came from households with at least one child
under 16 years old. In Denmark, the proportion of households who have at least one child is at
about 29%, while the percentage of families who have at least one child is 26%2. Yet, the
definition of children in the household/family is different than the one in this study. In the
Statistics Denmark data, children living at home are individuals under 25 years old who live at
the same address with at least one of the parents, who have never been married or in a registered
partnership and who have no children of their own (children under 18 years old not living with
parents will be considered as a separate family if they meet certain criteria)3. Given that there are
some differences between the definitions of children living in the household, the difference in
percentages of households with children between our sample and the general population can be
considered quite small.
Household characteristics
We asked the respondents some questions about the characteristics of their household that can
play a role in food waste (for details see Appendix 1). First, prior studies show that relying
heavily on convenience food is associated with higher food waste (Mallinson et al., 2016).
Therefore, the types of foods/meals that people eat at home were included in this study. In
2 http://www.statbank.dk/10012 (computed based on data in Tables FAM55N and FAM44N, 2017 data) 3 http://www.dst.dk/en/Statistik/dokumentation/documentationofstatistics/households--families-and-
children
16
addition, having a strong preference for fresh food implies that more perishable foods may be
available at home, some of which may not be used before they spoil. Furthermore, households
where shopping is done frequently can end up buying more food due to in-store cues, thus, the
frequency of grocery shopping is relevant. Finally, the distribution of labour at home in relation
to food-related activities is important, as when people share the responsibility there is a need for
coordination in order to avoid food waste promoting behaviours like double purchases.
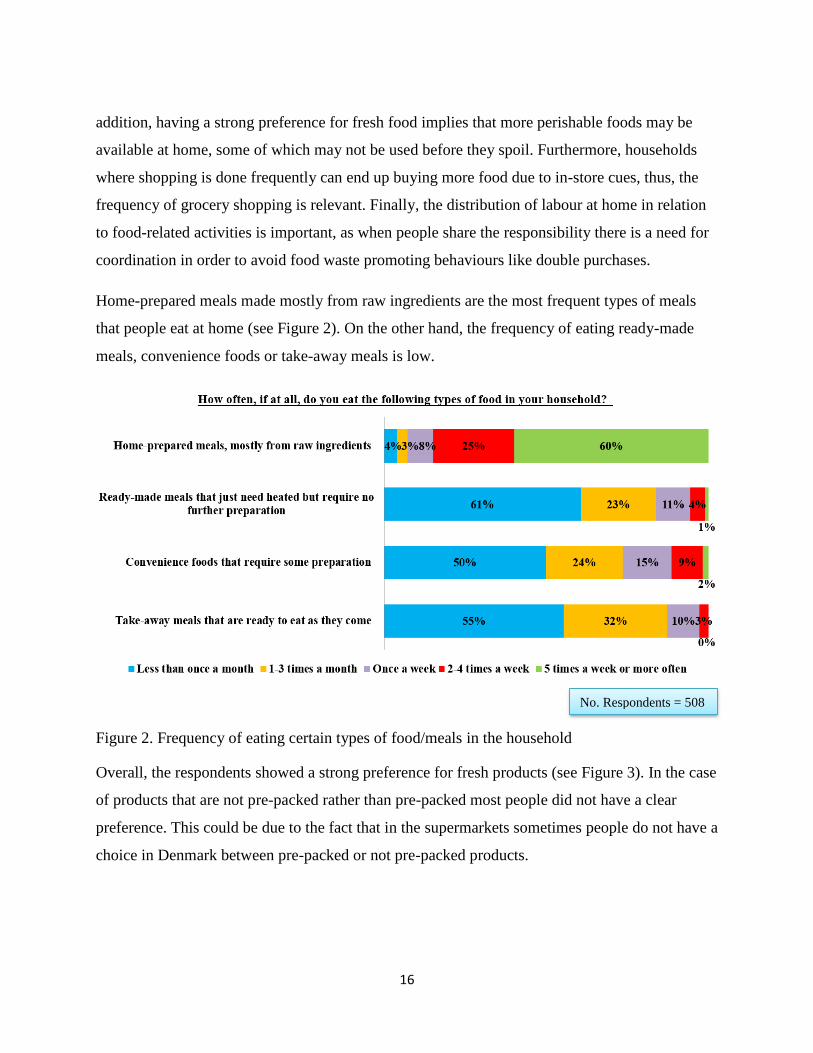
Home-prepared meals made mostly from raw ingredients are the most frequent types of meals
that people eat at home (see Figure 2). On the other hand, the frequency of eating ready-made
meals, convenience foods or take-away meals is low.
Figure 2. Frequency of eating certain types of food/meals in the household
Overall, the respondents showed a strong preference for fresh products (see Figure 3). In the case
of products that are not pre-packed rather than pre-packed most people did not have a clear
preference. This could be due to the fact that in the supermarkets sometimes people do not have a
choice in Denmark between pre-packed or not pre-packed products.
No. Respondents = 508

17
Figure 3. Preference for fresh food products in the household
Most respondents stated that grocery shopping is done in their household 1-2 times a week or 3-4
times a week (see Figure 4).
Figure 4. Frequency of household grocery shopping
For each of a variety of food-related tasks, more than half of the respondents said that they are
the ones who do all or most of the respective activity (see Figure 5). These results show that
most of the respondents in the present survey are involved in food-related activities in their
household to a significant extent.
No. Respondents = 508
No. Respondents = 508

18
Figure 5. Responsibility for household food-related tasks
The study included some additional demographics (e.g. education, household income). These are
presented in Appendix 2.
3.3. Questionnaire measures
The survey contained a series of questions regarding consumers’ self-reported food waste
behaviour, their understanding of food waste, their perceptions regarding edibility of food, their
food-related practices and skills as well as individual characteristics and socio-demographics.
The flow of the online questionnaire can be seen in Figure 6. The measures included in the
survey were adapted from prior literature when appropriate. The entire questionnaire can be seen
in Appendix 3 (in Danish).
In the following, the main sections of the survey will be briefly described together with the
reasoning for their inclusion in the study. The measures related to these sections are described in
Appendix 1.
No. Respondents = 508

19
Figure 6. Overview of food waste questionnaire
Note! The flow of the survey is as shown in the figure (the sections that are described in the Results are
numbered). The constructs listed under the second bullet point in the Individual characteristics block
were displayed in a random order.
Introduction
Introduction & Informed consent
Background questions
Responsibility for household activities
Household size & Gender
1. Consumer understanding and awareness of food waste
Open-ended question on understanding
Awareness of food waste
Awareness of consequences
2. Self-reported food waste behaviour
Overall waste and types of food
Food waste scenarios
3. Consumer perceptions of food edibility and assessment of edibility
Perceptions of food edibility
How is edibility assessed
4. Food-related practices in the households
Planning & Shopping, Storage, Cooking, Eating, Coordination
5. Food-related skills in the households
Skills in line with practices
6. Individual characteristics
Motivation to reduce food waste & Incentives for motivation
Self-identities, Values (Universalism), Impulsive buying tendency,
Disgust sensitivity, Perceived ability to reduce food waste
Household characteristics
Types of food consumed, Preference for freshness
Socio-demographics
Individual-related (e.g. age)
Household-related (e.g. vegetarian/vegan diet, income)

20
Consumer understanding and awareness of food waste
Prior literature provides some expert definitions of food waste (Edjabou et al., 2016), however,
we know very little about what consumers understand by food waste. Moreover, it is unclear to
what extent are consumers aware of the issue of food waste and its consequences. Consumer
understanding of food waste and perceptions related to food waste can inform attempts to tackle
consumer food waste by showing whether there is need for more information. Therefore, these
were measured in the present study. The measures were adapted from prior literature (Grunert,
Scholderer, & Rogeaux, 2011; Neff, Spiker, & Truant, 2015; Stancu et al., 2016) (for details see
Appendix 1, Section 1).
Self-reported food waste behaviour
As food waste is at the core of this study, household food waste was assessed with self-reported
measures. Three different measures of self-reported household food waste were used in order to
gain a deeper understanding of the food waste behaviour. More precisely, consumers were asked
to estimate how much food is discarded in their household in certain categories or were asked to
state what they would do in certain situations (scenarios) which may lead to food waste. The use
of scenarios allows providing a concrete context, which can facilitate the ability of consumers to
report what they would do in such a situation. Self-reported measures of food waste are common
in the consumer research area and have been used in prior studies of food waste (Neff et al.,
2015; Stancu et al., 2016; Visschers et al., 2016). The measures were adapted from prior
literature (Miljøstyrelsen, 2016; Neff et al., 2015; Stancu et al., 2016) (for details see Appendix
1, Section 2).
Consumer perceptions of food edibility and assessment of edibility
The concept of food edibility is closely linked to food waste with some expert definitions of food
waste making a reference to the edibility of food (WRAP, 2009). However, we know very little
about consumers’ perceptions of edibility. In some cases, food waste may occur because people
do not perceive certain foods or parts of foods (e.g. broccoli stalks) as something that they could
eat. Similarly, when cooked food turns out to be disappointing in taste or appearance, some
people may throw it away because they do not see it as edible. At the same time, how people
deal with products when they are unsure if certain products are still fit for consumption may

21
result in food waste. Some people may choose to throw away such products without even trying
to assess their edibility, while others may try to check if the product is still edible. Thus,
consumers’ perceptions of edibility for certain foods or parts of foods were assessed as well as
the strategies that people use to assess edibility. The measures were adapted from prior literature
(Glanz-Chanos, Friis, & Lähteenmäki, 2016; Miljøstyrelsen, 2016; Van Boxstael et al., 2014)
(for details see Appendix 1, Section 3).
In order to investigate whether people differentiate between the “best before” and “use by” date
labelling we have used a between-subjects design. This means that half of the respondents
answered the “best before” question for smoked salmon and ready-made meals as well as the
“use by” question for liver pate and meat cold-cuts. The other half of the respondents answered
the “use by” question for smoked salmon and ready-made meals as well as the “best before”
questions for liver pate and meat cold-cuts. By comparing the group of people who saw a certain
product with “best before” date to the group who saw the same product with “use by” date, we
can find out if people react differently to the same product when it has a “best before” date as
opposed to a “use by” date.
Food-related practices in the households
There is increasing evidence in prior literature that people’s food-related practices at home are
some of the main drivers of food waste (Farr-Wharton et al., 2014; Miljøstyrelsen, 2016; Neff et
al., 2015; Stancu et al., 2016). Some of the practices are associated with higher food waste, like
excessive buying. Thus, these can be seen as food waste promoting practices. On the other hand,
other food-related practices are associated with lower food waste, like reusing leftovers. Such
practices can, thus, be seen as food waste preventing practices. In this study several food-related
practices (food waste preventing or food waste promoting) at different stages of the household
food provisioning system were investigated. The stages in the household food provisioning
system covered are: Planning & Shopping, Storage, Cooking and Eating. In addition, the level
of coordination related to the food practices in households with more than one member can
impact food waste. Lack of coordination may impact purchases or lead to forgetting foods that
other members bring in the household (Miljøstyrelsen, 2016). Thus, the level of coordination was
investigated in this study. The measures of food-related practices and coordination between

22
household members were adapted from prior literature (Miljøstyrelsen, 2016; Neff et al., 2015;
Schmidt, 2016; Stancu et al., 2016; Visschers et al., 2016) (for details see Appendix 1, Section
4).
Food-related skills in the households
Good food-related skills may allow consumers to avoid some food waste. Being able to cook
with the food available at home or knowing how to make new dishes using leftovers from
previous meals can result in lower waste. Therefore, several food-related skills referring to the
different stages in the household food provisioning were included in this study. The measures
were adapted from prior literature (Hartmann, Dohle, & Siegrist, 2013; Miljøstyrelsen, 2016)
(for details see Appendix 1, Section 5).
Individual characteristics and food waste
Many food-related decisions are ultimately made by individuals. A set of individual
characteristics have been included in the present study due to their potential to help explain
people’s food waste behaviour (for details see Appendix 1, Section 6).
Motivation to reduce food waste
Consumers’ motivation to reduce food waste was assessed as motivation is a close predictor of
behaviour. People who are highly motivated to reduce food waste would be more willing to
reduce the food waste in their household. Furthermore, people may be motivated to reduce their
food waste due to various motivations like saving money or keeping order in the kitchen
(Miljøstyrelsen, 2016). Identifying the incentives that motivate people to reduce their food waste
can provide critical input for designing attempts to reduce food waste at the household level.
These measures were adapted from prior literature (Brook Lyndhurst, 2007; Miljøstyrelsen,
2016; Neff et al., 2015).
Consumer self-identities
Self-identity refers to the label that consumers use to describe themselves, namely it relates to
how people see themselves (van der Werff et al., 2013). People may have several self-identities
and these identities can show how people relate to food. People’s identities can contribute to
explain their food waste behaviour (Visschers et al., 2016).

23
Five types of self-identities were assessed in this study as they are expected to be associated with
people’s food waste behaviour. The thrifty consumer identity refers to seeing oneself as the type
of person who is thrifty when it comes to food. The good homemaker identity refers to those
people who see themselves as the type of person who is good at managing the household. These
two identities may result in better management of the food at home and, thus, lower food waste.
The environmental friendly identity refers to being the type of person who is environmentally
friendly. People who are environmentally friendly may be more likely to avoid being wasteful as
waste harms the environment. The hedonic identity refers to being the type of person who enjoys
eating. Such people may place a high importance on the quality of food, meaning that they may
throw food away more easily. On the other hand, for these people food may have more value,
which means that they may be less likely to throw food out. Finally, the healthy eater identity
refers to those consumers who see themselves as the type of person who eats healthy food. These
people may end up using more fresh foods (e.g. fresh fruits and vegetables) which are perishable
and that could mean more waste if such foods are not used in time. However, such people may
also be more concerned with the food they eat and, thus, have better management of their food.
These measures were adapted from prior literature (van der Werff et al., 2013).
Consumer values
Values are basic individual orientations that underlie consumer behaviour or attitudes (Schwartz,
2001). For the study of consumer food waste, the universalism value was considered relevant as
it relates to understanding, appreciating and protecting the welfare of all people and the
nature/environment (Schwartz, 2001). This value was selected as it is expected to relate to
people’s self-identities and it may be linked with lower food waste, especially when people
perceive food waste as an environmental or social problem. The measure of universalism value
was adapted from prior literature (Schwartz, 2001).
Consumer perceived ability to reduce food waste
Consumers’ perceived ability to engage in a certain behaviour has an impact on the likelihood
that they will take up the behaviour (Bandura, 1977). In the case of food waste, the extent to
which people believe that they can reduce the amount of food waste discarded by their household
is expected to impact the level of food waste.

24
Impulsive buying tendency
Shopping practices are important in consumer food waste. People’s impulsive buying tendency
can impact people’s shopping behaviour which can result in more food waste. Impulsive buying
tendency is an individual trait that leads people to make spontaneous purchases (Rook & Fisher,
1995). People who have high impulsive buying tendency are more sensitive to external cues in
the shopping environment and that may lead to more unplanned or impulsive purchases. The
impulsive buying tendency is not a trait that people either have or do not have. It is a trait of
every consumer, however, each person is situated at a certain point in the impulsive buying
tendency continuum, meaning that some people will be low in impulsive buying tendency while
others will score higher on this tendency (Rook & Fisher, 1995). The measure of impulsive
buying tendency was adopted from prior literature (Park & Dhandra, 2017; Rook & Fisher, 1995;
Thompson & Prendergast, 2015; Verplanken & Herabadi, 2001).
Disgust sensitivity
Disgust sensitivity refers to a person’s susceptibility to be more or less easily disgusted by
specific food-related cues (Haidt, McCauley, & Rozin, 1994; Hartmann & Siegrist, 2018; Rozin,
Fallon, & Mandell, 1984). People’s disgust sensitivity can impact their food waste due to
unwillingness to eat certain foods that cause disgust. We expect that foods triggering disgust will
not be eaten, and thus, will be likely discarded. The measure was partly adapted from prior
literature (Hartmann & Siegrist, 2018).
3.4. Data analyses
The data analyses were conducted in the IBM SPSS Statistics 24 software. Descriptive statistics,
mainly frequencies and means, were used to describe respondents’ perceptions and behaviours.
Furthermore, cluster analysis was used in order to identify if there is any meaningful grouping of
respondents according to their reported food waste in certain food categories. Twostep cluster
analysis was selected for these analyses as it allows using variables that are not continuous.
Pearson’s correlation coefficient was used to identify the associations between individual
characteristics. Additionally, the Chi-square test was used to identify associations between the
food waste behaviour clusters and household characteristics as well as socio-demographics, as

25
these measures were not continuous. Furthermore, ANOVA analyses were used to assess
whether there were differences in perceptions and food-related practices by socio-demographics.
Finally, logistic regression was used to assess the relative importance of individual
characteristics in explaining people’s self-reported food waste behaviour.
4. Results
4.1. Consumer understanding and awareness of food waste
Consumers’ understanding of food waste together with insights into consumer awareness of food
waste can help us to understand whether consumers need more information about food waste.
Consumer understanding of food waste
Respondents were asked an open-ended question on their understanding of food waste at the
beginning of the survey. The use of an open-ended question allowed consumers to give any
answer that they found relevant. Respondents were asked to write what would they say to a
friend if they had to explain to him/her what food waste is. The answers that people gave were
content analysed to identify the overarching themes (the identified themes can be seen in
Appendix 4). When an answer mentioned several themes it was counted towards the frequency
of each of the themes it mentioned.
The most frequent types of answers were that food waste is mainly about excessive buying (see
Table 3). In this case, some respondents went on to explain that excessive purchasing leads to
food that is left unused or gets old or is thrown away or other such aspects. The second most
frequent type of answer was that food waste is about throwing away leftover food or products.
Moreover, many people mentioned that food waste is about throwing away food that is edible
or food that is not used. Then there were those respondents who gave a broad answer of the
type that food waste is food that is thrown away or is about throwing away food. For some
people, food waste is about cooking too much and few of them went on to explain that because
too much is cooked, some of the food is thrown away or not all the food is eaten. Several other
aspects, like food waste at the distribution level (e.g. in supermarkets or restaurants) or food that

26
is thrown away due to date labelling concerns were mentioned less frequently. There were also
some people who did not answer the question or said that they did not know what to answer.
Table 3. Consumer understanding of food waste
Themes Frequency % of
respondents
Excessive purchasing (buying too much, buying on
discount, buying packages too big)
109 21%
Leftover food/products that are thrown away (Throwing
away leftover food/products)
100 20%
Food that is edible (usable) but is thrown away (Throwing
away food that is edible (usable))
94 19%
Food that is not used but thrown away (Throwing away
food that is not used)
85 17%
Food that is thrown away (Throwing away food) 56 11%
Cooking more than can be eaten 53 10%
No answer / Don’t know 38 7%
Waste at the distribution level (e.g. supermarket or
restaurants)
27 5%
Food that gets old is thrown away (Throwing away food
that gets old)
26 5%
Food that is thrown away due to date labelling concerns
(Throwing away food due to date labelling concerns)
20 4%
Excessive consumption 5 1%
Waste of resources 5 1%
Bad management of food 4 1%
Other 4 1%
Note! The answer of each respondent was coded at all applicable themes, thus, some consumers
mentioned more of these themes and they are counted towards the frequency of each of the
codes.
Consumer awareness of food waste
The awareness of food waste among consumers is very high, with 85% of respondents saying
that they have seen or heard something about food waste in the past year. Only 6% of the
respondents have not seen or heard anything related to the issue of food waste in the past year,
and 9% were unsure.
Of those respondents who have seen or heard something about food waste in the past year, most
individuals had seen or heard information about the amounts of food waste and/or ways to avoid

27
food waste (see Figure 7). Additionally, more than half of the participants who had seen or heard
something about food waste in the past year, were aware of information regarding expiration
date labelling. The awareness about composting or other ways to dispose of food waste was low.
Finally, few respondents stated other types of information that they had seen or heard in the past
year, such as information about people who forage for food.
Figure 7. Types of information that consumers are aware of
Consumer awareness of food waste consequences
Respondents were relatively well aware of the environmental and economic consequences of
food waste, but agreed less with the statement that food waste in Denmark has consequences for
the undernourished people in the world (See Figure 8).
No. Respondents = 430

28
Figure 8. Awareness of food waste consequences
Consumer perception of food fed to pets/animals
Slightly more than half of the respondents stated that in their household leftover food fed to pets
or other animals is not seen as food waste (see Figure 9). It can be debated whether food fed to
pets or animals should be seen as food waste (WRAP, 2009), yet, some definitions include food
used to feed animals under food waste (Aschemann-Witzel et al., 2015).
Figure 9. Consumer perception of food fed to pets or other animals
No. Respondents = 508
No. Respondents = 508

29
Section summary - Consumer understanding and awareness of food waste
The awareness of food waste is high among the participants. Concerning certain aspects, like
information about date labelling or social consequences of food waste, there is room for
improvements in consumer awareness.
Although consumers referred to several aspects related to food waste, many respondents covered
only specific aspects (like excessive buying) which shows a fragmented understanding of food
waste.
4.2. Self-reported food waste behaviour
Consumers’ self-reported food waste was assessed in several ways in order to get a deeper
understanding of waste-related behaviours.
Food waste by food categories
For each food category, the majority of the respondents reported “low waste” (waste less than a
tenth of what they buy or produce themselves) in their household (Figure 10). As expected based
on prior studies, higher waste occurs in the fresh fruits and vegetables category as opposed to
other categories (Edjabou et al., 2016; WRAP, 2009). On the other hand, reported waste in the
meat and fish category is very low. This is in line with the idea that food with higher value, like
meat and fish, is less likely to be wasted (Miljøstyrelsen, 2016).
The results presented so far relate to each food category taken separately. In order to find out if
the respondents can be grouped according to their answers to the food waste categories, a cluster
analysis was conducted. Two clusters or groups of consumers could be distinguished based on
their food waste behaviour across the five food categories. The first group was called the “low
waste cluster”, these were respondents who reported “low waste” (i.e. less than a tenth of what
they buy or produce) in all of the five food categories. The second group was called “high waste
cluster” and included those respondents who reported “high waste” (i.e. more than a tenth of
what they buy or produce) in at least one of the five food categories. As Figure 11 shows, most
respondents belong to the “low waste cluster”, namely they waste less than a tenth of what they
buy or produce in all of the five food categories in their household. On the other hand, almost a

30
third of participants belong to the “high waste cluster”, meaning that in their household they
waste more than a tenth of what they buy or produce in at least one of the studied food
categories.
Figure 10. Food waste by food categories
Figure 11. Food waste clusters on food categories
Note! The high waste cluster had a majority of consumers who reported high waste per each
food category, except Milk & Dairy products and Meat & Fish.
No. Respondents = 508
No. Respondents = 508

31
Food waste by functional categories
In terms of functional food categories, most participants reported “low waste” (none or hardly
any waste) per each category in their household (see Figure 12). Waste in the processed products
stored outside of the fridge was the lowest. This is not surprising as it could be expected that
processed products which are not stored in the fridge often have a long shelf life.
Figure 12. Food waste by functional food categories
Further, the association between this measure of food waste and the food waste clusters was
explored. The aim was to identify how those respondents categorised in the “low waste cluster”
or the “high waste cluster” groups answered this measure of food waste. The results show that
there is a significant association between the two measures. Most of the respondents who
reported “low waste” in the functional category belong to the “low waste cluster”, while most of
the consumers who reported “high waste” in the functional category belonged to the “high waste
cluster” in the food waste clusters (Table 4). The close association between these two measures
of food waste implies that the measures used in this study are reliable.
No. Respondents = 508

32
Table 4. Food waste clusters by food waste in functional categories
Raw
ingredients
Processed
products
stored in the
fridge
Processed
foods stored
outside the
fridge
Cooked food
low
waste
high
waste
low
waste
high
waste
low
waste
high
waste
low
waste
high
waste
low
waste
cluster(1)
Count 291a 19b 286a 24b 296a 14b 277a 33b
% within
Functional
category
73% 17% 75% 19% 65% 27% 70% 30%
high
waste
cluster(2)
Count 107a 91b 97a 101b 161a 37b 121a 77b
% within
Functional
category
27% 83% 25% 81% 35% 73% 30% 70%
Total Count 398 110 383 125 457 51 398 110
% within
Functional
category
100% 100% 100% 100% 100% 100% 100% 100%
Pearson Chi-Square>26, df=1, significant at p<.01, different subscript letters show that the
column proportions are significantly different per functional category
(1) Respondents who reported household food waste of less than a tenth of what is bought or
produced in all food categories
(2) Respondents who reported household food waste of more than a tenth of what is bought or
produced in at least one food category
Food waste scenarios
Five scenarios that described certain situations when food waste may occur were used to
understand more in-depth people’s behaviour. The use of scenarios allows providing a concrete
context, which can facilitate the ability of consumers to report what they would do in such a
situation.
Lasagne leftovers scenario
This first scenario aimed to measure people’s food waste behaviour in relation to meat-based
lasagne leftovers. Respondents were asked to imagine that they had just finished eating dinner at
home which consisted of meat lasagne (vegetarians were asked to imagine a vegetarian option)
and salad. Further, the scenario specified that there was still a good portion of lasagne left in the

33
tray (not served on the plates) after dinner. People were then asked what they would do with the
leftover lasagne when cleaning up after dinner.
The vast majority of respondents stated that they would keep the leftovers (see Figure 13). Most
of these respondents would keep the leftovers in the fridge, while some would keep them in the
freezer. Those respondents stating that they would keep the lasagne leftovers (either in the fridge
or the freezer) and those who selected “other”, were asked how likely it would be that they
would eat the kept leftovers. Most respondents reported that in their household it would be very
likely to eat the kept leftovers (see Figure 14).
Figure 13. Lasagne leftovers scenario
Figure 14. Likelihood to use leftovers from lasagne meal
No. Respondents = 490
No. Respondents = 508

34
Composite meal leftovers scenario
In this scenario, the aim was to find out how people deal with leftovers from a meal consisting of
several components. Respondents were instructed to imagine that they had just finished eating
dinner at home, that was made from raw ingredients and consisted of meat (or a vegetarian
option instead of meat if they were vegetarians), potatoes, cooked vegetables, fresh green salad,
and sauce. Further, the scenario specified that there is still some food left of each meal
component after dinner which had not been served on their plates. Then people were asked what
they would do with each meal component when cleaning up after dinner.
In general, people would save the food, especially if there is enough for at least one person to eat
again (see Figure 15). There are some differences between meal components. The sauce is the
least likely to be kept compared to the other components. Among those respondents who selected
“other” for the sauce, most stated that they do not eat sauce.
However, respondents who saved the leftover food (or selected “other”) are not sure if they will
use the food later (see Figure 16). Many of these participants said that it is not likely or it is only
quite likely that the kept leftovers will be eaten in their household. This is of course worrisome
from the food waste perspective.

35
Figure 15. Composite meal leftovers scenario
No. Respondents = 508

36
Figure 16. Likelihood to use leftovers from composite meal
Raw ingredients scenario
The third scenario aimed to find out how people deal with partly used raw ingredients after
preparing a meal. People were asked to imagine that they are preparing a meal and they do not
use some ingredients entirely for the meal. Then respondents were asked what they would do
with the remaining ingredients.
The leftover raw ingredients are most frequently saved, especially in the case of cheese and
meat-based ingredients (see Figure 17). There were some differences between ingredients
though, with leftover onion or canned chopped tomatoes being kept least frequently.
However, many of those respondents who kept the leftover raw ingredients are not likely or are
only quite likely to use the kept ingredient later (see Figure 18).

37
Figure 17. Raw ingredients not used in their entirety scenario
Figure 18. Likelihood to use raw ingredients leftovers
No. Respondents = 508

38
Minced meat about to expire scenario
The fourth scenario was looking to identify whether people prioritize food close to expiry when
cooking. People were asked to imagine that they are about to prepare dinner for which they had
bought fresh fish fillet. The scenario then specified that while looking through the fridge for the
other ingredients for dinner one finds a minced meat pack that expires on the same day. People
were asked what they would do with the minced meat in this case.
There are several strategies that people use when coming across a product about to expire when
they are preparing a meal (see Table 5). Most frequently, respondents stated that they would put
the minced meat in the freezer for future use. This is also one of the options which involved little
effort from the part of the consumer.
Table 5. Strategies to deal with minced meat about to expire
Minced meat about to expire strategies %
I would put the minced meat to the freezer for later use 39%
I would prepare the minced meat now and store the prepared dish for later
use
24%
I would use the minced meat in the dinner now and store the fish for later use 14%
I would make plans to use the minced meat the next day even though it would
have passed its expiration date
12%
I would include the minced meat as a part of the meal that I was starting to
prepare
4%
I would keep it, even if I am not sure what to do with it 3%
I would throw the minced meat out 3%
Other (please specify) 1%
Decaying fruit scenario
The fifth and last scenario was looking to identify people’s strategies when dealing with old or
decaying fresh fruits. People were asked to imagine that they notice 4-5 apples in their fruit bowl
that have gotten old (e.g. wrinkled, bruised, decaying) and report what they would do with the
apples.
Most frequently, participants reported that they would throw away the old apples (see Table 6).
About a tenth of respondents have selected “other”. Most of these respondents specified that they
would give the apples to birds or animals.
No. Respondents = 508

39
Table 6. Strategies to deal with decaying fresh fruit (apples)
Decaying apples strategies %
I would throw them out 31%
I would include them in my cooking plans somehow 20%
I would eat some of them as soon as possible and throw out the leftover
ones
20%
I would make a dessert out of them 12%
I would make juice out of them 6%
Other (please specify) 11%
Section summary - Self-reported food waste behaviour
Most participants report that in their household they waste little food. They reported lowest
waste in the “meat and fish” category and in the “processed foods stored outside the fridge”
category. The majority of participants reported that they would keep leftovers from meals or raw
ingredients from food preparation, but they were not sure that these kept leftovers will be eaten
in their household. Most participants would try to save a product about to expire; however,
decaying fruits are most likely to be discarded.
4.3. Food waste and household characteristics
The associations between household characteristics and the food waste clusters were studied
(“low waste cluster” – reported household food waste of less than a tenth of what is bought or
produced in all food categories; “high waste cluster” - reported household food waste of more
than a tenth of what is bought or produced in at least one food category).
Households with flexible size may face higher challenges when managing the food-related
activities and needs due to the varying number of people living in the household. This could
translate into higher waste in such households. However, in the present study there was no
significant association between the food waste clusters and the stability of the household size.
Though, the number of households with flexible size was small in our random sample. Thus,
future studies interested in the behaviour of these households should target them more directly.
No. Respondents = 508
40
Similarly, when some members of the household do not always eat at home there can be higher
uncertainty around the food-related needs and activities which may lead to food waste. There
was a significant association between the food waste clusters and having some household
members that do not always eat at home (the analysis included only households with more than
one member). Of those respondents who disagreed with not everyone eating at home, about 69%
were categorised in the “low waste cluster”. This was significantly more compared to those
respondents who neither agreed nor disagreed (of which 52% were categorised in the “low waste
cluster”) and to those who agreed (of which 51% were categorised in the “low waste cluster”)
that some people in their household do not always eat at home and were categorized in the “low
waste cluster”. Thus, overall a higher proportion of those people who disagreed with not
everyone eating at home was categorised in the “low waste cluster” compared to those who
agreed or gave a neutral response. The reverse holds for categorisation in the “high waste
cluster”.
Finally, households where grocery shopping is done frequently may be at risk to buy more food
than necessary due to in-store cues which may lead to more food waste. There was a significant
association between the frequency of going grocery shopping and the food waste clusters. Higher
frequency of grocery shopping was associated with higher waste (see Table 7).

41
Table 7. Frequency of grocery shopping and food waste clusters
Frequency of grocery shopping Total
1-2 times a
week or less
3-4 times a week
or more
low waste
cluster(1)
Count 163a 147b 310
% within Frequency
of grocery shopping
68% 55% 61%
high waste
cluster(2)
Count 76a 122b 198
% within Frequency
of grocery shopping
32% 45% 39%
Total Count 239 269 508
% within Frequency
of grocery shopping
100% 100% 100%
Pearson Chi-Square 9.8, df=1, significant at p<.05, different subscript letters show that the
column proportions are significantly different
(1) Respondents who reported household food waste of less than a tenth of what is bought or
produced in all food categories
(2) Respondents who reported household food waste of more than a tenth of what is bought or
produced in at least one food category
Section summary - Food waste and household characteristics
Overall, knowing how many people will eat at home is associated with lower food waste.
Furthermore, participants who stated that in their household grocery shopping is done “1-2 times
a week or less often” reported lower waste.
4.4. Consumer perceptions of food edibility and assessment of edibility
Certain foods or parts of foods (e.g. broccoli stalks) may end up being discarded because people
simply do not regard them as edible. Similarly, when faced with a situation where they are
unsure if a food product is still edible, some people may choose to discard the product
immediately while others may choose to look at the product and try to assess if they can still eat
it.
Consumer perceptions of food edibility
Consumers’ perceptions regarding the edibility of the foods/parts of foods included in the study
varied to a large extent (see Figure 19). The green part of the leek, the broccoli stalks and the

42
apple peels were most frequently considered as something that is always edible by the
respondents. On the other hand, the softened salad, potato peels, carrot peels and fish skin were
most frequently seen as never edible. The high percentage of people who consider carrot or
potato peels as never edible may be due in part to possible misunderstanding of the question. It
may be that some of the people considered that the question only refers to eating the peels
separately and not for example potatoes that are not peeled. Finally, the dry bread, browned
bananas and visible fat in meat were seen most frequently as edible only if they were used in a
specific recipe.
Figure 19. Consumer perceptions of edibility for certain foods/parts of foods
Differences were found as well in people’s perceptions of edibility in relation to leftover food or
cooked food. Leftover food from which one has eaten twice in the same week was most
No. Respondents = 508

43
frequently seen as always edible, while food that starts to look unappealing even if it still can be
eaten is least frequently seen as always edible (see Figure 20).
Figure 20. Consumer perceptions of edibility for cooked food and leftovers
Consumer strategies for assessing the edibility of food
When people are unsure whether a product (ham or strawberries) is still safe to eat, the most
frequent strategy is to assess the eating quality and eat the product if they think that the quality is
good enough (see Figure 21). The second most frequent strategy is to throw the product out.
No. Respondents = 508

44
Figure 21. Strategies used by consumers when in doubt about a food product’s safety
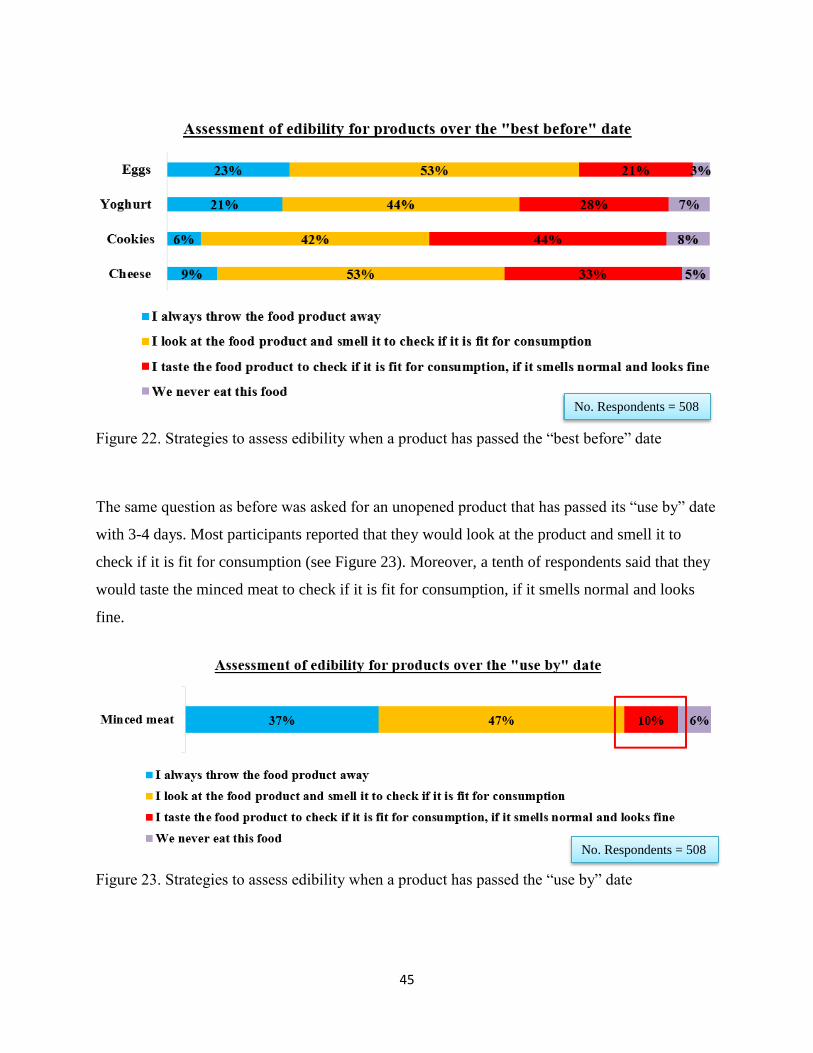
Sometimes it happens that people find products in their fridge that have passed their expiration
date. We asked people what they would do if they find an unopened product in their fridge that
had passed its “best before” date by 3-4 days. Most frequently, in the case of cheese, yoghurt and
eggs, respondents would look at the product and smell it to check if it is fit for consumption (see
Figure 22). For cookies, most respondents would taste them to check if they are fit for
consumption, if they smell normal and look fine.
No. Respondents = 508
45
Figure 22. Strategies to assess edibility when a product has passed the “best before” date
The same question as before was asked for an unopened product that has passed its “use by” date
with 3-4 days. Most participants reported that they would look at the product and smell it to
check if it is fit for consumption (see Figure 23). Moreover, a tenth of respondents said that they
would taste the minced meat to check if it is fit for consumption, if it smells normal and looks
fine.
Figure 23. Strategies to assess edibility when a product has passed the “use by” date
No. Respondents = 508
No. Respondents = 508

46
Strategies to assess edibility of products passed the “best before” versus the “use by”
dates
In order to find out whether people make a difference between the “best before” and “use by”
date labelling when deciding how to deal with an expired product, we used a between-subjects
design (see the Methods section). In general, we find that there are no significant differences
between how people deal with products that have passed the “best before” date or the “use by”
date. There was a small statistically significant difference only for ready-made meals (see Table
8). Of those respondents who saw the ready-made meal with “best before” date, a higher
proportion said that they would taste the food product to check if it is fit for consumption if it
smells normal and looks fine, compared to those who saw the “use by” date.
Table 8. Strategies to deal with ready-made meals passed the “best before” versus the “use by”
date
Date labelling Total
"best
before"
"use
by"
I always throw the food product away Count 41a 58a 99
% within
Date
labelling
16% 23% 20%
I look at the food product and smell it to
check if it is fit for consumption
Count 104a 115a 219
% within
Date
labelling
41% 45% 43%
I taste the food product to check if it is fit for
consumption, if it smells normal and looks
fine
Count 58a 34b 92
% within
Date
labelling
23% 13% 18%
We never eat this food Count 50a 48a 98
% within
Date
labelling
20% 19% 19%
Total Count 253 255 508
% within
Date
labelling
100% 100% 100%
Pearson Chi-Square=9.8, df=3, significant at p<.05, different subscript letters show that the
column proportions are significantly different

47
Section summary - Consumer perceptions of food edibility and assessment of edibility
Consumers vary in their perceptions of edibility in relation to certain foods or parts of foods,
such as the upper part of leeks, fish skin or food that starts to look unappealing.
Participants reported using a variety of strategies when they deal with products that have passed
their expiration date or when they have doubts about food safety. For products passed their
expiration date, many participants try to judge edibility by looking at the product and smelling it.
4.5. Food-related practices in the households
Food waste is the last step in the household food provisioning, thus, it is closely linked to food-
related practices in previous steps. Some of these food-related practices can be seen as food
waste preventing as they help minimize food waste, while others can be seen as food waste
promoting as they may result in food waste.
Food-related practices in the Planning & Shopping stage
The practices of planning the shopping trips or planning the meals in advance can be seen as
food waste preventing (the first two practices in Figure 24). On the other hand, the practices
related to making unplanned purchases or buying more than necessary can be considered food
waste promoting practices (the remaining practices in Figure 24).
The majority of people often check their food inventories at home before going grocery
shopping. On the other hand, making meal plans is not such a common practice. In terms of food
waste promoting practices, the most frequent one relates to buying products that were not
planned, while the least common one refers to buying food products that people already have at
home (see Figure 24).

48
Figure 24. Frequency of planning and shopping practices (food waste preventing in green
margins and food waste promoting in red margins)
Food-related practices in the Storage stage
In the storage stage, practices such as having a good overview of the food that people have at
home, knowing for how long food has been in the fridge, storing food as seen in the supermarket
(storage in fridge or not), storing meal leftovers in the fridge in transparent or clearly visible
containers, and storing leftovers in the freezer (the first five practices in Figure 25), can be
considered as food waste preventing practices. On the other hand, forgetting food in the fridge
until it is too old to eat or forgetting to use the food from the freezer are practices that promote
food waste (the remaining practices in Figure 25).
A vast majority of respondents engage often or almost always in food waste preventing practices
in relation to storage. While most respondents report that in their household they almost never
forget about the food in the fridge or the freezer, more than a third of respondents say they often
do so (see Figure 25).
No. Respondents = 508

49
Figure 25. Frequency of storage practices (food waste preventing in green margins and food
waste promoting in red margins)
Food-related practices in the Cooking and preparing food stage
At the cooking and food preparing stage, there are several practices that can result in more or less
food waste in the households. Practices like checking what food products are available at home
before starting to cook, prioritizing leftovers and products close to expiry when cooking, using
the leftovers in the lunch pack for the coming day or following a set meal plan when cooking can
prevent food waste (the first four practices in Figure 26). On the contrary, when households
intentionally cook more food than needed in order to ensure that there will be enough or when
households do not eat all the food prepared for a meal, they can end up discarding more food (the
remaining practices in Figure 26).
Most of the respondents engage in food waste preventing practices frequently, except for
following a meal plan when cooking. This is not surprising as in the planning stage we found that
many people do not make a meal plan for the coming days. When it comes to practices that
No. Respondents = 508

50
promote food waste, most respondents report that these practices are frequent in their household
(see Figure 26).
Figure 26. Frequency of cooking practices (food waste preventing in green margins and food
waste promoting in red margins)
Food-related practices and norms in the Eating stage
In the eating stage people’s beliefs about what is proper behaviour when eating, the variety of
foods served for a meal or variations in the number of people who eat at home, can result in food
waste as these aspects can add complexity to the management of food at home.
In general everyone in the household is reported to eat the same food for dinner. When it comes
to proper eating behaviour, half of the respondents strongly believe that one should always eat
what is on one’s plate when eating at home. On the other hand, the food waste promoting
practices do not seem to be largely widespread among the participants (see Figure 27).
No. Respondents = 508

51
Figure 27. Eating related practices and norms (food waste preventing in green margins and food
waste promoting in red margins)
Coordination of household food-related practices
The lack of coordination between household members in relation to food-related activities may
result in food waste. Yet, in this study most participants stated that they almost never experience
lack of coordination regarding specific practices in their household (see Figure 28).

52
Figure 28. Extent of coordination between members of the household regarding food-related
activities
Section summary - Food-related practices in the households
Overall, the participants engage frequently in food waste preventing practices (those behaviours
that may result in lower food waste). There were also some exceptions. In particular, making a
meal plan or following a meal plan when cooking were not very common.
On the other hand, the respondents reported that in their household food waste promoting
practices (those behaviours that may contribute to higher food waste) are less frequent. However,
some practices, such as making unplanned purchases, intentionally cooking more than needed to
make sure that there will be enough and having leftovers after a meal, are quite common.
No. Respondents = 367

53
4.6. Food-related skills in the households
The extent to which people are skilled in dealing with food is closely linked to food waste. It
could be easier for example for people with better cooking skills to include leftovers from a meal
into a new dish or to prepare meals from ingredients that are available at home. In this study, the
most common value of the food-related skills composite was 7 (on a scale from 1 to 7), which
shows that most people strongly believe that their household food-related skills are sufficient.
Similarly, the mean value of 5.66 shows that on average people believe their household skills to
be sufficient.
4.7. Individual characteristics and food waste
Food waste is the result of food-related decisions in the household and such decisions are mainly
made by individuals. As individual characteristics relate to the decisions that people make, these
can be associated to food waste. In this study we included a number of these individual factors to
study their associations with food waste.
People’s motivation to reduce food waste may result in lower waste. Furthermore, consumers’
self-identities can show how people relate to food and, thus, can impact their food-related
behaviours. Individuals’ values in terms of appreciation for the welfare of other people and the
environment can help explain food waste, especially if people believe that food waste has
environmental or social consequences. The extent to which people perceive that they are able to
perform a behaviour is known to explain the likelihood that people will take up the behaviour.
Thus, the perceived ability to reduce food waste may be linked to food waste behaviour. People
who have high impulsive buying tendency are more sensitive to external cues in the shopping
environment and that may lead to more unplanned or impulsive purchases. Finally, people’s
disgust sensitivity (i.e. their susceptibility to be more or less easily disgusted by specific food-
related cues) can impact their food waste due to unwillingness to eat certain foods that cause
disgust.
Motivation to reduce food waste
The most common value of the motivation to reduce food waste was 7 (on a scale from 1 to 7)
which shows that most of the respondents are highly motivated to reduce food waste in their

54
household. Similarly, the mean value of 5.7 shows that on average people are motivated to
minimize their food waste.
The most important incentive that would motivate respondents to reduce their food waste was
thinking about the possibility of saving money. Furthermore, people’s values and helping the
environment were amongst the most important incentives. On the other hand, wanting to feel
competent in the kitchen was the least important incentive (see Figure 29).
Figure 29. Importance of incentives to motivate reduction of food waste
No. Respondents = 508

55
Table 9. Motivation to reduce food waste and individual characteristics descriptives
Minimum Maximum Mean Std.
Deviation
N
Thrifty consumer
identity
1.3 7 5.1 1.28 508
Environmental friendly
identity
1.0 7 4.8 1.43 508
Hedonic identity 1.0 7 5.4 1.28 508
Good homemaker
identity
1.0 7 4.9 1.37 508
Healthy eater identity 1.0 7 4.9 1.28 508
Impulsive buying
tendency
1.0 7 3.4 1.15 508
Disgust sensitivity 1.0 7 2.9 1.33 508
Universalism value 1.7 6 4.0 0.98 508
Perceived ability to
reduce food waste
1.0 7 4.8 1.69 508
Motivation to reduce
food waste
1.0 7 5.7 1.26 508
Regarding the remaining individual characteristics, we find that our respondents vary in terms of
their self-identities, universalism orientation, perceived ability to reduce food waste, impulsive
buying tendency and disgust sensitivity (see Table 9).
On average, respondents scored quite highly on the hedonic identity and the thrifty consumer
identity, which were closely followed by the good homemaker, healthy eater and
environmental friendly identities. We further find that the respondents, on average, scored high
on the universalism value which means that they value the protection of the welfare for all
people and the nature. Similarly, on average, people believe that they are able to reduce the
food waste in their household. On the other hand, on average, people score low on impulsive
buying tendency and disgust sensitivity (perceiving eating certain foods to be disgusting) (see
Table 9).

56
Relationships between individual characteristics and the food waste clusters
The relationships between the individual characteristics and people’s motivation to reduce food
waste or their self-reported food waste behaviour are important as they can show which
characteristics play an important role in food waste.
First, the associations between motivation to reduce food waste and the other individual
characteristics were investigated. The associations between individual characteristics and
motivation are important as they can show which characteristics need to be considered when
trying to develop attempts to increase motivation to reduce food waste.
Overall, people’s self-identities, universalism and perceived ability to reduce food waste are
positively linked to motivation to reduce food waste, while impulsive buying tendency and
disgust sensitivity are negatively associated with the motivation to reduce food waste (see Table
10). Therefore, the impulsive buying tendency and the disgust sensitivity could be seen as
barriers to people’s motivation to reduce their food waste.
Table 10. Correlations between individual characteristics and motivation to reduce food waste
Motivation to reduce food waste
Thrifty consumer identity .473**
Environmental friendly identity .453**
Hedonic identity .307**
Good homemaker identity .351**
Healthy eater identity .428**
Impulsive buying tendency -.303**
Disgust sensitivity -.226**
Universalism value .338**
Perceived ability to reduce food
waste
.198**
Pearson’s correlation coefficient is used to assess the associations (** shows statistically
significant associations at p<.01)
As all the individual characteristics were associated with people’s motivation to reduce food
waste and they were also associated with each other, we have conducted a logistic regression to
investigate the relative importance of each individual characteristic in explaining consumers’
food waste behaviour. The measure of food waste that we used in this analysis was the food
waste clusters (“low waste cluster” - the respondents who reported household food waste of less

57
than a tenth of what is bought or produced in all food categories; “high waste cluster” -
respondents who reported household food waste of more than a tenth of what is bought or
produced in at least one food category).
We find that respondents with stronger thrifty consumer identity and higher motivation to reduce
food waste were less likely to belong to the “high waste cluster”. On the other hand, people with
higher impulsive buying tendency, higher disgust sensitivity and higher perceived ability to
reduce food waste in their household were more likely to be categorised in the “high waste
cluster” (see Table 11).
Table 11. Regression of individual characteristics on food waste clusters to predict categorization
in the “high waste cluster”(2) versus the “low waste cluster”(1)
B Sig.
Thrifty consumer identity -.29 .005
Environmental friendly identity -.04 .737
Hedonic identity .12 .239
Good homemaker identity -.02 .850
Healthy eater identity -.01 .907
Impulsive buying tendency .40 .000
Disgust sensitivity .20 .015
Universalism value -.17 .227
Perceived ability to reduce food waste .14 .045
Motivation to reduce food waste -.28 .006
Constant .25 .791
Logistic regression was conducted (Sig. <.05 shows a statistically significant effect; Nagelkerke
R2 = .26). For statistically significant effects, a negative B value means that higher scores on the
individual characteristic are associated with lower likelihood to be categorized in the “high
waste cluster”; while a positive B value means that higher scores on the individual
characteristic are associated with higher likelihood to be categorized in the “high waste
cluster”.
(1) Respondents who reported household food waste of less than a tenth of what is bought or
produced in all food categories
(2) Respondents who reported household food waste of more than a tenth of what is bought or
produced in at least one food category
Section summary - Individual characteristics and food waste
Participants are highly motivated to reduce food waste in their household. Respondents reported
that several incentives would be important in motivating them to reduce their household food
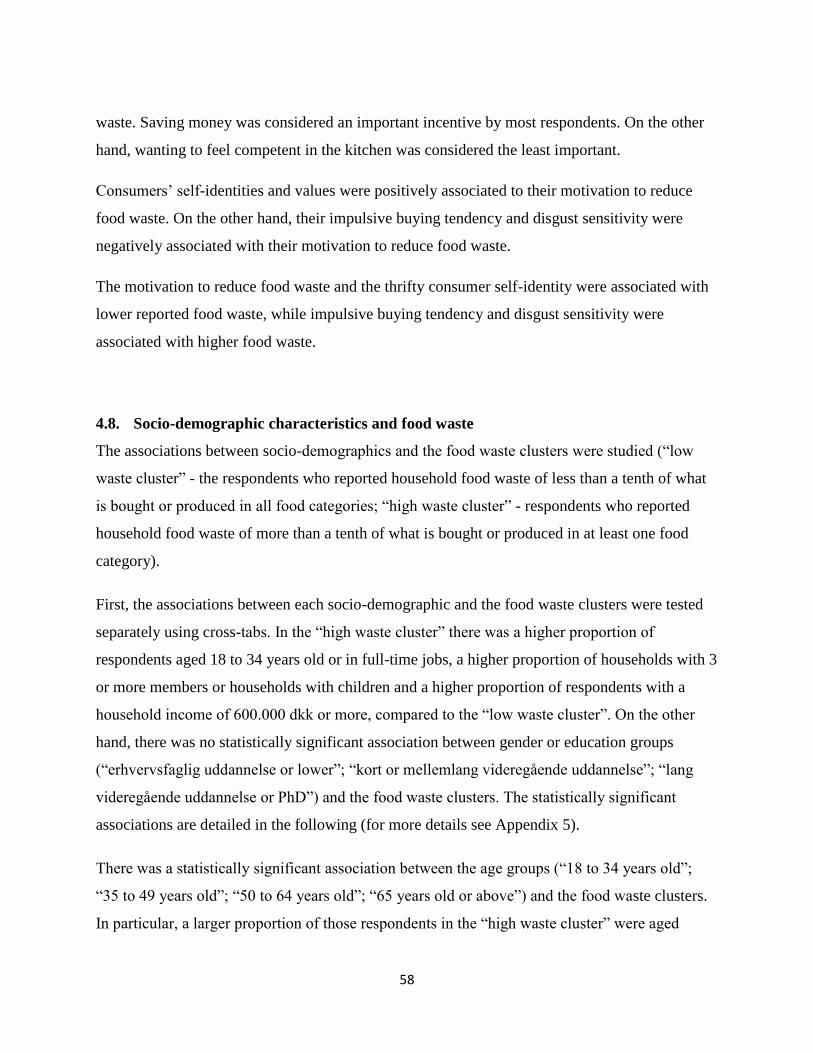
58
waste. Saving money was considered an important incentive by most respondents. On the other
hand, wanting to feel competent in the kitchen was considered the least important.
Consumers’ self-identities and values were positively associated to their motivation to reduce
food waste. On the other hand, their impulsive buying tendency and disgust sensitivity were
negatively associated with their motivation to reduce food waste.
The motivation to reduce food waste and the thrifty consumer self-identity were associated with
lower reported food waste, while impulsive buying tendency and disgust sensitivity were
associated with higher food waste.
4.8. Socio-demographic characteristics and food waste
The associations between socio-demographics and the food waste clusters were studied (“low
waste cluster” - the respondents who reported household food waste of less than a tenth of what
is bought or produced in all food categories; “high waste cluster” - respondents who reported
household food waste of more than a tenth of what is bought or produced in at least one food
category).
First, the associations between each socio-demographic and the food waste clusters were tested
separately using cross-tabs. In the “high waste cluster” there was a higher proportion of
respondents aged 18 to 34 years old or in full-time jobs, a higher proportion of households with 3
or more members or households with children and a higher proportion of respondents with a
household income of 600.000 dkk or more, compared to the “low waste cluster”. On the other
hand, there was no statistically significant association between gender or education groups
(“erhvervsfaglig uddannelse or lower”; “kort or mellemlang videregående uddannelse”; “lang
videregående uddannelse or PhD”) and the food waste clusters. The statistically significant
associations are detailed in the following (for more details see Appendix 5).
There was a statistically significant association between the age groups (“18 to 34 years old”;
“35 to 49 years old”; “50 to 64 years old”; “65 years old or above”) and the food waste clusters.
In particular, a larger proportion of those respondents in the “high waste cluster” were aged

59
between 18-34 years old compared to the “low waste cluster”. On the other hand, a smaller
proportion of those respondents in the “high waste cluster” were aged 65 years old or above
compared to the “low waste cluster”.
There was a statistically significant association between the occupation groups (“full-time job”;
“retired”; “other” (e.g. part-time job, unemployed)) and the food waste clusters. A higher
proportion of the “high waste cluster” consisted of respondents with a full-time job as opposed to
the “low waste cluster”. On the other hand, a lower proportion of the “high waste cluster”
consisted of respondents that were retired as opposed to the “low waste cluster”.
The household size (“1 member”, “2 members”, “3 or more members”) was associated to the
food waste clusters. The food waste clusters are not a per capita measure of food waste. In
particular, the proportion of households with 3 or more members was higher in the “high waste
cluster” compared to the “low waste cluster”. About 73% of the households with 3 or more
members had children in the household. The presence of children in the household was
associated with higher waste.
There was a significant association between household income groups (“under 299.999 dkk”;
“300.000 to 599.999 dkk”; “above 600.000 dkk”) and the food waste clusters. A lower
proportion of the “high waste cluster” consisted of respondents from households with income of
under 299.999 dkk as opposed to the “low waste cluster”. On the other hand, a higher proportion
of the “high waste cluster” consisted of respondents from households with income above
600.000 dkk as opposed to the “low waste cluster”.
As these demographics were associated with each other, a logistic regression was conducted to
assess their relative importance in explaining the categorization of the respondents in the “high
waste cluster” (reported waste of more than 10% of what is bought or produced in at least one of
the food categories). The household income was not included in this analysis because 104
respondents did not provide their income in the survey. Logistic regression allows us to predict
whether a respondent is likely to belong to the “high waste cluster” given his/her demographic
characteristics. As the demographic characteristics have several groups, a reference (or
comparison) group is set for each demographic in the analysis. The reference group for age,

60
occupation and household size was selected based on the findings presented above, namely the
group with the highest proportion in the “high waste cluster” (18 to 34 years old for age; full-
time job for occupation and households with 3 or more members for household size). The
logistic regression results will show which of the socio-demographic groups (compared to the
reference groups) impact the likelihood that people will be categorized in the “high waste
cluster”, when all the demographics are in the same model.
The results (Table 12) show that when all socio-demographic variables were included in the
analysis only age and occupation had a significant association with the food waste clusters. The
respondents who were in the age groups “35 to 49”; “50 to 64” and “65 years old or over” were
less likely to be in the “high waste cluster” compared to those in the age group “18 to 34” years
old. Thus, the 18 to 34 age group was associated with higher food waste. When it comes to
occupation, the respondents who reported being in a part-time job or being unemployed (i.e.
“other” occupation) were less likely to be categorized in the “high waste cluster” compared to
those respondents who reported having a “full-time job”. However, being “retired” as opposed to
having a “full-time job” had no significant effect on the categorization in the “high waste
cluster”.
Table 12. Demographic characteristics that predict the categorization of respondents in the “high
waste cluster”(2)
B Sig.
Gender .16 .430
Age groups
.002
35 to 49 (versus 18 to 34) -.58 .037
50 to 64 (versus 18 to 34) -.81 .005
65 or over (versus 18 to 34) -1.47 .000
Education groups
.571
Erhvervsfaglig uddannelse or
lower (versus Lang videregående
uddannelse or PhD)
-.20 .488
Kort or Mellemlang videregående
uddannelse (versus Lang
videregående uddannelse or PhD)
.03 .919
Occupation groups
.036
Retired (versus Full-time job) -.56 .096

61
Other (e.g. part time, unemployed)
(versus Full-time job)
-.58 .018
Household size
.726
1 member (versus 3+ members) -.24 .535
2 members (versus 3+ members) -.08 .834
Presence of children .09 .824
Logistic regression was conducted (Sig. <.05 shows a statistically significant effect; Nagelkerke
R2 = .14); N=504; For statistically significant effects, a negative B value means that the
demographics group is less likely to be in the “high waste cluster” as opposed to the reference
group (noted after “versus”).
(2) Respondents who reported household food waste of more than a tenth of what is bought or
produced in at least one food category
Overall, even though there were some significant effects of some of the demographic
characteristics, the effects were rather small, which should be kept in mind when interpreting the
results regarding demographics.
Section summary - Socio-demographic characteristics and food waste
Several demographic characteristics were weakly associated with the food waste clusters, but
when considering their relative importance only the age and the occupation groups remained
significant.
5. Discussion and Conclusions
This study aimed to investigate consumer understanding and perceptions of food waste as well as
behavioural and psychological factors associated to food waste. The results of this study can
contribute to inform the development of attempts to reduce food waste at the household level. In
the following, the key contributions and implications of this study are discussed.
5.1. Consumer understanding and awareness of food waste
There is high awareness about food waste among consumers in Denmark. However, there is still
potential for improvement in awareness levels regarding the consequences of food waste and
specific aspects related to food waste like food expiration date labels.
People’s understanding of food waste is to some extent fragmented, as people mention certain
aspects which do not always cover the whole food waste concept. Moreover, consumers in

62
general do not perceive leftover food fed to animals as food waste. Thus, there is a need to
provide people with further information to increase their knowledge about food waste.
5.2. Self-reported food waste behaviour
Most people reported that they discard little food. Similarly, when confronted with specific
scenarios in which food waste can happen, most consumers reported that they would not engage
in food waste. However, many people who save leftovers are unsure whether these will be eaten
later. This shows that even though people report not wasting too much food, when probed more
in depth we can identify that waste still occurs. The self-reported measures of food waste may be
biased estimates of actual behaviour and, thus, we expect that there is some extent of under-
reporting in this study.
5.3. Food waste and household characteristics
Food waste was associated with the uncertainty around how many people eat at home and the
frequency of going grocery shopping. Frequency of grocery shopping was linked to higher food
waste, but we do not know what the drivers of shopping frequency are; these can be related to
poor planning practices or practical issues related to the household provisioning system in
general. Making consumers aware of the drawbacks of frequent shopping could be a first step
towards tackling this issue.
5.4. Consumer perceptions of food edibility and assessment of edibility
Consumers vary in their perceptions of food edibility when it comes to certain foods or parts of
foods. The differences in perceptions of food edibility are important from the perspective of food
waste. People may not consider that certain foods or parts of foods that they discard are food
waste because for them those are not edible. In order to avoid the food waste caused by people’s
perceptions of edibility, information about which parts of foods are edible could be provided to
consumers. For some people it may be hard to break the habit or tradition of not using certain
parts of foods, yet, some people may just be unaware that certain foods or parts of foods are safe
to eat. Moreover, advice on how to use certain foods or parts of foods (e.g. dry bread) in specific
recipes or how to reuse certain leftovers or disappointing meals in preparing a new dish could
help consumers avoid food waste.
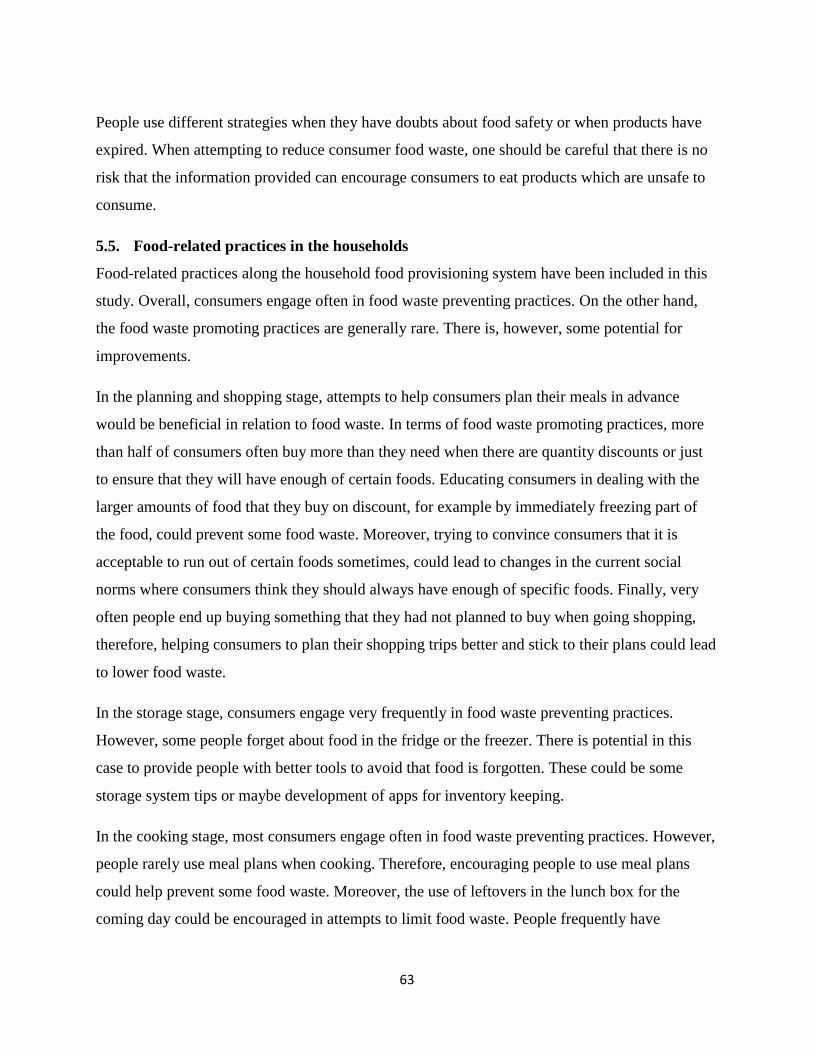
63
People use different strategies when they have doubts about food safety or when products have
expired. When attempting to reduce consumer food waste, one should be careful that there is no
risk that the information provided can encourage consumers to eat products which are unsafe to
consume.
5.5. Food-related practices in the households
Food-related practices along the household food provisioning system have been included in this
study. Overall, consumers engage often in food waste preventing practices. On the other hand,
the food waste promoting practices are generally rare. There is, however, some potential for
improvements.
In the planning and shopping stage, attempts to help consumers plan their meals in advance
would be beneficial in relation to food waste. In terms of food waste promoting practices, more
than half of consumers often buy more than they need when there are quantity discounts or just
to ensure that they will have enough of certain foods. Educating consumers in dealing with the
larger amounts of food that they buy on discount, for example by immediately freezing part of
the food, could prevent some food waste. Moreover, trying to convince consumers that it is
acceptable to run out of certain foods sometimes, could lead to changes in the current social
norms where consumers think they should always have enough of specific foods. Finally, very
often people end up buying something that they had not planned to buy when going shopping,
therefore, helping consumers to plan their shopping trips better and stick to their plans could lead
to lower food waste.
In the storage stage, consumers engage very frequently in food waste preventing practices.
However, some people forget about food in the fridge or the freezer. There is potential in this
case to provide people with better tools to avoid that food is forgotten. These could be some
storage system tips or maybe development of apps for inventory keeping.
In the cooking stage, most consumers engage often in food waste preventing practices. However,
people rarely use meal plans when cooking. Therefore, encouraging people to use meal plans
could help prevent some food waste. Moreover, the use of leftovers in the lunch box for the
coming day could be encouraged in attempts to limit food waste. People frequently have

64
leftovers after meals, thus, trying to persuade consumers that it is acceptable to have only enough
food for a meal is one way to try and tackle the issue. Otherwise, consumers can be provided
with tools to better estimate portion sizes. Additionally, the provision of information about how
to deal with leftovers and of recipes using leftovers from previous meals could be useful to avoid
that leftovers are discarded.
In the eating stage, trying to advise people that they would still be good providers if only enough
food in a reasonable variety is provided at mealtimes could help prevent some food waste. Those
households where some members do not always eat at home may have difficulties in planning
their food-related activities. For such households, advice on how to deal with leftovers could be
useful, as when people unexpectedly do not come home for a meal there would be more
leftovers.
Changing consumers’ food-related practices can be challenging as people have certain routines
to deal with their everyday life. However, food-related practices are closely linked to food waste
and small changes may result in significant benefits. Attempts to reduce food waste could be
focused on few practices at the time. As the planning activities are least practiced activities, new
solutions to make these activities easier and even fun would also support the reduction of food
waste. Applications that can turn menus into shopping lists and estimate required amounts of raw
materials could help consumers, but these applications need to be sophisticated enough to
account for different household sizes and personalised preferences.
5.6. Individual characteristics and food waste
Consumers are highly motivated to reduce the food waste in their household. Several incentives
are important in motivating people to reduce their food waste, of which saving money is the most
important. These incentives can be used when communicating to consumers about food waste in
attempts to motivate them to change their behaviour or perceptions. Appeals to consumers’ self-
identities and values can also result in higher motivation to reduce food waste.
When it comes to reduction of food waste, attempts to increase even more consumers’
motivation to reduce food waste or to appeal to consumers’ thrifty identity can make a positive
contribution. On the other hand, dealing with the barriers to food waste (impulsive buying
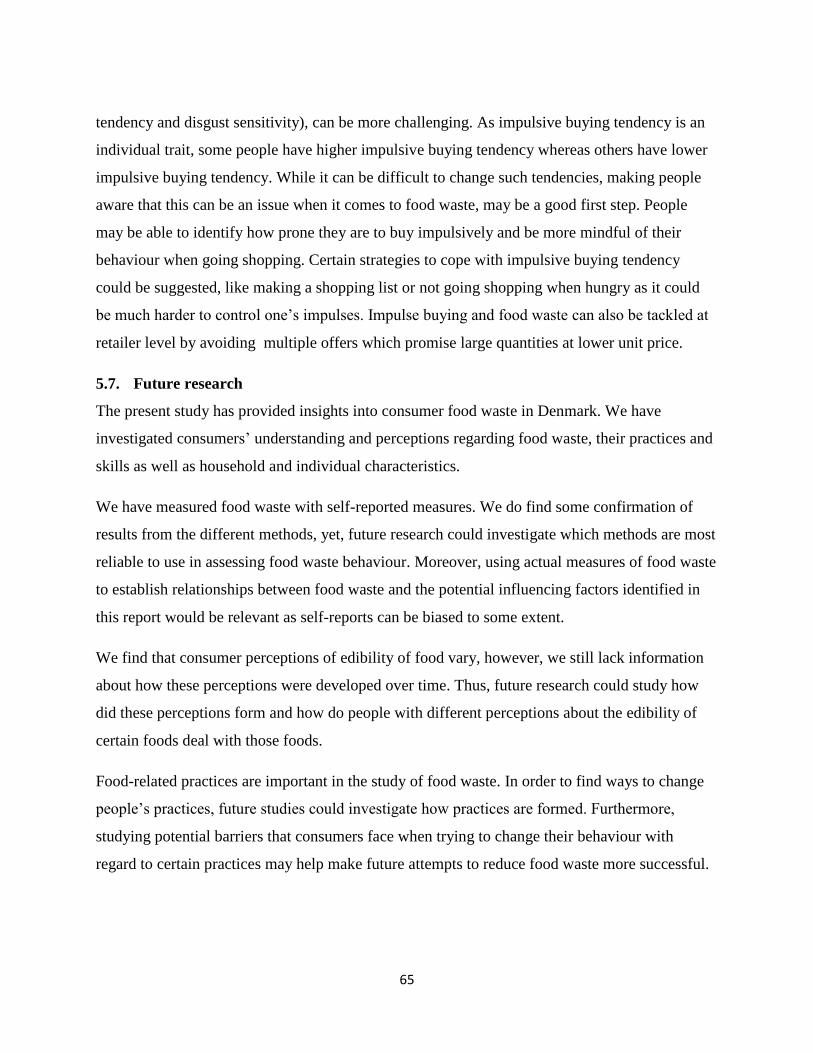
65
tendency and disgust sensitivity), can be more challenging. As impulsive buying tendency is an
individual trait, some people have higher impulsive buying tendency whereas others have lower
impulsive buying tendency. While it can be difficult to change such tendencies, making people
aware that this can be an issue when it comes to food waste, may be a good first step. People
may be able to identify how prone they are to buy impulsively and be more mindful of their
behaviour when going shopping. Certain strategies to cope with impulsive buying tendency
could be suggested, like making a shopping list or not going shopping when hungry as it could
be much harder to control one’s impulses. Impulse buying and food waste can also be tackled at
retailer level by avoiding multiple offers which promise large quantities at lower unit price.
5.7. Future research
The present study has provided insights into consumer food waste in Denmark. We have
investigated consumers’ understanding and perceptions regarding food waste, their practices and
skills as well as household and individual characteristics.
We have measured food waste with self-reported measures. We do find some confirmation of
results from the different methods, yet, future research could investigate which methods are most
reliable to use in assessing food waste behaviour. Moreover, using actual measures of food waste
to establish relationships between food waste and the potential influencing factors identified in
this report would be relevant as self-reports can be biased to some extent.
We find that consumer perceptions of edibility of food vary, however, we still lack information
about how these perceptions were developed over time. Thus, future research could study how
did these perceptions form and how do people with different perceptions about the edibility of
certain foods deal with those foods.
Food-related practices are important in the study of food waste. In order to find ways to change
people’s practices, future studies could investigate how practices are formed. Furthermore,
studying potential barriers that consumers face when trying to change their behaviour with
regard to certain practices may help make future attempts to reduce food waste more successful.
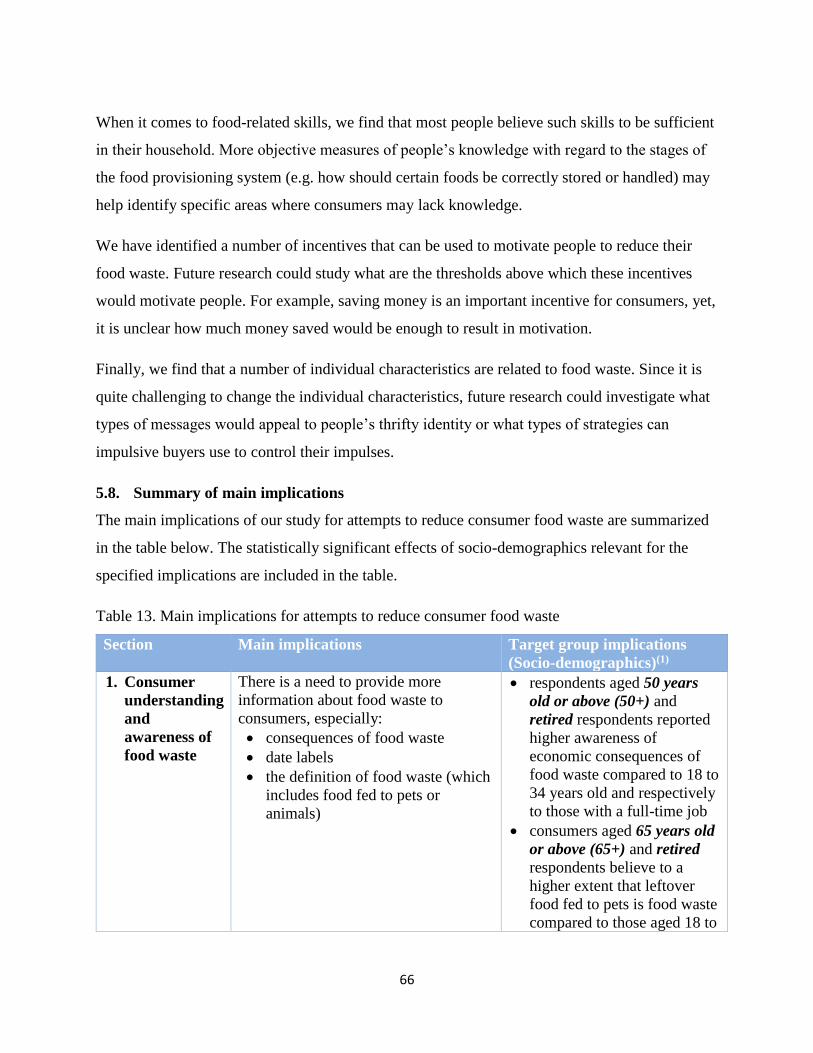
66
When it comes to food-related skills, we find that most people believe such skills to be sufficient
in their household. More objective measures of people’s knowledge with regard to the stages of
the food provisioning system (e.g. how should certain foods be correctly stored or handled) may
help identify specific areas where consumers may lack knowledge.
We have identified a number of incentives that can be used to motivate people to reduce their
food waste. Future research could study what are the thresholds above which these incentives
would motivate people. For example, saving money is an important incentive for consumers, yet,
it is unclear how much money saved would be enough to result in motivation.
Finally, we find that a number of individual characteristics are related to food waste. Since it is
quite challenging to change the individual characteristics, future research could investigate what
types of messages would appeal to people’s thrifty identity or what types of strategies can
impulsive buyers use to control their impulses.
5.8. Summary of main implications
The main implications of our study for attempts to reduce consumer food waste are summarized
in the table below. The statistically significant effects of socio-demographics relevant for the
specified implications are included in the table.
Table 13. Main implications for attempts to reduce consumer food waste
Section Main implications Target group implications
(Socio-demographics)(1)
1. Consumer
understanding
and
awareness of
food waste
There is a need to provide more
information about food waste to
consumers, especially:
consequences of food waste
date labels
the definition of food waste (which
includes food fed to pets or
animals)
respondents aged 50 years
old or above (50+) and
retired respondents reported
higher awareness of
economic consequences of
food waste compared to 18 to
34 years old and respectively
to those with a full-time job
consumers aged 65 years old
or above (65+) and retired
respondents believe to a
higher extent that leftover
food fed to pets is food waste
compared to those aged 18 to

67
34 and respectively to those
with a full-time job
2. Self-reported
food waste
behaviour
Attempts to reduce food waste could be
directed mainly at those people who are
more likely to be categorized in the
“high waste cluster” (i.e. reported
household food waste of more than a
tenth of what is bought or produced in
at least one food category)
respondents aged 35 years
old or over and those in part-
time job or unemployed (i.e.
“other” occupation group)
are less likely to be in the
“high waste cluster”
compared to 18 to 34 years
old and respectively those in
full-time job. Thus, 18 to 34
years old consumers and
those in full-time jobs could
be targeted.
3. Food waste
and household
characteristics
There is a need to make consumers
aware that frequent shopping trips can
be detrimental if they try to reduce their
food waste
4. Consumer
perceptions of
food edibility
and
assessment of
edibility
There is a need to provide consumers
with:
information about which
foods/parts of foods can be eaten
(e.g. broccoli stalks)
advice on how to use certain foods
/ parts of foods (e.g. dry bread) in
specific recipes
advice on how to reuse certain
leftovers or disappointing meals in
preparing a new dish
Care should be taken so that the
information provided does not
encourage consumers to eat products
which are unsafe to eat
a lower proportion of the
respondents aged 18 to 34
years old perceived the upper
part of leeks, dry bread and
browned bananas as “always
edible” as opposed to the 35+
years old group
a lower proportion of the
respondents aged 18 to 34
years old perceived the peels
from potatoes, carrots and
apples as “never edible” as
opposed to the 35+ years old
group
a higher proportion of the
respondents aged 18 to 34
years old perceive food that
starts to look unappealing
even though it can still be
eaten or leftovers that they
have been eating from twice
before in the same week as

68
“always edible”, as opposed
to those 35+ years old
a lower percentage of those
respondents in a full-time job
perceived food that starts to
look unappealing even
though it can still be eaten as
“always edible” compared to
those respondents who are
retired or have other
occupation, yet, a higher
percentage of those in a full-
time job would eat such food
if it is made into another dish
5. Food-related
practices in
the
households
Initiatives to address some of the
practices with potential to reduce food
waste could be:
attempts to increase the frequency
of planning practices among
consumers, for example, by
making these activities easier and
even fun (e.g. finding/ developing
applications that can turn menus
into shopping lists and estimate
required amounts of raw materials,
but these applications need to be
sophisticated enough to account for
different household sizes and
personalised preferences)
provide advice about dealing with
the larger amounts of food that
people buy on discount (e.g.
immediately freezing part of the
food)
campaigns trying to change the
social norms around
buying/cooking more to be sure
there is enough
provide people with better tools to
avoid that food is forgotten (e.g.
storage system tips; development
of applications for inventory
keeping)
respondents aged 18 to 34
years old and those in full-
time jobs report higher
frequency of using meal
plans compared to those 50+
years old and respectively
those who are retired (yet,
respondents aged 18 to 34
years old and those in a full-
time job check their
inventories at home less
frequently than those in the
65+ years old group and
respectively those who are
retired
respondents in full-time jobs
make unplanned purchases
more frequently than those
who are retired
respondents aged 18 to 34
years old cook more than
needed to be sure that there
will be enough more
frequently compared to those
50+ years old
respondents aged 18 to 34
years old and those in full-
time jobs forget about foods
in their fridge or freezer more

69
encourage the use of leftovers in
the lunch box for the coming day
provide consumers with tools to
better estimate portion sizes
provision of information about how
to deal with leftovers and of
recipes using leftovers from
previous meals
frequently compared to those
50+ years old and
respectively those retired
not surprisingly, respondents
aged 18 to 34 years old and
those in full-time jobs use
leftovers in their lunch box
the next day more often
compared to those 65+ years
old and respectively those
retired
6. Individual
characteristics
and food
waste
messages aimed to motivate
consumers to reduce their food
waste can highlight that reducing
food waste leads to saving money
messages that appeal to consumers’
thrifty identity can be useful when
communicating about food waste
reduction
raising people’s awareness that
impulsive buying is a barrier to
reducing food waste (strategies to
cope with impulsive buying
tendency could be suggested, like
making a shopping list or not going
shopping when hungry)
impulse buying and food waste can
also be tackled at the retailer level
by avoiding multiple offers which
promise large quantities at lower
unit price
(1) This column contains information about differences in terms of socio-demographics,
when the effect was statistically significant - see Appendix 6 for detailed results.

70
5.9. Conclusion
Household food waste is a complex issue as it is the result of different food-related activities and
individual decisions. Most people report throwing away only little amounts of food. Consumers
hold various perceptions regarding food edibility and they use various strategies to assess the
edibility of food. In general, people engage often in food waste preventing practices and rarely in
food waste promoting practices, however, there is potential for improvements. Motivation to
reduce food waste and the thrifty consumer identity are related to lower food waste, while
impulsive buying tendency and disgust sensitivity are related to higher food waste.

71
References
Ajzen, Icek. (1991). The theory of planned behavior. Organizational Behavior and Human Decision
Processes, 50(2), 179-211. doi:https://doi.org/10.1016/0749-5978(91)90020-T
Aschemann-Witzel, Jessica, de Hooge, Ilona, Amani, Pegah, Bech-Larsen, Tino, & Oostindjer, Marije.
(2015). Consumer-Related Food Waste: Causes and Potential for Action. Sustainability, 7(6), 6457-6477.
Bandura, A. (1977). Self-efficacy: Toward a Unifying Theory of Behavioral Change. Psychological
Review, 84(2), 191-215.
Blichfeldt, B.S., Mikkelsen, M., & Gram, M. (2015). When it Stops Being Food. Food, Culture &
Society, 18(1), 89-105. doi:10.2752/175174415X14101814953963
Brook Lyndhurst. (2007). Food Behaviour Consumer Research: Quantitative Phase.
Canali, Massimo, Amani, Pegah, Aramyan, Lusine, Gheoldus, Manuela, Moates, Graham, Östergren,
Karin, Silvennoinen, Kirsi, Waldron, Keith, Vittuari, Matteo. (2017). Food Waste Drivers in Europe,
from Identification to Possible Interventions. Sustainability, 9(1), 37.
Edjabou, Maklawe Essonanawe, Petersen, Claus, Scheutz, Charlotte, & Astrup, Thomas Fruergaard.
(2016). Food waste from Danish households: Generation and composition. Waste Management, 52, 256-
268. doi:http://dx.doi.org/10.1016/j.wasman.2016.03.032
Farr-Wharton, G., Foth, M., & Choi, J. H. J. (2014). Identifying factors that promote consumer
behaviours causing expired domestic food waste. Journal of Consumer Behaviour, 13(6), 393-402.
doi:10.1002/cb.1488
Fusions. (2014). FUSIONS Definitional Framework for Food Waste Full Report. Available online at:
http://www.eu-fusions.org/index.php/publications (accessed 3 april 2017) Retrieved from http://www.eu-
fusions.org/
Glanz-Chanos, Viviane , Friis, Rasmus, & Lähteenmäki, Liisa (2016). Holdbarhedsmærkninger på
fødevarer: Forståelse blandt forbrugere.
Grunert, Klaus G., Scholderer, Joachim, & Rogeaux, Michel. (2011). Determinants of consumer
understanding of health claims. Appetite, 56(2), 269-277. doi:https://doi.org/10.1016/j.appet.2011.01.009
Haidt, Jonathan, McCauley, Clark, & Rozin, Paul. (1994). Individual differences in sensitivity to disgust:
A scale sampling seven domains of disgust elicitors. Personality and Individual Differences, 16(5), 701-
713. doi:10.1016/0191-8869(94)90212-7
Hartmann, Christina, Dohle, Simone, & Siegrist, Michael. (2013). Importance of cooking skills for
balanced food choices. Appetite, 65(Supplement C), 125-131.
doi:https://doi.org/10.1016/j.appet.2013.01.016

72
Hartmann, Christina, & Siegrist, Michael. (2018). Development and validation of the Food Disgust Scale.
Food Quality and Preference, 63(Supplement C), 38-50.
doi:https://doi.org/10.1016/j.foodqual.2017.07.013
Koivupuro, Heta-Kaisa, Hartikainen, Hanna, Silvennoinen, Kirsi, Katajajuuri, Juha-Matti, Heikintalo,
Noora, Reinikainen, Anu, & Jalkanen, Lotta. (2012). Influence of socio-demographical, behavioural and
attitudinal factors on the amount of avoidable food waste generated in Finnish households. International
Journal of Consumer Studies, 36(2), 183-191. doi:10.1111/j.1470-6431.2011.01080.x
Kummu, M., de Moel, H., Porkka, M., Siebert, S., Varis, O., & Ward, P. J. (2012). Lost food, wasted
resources: Global food supply chain losses and their impacts on freshwater, cropland, and fertiliser use.
Science of the Total Environment, 438(Supplement C), 477-489.
doi:https://doi.org/10.1016/j.scitotenv.2012.08.092
Mallinson, L. J., Russell, J. M., & Barker, M. E. (2016). Attitudes and behaviour towards convenience
food and food waste in the United Kingdom. Appetite, 103, 17-28. doi:10.1016/j.appet.2016.03.017
Miljøstyrelsen. (2016). Madspild: Forstudie af forbrugeradfærd med henblik pa nudging.
Neff, R. A., Spiker, M. L., & Truant, P. L. (2015). Wasted food: U.S. consumers' reported awareness,
attitudes, and behaviors. PLoS ONE, 10(6). doi:10.1371/journal.pone.0127881
Park, Hyun Jung, & Dhandra, Tavleen Kaur. (2017). Relation between dispositional mindfulness and
impulsive buying tendency: Role of trait emotional intelligence. Personality and Individual Differences,
105(Supplement C), 208-212. doi:https://doi.org/10.1016/j.paid.2016.09.061
Priefer, Carmen, Jörissen, Juliane, & Bräutigam, Klaus-Rainer. (2016). Food waste prevention in Europe
– A cause-driven approach to identify the most relevant leverage points for action. Resources,
Conservation and Recycling, 109, 155-165. doi:http://dx.doi.org/10.1016/j.resconrec.2016.03.004
Rook, Dennis W., & Fisher, Robert J. (1995). Normative Influences on Impulsive Buying Behavior.
Journal of Consumer Research, 22(3), 305-313.
Rozin, Paul, Fallon, April, & Mandell, Robin. (1984). Family resemblance in attitudes to foods.
Developmental Psychology, 20(2), 309-314. doi:10.1037/0012-1649.20.2.309
Schmidt, Karolin. (2016). Explaining and promoting household food waste-prevention by an
environmental psychological based intervention study. Resources, Conservation and Recycling,
111(Supplement C), 53-66. doi:https://doi.org/10.1016/j.resconrec.2016.04.006
Schwartz, S. (2001). European Social Survey Core Questionnaire Development – Chapter 7: A Proposal
for Measuring Value Orientations across Nations. In European Social Survey. London: City University
London.

73
Stancu, Violeta, Haugaard, Pernille, & Lähteenmäki, Liisa. (2016). Determinants of consumer food waste
behaviour: Two routes to food waste. Appetite, 96, 7-17.
doi:http://dx.doi.org/10.1016/j.appet.2015.08.025
Thompson, Edmund R., & Prendergast, Gerard P. (2015). The influence of trait affect and the five-factor
personality model on impulse buying. Personality and Individual Differences, 76(Supplement C), 216-
221. doi:https://doi.org/10.1016/j.paid.2014.12.025
Van Boxstael, S., Devlieghere, F., Berkvens, D., Vermeulen, A., & Uyttendaele, M. (2014).
Understanding and attitude regarding the shelf life labels and dates on pre-packed food products by
Belgian consumers. Food Control, 37(1), 85-92. doi:10.1016/j.foodcont.2013.08.043
van der Werff, Ellen, Steg, Linda, & Keizer, Kees. (2013). The value of environmental self-identity: The
relationship between biospheric values, environmental self-identity and environmental preferences,
intentions and behaviour. Journal of Environmental Psychology, 34(Supplement C), 55-63.
doi:https://doi.org/10.1016/j.jenvp.2012.12.006
van Herpen, Erica, van der Lans, Ivo, Nijenhuis-de Vries, Mariska, Holthuysen, Nancy, Kremer, Stefanie,
& Stijnen, Daniella (2016). "Consumption Life Cycle Contributions. Assessment of practical
methodologies for in-home waste measurement". EU Horizon 2020 REFRESH. Retrieved from
Wageningen, The Netherlands: Wageningen University and Research
Verplanken, Bas, & Herabadi, Astrid. (2001). Individual differences in impulse buying tendency: feeling
and no thinking. European Journal of Personality, 15(s1), S71-S83. doi:10.1002/per.423
Visschers, V. H. M., Wickli, N., & Siegrist, M. (2016). Sorting out food waste behaviour: A survey on the
motivators and barriers of self-reported amounts of food waste in households. Journal of Environmental
Psychology, 45, 66-78. doi:10.1016/j.jenvp.2015.11.007
WRAP. (2009). Household Food and Drink Waste in the UK.
WRAP. (2013). Household Food and Drink Waste in the United Kingdom 2012.

74
Appendices

75
Appendix 1
Summary of questionnaire measures
The exact items and instructions used in the measures can be found in Appendix 3 (in Danish).
The section name from this table corresponds with the sections in Appendix 3.
Sub-section Measures Response scale Source
1. Consumer understanding and awareness of food waste
Consumer
understanding
of food waste
Respondents were asked to write
what would they say to a friend
if they had to explain to him/her
what food waste is.
Open-ended question Inspired from
Grunert,
Scholderer, &
Rogeaux, 2011
Consumer
awareness of
food waste
Respondents were asked
whether in the past year they
had seen or heard anything
about the issue of food waste.
o “yes” (1),
o “no” (2),
o “not sure” (3)
Adapted from
Neff, Spiker,
& Truant,
2015
Consumer
awareness of
food waste
aspects
Respondents who answered
“yes” in the question about
consumer awareness of food
waste, were asked to state what
kind of information were they
aware of.
Check all that apply:
o how much food is
thrown out (1)
o how to avoid
throwing out food
(2)
o food expiration date
labels (3)
o composting or ways
to dispose of food
that is thrown out (4)
o other (please
specify) (5)
Adapted from
Neff, Spiker,
& Truant,
2015
Consumer
awareness of
food waste
consequences
Respondents rated three
statements regarding their
awareness of the consequences
of food waste (monetary,
environmental and social
consequences).
“strongly disagree” (1) to
“strongly agree” (7)
Collapsed into three
categories for analyses:
o (1) and (2) became
“strong
disagreement”;
o (3) to (5) became
“neither nor”
o (6) and (7) became
“strong agreement”
Adapted from
Stancu et al.,
2016

76
Consumer
perception of
food fed to
pets/animals
Respondents were asked
whether, in their household,
leftover food fed to pets or other
animals is seen as food waste.
“strongly disagree” (1) to
“strongly agree” (7)
Collapsed into three
categories for analyses:
o (1) and (2) became
“strong
disagreement”;
o (3) to (5) became
“neither nor”
o (6) and (7) became
“strong agreement”
2. Self-reported food waste behaviour
Food waste by
food
categories
Respondents were asked to
estimate how much of all the
food; milk and dairy products;
fresh fruits and vegetables; meat
and fish; bread and other bakery
products that they buy and/or
grow is thrown away in a
regular week in their household.
o hardly any (1),
o less than a tenth (less
than 10%) (2),
o more than a tenth but
less than a quarter
(between 10% and
25%) (3),
o more than a quarter
but less than a half
(between 25% and
50%) (4),
o more than a half
(more than 50%) (5)
Collapsed into two
categories for analyses
o (1) and (2) became
“low waste”
o (3) to (5) became
“high waste”
Adapted from
Stancu et al.,
2016
Food waste by
functional
categories
Respondents were asked to
estimate how much food they
throw away in their household
in a typical week in four
functional categories: raw
ingredients, processed products
stored in the fridge, processed
foods stored outside the fridge,
and cooked food.
none (1), hardly any (2),
some (3), a fair amount
(4), a lot (5)
Collapsed into two
categories for analyses
o (1) and (2) became
“low waste”
o (3) to (5) became
“high waste”
Partly adapted
from Neff,
Spiker, &
Truant, 2015

77
Food waste
scenarios
Five scenarios that described
certain situations when food
waste may occur were shown in
turn to the respondents. They
were asked to state what they
would do in each situation.
The scenarios dealt with
leftovers after a meal (two
scenarios), raw ingredient
leftovers while cooking (one
scenario), products close to
expire (one scenario) and
decaying fresh fruits (one
scenario).
In the three scenarios involving
leftovers, those people who
reported that they would keep
the leftovers (or selected “other”
in leftovers after a meal
scenarios) were asked about the
likelihood that the leftovers
would be eaten in their
household.
Several options suitable
for each scenario were
provided (see Appendix
3, Section: Self-reported
food waste behaviour).
For the likelihood that the
leftovers will be eaten
later, the answer options
were:
o “not likely” (1),
o “quite likely” (2),
o “very likely” (3)
o “not applicable” (4)
(in leftovers after a
meal scenarios)
Inspired from
Miljøstyrelsen,
2016
3. Consumer perceptions of food edibility and assessment of edibility
Consumer
perceptions of
food edibility
(foods and
parts of foods)
Respondents were asked if they
consider certain foods/parts of
foods as edible (something that
they would eat or would
consider eating). In total, ten
foods or part of foods were
included in this question (e.g.
upper part of the leek, broccoli
stalks, fish skin).
o “always edible”,
o “edible only when
used in specific
recipes”
o “never edible”
Inspired from
Miljøstyrelsen,
2016
Consumer
perceptions of
food edibility
(leftovers and
cooked foods)
Respondents were asked if they
consider leftovers or certain
cooked dishes as edible
(something that they would eat
or would consider eating).
o “always edible”,
o “edible only when
made into another
dish”
o “never edible”
Inspired from
Miljøstyrelsen,
2016

78
Consumer
strategies for
assessing the
edibility of
food
(uncertainty
around safety)
Respondents were asked what
they would do with a product if
they were unsure if it is still safe
to eat that product. This was
asked in relation to ham (if
people were vegetarians they
were told to think of a
vegetarian alternative), and
strawberries.
Check all that apply:
o “I eat it, if I think the
quality is good
enough”
o “I use it in dishes that
are thoroughly
cooked”
o “I freeze it to destroy
harmful bacteria”
o “I throw it out”
o “Other”
Adapted from
Glanz-Chanos,
Friis, &
Lähteenmäki,
2016; Van
Boxstael et al.,
2014
Consumer
strategies for
assessing the
edibility of
food (products
passed the
date labelling)
Respondents were asked what
they would do if they find an
unopened product in their fridge
that had passed its “best before”
date by 3-4 days. The products
investigated were: cheese,
cookies, yoghurt, eggs, smoked
salmon, ready-made meals, liver
pate and meat based cold cuts.
The same question was asked
for an unopened product that has
passed its “use by” date with 3-4
days. The products were minced
meat, smoked salmon, ready-
made meals, liver pate and meat
based cold cuts.
o “I always throw the
food product away”
o “I look at the food
product and smell it
to check if it is fit for
consumption”
o “I taste the food
product to check if it
is fit for consumption,
if it smells normal
and looks fine”
o “We never eat this
food”
Adapted from
Glanz-Chanos,
Friis, &
Lähteenmäki,
2016;

79
4. Food-related practices in the households
Food-related
practices in
the Planning
& Shopping
stage
Respondents were asked to
report how frequently they
engage in two practices related
to planning (e.g. checking
inventories before shopping
trips) and four practices related
to shopping (e.g. making
unplanned purchases).
“never” (1) to “always”
(7) (there were labels for
each answer option)
Collapsed into three
categories for analyses:
o “never” (1), “almost
never” (2) and
“rarely” (3) were
categorised as
“almost never”
o “sometimes” (4) and
“often” (5) were
categorised as
“often”
o “almost always” (6)
and “always” (7) were
categorised as
“almost always”
Adapted from
Miljøstyrelsen,
2016; Neff et
al., 2015;
Schmidt, 2016;
Stancu et al.,
2016;
Visschers et
al., 2016
Food-related
practices in
the Storage
stage
Respondents were asked to
report how frequently they
engage in practices related to
storing food, e.g. having a good
overview of what they have at
home, storing food
appropriately.
“never” (1) to “always”
(7) (there were labels for
each answer option)
Collapsed into three
categories for analyses
(as for Planning &
Shopping).
Adapted from
Miljøstyrelsen,
2016; Neff et
al., 2015;
Schmidt, 2016;
Stancu et al.,
2016;
Visschers et
al., 2016
Food-related
practices in
the Cooking
and preparing
food stage
Respondents were asked to
report how frequently they
engage in practices related to
cooking, e.g. checking what
food is available before cooking,
prioritizing leftovers and food
about to expire when cooking.
“never” (1) to “always”
(7) (there were labels for
each answer option)
Collapsed into three
categories for analyses
(as for Planning &
Shopping)
Adapted from
Miljøstyrelsen,
2016; Neff et
al., 2015;
Schmidt, 2016;
Stancu et al.,
2016;
Visschers et
al., 2016
Food-related
practices and
norms in the
Eating stage
Respondents were asked to rate
four statements related to eating
practices and norms, e.g.
believing that one should always
eat what is on one’s plate when
dinning at home, providing a
“strongly disagree” (1) to
“strongly agree” (7)
Collapsed into three
categories for analyses:
Adapted from
Miljøstyrelsen,
2016; Neff et
al., 2015;
Schmidt, 2016;
Stancu et al.,

80
large variety of foods at
mealtimes so that everyone can
have something that he or she
likes.
o (1) and (2) became
“strong
disagreement”
o (3) to (5) became
“neither nor”
o (6) and (7) became
“strong agreement”
2016;
Visschers et
al., 2016
Coordination
of household
food-related
practices
Respondents were asked to
report how frequent is there lack
of coordination in their
household, e.g. different
members of the household buy
the same food product
separately without knowing that
the other one had bought it.
“never” (1) to “always”
(7) (there were labels for
each answer option)
Collapsed into three
categories for analyses
(as for Planning &
Shopping).
Adapted from
Miljøstyrelsen,
2016
5. Food-related skills in the households
Respondents were asked to
think about their household and
report the extent to which they
believe that their household’s
food-related skills (e.g. planning
the meals and shopping) are
sufficient.
One composite measure was
computed for the analyses as the
average of the scores of the six
skills items.
“strongly disagree” (1) to
“strongly agree” (7)
Adapted from
Hartmann,
Dohle, &
Siegrist, 2013;
Miljøstyrelsen,
2016
6. Individual characteristics
Motivation to
reduce food
waste
People rated how much effort
they currently make to reduce
food waste in their household,
how much effort they will make
in the near future to reduce food
waste in their household as well
as the extent to which they look
for ways to reduce food waste in
their household.
Finally, respondents rated their
level of interest in reducing the
amount of food discarded in
“not at all” (1) to “as
much as possible” (7)
“not at all” (1) to
“extremely” (7)
Adapted from
Brook
Lyndhurst,
2007;
Miljøstyrelsen,
2016; Neff et
al., 2015

81
their household on a separate
rating scale.
One composite measure was
computed for the analyses as the
average of the scores of the four
motivation items.
Incentives to
reduce food
waste
Respondents were asked how
important, if at all, were a
number of incentives (e.g.
saving money; feeling
competent in the kitchen) in
motivating them to reduce the
amount of food discarded by
their household in the near
future.
“not at all important” (1)
to “extremely important”
(7)
Collapsed into three
categories for analyses:
o (1) and (2) became
“not important”;
o (3) to (5) became
“neither nor”
o (6) and (7) became
“important”
Adapted from
Brook
Lyndhurst,
2007;
Miljøstyrelsen,
2016; Neff et
al., 2015
Consumer
self-identities
Five self-identities were
assessed: thrifty consumer
identity, good homemaker
identity, environmental friendly
identity, hedonic identity,
healthy eater identity.
Each self-identity was measured
with three items (e.g. Acting
environmentally-friendly is an
important part of who I am; I
am the type of person who acts
environmentally-friendly; I see
myself as an environmentally-
friendly person).
For each of the five types of
self-identities one composite
measure was computed as the
average of the scores on the
three items measuring it, for the
analyses.
“strongly disagree” (1) to
“strongly agree” (7)
Adapted from
van der Werff,
Steg, &
Keizer, 2013
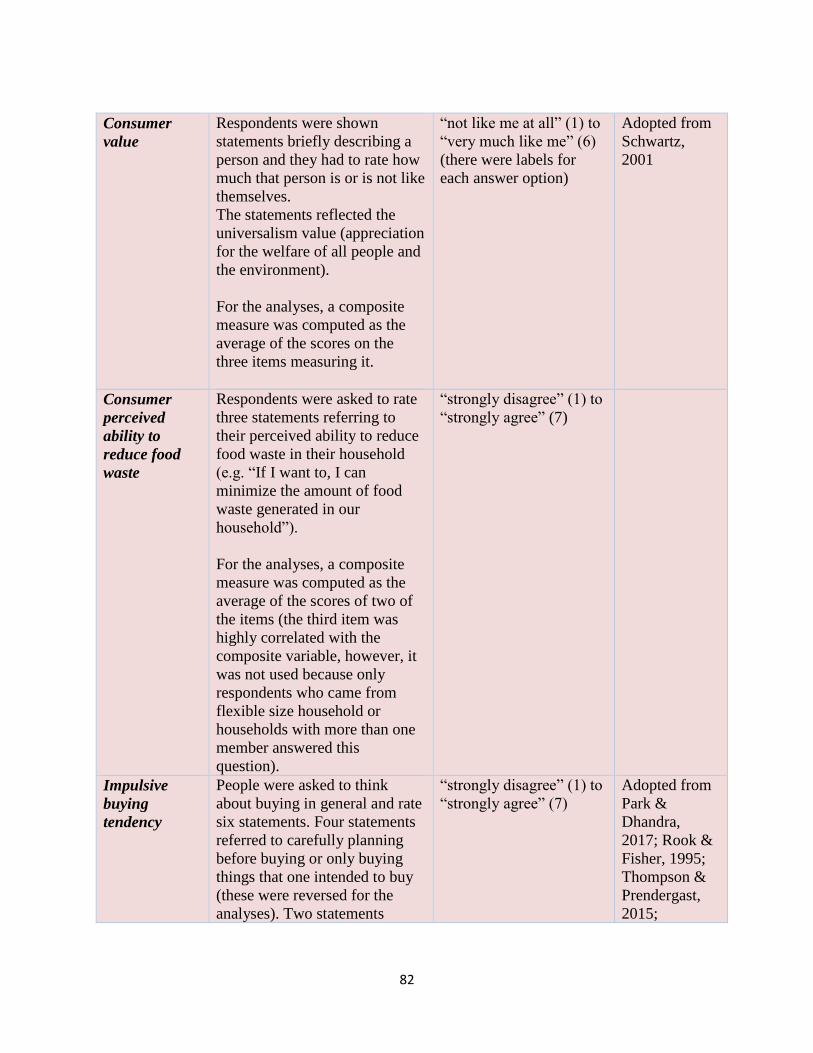
82
Consumer
value
Respondents were shown
statements briefly describing a
person and they had to rate how
much that person is or is not like
themselves.
The statements reflected the
universalism value (appreciation
for the welfare of all people and
the environment).
For the analyses, a composite
measure was computed as the
average of the scores on the
three items measuring it.
“not like me at all” (1) to
“very much like me” (6)
(there were labels for
each answer option)
Adopted from
Schwartz,
2001
Consumer
perceived
ability to
reduce food
waste
Respondents were asked to rate
three statements referring to
their perceived ability to reduce
food waste in their household
(e.g. “If I want to, I can
minimize the amount of food
waste generated in our
household”).
For the analyses, a composite
measure was computed as the
average of the scores of two of
the items (the third item was
highly correlated with the
composite variable, however, it
was not used because only
respondents who came from
flexible size household or
households with more than one
member answered this
question).
“strongly disagree” (1) to
“strongly agree” (7)
Impulsive
buying
tendency
People were asked to think
about buying in general and rate
six statements. Four statements
referred to carefully planning
before buying or only buying
things that one intended to buy
(these were reversed for the
analyses). Two statements
“strongly disagree” (1) to
“strongly agree” (7)
Adopted from
Park &
Dhandra,
2017; Rook &
Fisher, 1995;
Thompson &
Prendergast,
2015;

83
referred to buying things
without thinking or
spontaneously.
One composite measure was
computed as the average of the
six items measuring it.
Verplanken &
Herabadi, 2001
Disgust
sensitivity
Respondents were asked to
indicate how disgusting they
perceive eating certain foods to
be.
Two items referred to leftovers.
The remaining four items
referred to specific foods, e.g.
potatoes that had a black spot
removed, cheese that had a
moulded spot removed.
For the analyses, a composite
measure was computed as the
average of the scores on the six
items measuring it.
“not disgusting at all” (1)
to “extremely disgusting”
(7)
Adapted from
Hartmann &
Siegrist, 2018
Household characteristics
Types of food
consumed in
households
Respondents were asked to
report the frequency of eating
certain types of food/meals in
their household.
never (1), less than once
a month (2), 1-3 times a
month (3); once a week
(4), 2-4 times a week (5);
5-6 times a week (6) and
every day (7)
Collapsed categories for
analyses: (1) and (2)
became
“less than once a
month”; (6) and (7)
became “5 times a week
or more often”

84
Preference for
freshness
The respondents rated three
statements regarding their
household’s preference for fresh
foods.
“strongly disagree” (1) to
“strongly agree” (7)
Collapsed into three
categories for analyses:
o (1) and (2) became
“strong
disagreement”;
o (3) to (5) became
“neither nor”
o (6) and (7) became
“strong agreement”
Adopted from
O'Sullivan,
Scholderer, &
Cowan, 2005
Frequency of
grocery
shopping
Respondents were asked to
report the frequency of grocery
shopping in their household.
o “less often than once
a week”
o “1-2 times a week”
o “3-4 times a week”
o “5-6 times a week”
o “every day”
Responsibility
for household
food-related
tasks
Respondents were asked to
report the extent to which they
are responsible for seven
household food-related tasks
from different steps/decisions in
the household food
provisioning.
o “you do all or most
of it” (1)
o “you do about half of
it” (2)
o “someone else does
all or most of it” (3)
Adapted from
Farr-Wharton
et al., 2014;
Neff, Spiker,
& Truant,
2015
Socio-demographics
Individuals’ demographics:
gender, age, education and
occupation. Households’
demographics: household size
and stability (i.e. does the
number of people who live at
home fluctuate over a typical
two-week period), household
income and presence of
vegetarians.

85
Appendix 2
Characteristics of respondents
Frequency of types of education
Education Frequency %
Grund-/folkeskole 45 8.9
Almengymnasial uddannelse (studentereksamen/HF) 38 7.5
Erhvervsgymnasial uddannelse (HH/HTX/HHX) 20 3.9
Erhvervsfaglig uddannelse 91 17.9
Kort videregående uddannelse under 3 år 46 9.1
Mellemlang videregående uddannelse 3-4 år 175 34.4
Lang videregående uddannelse 5 år eller mere 83 16.3
Forskeruddannelse (f.eks. PHD) 6 1.2
Ønsker ikke at oplyse 4 0.8
Frequency of types of occupation
Occupation Frequency %
Fuldtidsarbejde (+30 timer/ugen) 220 43.3
Deltid (8-29 timer/ugen) 24 4.7
Deltid (under 8 timer/ugen) 10 2.0
Pensioneret/ førtidspensioneret/ på efterløn 148 29.1
Går i skole 25 4.9
Følger fuldtidsstudium på længerevarende uddannelse 29 5.7
Arbejdsløs (jobsøgende) 28 5.5
Arbejdsløs (ikke jobsøgende) 7 1.4
Hjemmegående 9 1.8
Andet 8 1.6

86
Frequency of household incomes
Houseold income Frequency %
Mindre end 100.000 kr. 21 4.1
100.000 til 199.999 kr. 53 10.4
200.000 til 299.999 kr. 55 10.8
300.000 til 399.999 kr. 62 12.2
400.000 til 499.999 kr. 59 11.6
500.000 til 599.999 kr. 33 6.5
600.000 til 699.999 kr. 31 6.1
700.000 til 799.999 kr. 28 5.5
800.000 til 899.999 kr. 26 5.1
900.000 til 999.999 kr. 10 2.0
1.000.000 kr. eller mere 26 5.1
Ved ikke 17 3.3
Ønsker ikke at oplyse 87 17.1
Distribution of respondents according to the region in Denmark that they come from

87
Frequency of people following a vegetarian diet

88
Appendix 3
Consumer Food Waste Survey (DK)
Introduction
Q1. Kære deltager
Velkommen til denne undersøgelse, som udføres af MAPP Centret ved Aarhus Universitet.
I undersøgelsen er vi interesserede i din mening om mad og måltidsrelaterede aktiviteter i din
husholdning. Dine meninger er særdeles værdifulde for os og vil hjælpe os til at forstå, hvordan
folk agerer i forhold til mad og måltider i hjemmet.
Der er ingen rigtige eller forkerte svar; vi er udelukkende interesserede i din mening om mad og
måltidsrelaterede aktiviteter hjemme hos dig selv.
Det tager omkring 20 minutter at udfylde spørgeskemaet.
Læg venligst mærke til, at nogle af spørgsmålene i skemaet handler om din husstand, dvs. at
når vi skriver ”I” i spørgsmålet, dækker det husstanden uanset dens størrelse.
Hvis du har spørgsmål eller kommentarer, bedes du kontakte … på e-mail [email protected].
På forhånd mange tak for hjælpen!
Venlig hilsen
Aarhus Universitet
MAPP Research Centre
Q2. Det er helt frivilligt at deltage, og du har ingen pligt til at deltage. Du kan til enhver tid
trække dig fra undersøgelsen. Vi behandler naturligvis dine svar med den allerstørste
fortrolighed. Dataene fra dette spørgeskema lagres og behandles elektronisk og anonymt.
Jeg bekræfter at:
□ Jeg har læst og forstået ovenstående information og er indforstået med at deltage i
undersøgelsen (1)
□ Jeg giver Aarhus Universitet tilladelse til at bruge mine data i forskningsøjemed (2)

89
Background questions
Q3. Hvor stor en del af følgende opgaver i hjemmet tager du dig af?
Skala
Beslutter, hvilke fødevarer der skal købes og hvor
meget (Q3_1)
o Jeg tager mig af det hele eller det
meste (1)
o Jeg tager mig af cirka halvdelen
(2)
o En anden tager sig af det hele eller
det meste (3)
Indkøb (Q3_2)
Sætter på plads efter indkøb (Q3_3)
Beslutter, hvad der skal laves til måltiderne
(Q3_4)
Laver mad (Q3_5)
Rydder op efter aftensmaden (Q3_6)
Holder orden i og tjekker køleskab, køkkenskabe
og dybfryser (Q3_7)
Q82. Hvad er dit køn?
o Mand (0)
o Kvinde (1)
Q4. Skifter antallet af personer i husstanden over en typisk to-ugers periode (fx pga. delt
forældremyndighed, hyppige arbejdsrelaterede rejser)?
o Ja (1)
o Nej (2)
<If Ja, ask Q5 to Q10; If Nej ask Q11 and Q12>
Q5. Hvad er det laveste antal personer, der bor i husstanden (iberegnet dig selv)?
▼ 1 (1) ... 10 eller flere (10)
Q6. Hvor mange af dem er børn (under 16 år)?
▼ 0 (0) ... 10 eller flere (10)

90
Q7. Hvad er det højeste antal personer, der bor i din husstand (iberegnet dig selv)?
▼ 1 (1) ... 10 eller flere (10)
Q8 Hvor mange af dem er børn (under 16 år)?
▼ 0 (0) ... 10 eller flere (10)
Q9. Hvad er antallet af personer, der bor i husstanden det meste af tiden (iberegnet dig selv)?
▼ 1 (1) ... 10 eller flere (10)
Q10. Hvor mange af dem er børn (under 16 år)?
▼ 0 (0) ... 10 eller flere (10)
Q11. Hvor mange personer bor der i alt i din husstand (dig selv iberegnet)?
▼ 1 (1) ... 10 eller flere (10)
Q12. Hvor mange af dem, der bor i din husstand, er børn under 16 år?
▼ 0 (0) ... 10 eller flere (10)
1. Consumer understanding and awareness of food waste
Q14. Hvis du skulle forklare en ven, hvad madspild er, hvad ville du så sige?
________________________________________________________________
________________________________________________________________
________________________________________________________________
Q15. Har du inden for det seneste år set eller hørt noget i nyhederne, på de sociale medier eller
andre steder, om mad, der bliver kasseret eller på anden måde ikke bliver spist af mennesker?
(sommetider kaldet ”madspild”)
o Ja (1); Nej (2); Er ikke sikker (3)
<If Ja, ask Q16 >

91
Q16. Hvad drejede informationen sig om (vælg alle der er relevante)?
□ Information om, hvor meget mad der bliver kasseret (1)
□ Information om, hvordan man kan undgå at smide mad ud (2)
□ Information om mærkning med sidste holdbarhedsdato (3)
□ Information om kompostering og andre måder at komme af med mad, der er kasseret (4)
□ Andre (angiv venligst) (5) ________________________________________________
Q17. Angiv venligst, hvor uenig eller enig, du er i følgende udsagn
Skala
Madspild (mad der bliver kasseret) er et problem for miljøet
(Q17_1)
o Meget uenig 1 (1)
o 2 (2)
o 3 (3)
o 4 (4)
o 5 (5)
o 6 (6)
o Meget enig 7 (7)
Madspild (mad der bliver kasseret) i Danmark påvirker
verdens underernærede (Q17_2)
Hjemme hos os er vi bevidste om, hvor mange penge vi
bruger ugentlig på mad, der bliver smidt ud (Q17_3)
Q88. Når du tænker på din husholdning, angiv venligst, hvor uenig eller enig, du er i følgende
udsagn.
I min husstand synes vi at det er madspild at fodre kæledyr eller andre dyr med madrester.
Meget
uenig 1 (1) 2 (2) 3 (3) 4 (4) 5 (5) 6 (6)
Meget enig
7 (7)
<This question was asked after the food waste scenarios in the online survey>
2. Self-reported food waste behaviour
Q18. Det sker i alle husholdninger, at man sommetider må kassere mad. Prøv at tænke på din
egen husholdning og vurder så, hvor meget der bliver smidt ud i løbet af en typisk uge.
Medtag alle mad- og drikkevarer, som du havde derhjemme, og som kunne have været spist i
stedet for at blive kasseret uanset grunden til, at det blev smidt ud (fx brødskiver, æbler, tilberedt
mad)
Skala
Hvor stor en andel af alle de fødevarer og den mad, du køber
og/eller dyrker, bliver kasseret på en typisk uge? (Q18_1)
o Næsten intet (1)

92
Hvor stor en andel af den mælk og de mejeriprodukter, du
køber og/eller producerer, bliver kasseret på en typisk uge?
(Q18_2)
o Mindre end en tiendedel
(mindre end 10%) (2)
o Mere end en tiendedel men
mindre end en fjerdedel
(mellem 10% og 25%) (3)
o Mere end en fjerdedel men
mindre end halvdelen
(mellem 25% og 50%) (4)
o Mere end halvdelen (mere
end 50%) (5)
Hvor stor en andel af den friske frugt og de grøntsager, du
køber og/eller producerer, bliver kasseret på en typisk uge?
(Q18_3)
Hvor stor en andel af det kød og den fisk, du køber og/eller
producerer, bliver kasseret på en typisk uge? (Q18_4)
Hvor stor en andel af det brød og andre bagerprodukter, du
køber og/eller producerer, bliver kasseret på en typisk uge?
(Q18_5)
Q19. Tænk på din egen husholdning, og vurder så, hvor meget af følgende, I kasserer på en
typisk uge.
Skala
Rå ingredienser (fx grøntsager, kød, fisk, mælk, etc.) (Q19_1) o Intet (1)
o Næsten intet (2)
o Noget (3)
o En hel del (4)
o Meget (5)
Forarbejdede produkter, som ligger i køleskabet (fx pølse,
leverpostej, ost, etc.) (Q19_2)
Forarbejdede produkter, som ikke ligger i køleskabet (fx
morgenmadsprodukter, småkager, dåsemad, etc.) (Q19_3)
Tilberedt mad (fx rester fra boller i karry, grøntsagsretter; retter der
ikke bliver spist; etc.) (Q19_4)
Q20. Sommetider er der enten rå eller tilberedte rester efter madlavningen eller et måltid. Det
sker, at madvarer bliver glemt, og vi finder dem, efter at holdbarheden er overskredet. Folk har
forskellige strategier med hensyn til sådanne fødevarer, og i de følgende spørgsmål vil vi gerne
vide, hvad du ville gøre i disse situationer.

93
Q21. Forestil dig, at I lige har spist aftensmad derhjemme. Middagen, der var lavet af
råvarer, bestod af kød (hvis I er vegetarer, tænk på et vegetarisk alternativ i stedet for kød),
kartofler, kogte grøntsager, en grøn salat og sovs. Der er noget tilbage af alle elementerne i
middagen, som ikke er blevet serveret på tallerkenerne. Når du skal rydde op efter aftensmaden,
hvad gør du så ved hvert element?
Skala
Q22. Tilberedt kød (hvis I er
vegetarer, tænk på et vegetarisk
alternativ i stedet for kød)
<If (1), (2) or (5) ask Q38>
o Gemmer resterne, uanset hvor meget der er tilbage
(1)
o Gemmer kun resterne, hvis der er nok til mindst én
person en anden gang (2)
o Smider resterne ud (3)
o Giver resterne til kæledyr eller andre dyr (4)
o Andet (angiv venligst) (5)_______________
Q34. Kogte kartofler
<If (1), (2) or (5) ask Q39>
Q35. Sovs
<If (1), (2) or (5) ask Q40>
Q36. Kogte grøntsager
<If (1), (2) or (5) ask Q41>
Q37. Grøn salat
<If (1), (2) or (5) ask Q42>
Q23. Nogle gemmer rester, men af forskellige grunde får de dem ikke spist i de følgende dage.
Hvad er sandsynligheden for, at de rester, I har gemt, bliver spist hjemme hos jer?
Skala
Q38. Tilberedt kød (hvis I er vegetarer, tænk
på et vegetarisk alternativ i stedet for kød)
o Ikke sandsynligt (1)
o Ret sandsynligt (2)
o Meget sandsynligt (3)
o Ikke relevant (4) <displayed only if (5)
was selected in Q21>
Q39. Kogte kartofler
Q40. Sovs
Q41. Kogte grøntsager
Q42. Grøn salat
Q24. Forestil dig, at I lige har spist aftensmad derhjemme. Måltidet bestod af kød-lasagne (hvis I
er vegetarer, tænk på et vegetarisk alternativ) og salat. Der er en god portion lasagne tilbage i
fadet. Når du skal rydde op bagefter, hvad gør du så med lasagneresterne?
o Gemmer resterne i køleskabet (1)
o Gemmer resterne i dybfryseren (2)
o Smider dem ud (3)
o Giver resterne til kæledyr eller andre dyr (4)
o Andet (angiv venligst) (5) ________________________________________________
<If (1), (2) or (5) ask Q25>

94
Q25. Nogle gemmer rester, men af forskellige grunde får de dem ikke spist i de følgende dage.
Hvad er sandsynligheden for, at de lasagnerester, I har gemt, bliver spist hjemme hos jer?
o Ikke sandsynligt (1)
o Ret sandsynligt (2)
o Meget sandsynligt (3)
o Ikke relevant (4) <displayed only if (5) was selected in Q24>
Q26. Forestil dig, at du er ved at lave aftensmad derhjemme, og at der er nogle rå ingredienser,
som du ikke bruger det hele af til måltidet. Forestil dig, at du har følgende i overskud – hvad gør
du med hver af dem?
Skala
En halv broccoli (Q26_1) o Gemmer resten (1)
o Kasserer resten (2)
<If (1) then ask about the
ingredient in Q27>
Et halvt løg (Q26_2)
En halv pose blandet grøn salat (ca. 75 g) (Q26_3)
En halv dåse hakkede, flåede tomater (ca. 200 g) (Q26_4)
En tredjedel karton madlavningsfløde (ca. 80 ml) (Q26_5)
En kvart pose revet ost (ca. 50 g) (Q26_6)
En halv pakke skiveskåret skinke (ca. 45 g) (Q26_7)
Q27. Nogle gemmer rester, men af forskellige grunde får de dem ikke spist i de følgende dage.
Hvad er sandsynligheden for, at de ingrediensrester, I har gemt, bliver spist hjemme hos jer?
Skala
En halv broccoli (Q27_1) o Ikke sandsynligt (1)
o Ret sandsynligt (2)
o Meget sandsynligt (3) Et halvt løg (Q27_2)
En halv pose blandet grøn salat (ca. 75 g) (Q27_3)
En halv dåse hakkede, flåede tomater (ca. 200 g) (Q27_4)
En tredjedel karton madlavningsfløde (ca. 80 ml) (Q27_5)
En kvart pose revet ost (ca. 50 g) (Q27_6)
En halv pakke skiveskåret skinke (ca. 45 g) (Q27_7)
Q29. Forestil dig, at du skal til at lave aftensmad, og du har købt frisk fiskefilet til formålet. Da
du går køleskabet igennem for at finde de andre ingredienser, finder du en pakke hakket kød
(hvis I er vegetarer, tænk på et vegetarisk alternativ i stedet for kød), som udløber samme dag.
Hvad gør du med det hakkede kød?
o Jeg bruger det hakkede kød som en del af det måltid, jeg skulle i gang med at lave (1)
o Jeg tilbereder det hakkede kød og gemmer den tilberedte ret til senere brug (2)
o Jeg putter det hakkede kød i fryseren til senere brug (3)
o Jeg bruger det hakkede kød til måltidet nu og gemmer fisken til senere brug (4)

95
o Jeg kasserer det hakkede kød (5)
o Jeg planlægger at bruge det hakkede kød dagen efter, selv om det har overskredet sidste
holdbarhed (6)
o Jeg gemmer det, selv om jeg ikke er sikker på, hvad jeg skal bruge det til (7)
o Andet (angiv venligst) (8) ________________________________________________
Q28. Forestil dig, at du i frugtskålen har spottet 4-5 æbler, der er blevet lidt gamle (fx runkne,
plettede, smårådne). Hvad ville du gøre med æblerne?
o Jeg ville lave en dessert af dem (1)
o Jeg ville lave saft af dem (2)
o Jeg ville på en eller anden måde bruge dem i madlavningen (3)
o Jeg ville spise nogen så hurtigt som muligt og smide resten ud (4)
o Jeg ville kassere dem (5)
o Andet (angiv venligst) (6) ________________________________________________
3. Consumer perceptions of food edibility and assessment of edibility
Q32. Det kan være forskelligt, hvilken mad og hvilke dele af fødevarer folk betragter som
spiselige. Vi er interesserede i at vide, hvilke af følgende I betragter som spiselige (noget I ville
spise eller overveje at spise).
Skala
Den grønne del af porren (Q32_1) o Altid spiselig (1)
o Kun spiselig i
særlige retter (2)
o Aldrig spiselig
(3)
Tørt brød (Q32_2)
Slatten salat (Q32_3)
Brune bananer (Q32_4)
Broccolistilke (Q32_5)
Kartoffelskræl (Q32_6)
Gulerodsskræl (Q32_7)
Æbleskræl (Q32_8)
Fiskeskind (Q32_9)
Synligt fedt i kød (Q32_10)

96
Q43. Vi vil også gerne vide, hvilke af følgende fødevarer I betragter som spiselige (noget I ville
spise eller overveje at spise).
Skala
Mad, der begynder at se uappetitlig ud, selv om den stadig kan spises
(Q43_1)
o Altid spiselig (1)
o Kun spiselig hvis
de indgår i andre
retter (2)
o Aldrig spiselig
(3)
Rester, som man har spist af to gange inden for samme uge (Q43_2)
Retter, som viste sig at være en skuffelse smagsmæssigt (fx fad i
smagen, for krydret) (Q43_3)
En kødret, der ser tør ud eller er kogt/stegt for meget (Q43_4)
Q44. Når du har de følgende fødevarer, og du er i tvivl om det stadig er sikkert at spise dem,
hvordan håndterer du det så? (vælg alle relevante)
Jeg spiser det,
hvis jeg tror at
kvaliteten er god
nok (1)
Jeg bruger det
i retter, hvor
det bliver
gennemkogt
(2)
Jeg fryser det
ned for at slå
farlige
bakterier ihjel
(3)
Jeg
smider
det ud
(4)
Andet
(5)
Skinke (hvis I er
vegetarer, tænk på et
vegetarisk alternativ)
(Q44_1)
□ □ □ □ □
Jordbær (Q44_2) □ □ □ □ □
<Respondents either saw Q45 and Q46 or Q47 and Q48 >
Q45. Hvad gør du, når du finder et uåbnet produkt i køleskabet, som har passeret "bedst før"
med 3-4 dage?
Skala
Æg (Q45_1) o Jeg smider det altid ud (1)
o Jeg kigger på det og lugter til det for at se, om det er spiseligt (2)
o Jeg smager på det for at tjekke, om det er spiseligt, hvis det lugter og
ser normalt ud (3)
o Vi spiser aldrig denne fødevare (4)
Yoghurt (Q45_2)
Småkager
(Q45_3)
Ost (Q45_4)
Røget laks
(Q45_5)
Færdigretter
(Q45_6)

97
Q46. Hvad gør du, når du finder et uåbnet produkt i køleskabet, som har passeret "sidste
anvendelsesdato" med 3-4 dage?
Skala
Hakket kød
(Q46_1)
o Jeg smider det altid ud (1)
o Jeg kigger på det og lugter til det for at se, om det er spiseligt (2)
o Jeg smager på det for at tjekke, om det er spiseligt, hvis det lugter og
ser normalt ud (3)
o Vi spiser aldrig denne fødevare (4)
Leverpostej
(Q46_2)
Kødpålæg
(Q46_3)
Q47. Hvad gør du, når du finder et uåbnet produkt i køleskabet, som har passeret "bedst før"
med 3-4 dage?
Skala
Æg (Q47_1) o Jeg smider det altid ud (1)
o Jeg kigger på det og lugter til det for at se, om det er spiseligt (2)
o Jeg smager på det for at tjekke, om det er spiseligt, hvis det lugter
og ser normalt ud (3)
o Vi spiser aldrig denne fødevare (4)
Yoghurt (Q47_2)
Småkager (Q47_3)
Ost (Q47_4)
Leverpostej
(Q47_5)
Kødpålæg (Q47_6)
Q48. Hvad gør du, når du finder et uåbnet produkt i køleskabet, som har passeret "sidste
anvendelsesdato" med 3-4 dage?
Skala
Hakket kød
(Q48_1)
o Jeg smider det altid ud (1)
o Jeg kigger på det og lugter til det for at se, om det er spiseligt (2)
o Jeg smager på det for at tjekke, om det er spiseligt, hvis det lugter
og ser normalt ud (3)
o Vi spiser aldrig denne fødevare (4)
Røget laks (Q48_2)
Færdigretter
(Q48_3)

98
4. Food-related practices in the households
Q49. Der er mange forskellige ting relateret til mad, som husholdninger skal forholde sig til. I
det følgende er vi interesserede i at vide noget om hvilke fødevare-relaterede opgaver, der er i
jeres husstand.
Q50. I din husholdning, hvor ofte køber du (eller et andet medlem af husstanden) ind?
o Mindre end en gang om ugen (1)
o 1-2 gange om ugen (2)
o 3-4 gange om ugen (3)
o 5-6 gange om ugen (4)
o Hver dag (5)
<This question was reported under Household characteristics>
Q52. Hvor ofte sker følgende i din husholdning i forbindelse med planlægning og indkøb af
mad?
Skala
Før vi tager på indkøb, tjekker vi, hvad vi har på lager (køkkenskabe,
køleskab) (Q52_1)
o Aldrig (1)
o Næsten aldrig
(2)
o Sjældent (3)
o Sommetider (4)
o Ofte (5)
o Næsten altid (6)
o Altid (7)
Vi laver madplan for et par dage ad gangen (Q52_2)
Vi køber mere, end vi har brug for aktuelt, når der er mængderabatter
(Q52_3)
Vi køber fødevarer, som det viser sig, at vi allerede har derhjemme
(Q52_4)
Vi køber noget, som vi ikke havde planlagt at købe (Q52_5)
Vi køber bevidst store mængder af varer, som vi altid bruger, for at
være sikre på at have nok (Q52_6)
Q53. Hvor ofte er de følgende udsagn sande for din husholdning, når det drejer sig om
opbevaring af fødevarer?
Skala
Vi har et godt overblik over, hvad vi har i køkkenskabene og i
køleskabet (Q53_1)
o Aldrig (1)
o Næsten aldrig
(2)
o Sjældent (3) Vi har styr på, hvor længe det, vi har i køleskabet, har været der
(Q53_2)

99
Vi glemmer fødevarer i køleskabet, indtil de er for gamle til at spise
(Q53_3)
o Sommetider (4)
o Ofte (5)
o Næsten altid (6)
o Altid (7) Vi opbevarer fødevarer, som vi ser det i supermarkedet (fx hvis et
produkt er på køl i supermarkedet, så lægger vi det i køleskabet
derhjemme, og hvis det ikke er på køl i supermarkedet, så lægger vi det
heller ikke på køl derhjemme) (Q53_4)
Vi gemmer måltidsrester i gennemsigtige bokse eller så vi tydeligt kan
se dem i køleskabet (Q53_6)
Vi opbevarer rester i fryseren (Q53_8)
Vi glemmer at bruge det, vi har i fryseren (Q53_9)
Q57. Hvor ofte sker følgende i din husholdning i forbindelse med madlavning og tilberedning af
mad?
Skala
Før vi begynder at lave mad, kigger vi i køkkenskabe og i køleskabet
for at se, hvad vi har (Q57_1)
o Aldrig (1)
o Næsten aldrig
(2)
o Sjældent (3)
o Sommetider (4)
o Ofte (5)
o Næsten altid (6)
o Altid (7)
Vi prioriterer at bruge rester og fødevarer, der er tæt på udløb, når vi
laver mad (Q57_2)
Vi bruger rester til madpakken næste dag (Q57_3)
Vi laver med vilje lidt mere end nødvendigt for at være sikre på, at der
er nok (Q57_4)
Vi har en madplan, vi går efter, når vi laver mad (Q57_5)
Vi spiser ikke det hele op (Q57_6)
Q58. Når du tænker på at spise og måltider, angiv venligst, hvor uenig eller enig, du er i følgende
udsagn
Skala
Jeg synes, at man altid skal spise det, der er på ens tallerken, når man
spiser derhjemme (Q58_1)
o Meget uenig 1
(1)
o 2 (2)
o 3 (3)
o 4 (4)
o 5 (5)
o 6 (6)
o Meget enig 7
(7)
Hjemme hos os spiser vi alle det samme til aften (Q58_3)
Vi serverer mange forskellige ting til måltiderne, så alle kan få noget,
de kan lide (Q58_4)
Nogle medlemmer af husstanden spiser ikke altid hjemme (Q58_5)
<Q58_5 was asked only for households with more than one member and flexible size
households>
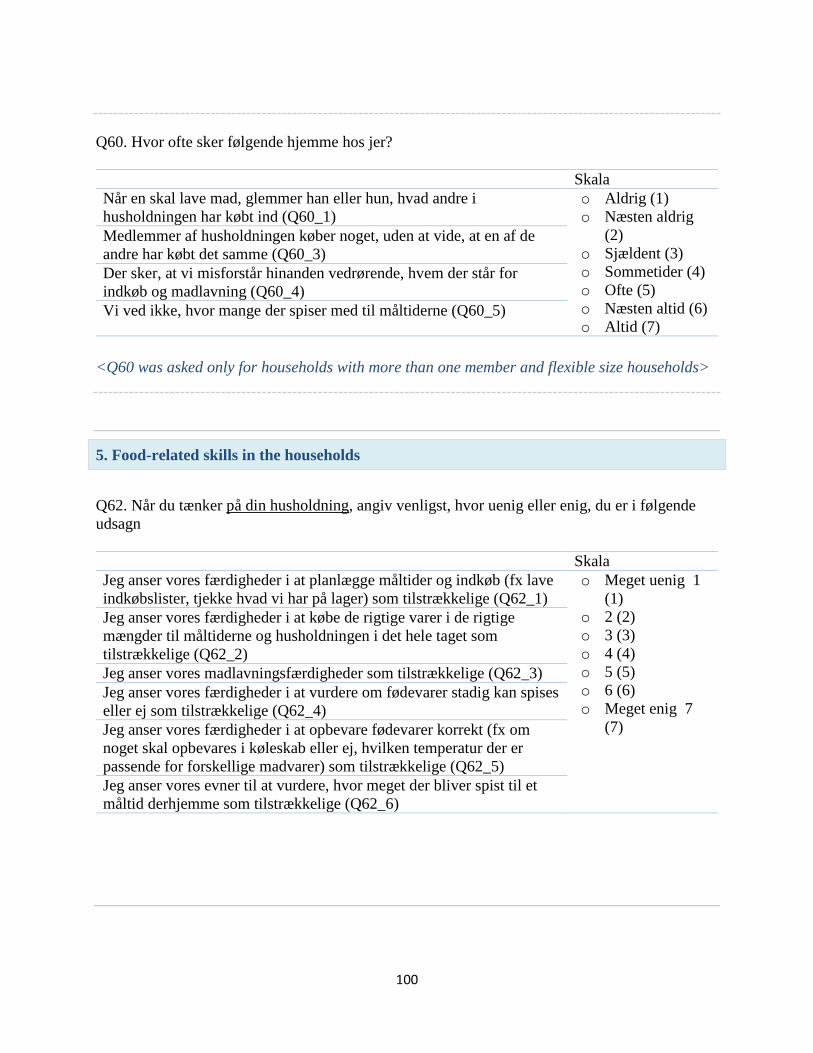
100
Q60. Hvor ofte sker følgende hjemme hos jer?
Skala
Når en skal lave mad, glemmer han eller hun, hvad andre i
husholdningen har købt ind (Q60_1)
o Aldrig (1)
o Næsten aldrig
(2)
o Sjældent (3)
o Sommetider (4)
o Ofte (5)
o Næsten altid (6)
o Altid (7)
Medlemmer af husholdningen køber noget, uden at vide, at en af de
andre har købt det samme (Q60_3)
Der sker, at vi misforstår hinanden vedrørende, hvem der står for
indkøb og madlavning (Q60_4)
Vi ved ikke, hvor mange der spiser med til måltiderne (Q60_5)
<Q60 was asked only for households with more than one member and flexible size households>
5. Food-related skills in the households
Q62. Når du tænker på din husholdning, angiv venligst, hvor uenig eller enig, du er i følgende
udsagn
Skala
Jeg anser vores færdigheder i at planlægge måltider og indkøb (fx lave
indkøbslister, tjekke hvad vi har på lager) som tilstrækkelige (Q62_1)
o Meget uenig 1
(1)
o 2 (2)
o 3 (3)
o 4 (4)
o 5 (5)
o 6 (6)
o Meget enig 7
(7)
Jeg anser vores færdigheder i at købe de rigtige varer i de rigtige
mængder til måltiderne og husholdningen i det hele taget som
tilstrækkelige (Q62_2)
Jeg anser vores madlavningsfærdigheder som tilstrækkelige (Q62_3)
Jeg anser vores færdigheder i at vurdere om fødevarer stadig kan spises
eller ej som tilstrækkelige (Q62_4)
Jeg anser vores færdigheder i at opbevare fødevarer korrekt (fx om
noget skal opbevares i køleskab eller ej, hvilken temperatur der er
passende for forskellige madvarer) som tilstrækkelige (Q62_5)
Jeg anser vores evner til at vurdere, hvor meget der bliver spist til et
måltid derhjemme som tilstrækkelige (Q62_6)

101
6. Individual characteristics
Q64. Hvor stor en indsats lægger du aktuelt i at minimere mængden af mad, der bliver kasseret
hjemme hos jer?
Ingen 1
(1) 2 (2) 3 (3) 4 (4) 5 (5) 6 (6)
Så meget som muligt 7
(7)
Q65. Hvor interesseret er du aktuelt i at minimere mængden af mad, der bliver kasseret hjemme
hos jer?
Slet ikke 1
(1) 2 (2) 3 (3) 4 (4) 5 (5) 6 (6) Meget 7 (7)
Q66. I hvilken grad prøver du at finde måder til at minimere mængden af mad, der bliver
kasseret hjemme hos jer?
Slet ikke 1 (1) 2 (2) 3 (3) 4 (4) 5 (5) 6 (6) Så meget som muligt 7
(7)
Q67. Hvor stor en indsats vil du gøre i den nærmeste fremtid for at minimere mængden af mad,
der bliver kasseret hjemme hos jer?
Ingen 1 (1) 2 (2) 3 (3) 4 (4) 5 (5) 6 (6) Så stor som muligt 7 (7)
Q68. Hvor vigtigt, hvis overhovedet, er følgende for at motivere dig til at reducere den mængde
mad, som I kasserer i den nærmeste fremtid?
Skala
Tanken om at spare penge (Q68_1) o Slet ikke vigtigt 1
(1)
o 2 (2)
o 3 (3)
o 4 (4)
o 5 (5)
o 6 (6)
o Meget vigtigt 7 (7)
Ønsket om at føle mig som en dygtig husmor/far (Q68_2)
Mine værdier (Q68_3)
Ønsket om at holde orden i køkkenet (Q68_4)
Ønsket om at hjælpe miljøet (Q68_5)
Ønsket om at undgå ærgrelsen over den tid der er gået med at købe
ind, opbevare og lave mad, der ikke blive spist (Q68_6)

102
Q69. Angiv venligst, hvor uenig eller enig, du er i følgende udsagn
Skala
At bruge de fødevarer vi har derhjemme op, er en vigtig del af hvem
jeg er (Q69_1)
o Meget uenig 1 (1)
o 2 (2)
o 3 (3)
o 4 (4)
o 5 (5)
o 6 (6)
o Meget enig 7 (7)
Jeg ser mig selv som en sparsommelig person, hvad angår mad
(Q69_3)
At være miljøvenlig er en vigtig del af, hvem jeg er (Q69_4)
Jeg er sådan en person, der nyder mad (Q69_8)
At være en god husmor/far er en vigtig del af hvem jeg er (Q69_10)
Jeg er den type, der er en god husmor/far (Q69_11)
Jeg er den type, der spiser sundt (Q69_14)
Q94. Angiv venligst, hvor uenig eller enig, du er i følgende udsagn
Skala
Jeg er den økonomiske type, hvad angår mad (Q94_2) o Meget uenig 1 (1)
o 2 (2)
o 3 (3)
o 4 (4)
o 5 (5)
o 6 (6)
o Meget enig 7 (7)
Jeg er sådan en type, der handler miljøbevidst (Q94_5)
Jeg ser mig selv som en miljøvenlig person (Q94_6)
Nydelsen ved at spise er en stor del af, hvem jeg er (Q94_7)
Jeg ser mig selv som en person, der stræber efter nydelse og gode
oplevelser, når jeg spiser et måltid (Q94_9)
Jeg ser mig selv som en person, som er god til at køre en
husholdning (Q94_12)
At vælge fødevarer, der er gode for mit helbred, er en vigtig del af,
hvem jeg er (Q94_13)
Jeg ser mig selv som en person, der bekymrer sig om sit helbred
(Q94_15)
Q75. Tænk på det at købe generelt, og angiv venligst, hvor uenig eller enig du er i følgende
udsagn
Skala
Normalt planlægger jeg mine indkøb nøje (Q75_1) o Meget uenig 1
(1)
o 2 (2)
o 3 (3)
o 4 (4)
o 5 (5)
o 6 (6)
o Meget enig 7 (7)
Normalt køber jeg kun ting, jeg havde planlagt at købe (Q75_2)
Før jeg køber noget, overvejer jeg altid nøje, om det er noget, jeg
har behov for (Q75_3)
Jeg overvejer det normalt grundigt, før jeg køber noget (Q75_4)
Jeg køber ofte noget uden at tænke mig om (Q75_5)
Jeg køber ofte noget spontant (Q75_6)

103
Q76. Angiv venligst, hvor frastødende du synes, det vil være at spise følgende fødevarer.
Skala
Rester efter de har været på bordet (Q76_1) o Ikke frastødende
overhovedet 1
(1)
o 2 (2)
o 3 (3)
o 4 (4)
o 5 (5)
o 6 (6)
o Særdeles
frastødende 7 (7)
En ret, der delvis er lavet af rester fra et tidligere måltid (Q76_2)
Kartofler, hvor sorte pletter er blevet fjernet (Q76_3)
Æblebåde, der er blevet brune af at have været udsat for ilt (Q76_4)
Ost, hvor en mugplet er blevet fjernet (Q76_5)
Salat, hvor der var en lille snegl i, som er blevet fjernet (Q76_6)
Q92. Nedenfor beskriver vi kort en person. Marker ud for hvert udsagn, hvor meget denne
person ligner eller ikke ligner dig.
Skala
Han mener, det er vigtigt, at alle mennesker i verden bliver
behandlet lige. Han ønsker retfærdighed for alle, selv for
mennesker han ikke kender (Q92_3)
o Ligner mig slet ikke
(1)
o Ligner mig ret dårligt
(2)
o Ligner mig lidt (3)
o Ligner mig ret godt
(4)
o Ligner mig virkelig
godt (5)
o Ligner mig helt
præcist (6)
Det er vigtigt for ham at lytte til mennesker, der er anderledes
end ham selv. Selv når han er uenig med dem, vil han alligevel
gerne forstå dem (Q92_8)
Det ligger ham meget på sinde, at man skal beskytte naturen.
Det er vigtigt for ham at passe på miljøet (Q92_19)
<This question was asked only for males>
Q93. Nedenfor beskriver vi kort en person. Marker ud for hvert udsagn, hvor meget denne
person ligner eller ikke ligner dig.
Skala
Hun mener, det er vigtigt, at alle mennesker i verden bliver
behandlet lige. Hun ønsker retfærdighed for alle, selv for
mennesker hun ikke kender (Q93_3)
o Ligner mig slet ikke
(1)

104
Det er vigtigt for hende at lytte til mennesker, der er anderledes
end hende selv. Selv når hun er uenig med dem, vil hun
alligevel gerne forstå dem (Q93_8)
o Ligner mig ret dårligt
(2)
o Ligner mig lidt (3)
o Ligner mig ret godt
(4)
o Ligner mig virkelig
godt (5)
o Ligner mig helt
præcist (6)
Det ligger hende meget på sinde, at man skal beskytte naturen.
Det er vigtigt for hende at passe på miljøet (Q93_19)
<This question was asked only for females>
Q77. Angiv venligst, hvor uenig eller enig, du er i følgende udsagn
Skala
Hvis jeg vil, kan jeg mindske madspildet hjemme hos os
(Q77_1)
o Meget uenig 1 (1)
o 2 (2)
o 3 (3)
o 4 (4)
o 5 (5)
o 6 (6)
o Meget enig 7 (7)
Jeg er overbevist om, at jeg kan mindske madspildet hjemme
hos os, selv om jeg er den eneste, der gør en indsats (Q77_2)
Jeg er overbevist om, at jeg kan få de andre i husstanden til at
mindske madspildet hjemme hos os (Q77_3)
<Q77_3 was asked only for households with more than one member and flexible size
households>
Household characteristics
Q78. Hvor ofte, hvis overhovedet, spiser I følgende typer mad hjemme hos jer?
Skala
Hjemmelavede måltider hovedsageligt lavet af råvarer
(Q78_1)
o Aldrig (1)
o Mindre end en gang om
måneden (2)
o 1-3 gange om måneden (3)
o En gang om ugen (4)
o 2-4 gange om ugen (5)
o 5-6 gange om ugen (6)
o Hver dag (7)
Færdigretter, der bare skal varmes og ikke kræver
yderligere tilberedning (Q78_2)
Convenience-produkter, der kræver nogen tilberedning
(Q78_3)
Take-away måltider, som er klar til at spise, som de er
(Q78_4)

105
Q79. Hvor ofte, hvis overhovedet, spiser I følgende typer mad hjemme hos jer?
Skala
Mælk og mejeriprodukter (Q79_1) o Aldrig (1)
o Mindre end en gang om
måneden (2)
o 1-3 gange om måneden (3)
o En gang om ugen (4)
o 2-4 gange om ugen (5)
o 5-6 gange om ugen (6)
o Hver dag (7)
Frisk frugt og grønt (Q79_2)
Kød og fisk (Q79_3)
Brød og andre bagerprodukter (Q79_4)
Q80. Når du tænker på din husholdning, angiv venligst, hvor uenig eller enig, du er i følgende
udsagn
Meget uenig
1 (1)
Vi foretrækker friske produkter frem for dåsemad eller
frosne produkter (Q80_1)
o Meget uenig 1 (1)
o 2 (2)
o 3 (3)
o 4 (4)
o 5 (5)
o 6 (6)
o Meget enig 7 (7)
Det er vigtigt for os, at fødevarer er friske (Q80_2)
Vi foretrækker at købe kød og grøntsager, som ikke er
emballeret frem for emballeret (Q80_3)
Socio-demographics
Q81. Hvad er din alder? (brug tal)
________________________________________________________________
Q83. Angiv venligst din højeste gennemførte uddannelse
o Grund-/folkeskole (1)
o Almengymnasial uddannelse (studentereksamen/HF) (2)
o Erhvervsgymnasial uddannelse (HH/HTX/HHX) (3)
o Erhvervsfaglig uddannelse (4)
o Kort videregående uddannelse under 3 år (5)
o Mellemlang videregående uddannelse 3-4 år (6)
o Lang videregående uddannelse 5 år eller mere (7)

106
o Forskeruddannelse (f.eks. PHD) (8)
o Ønsker ikke at oplyse (9)
Q84. Hvad er din nuværende arbejdsmæssige status?
o Fuldtidsarbejde (+30 timer/ugen) (1)
o Deltid (8-29 timer/ugen) (2)
o Deltid (under 8 timer/ugen) (3)
o Pensioneret/ førtidspensioneret/ på efterløn (4)
o Går i skole (5)
o Følger fuldtidsstudium på længerevarende uddannelse (6)
o Arbejdsløs (jobsøgende) (7)
o Arbejdsløs (ikke jobsøgende) (8)
o Hjemmegående (9)
o Andet (10)
Q90. Følger nogen i din husstand en vegetarisk/vegansk diæt?
o Ingen (1)
o Jeg følger selv en vegetarisk/vegansk diæt (2)
o En anden eller andre i min husstand følger en vegetarisk/vegansk diæt (3)
o Alle i min husstand følger en vegetarisk/vegansk diæt (4)
< (3) and (4) shown only to households with more than one member and flexible size
households>
Q85. Hvad er din husstands årlige indkomst før skat?
o Mindre end 100.000 kr. (1)
o 100.000 til 199.999 kr. (2)
o 200.000 til 299.999 kr. (3)
o 300.000 til 399.999 kr. (4)
o 400.000 til 499.999 kr. (5)
o 500.000 til 599.999 kr. (6)
o 600.000 til 699.999 kr. (7)
o 700.000 til 799.999 kr. (8)
o 800.000 til 899.999 kr. (9)
o 900.000 til 999.999 kr. (10)
o 1.000.000 kr. kr. eller mere (11)
o Ved ikke (12)
o Ønsker ikke at oplyse (13)

107
Closing
Q91. Hvis du har spørgsmål eller kommentarer, bedes du kontakte … på e-mail [email protected].
På forhånd mange tak for hjælpen!
Venlig hilsen
Aarhus Universitet
MAPP Research Centre

108
Appendix 4
Themes identified when coding the answers to the open-ended question on consumer
understanding of food waste
Code name Description Example answers
Food that is thrown
away (Throwing
away food)
Short answers saying that food
waste means: food being
discarded or the action of
discarding food
At, smide mad ud er madspild.;
Mad der ryger i skraldespanden
Excessive
purchasing
Answers emphasizing that food
waste: is about buying too much
or buying more than is used,
some go on to say that the food is
not used before it goes bad
because so much is bought. Also
covers those who say they buy
too much because packages are
too big or there are discounts
køber for stor mængde ind og
smider det der ikke bliver brugt ud;
Du køber mere end du ædet!;
Indkøb af for store mængder mad;
Køb af alt for store mængder
fødevarer især i supermarkederne,
især enlige og pensionister burde
kunne købe mindre portioner af
fødevarer
Cooking more than
can be eaten
Answers emphasizing that food
waste: is about cooking too much
or cooking more than can be
eaten, some go on to say that the
extra food is not used and so is
discarded
Laver for meget mad og smider
resterne ud; Madspild er når man
tilbereder mere mad end det der
bliver spist.; At man laver for meget
mad og ikke fryser ned fx
Leftover
food/products that
are thrown away
(Throwing away
leftover
food/products)
Answers emphasizing that food
waste: is about discarding the
leftovers from cooked food or
leftover products instead of using
them, or is about not reusing
leftovers
rester fra måltider der kan
anvendes som menneske føde, men
som smides væk; har for stort
oveskud, der herefter kasseres; Mad
der ikke kan spises op til måltider
og derefter kasseres.; at det er hvis
de ikke bruger resterne næste dag
hvis der er rester
Food that is edible
(usable) but is
thrown away
(Throwing away
food that is edible
(usable))
Answers emphasizing that food
waste: refers to throwing away
food that can be eaten, food that
is still good, etc.
det er mad som er brugbart som
bliver smidt ud; det er når noget
bliver smidt ud selvom det muligvis
kunne holde en dag eller to mere;
At kassere spiseligt mad

109
Food that is not
used but thrown
away (Throwing
away food that is
not used)
Answers emphasizing that food
waste: refers to food that is not
eaten and thus discarded, or food
that is bought and not used (e.g.
before expires or goes bad)
Det er alt det som i ikke spiser, og
smider direkte i skraldespanden;
indkøbte/tilberedte fødevarer, der
ikke bliver spist, men ender som
affald.; Alt det mad vi køber men
ikke får brugt.; Overskud smides ud
Food that gets old is
thrown away
(Throwing away
food that gets old)
Answers emphasizing that food
waste: is about throwing away
food that becomes or is old/bad
at smide madvarer ud der har ligget
for længe i køleskab / fryser; Mad
som bliver for dårligt og ikke bliver
brugt, og som derfor smides ud
Food that is thrown
away due to date
labelling concerns
(Throwing away
food due to date
labelling concerns)
Answers emphasizing that food
waste: is about throwing away
food that has passed the
expiration date or is food that is
discarded because people are
worried about the date labelling
det er at smide mad væk, fordi
slutdatoen er overskredet med en
dag; At smide uåbnet madvarer ud
pga dato
Excessive
consumption
Answers emphasizing that food
waste: refers to over consumption
overforbrug, ubegrundet
udsmidning af mad; Overforbrug af
råvarer
Bad management of
food
Answers emphasizing that food
waste: is about bad management
of food including lack of planning
dårlig planlægning. hvs du har
noget til overs, så genbrug det
Waste of resources Answers emphasizing that food
waste: is a waste of resources
spild af resurcer; Unødvendig brug
af råstoffer
Waste at the
distribution level
(e.g. supermarket
or restaurants)
Answers which refer to food
waste at the other levels than the
consumer (e.g. food waste in
stores, restaurants, at the
producers, etc.)
At det er overskridelse af dato på
fødevarer i forretningerne;
Other Answers that could not be coded
elsewhere
No answer / Don’t
know
Answers of the type “do not
know” or where nothing was
written

110
Appendix 5
Associations between demographic characteristics and the food waste clusters
Food waste clusters Total
Low waste
cluster(1)
High waste
cluster(2)
Age groups 18 to 34 Count 64a 76b 140
% 20.6% 38.4% 27.6%
35 to 49 Count 68a 58a 126
% 21.9% 29.3% 24.8%
50 to 64 Count 78a 42a 120
% 25.2% 21.2% 23.6%
65 or over Count 100a 22b 122
% 32.3% 11.1% 24.0%
Total Count 310 198 508
% 100.0% 100.0% 100.0%
Occupation
groups
Full-time job Count 107a 113b 220
% 34.5% 57.1% 43.3%
Retired Count 116a 32b 148
% 37.4% 16.2% 29.1%
Other (e.g.
part-time,
unemployed)
Count 87a 53a 140
% 28.1% 26.8% 27.6%
Total Count 310 198 508
% 100.0% 100.0% 100.0%
Household
size(3)
1 member Count 103a 55a 158
% 33.2% 27.8% 31.1%
2 members Count 142a 76a 218
% 45.8% 38.4% 42.9%
3+ members Count 65a 67b 132
% 21.0% 33.8% 26.0%
Total Count 310 198 508
% 100.0% 100.0% 100.0%

111
Presence of
children(4)
no children Count 264a 144b 408
% 85.2% 72.7% 80.3%
with children Count 46a 54b 100
% 14.8% 27.3% 19.7%
Total Count 310 198 508
% 100.0% 100.0% 100.0%
Household
income
groups
under
299.999 dkk
Count 86a 43b 129
% 35.8% 26.2% 31.9%
300.000 to
599.999 dkk
Count 99a 55a 154
% 41.3% 33.5% 38.1%
600.000 dkk
or more
Count 55a 66b 121
% 22.9% 40.2% 30.0%
Total Count 240 164 404
% 100.0% 100.0% 100.0%
Pearson Chi-Square >=10; all significant at p<.05. For each of the demographics, different
subscript letters show that the column proportions are significantly different.
(1) Respondents who reported household food waste of less than a tenth of what is bought or
produced in all food categories
(2) Respondents who reported household food waste of more than a tenth of what is bought or
produced in at least one food category
(3) The household size for flexible households is the number of people who live in the household
most of the time
(4) The presence of children for flexible households refers to having children in the household
most of the time
(5) “%” refers to percentage within the Food waste cluster

112
Appendix 6
Associations between demographic characteristics and consumer perceptions, practices,
incentives for motivation and awareness of food waste consequences.
The associations between demographics (age and occupation groups) and consumer perceptions,
food-related practices, incentives for motivation and awareness of food waste consequences were
explored. The results are presented in the tables below. Only age and occupation groups were
included in these analyses as these were the demographics that had a significant effect on the
food waste clusters in the logistic regression (when considering the relative importance of all
demographics, see Section 4.8.). In relation to age, the 18 to 34 years old group was associated
with higher food waste, thus, only the results related to the comparison between the 18 to 34
years old group and the other age groups are presented in the table below. Similarly, for
occupation the “full-time job” group was associated with higher food waste as opposed to the
“other” occupation group (e.g. part-time job, unemployed), thus, only the results related to the
comparison between the “full-time job” group and the occupation groups “other” or “retired”, are
presented in the table below.
Table. Associations between Perceptions of edibility of certain foods and parts of food and
Demographics
Age groups
35+ 18 to 34
Upper part of leeks Always edible Count 185a 56b
% within Age groups 50.3% 40.0%
Edible only
when used in
specific recipes
Count 118a 45a
% within Age groups 32.1% 32.1%
Never edible Count 65a 39b
% within Age groups 17.7% 27.9%
Dry bread Always edible Count 106a 25b
% within Age groups 28.8% 17.9%
Edible only
when used in
specific recipes
Count 185a 89b
% within Age groups 50.3% 63.6%

113
Never edible Count 77a 26a
% within Age groups 20.9% 18.6%
Browned bananas Always edible Count 142a 39b
% within Age groups 38.6% 27.9%
Edible only
when used in
specific recipes
Count 149a 80b
% within Age groups 40.5% 57.1%
Never edible Count 77a 21a
% within Age groups 20.9% 15.0%
Potato skins Always edible Count 49a 26a
% within Age groups 13.3% 18.6%
Edible only
when used in
specific recipes
Count 95a 48a
% within Age groups 25.8% 34.3%
Never edible Count 224a 66b
% within Age groups 60.9% 47.1%
Carrot peels Always edible
Count 36a 25b
% within Age groups 9.8% 17.9%
Edible only
when used in
specific recipes
Count 77a 50b
% within Age groups 20.9% 35.7%
Never edible Count 255a 65b
% within Age groups 69.3% 46.4%
Apple skin Always edible Count 133a 78b
% within Age groups 36.1% 55.7%
Edible only
when used in
specific recipes
Count 74a 34a
% within Age groups 20.1% 24.3%
Never edible Count 161a 28b
% within Age groups 43.8% 20.0%
Cross-tabs were conducted separately for each food. Pearson Chi-Square >=7; all significant at p<.05.
Only foods where there were statistically significant associations are presented. For each food, different
subscript letters show that the column proportions are significantly different; N=508

114
Table. Associations between Perceptions of edibility of certain foods and Demographics
Age groups
Occupation
35+ 18 to 34
Retired
or Other
Full-
time job
Food that
starts to look
unappealing
even if it still
can be eaten
Always
edible
Count 63a 51b Count 75a 39b
% within Age groups 17.1% 36.4% % within
Occupation 26.0% 17.7%
Edible
only when
made into
another
dish
Count 135a 61a Count 99a 97b
% within Age groups 36.7% 43.6% % within
Occupation 34.4% 44.1%
Never
edible
Count 170a 28b Count 114a 84a
% within Age groups 46.2% 20.0% % within
Occupation
39.6% 38.2%
Food that is
leftover and
you have
been eating
from it twice
before in the
same week
Always
edible
Count 198a 92b
% within Age groups 53.8% 65.7%
Edible
only when
made into
another
dish
Count 80a 30a
% within Age groups 21.7% 21.4%
Never
edible
Count 90a 18b
% within Age groups 24.5% 12.9%
Cross-tabs were conducted separately for each food. Pearson Chi-Square >=6; all significant at p<.05.
Only foods where there were statistically significant associations are presented. For each food, different
subscript letters show that the column proportions are significantly different; N=508

115
Table. Associations between age groups and food-related practices, incentives for motivation to reduce food waste, perceptions of
food waste and awareness of food waste consequences
Age
18 to 34 vs. 35 to 49
years old
18 to 34 vs. 50 to 64
years old
18 to 34 vs. 65+
years old
Mean difference Sig. Mean difference Sig. Mean difference Sig. positive values:
mean in the 18 to 34
group > mean in the
35 to 49 group;
negative values mean in the 18 to 34
group < mean in the
35 to 49 group)
positive values:
mean in the 18 to
34 group > mean in
the 50 to 64 group;
negative values: mean in the 18 to
34 group < mean in
the 50 to 64 group)
positive values:
mean in the 18 to
34 group > mean
in the 65+ group;
negative values: mean in the 18 to
34 group < mean
in the 65+ group)
Planning and Shopping Practices
Before going grocery shopping, we
check our inventories (cupboards,
fridge) to see what we already have
at home
NS
NS -.614 .003
We make a meal plan for a couple
of days ahead
NS
NS .708 .014
We buy food in quantities that are
bigger than what we currently
need when there are quantity
discounts
NS
NS
NS
We buy food products that then we
find out we already had at home
NS
NS
NS
We buy products that we did not
plan to buy
NS
NS
NS
We intentionally buy larger
quantities of some products that
are staples in our home to make
sure that we will have enough
NS
NS
NS
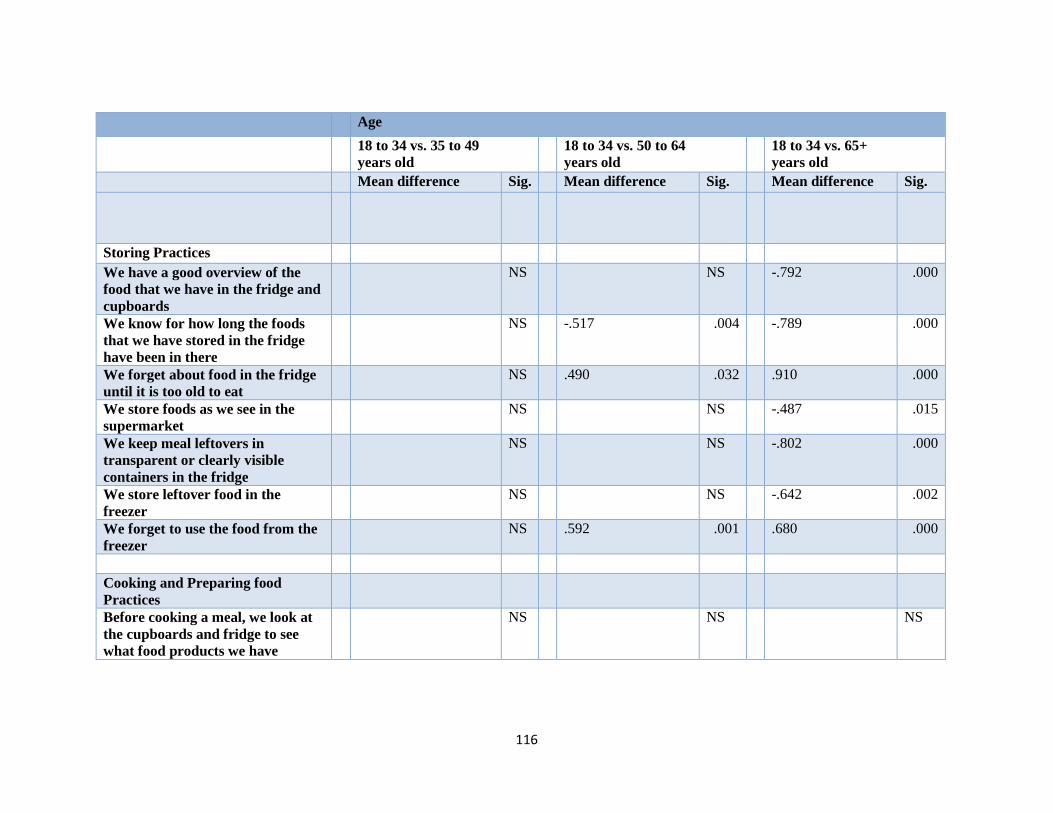
116
Age
18 to 34 vs. 35 to 49
years old
18 to 34 vs. 50 to 64
years old
18 to 34 vs. 65+
years old
Mean difference Sig. Mean difference Sig. Mean difference Sig.
Storing Practices
We have a good overview of the
food that we have in the fridge and
cupboards
NS
NS -.792 .000
We know for how long the foods
that we have stored in the fridge
have been in there
NS -.517 .004 -.789 .000
We forget about food in the fridge
until it is too old to eat
NS .490 .032 .910 .000
We store foods as we see in the
supermarket
NS
NS -.487 .015
We keep meal leftovers in
transparent or clearly visible
containers in the fridge
NS
NS -.802 .000
We store leftover food in the
freezer
NS
NS -.642 .002
We forget to use the food from the
freezer
NS .592 .001 .680 .000
Cooking and Preparing food
Practices
Before cooking a meal, we look at
the cupboards and fridge to see
what food products we have
NS
NS
NS
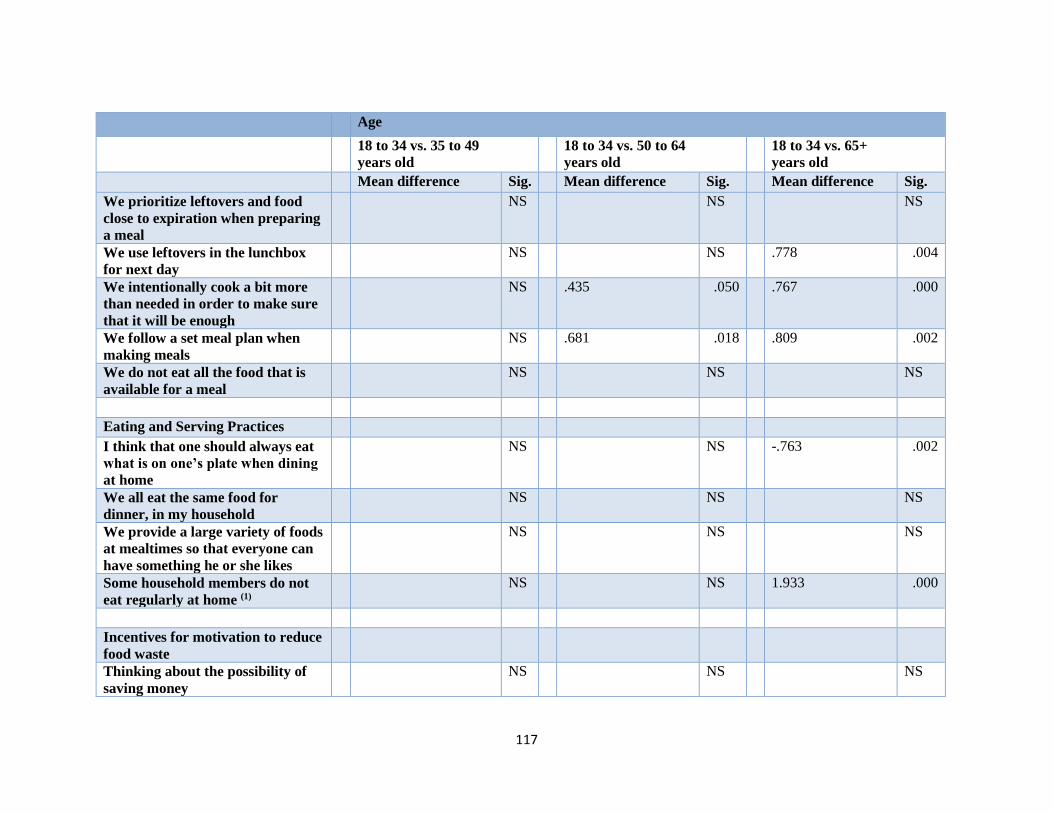
117
Age
18 to 34 vs. 35 to 49
years old
18 to 34 vs. 50 to 64
years old
18 to 34 vs. 65+
years old
Mean difference Sig. Mean difference Sig. Mean difference Sig.
We prioritize leftovers and food
close to expiration when preparing
a meal
NS
NS
NS
We use leftovers in the lunchbox
for next day
NS
NS .778 .004
We intentionally cook a bit more
than needed in order to make sure
that it will be enough
NS .435 .050 .767 .000
We follow a set meal plan when
making meals
NS .681 .018 .809 .002
We do not eat all the food that is
available for a meal
NS
NS
NS
Eating and Serving Practices
I think that one should always eat
what is on one’s plate when dining
at home
NS
NS -.763 .002
We all eat the same food for
dinner, in my household
NS
NS
NS
We provide a large variety of foods
at mealtimes so that everyone can
have something he or she likes
NS
NS
NS
Some household members do not
eat regularly at home (1)
NS
NS 1.933 .000
Incentives for motivation to reduce
food waste
Thinking about the possibility of
saving money
NS
NS
NS

118
Age
18 to 34 vs. 35 to 49
years old
18 to 34 vs. 50 to 64
years old
18 to 34 vs. 65+
years old
Mean difference Sig. Mean difference Sig. Mean difference Sig.
Wanting to feel competent in the
kitchen
NS
NS
NS
Thinking about my values
NS -.475 .038 -.668 .001
Wanting to keep order in the
kitchen
NS
NS -.686 .001
Wanting to help the environment
NS
NS
NS
Avoiding to feel regret about time
spent shopping, storing and
preparing food not eaten
NS
NS
NS
Perception of leftover food fed to
animals
In my household, we consider
leftover food fed to pets/animals as
food waste
NS
NS -.633 .047
Awareness of food waste
consequences
Food waste (food thrown away) is
a problem for the environment
NS NS NS
Food waste (food thrown away)
generated in Denmark has an
impact on the undernourished
people in the world
NS NS NS
In my household, we are aware of
how much money we use weekly
for food that gets thrown away
NS -.831 .003 -1.191 .000
ANOVA analyses (with Bonferroni adjustment in the comparison of age groups; or with Games-Howell adjustment for those analyses where
homogeneity of variance was an issue) were conducted per each practice, incentive, perception or awareness measure; NS=not statistically
significant;

119
(1) N=367; for all other measures N=508
(2) All measures had answer options from (1) to (7) and all 7 points were used for these analyses. The higher values represent higher frequency
(for Planning and Shopping, Storing, and Cooking and preparing food practices), higher agreement (Eating and serving practices, Perception of
leftover food fed to animals and Awareness of food waste consequences) or higher importance (Incentives for motivation)
Table. Associations between occupation groups and food-related practices, incentives for motivation to reduce food waste, perceptions
of food waste and awareness of food waste consequences
Occupation
Full-time job vs. Retired Full-time job vs. Other
Mean difference Sig. Mean difference Sig.
positive values: mean
in the Full-time job
group > mean in the
Retired group;
negative values: mean
in the Full-time job
group < mean in the
Retired group)
positive values: mean
in the Full-time job
group > mean in the
Other group;
negative values: mean
in the Full-time job
group < mean in the
Other group)
Planning and Shopping Practices
Before going grocery shopping, we check our
inventories (cupboards, fridge) to see what we already
have at home
-.418 .017
NS
We make a meal plan for a couple of days ahead
NS
NS
We buy food in quantities that are bigger than what we
currently need when there are quantity discounts
NS
NS
We buy food products that then we find out we already
had at home
NS .371 .006
We buy products that we did not plan to buy
.390 .003
NS
We intentionally buy larger quantities of some products
that are staples in our home to make sure that we will
have enough
NS
NS

120
Occupation
Full-time job vs. Retired Full-time job vs. Other
Mean difference Sig. Mean difference Sig.
Storing Practices
We have a good overview of the food that we have in the
fridge and cupboards
-.548 .000
NS
We know for how long the foods that we have stored in
the fridge have been in there
-.479 .000
NS
We forget about food in the fridge until it is too old to
eat
.657 .000
NS
We store foods as we see in the supermarket
NS
NS
We keep meal leftovers in transparent or clearly visible
containers in the fridge
-.371 .034
NS
We store leftover food in the freezer
-.444 .011
NS
We forget to use the food from the freezer
.422 .007
NS
Cooking and Preparing food Practices
Before cooking a meal, we look at the cupboards and
fridge to see what food products we have
NS
NS
We prioritize leftovers and food close to expiration
when preparing a meal
NS
NS
We use leftovers in the lunchbox for next day
.528 .027
NS
We intentionally cook a bit more than needed in order
to make sure that it will be enough
NS
NS
We follow a set meal plan when making meals
.491 .038
NS
We do not eat all the food that is available for a meal
NS
NS
Eating and Serving Practices
I think that one should always eat what is on one’s plate
when dining at home
-.644 .001
NS
We all eat the same food for dinner, in my household
NS
NS

121
Occupation
Full-time job vs. Retired Full-time job vs. Other
Mean difference Sig. Mean difference Sig.
We provide a large variety of foods at mealtimes so that
everyone can have something he or she likes
NS
NS
Some household members do not eat regularly at home (1)
1.055 .000
NS
Incentives for motivation
Thinking about the possibility of saving money
NS
NS
Wanting to feel competent in the kitchen
-.514 .047
NS
Thinking about my values
NS
NS
Wanting to keep order in the kitchen
-.687 .000 -.392 .047
Wanting to help the environment
NS
NS
Avoiding to feel regret about time spent shopping,
storing and preparing food not eaten
NS NS
Perception of leftover food fed to animals
In my household, we consider leftover food fed to
pets/animals as food waste
-.504 .038
NS
Awareness of food waste consequences
Food waste (food thrown away) is a problem for the
environment
NS NS
Food waste (food thrown away) generated in Denmark
has an impact on the undernourished people in the
world
NS NS
In my household, we are aware of how much money we
use weekly for food that gets thrown away
-1.186 .000 NS

122
ANOVA analyses (with Bonferroni adjustment in the comparison of occupation groups; or with Games-Howell adjustment for those analyses
where homogeneity of variance was an issue) were conducted per each practice, incentive, perception or awareness measure; NS=not statistically
significant;
(1) N=367; for all other measures N=508
(2) All measures had answer options from (1) to (7) and all 7 points were used for these analyses. The higher values represent higher frequency
(for Planning and Shopping, Storing, and Cooking and preparing food practices), higher agreement (Eating and serving practices, Perception of
leftover food fed to animals and Awareness of food waste consequences) or higher importance (Incentives for motivation)


![My Driving Recorder! - ROADSCAN · My Driving Recorder! VEDR (Video Event Data Recorder) Continuous Recording DT (Digital Tachometer) [This product is the VEDR system for vehicles.]](https://static.fdocuments.us/doc/165x107/5f4e506593a43479f135495b/my-driving-recorder-my-driving-recorder-vedr-video-event-data-recorder-continuous.jpg)