
Various Aspects of Bollard Pull Tests and Analysis of Test ... · propulsion systems, a different...
20
Journal of Ship Production and Design, Vol. 34, No. 3, August 2018, pp. 249–268 http://dx.doi.org/10.5957/JSPD.170001 Various Aspects of Bollard Pull Tests and Analysis of Test Results Arun Kr Dev School of Marine Science and Technology (MaST), Newcastle University International Singapore (NUIS), Singapore The static force exerted on a hawser at zero ship speed by a vessel, otherwise known as the bollard pull, is one of the key performance indicators of Tugs, Anchor Handling Tugs (AHTs) and Anchor Handling Tug Supply Vessels (AHTSVs).The value of bollard pull is considered critical as it defines the functionality and performance of the vessel. When a company decides on chartering a vessel, a definite prerequisite considered is the value of the bollard pull. The value may be obtained via three ways: calculations, model-testing, and full-scale trials. The latter is often used officially to certify the vessel’s bollard pull rating, with the presence of the vessel’s owners, surveyors, and any other third parties. The tests and trials follow a set of guidelines provided by classification societies but do not have a standardized set of rules. Therefore, disagreements often arise over the results of such tests and trials. Tests are often carried without any load cells measuring the shaft power to ascertain the brake horsepower (BHP). Simply, engine rpm/ rating is used to fix the 100% maximum continuous rating (MCR) which often in the range of 105–108% MCR. Some of the parties involved in certifying the correct bollard pull tests (BPTs) do not even understand what is all about the bollard pull. Everybody is looking for a higher figure for the bollard pull on the certificate when the reality is different. The author examines and discusses the broad spectrum of factors that affects the “true” value of the bollard pull and explains why such a standardized set of mandatory BPT and the trial code is deemed necessary. The author also presents some of the interesting BPTs data to show the differences in various ways of conducting BPTs. Keywords: Bollard pull; test and trial code; tugs; offshore support vessels; AHTs; AHTSVs; shaft power; engine MCR; instrumentation; classification societies; vessel performance 1. Introduction The bollard pull (BP) is the zero speed pulling/pushing capability of a vessel, i.e., Tugs, Anchor Handling Tug (AHTs), Anchor Handling Tug/ Towing Supply Vessel (AHTSVs), trawlers, etc. It is considered as one of the key practical performance indicators of the above-mentioned vessels, measuring the usefulness of the vessel in a stranding scenario or in holding large vessels such as tankers or towing a rig. Such bollard pull tests (BPTs) are conducted to ensure the performance of the vessel upon delivery. The test is witnessed in the presence of the International Classification Societies (CS) surveyors representing the classification society, the owners’ representatives of the vessel, engine and propeller manufacturer, representatives from the shipyard, and people who have partaken in the con- struction of the vessel. The BPTs have a significant impact on the performance indicator of Tugs, AHTs, and AHTSVs. It is so because, often, ship owners/ship operators would use the value of the bollard pull certification as a selling point of the vessel. The higher the value, the higher the weight the vessel can tow. Therefore, the value of the bollard pull becomes a key performance indicator of the vessel. Bollard pull is critical to ship owners/ship operators so much, so that the value of the bollard pull is one of the contractual items to be met during the contractual delivery of the vessel. However, there are no stringent rules stipulated by classification societies for the conduct of a BPT. What are given is usually rec- ommended guidelines for the conduct of the test, which is not specific enough to provide a standardized and identical method of testing. Manuscript received by JSPD Committee June 24, 2017; accepted July 20, 2017. Corresponding author: Arun Kr Dev, [email protected]; a.k.dev@ncl. ac.uk AUGUST 2018 JOURNAL OF SHIP PRODUCTION AND DESIGN 249 2158-2866/18/3403-0249$00.00/0
Transcript of Various Aspects of Bollard Pull Tests and Analysis of Test ... · propulsion systems, a different...

Journal of Ship Production and Design, Vol. 34, No. 3, August 2018, pp. 249–268http://dx.doi.org/10.5957/JSPD.170001
Various Aspects of Bollard Pull Tests and Analysis of Test Results
Arun Kr Dev
School of Marine Science and Technology (MaST), Newcastle University International Singapore (NUIS), Singapore
The static force exerted on a hawser at zero ship speed by a vessel, otherwise knownas the bollard pull, is one of the key performance indicators of Tugs, Anchor HandlingTugs (AHTs) and Anchor Handling Tug Supply Vessels (AHTSVs).The value of bollardpull is considered critical as it defines the functionality and performance of the vessel.When a company decides on chartering a vessel, a definite prerequisite considered isthe value of the bollard pull. The value may be obtained via three ways: calculations,model-testing, and full-scale trials. The latter is often used officially to certify thevessel’s bollard pull rating, with the presence of the vessel’s owners, surveyors, and anyother third parties. The tests and trials follow a set of guidelines provided by classificationsocieties but donot have a standardized set of rules. Therefore, disagreements often ariseover the results of such tests and trials. Tests are often carried without any load cellsmeasuring the shaft power to ascertain the brake horsepower (BHP). Simply, engine rpm/rating is used to fix the 100%maximumcontinuous rating (MCR) which often in the rangeof 105–108%MCR. Some of the parties involved in certifying the correct bollard pull tests(BPTs) do not even understandwhat is all about the bollard pull. Everybody is looking for ahigher figure for the bollard pull on the certificate when the reality is different. The authorexamines and discusses the broad spectrum of factors that affects the “true” value of thebollard pull andexplainswhy sucha standardized set ofmandatoryBPTand the trial codeis deemed necessary. The author also presents some of the interesting BPTs data toshow the differences in various ways of conducting BPTs.
Keywords: Bollard pull; test and trial code; tugs; offshore support vessels; AHTs;AHTSVs; shaft power; engine MCR; instrumentation; classification societies; vesselperformance
1. Introduction
The bollard pull (BP) is the zero speed pulling/pushing capability of avessel, i.e., Tugs, Anchor Handling Tug (AHTs), Anchor HandlingTug/TowingSupplyVessel (AHTSVs), trawlers, etc. It is considered asone of the key practical performance indicators of the above-mentionedvessels,measuring the usefulness of the vessel in a stranding scenario orin holding large vessels such as tankers or towing a rig.
Such bollard pull tests (BPTs) are conducted to ensure theperformance of the vessel upon delivery. The test is witnessed in thepresence of the International Classification Societies (CS) surveyors
representing the classification society, the owners’ representativesof the vessel, engine and propeller manufacturer, representativesfrom the shipyard, and people who have partaken in the con-struction of the vessel. The BPTs have a significant impact on theperformance indicator of Tugs, AHTs, and AHTSVs.
It is so because, often, ship owners/ship operators would use thevalue of the bollard pull certification as a selling point of the vessel. Thehigher the value, the higher the weight the vessel can tow. Therefore,the value of the bollard pull becomes a key performance indicator ofthe vessel. Bollard pull is critical to ship owners/ship operators somuch, so that the value of the bollard pull is one of the contractual itemsto be met during the contractual delivery of the vessel.
However, there are no stringent rules stipulated by classificationsocieties for the conduct of a BPT. What are given is usually rec-ommended guidelines for the conduct of the test, which is not specificenough to provide a standardized and identical method of testing.
Manuscript received by JSPD Committee June 24, 2017; accepted July 20,2017.
Corresponding author: Arun Kr Dev, [email protected]; [email protected]
AUGUST 2018 JOURNAL OF SHIP PRODUCTION AND DESIGN 2492158-2866/18/3403-0249$00.00/0

Improper method of testing would result in inaccurate values ofrecording the bollard pull. Often, such values are overquoted. Onesuch possibility of bollard pull being overquoted is when during theconduct of such tests, the engine maximum continuous rating(MCR) is set to more than 100%, to obtain a higher value of bollardpull. Such scenarios might cause conflicts with operational safetysuch as the stability during towing and anchor handling. What islacking right now in the industry, is that, is the measurement of theshaft horsepower (SHP) power to establish the brake horsepower(BHP) at 100% MCR. Certain terms must be defined properly, toformulate a standardized set of BPT procedure.
Firstly, it is important to understand the general procedure of aBPTand trial. A suitable test site is chosen, which is referred to as a basin,with a bollard pull testing facility. The bollard pull testing facility iscertified to conduct BPTs and trials of up to a set value of bollard pull.
There would be two sections of the hawser: one of the sectionsconnects the bollard and the dynamometer together, and the othersection connects the dynamometer and the towing hook/towingdrum, which is attached to the towing drum and winch, onboard theTug/AHT/AHTSV.
Next, there would be different bollard pull terms used. Suchterms should also be defined appropriately (Steerprop 2001):
1) Continuous Bollard Pull—it is the sustainable static pull withthe vessel’s engines, running at the engine maker’s recom-mended MCR. The average value of the pull is taken over aspecific period, usually from 5 to 10 minutes. If the readingsare taken at 30-second intervals, the Continuous Bollard Pullis the average of all the readings over the specific period.
2) Maximum Static Bollard Pull—it will have a higher valuethan the Continuous Bollard Pull as it takes the highest valueof the period of 30-second intervals. Subsequently, thehighest average values of two consecutive periods are taken.
3) Maximum Bollard Pull—it is the single highest measuredvalue, which is achieved when the engines are running at anoverloaded condition (e.g., 110% MCR) is achieved for veryshort periods without causing damage to the engines. It issignificantly higher than the Continuous Bollard Pull andtherefore should not be referred to as the usual “Bollard Pull.”
2. Aim and objectives
There are two main aims. The article aims to assess critically theguidelines provided by different classification societies and toformulate a standardized set of general guidelines most suitable forthe marine and offshore industry.
The other is the collection of data of BPTR and to analyze thosedata to find the various aspects of bollard pull test results (BPTRs).
To achieve the purpose, the following objectives are established:
1) to define the different types of bollard pull and describe howsignificant is the bollard pull value critical in the marine andoffshore industry beingused as a functionality indicator of a vessel.
2) to list and explain the different factors, (e.g., the propeller, theaft hull shape, etc.) that affect the value of the bollard pull.
3) to compare and identify the guidelines used by the classifi-cation societies used during the conduct of a BPT and hence,listing the commonalities and differences.
4) to do a research on the comparison of the guidelines used bythe classification societies, and therefore, formulate a set of
general guidelines mostly appropriate for the marine andoffshore industry.
5) to produce a number of standard checklist documents, whichare to be used during a BPT.
6) to collect data of full-scale BPTRs and categorize those dataand analyze to see the bollard pull trend as well as an anomalyin different sets of measurements.
3. Methodology
For this subject, the targeted vessels are mostly Tugs, AHTs andAHTSVs. Such vessels go through the conduct of BPTs. Aflowchart of how the aim of “How BPTs are done?” is achieved isshown in Fig. 1.
The key factors that affect the value of the bollard pull are firstidentified. Such factors include the propulsion power and propellerdesign, aft body hull form design and nozzle design. Adjustmentsand improvements can be done to the factors during the design stageof the vessel to ensure the optimal bollard pull value.
Several recognized bodies such as International Maritime Or-ganization (IMO 1998) and International Towing Tank Conference(ITTC 2011) have their sets of guidelines, where the classificationsocieties would then make certain changes to accommodate to theirrespective classification societies.
Fig. 1 Work plan flowchart
250 AUGUST 2018 JOURNAL OF SHIP PRODUCTION AND DESIGN

Shipyard practices are also noted. Each shipyard would haveslightly different procedures as compared with the rest. Such dif-ferences might be slight, but it might be critical to the reliability ofthe accuracy of the test results.
British Ship Research Association (BSRA 1965) published aCode of Procedure for Bollard Trials of Tugs, which stated the highimportance of preparation and calibration for the test, where failureto comply would significantly affect the results of the bollard pull.
Guidelines from major CS are also obtained. Such guidelinesprovide a comparison between different classification societies. Theabove differences and similarities are tabulated in the table for easycomparison and referencing.
Noting the key factors in performing a BPT, the detailed for-mulation for each factor is done to ensure a close to an ideal test isperformed. The formulation was then compiled.
With the above steps performed, the final wording of guidelinesin the form of guidance checklist recommended for use for BPTsand trials can then be formulated accordingly so as to provide a safeyet accurate procedure for testing.
4. Definition of bollard pull
The bollard pull of a vessel is defined as the tractive force of aTug, which can be expressed in metric tonnes (tonne) or kiloNewtons (kN) (Zahalka 2012).
The test is conducted at zero forward speed; therefore, the wakeðwÞ and relative rotative efficiency ðηRÞ do not apply. It is only thethrust deduction coefficient ðtÞ that accounts for the interaction withthe hull of the vessel.
At zero forward speed, the propeller would induce high axial andtangential velocities. This results in the flow through the propellerdisc to be accelerated and thus creating a strong current, a heavyloading for the propeller and rudder.
Sometimes, the propeller may cavitate as ventilation occurs and theair is sucked in from the free surface. When this happens, the value ofthe bollard pull would, therefore, be inaccurate (ITTC 2011).
Simple rules have been used to relate the value of the bollard pullto the power installed on the vessel as estimations. Such approx-imations (Zahalka 2012) for the calculation of the bollard pull fromthe BHP of a Tug are given as
Fixed Pitch Pr opeller: ðFreeWheelingÞ ¼ BHP� 0:9� 1:10100
ðtÞ(1)
Fixed Pitch Pr opeller andKort Nozzle ¼ BHP� 0:9� 1:20100
ðtÞ(2)
Controllable Pitch Pr opeller:ðFreeWheelingÞ¼ BHP� 0:9� 1:25
100ðtÞ (3)
Controllable Pitch Pr opeller and KortNozzle
¼ BHP� 0:9� 1:40100
ðtÞ (4)
Where BHP is at 100% MCR
The values that are obtained from the above approximations areto be regarded as rough estimates. This is because, with differentpropulsion systems, a different bollard pull can be achieved, evenwith identical engines with the same installed power.
The value of bollard pull is usually used as a performance in-dicator of a particular vessel. Therefore, the initial calculation of thebollard pull of a vessel should not differ too much from the valueobtained during the full-scale test of the same vessel.
The value of bollard pull also helps 1) to calculate the preplannedtowing speed, and 2) to provide sufficient power-reserve to ensurethe safety of the tow when in unfavorable weather conditions.
5. Design factors affecting BP
The design of a Tug, AHT, and AHTSV is not only dependenton the different physical components, such as the propellers, rudders,and engines. The performance is also influenced by the interactionbetween the various elements. An example would be the interactionbetween the propeller and the nozzle.
From Fig. 2 (Nielsen 2010), it can be observed that the attainablevalue of the bollard pull heavily depends on power density. Toachieve the optimal value of the bollard pull, the value of the powerdensity should be as low as possible. To attain a low-power density,the diameter of the propeller should be designed such that it is thewidest that the vessel is able to accommodate, and it is fullysubmerged in water in ballast condition.
To achieve a high bollard pull, the vessels are usually fitted withtwin screw with ducted controllable pitch propellers. It also givesthem great maneuverability. It must also be understood that theinstalled power is not the only determinant that affects the value ofbollard pull, where factors such as an optimized propulsion systemand hull form design would also create an impact on the value of thebollard pull. Several design factors influence the value of the bollardpull which would be discussed.
5.1. Propulsion power and propeller design
The propellers are usually chosen by deciding on the power of thevessel, as the horsepower is proportional to the propeller diameter.Based on the expected operating conditions and propulsion powerof the vessel, the diameter and the blades of the propeller are thendesigned appropriately.
Fig. 2 Specific bollard pull versus power density
AUGUST 2018 JOURNAL OF SHIP PRODUCTION AND DESIGN 251

Factors such as the diameter of the propellers and r.p.m. of theshaft would affect the choice of a propulsion system used, ascavitation is a significant issue to be considered during the designof a propulsion system, specifically the propellers. For such Tugsand offshore support vessels, these are usually fitted with twinscrew propulsion systems.
Factors such as open water propeller efficiency, cavitation, andvibration of the propeller are to be considered during the design ofthe propeller. The interaction between the nozzle and propeller arealso critical during the design of the propeller. For most vessels thatrequire maximum bollard pull, the shape of the blades tends to havewider chords at the tip of the propeller’s blades, as shown in Fig. 3(Lytewater 2009).
The skew of the propeller is also a defining factor for the designof the propeller. Given the right skew angle, the noise and vibrationinduced by the propeller can be suppressed.
5.2. Aft body hull form design
The water flow to the propeller, i.e., the wake field is influencedby the aft body hull form design. The lines of the aft hull formwould, therefore, influence the thrust deduction coefficient.
t ¼ 1 � TBPTPB þ TNB
(5)
Where, t is the thrust deduction factor, TBP is the thrust of the bollardpull, TPB is the propeller thrust in behind condition, and TNB is thenozzle thrust in behind condition.
It can be seen that if the value of the thrust for the propeller andnozzle is reduced because of the thrust deduction coefficient, thiswill result in the thrust of bollard pull to be reduced too. It is causedby the interaction between the propeller and the nozzle, and the hullsurfaces near to those.
To minimize the thrust deduction factor, proper design of the afthull lines should be done. The shaft that the propeller is attached toshould also be increased to the maximum wherever possible. Itwould then reduce the value of the thrust deduction factor to aminimum.
It should be noted that the wake coefficient for the design is alsoan important factor. However, because of the conduct of the BPT atzero speed, there is no effect of wake present.
5.3. Propeller nozzle design
A nozzle is a propeller shroud encircling just outside the pro-peller’s tips. Including a nozzle in the design of the vessel would
increase the thrust produced by the propeller. The effect of thenozzle is based on the hydrodynamics effect of pressure and ve-locity, where the thrust of water that passes through the nozzle isaccelerated further.
Alignment of the nozzle during installation is also critical as itwould affect the bollard pull. Nozzle alignment requirements wouldreduce the risk of misalignment during the installation process.
6. Key factors affecting BPTs
To ensure that the vessel achieves the optimum performanceduring a BPT, several factors are to be notedwhen conducting a test.
In an ideal (imaginary) BPT (Dev 2013), the following criteriaare to be met:
1) lower and straight hawser (no sag and no angle)2) larger water depth (three to four times draught with a mini-
mum of 50m or more).3) minimal current (<0.5 knots)4) minimal wind (<0.5m/s)5) good trim and sufficient draught for propeller immersion
Therefore, the key factors that affect the BPT are then determined:
1) environment2) measurement and instrumentation3) vessel condition
The BPT is supervised by the surveyors of CS, which then certifythe vessel, the value of the measured bollard pull.
However, the guidelines of the classification societies differ invarious ways. Therefore, the comparison is made between theguidelines stipulated by the different classification societies.
The different classification societies that would be used in thecomparison later would include:
1) American Bureau of Shipping (ABS)2) Bureau Veritas (BV)3) Det Norske Veritas (DNV)4) Germanischer Lloyd SE (GL)5) Lloyd’s Register (LR)6) Registro Italiano Navale (RINA)
It is to be noted that although DNV and GL have recently mergedto form DNV-GL, the guidelines are obtained prior from individualclassification societies for comparison purposes. The comparisonsfor each factor stated above are then tabulated in a tabular form inAppendix A.
6.1. Environment
BPTs are usually conducted in areas where dock walls arepresent. With the presence of dock walls, the propeller wake fromthe propeller/s would cause a buildup of circulation. This buildup ofcirculation would result in a maximum bollard pull obtained tooearly in the course of the test, and drop when the test is prolonged.Such BPTRs obtained would not be an accurate representative ofthe service condition of the vessel, as the vessel would not remainin a particular position for such a long period of time to create such asignificant amount of circulation during operation.
To reduce the impact of circulation on the effect of the BPTRs,the position of the vessel should be placed such that it is clear of anyFig. 3 Kaplan propeller
252 AUGUST 2018 JOURNAL OF SHIP PRODUCTION AND DESIGN

walls, and the propeller wake is given a clear run. RINA (2011)recommends the vessel to be positioned at 60° in respect to the pier.An example of such position is where the wake can run to either sideof the bollard as shown at A of Fig. 4.
Results of model-tests (BSRA 1965) have shown that the in-fluence of the dock wall is reduced when the depth of water isincreased. Therefore, it should be known that the deeper the water,the results of the BPT would be more accurate. The distance be-tween the vessel’s stern and the dock wall should, therefore, beadequate if the available depth of water is limited.
Further positions for a BPT can be observed in Fig. 5.Various classification societies including DNV (2011), RINA
(2011) and GL Noble Denton (2010) further recommend that thedistance should not be less than 100 m. The additional length of thehawser should be considered as the position of the towing hook onthe vessel which would influence the total length of the hawser. Theinclination of the hawser between the bollard and the towing hookshould be kept to a minimum so that the horizontal component ofthe pull would then be measured accurately by the load cell.
BPTs are to be carried out in calmweather to reduce the effects ofcurrents and winds as this would cause errors in the measurements.However, ABS (2012) allows the possibility of using correction dueto bad weather conditions. It should not be allowed as the test wouldprovide erroneous results.
It should be noted that the maximum value is recorded when thehawser is directly over the vessel’s stern. The vessel would yaw uponthe conduct of the test, and the angle of yaw becomes excessive, itwould cause a considerable drop in the value of the pull. In such cases,the test should be repeated, with the angles of yaw recorded.
To ensure that the hawser is safe for use, it should be providedwith a certificate, stating the breaking strength, material, and otherrelevant particulars of the hawser. Attached to the hawser includesequipment such as the winch and the towing hook. Such equipmentshould also be provided with a certificate to facilitate the conduct ofthe test.
During the conduct of the BPT where the vessel starts to sheerviolently, it may cause a high pull value, in which the measuredvalues should be ignored. Then the tests need to be repeated foraccurate results.
6.2. Measurement and instrumentation
It must be noted that the conditions of the BPTs are unlikely toproduce readings that are completely steady. In this case, there is aneed to obtain mean values for analysis.
The measuring instrument can either be a mechanical or anelectrical load cell. Furthermore, the load cell must be providedwith a calibration certificate, as requested by all classificationsocieties conducting the test. It would then be ideal to provide thecalibration being performed in the horizontal position because of thenature of usage during the test. The accuracy of a load cell differs fordifferent classification societies.
An autographic recorder is to be included during the conduct of thetest, as seen in the comparison in Appendix A. The recorder wouldthen be able to produce the continuous record of the pull. It wouldmake the analysis of results more accurate. However, if it is notpossible to provide one, BV (1986) and GL Noble Denton (2010)recommend consecutive readings to be taken at 20 and 30 seconds,respectively.
The bollard pull should be taken on the vessel’s towing hook,with the load cell located either next to the towing hook or near thebollard ashore (later preferable).
If the load cell is placed near the bollard ashore, arrangementsshould bemade for themovement of the load cell for it tomove freely.It would then allow alignment between the cable and the load cell inthe event when the vessel sheers from one side to another. It would,therefore, ensure that the load cell measures only the horizontalcomponent of the pull. An example of such provision would bemounting the load cell on a trolley as shown in Fig. 6 (BSRA 1965).
It is necessary to obtain the power developed by the shaft thatcorresponds to the respective value of bollard pull. A torsion-meter should be utilized to obtain the shaft power. By adding theconsiderable losses during transmission and the shaft power, itshould give an appropriate value of the engines’ BHP @ 100%
Fig. 4 Good and bad positions for a BPT
Fig. 5 Best, good, and bad positions for a BPT
Fig. 6 Load cell mounted on trolley for alignment with cable
AUGUST 2018 JOURNAL OF SHIP PRODUCTION AND DESIGN 253

MCR, which should be at 100%. It should therefore ensure thatthe engine is running at the manufacturer’s recommended ratedpower at 100% MCR.
6.3. Vessel condition
The vessel condition is expected to be in the same conditionduring the normal operation. Therefore, the requirements compriseof conditions of the vessel during normal operation.
The condition of the vessel is also critical in the conduct of theBPT. The vessel must be evenly keeled or trimmed to intendednormal operations during the conduct of the test. It is also rec-ommended that the vessel is ballasted to the condition where it issupposed to operate.
The rudder angle must be kept to zero during the entire test, asany steering that will result in a drop is BPTRs. Equipment usedduring the test should also be the same during the use of actualservice. It must be noted that any auxiliary equipment driven by themain engine(s) or propeller shaft(s) during normal operationsshould also be connected during the test.
All classification societies require that the main engine(s) shouldbe running at a manufacturer’s recommended MCR and should notbe exceeded. ABS (2012) recommends that the engine temperaturesare maintained steady during the test.
Communication between the party onshore and the partyonboard the vessel should be present. This form of two-waycommunications should be reliable and consistent, by means ofpossibly very high frequency (VHF) radio or a telephoneconnection.
7. Analysis of BPTRs
Given that the results are recorded continuously using an au-tographic recorder, the results would be similar to the graph as seen
in Fig. 7. It can be observed that there is an initial increase in values,during the build-up of engine revolutions, followed by a periodwhere the results reach a plateau and steady, and finally a dropbecause of the circulation of water induced by the stagnant positionof the vessel.
The steady period as seen in Fig. 7 indicates that there is a re-petitive oscillations occurring. This period usually lasts from 10 to20 seconds. The oscillations aremainly caused by themovements ofthe rudder for keeping the vessel in her position.
If the test is done without an autographic recorder, continuousmonitoring should be observed, and values of the maximum andminimum pull should be recorded every 30 seconds. The values ofthe results are to be recorded in a tabular form as shown in Table 1,as part of the report. Note that the last column of the table requiresthe mean pull value for previous 10 readings, in other words, anaverage of 5 minutes is taken.
As stated by BSRA (1965), it is recommended to plot the valuesof the Mean Bollard Pull against the value of the engine revolutionssquared correspondingly, as shown in Fig. 8.
As the torque coefficient for the propeller remains constant for100% slip, the results would be proven consistent if the pointsplotted are lying approximately in a straight line, and the line shouldpass through the origin of the graph.
8. Data analysis of BPTs
To carry out various investigations about the actual BPTRs, aset of measured data (a sample of 86 numbers of tests) is used. Thelist is shown in Table 2. The names of the vessel have beenreplaced with arbitrary serial numbers. The list also shows theinstalled power in kW and the measured ahead bollard pull intonnes.
8.1. Measured data and their analysis
The purpose of data analysis of the BPTRs is to furnish someguidelines based on actual measurements on full-scale tests, whichare seldom available in literature. Such analyses and their outcomeshelp in preliminary estimation of the bollard pull of a vessel. Thedata analyses of results provide the following mainly:
1) a simple preliminary mathematical relation between the in-stalled propulsion plant and the expected bollard pull.
2) a proof of generally higher bollard pull, when the BHP isbased on engine rating (normally greater than 100% MCR)instead of establishing it through shaft power measurement.
3) an alternative mathematical relation using the specific bollardpull and the power density, which also takes into account thepropeller diameter in predicting the bollard pull.
4) a rule of thumb that 100 BHP produces a bollard pull of about1.25 tonnes is approximately verified.
Fig. 7 Graph of value of bollard pull against time
Table 1 Record of BPTRs in a tabular form
Time of day (hours, minutes, seconds)
Bollard pull (Tonnes)
Mean pull for previous 10 readingsMaximum Minimum Mean
. . . . .
254 AUGUST 2018 JOURNAL OF SHIP PRODUCTION AND DESIGN

5) the astern bollard pull is always less than the ahead bollardpull, i.e., Astern BP≈ (0.8 to 1.0) x Ahead BP for vessels withaft azimuth propulsion drives.
In Fig. 9, it has been shown that it is quite likely that the relationbetween the measured bollard pull (tonnes) and the brake power(kW) shows an excellent linear fit with r2 value almost equal to0.98 showing the slope of about 0.162. In Fig. 10, an interestingdifference is noted for the same set of data. Now the data areseparated into two groups: one data where the shaft power ismeasured to find the BHP after adding the losses in bearings,gearboxes, etc. and the other set of data is where the shaft power isnot measured; the BHP is just based on the engine rating. Thepractice of doing the latter in BPT is becoming a standard practice inmost of the shipyards in South Asia, Southeast Asia, and East Asia.There could be a euphoric agenda here among all parties to achieve amaximum bollard pull number (gimmick or illusion) on the cer-tificate. The BHP rating is used as 100% MCR, but in reality, it ismuch higher almost in the range of around 104–106% MCR.Surprisingly, the CS is not taking any serious note of it. The authorcannot understand how one can calculate 100% MCR withouthaving a proper shaft power measurement device. There are twomain reasons for not doing it. The first reason is to save the cost ofhiring a consultant to set up the shaft power measurement system,and the second reason is to achieve a so-called 100% MCR BHP.However, the industry is bit naı̈ve without understanding the far-reaching implications of such a bollard pull number which willnever be able to achieve in reality. Such practice of BPTs withoutshaft powermeasurement must not be accepted by any classificationsociety so as not to jeopardize the operational safety of the vessel.
Figures 11 and 12 show the specific bollard pull (the bollard pullmeasured in kg divided by the total installed BHP in kW) as afunction of power density (the installed BHP divided by the discarea of the propeller connected to the engine or a pair of engines).These graphs were produced to see the similar trend as shown inFig. 2. Although Figs. 9 and 10 could give an indication of bollardpull based solely on the installed BHP, Figs. 11 and 12 will bemore relevant and practical to use because it will take into accountthe effects of the propeller diameter along with the installed poweron the expected bollard pull. It could be a better way of pre-liminary estimation of the bollard pull of a vessel. The author
himself has experienced before. Once for an AHTSV, there shouldhave been an easy target of getting 70 tonnes out of 5916 BHP, butit was a problem because the propeller diameter was not suitablerather undersize. An increase of another 100 mm would have abetter sign, but sometimes, the commercial people do not listen tosave cost and invite unnecessary risks.
It is more or less an industry practice in bollard pull com-munity that for a given power in BHP with an appropriatelydesigned propeller, 100 BHP produces a bollard pull of about1.25 tonnes, i.e., a standard bollard pull coefficient (t/100HP)(BPC100) as 1.25 t/100HP. Based on the collected data, one of theanalyses was done to verify this standard practice/rule of thumb.From Fig. 13, it is clearly seen that after analyzing all data; the
Fig. 8 Graph of mean bollard pull against R.P.M.2
Table 2 List of vessels, bollard pull and installed power in kW
Number Col. 1 Col. 2 Number Col. 3 Col. 4
1 40.2 2240 44 156.0 90002 49.2 2998 45 124.0 81203 49.2 2998 46 124.0 81204 51.5 2998 47 81.7 49205 49.5 3132 48 122.0 81206 49.4 3132 49 56.6 37307 51.0 3000 50 125.0 81208 51.9 3000 51 124.0 81209 35.8 2090 52 45.3 264610 198.0 13440 53 45.3 264611 35.6 2500 54 99.4 594012 213.0 13440 55 101.0 594013 212.0 13440 56 177.0 1104014 98.0 5850 57 63.2 528015 211.0 13440 58 178.0 1104016 209.0 13440 59 135.0 800017 61.5 3700 60 142.0 792018 60.4 3700 61 135.0 800019 98.7 5850 62 113.0 594020 212.0 13440 63 139.0 792021 61.3 3700 64 44.8 264622 68.0 4924 65 43.1 264623 66.8 4140 66 141.0 792024 64.9 4140 67 140.0 800025 68.2 4140 68 143.0 792026 52.6 3530 69 135.0 800027 166 9840 70 50.8 299828 45.5 2646 71 51.5 299829 46.3 2646 72 110.0 697230 158.0 9840 73 150.0 900031 100.0 6400 74 150.0 900032 72.0 5372 75 141.0 792033 141.0 9000 76 126.0 819034 159.0 8700 77 60.1 528035 45.5 2646 78 63.2 528036 45.0 2646 79 135.0 792037 135.0 8000 80 162.0 1073638 45.6 2646 81 112.0 594039 44.8 2646 82 25.6 242440 136.0 8000 83 68.9 400041 71.4 4414 84 71.2 400042 72.8 4414 85 110.0 594043 43.5 2646 86 156.0 9000
Col. 1 and Col. 3 ¼ ahead bollard pull in tonnes.
Col. 2 and Col. 4 ¼ installed brake power in kW.
AUGUST 2018 JOURNAL OF SHIP PRODUCTION AND DESIGN 255

mean curve is somewhat less than 1.25 tonnes per 100HP line (redcolor), i.e., a BPC100 of 1.21 tonnes/100HP. The measured data areagain found above and below the datum line of 1.25 tonnes per 100HP.Hence, in Fig. 14, two lines were then drawn for data greater than 1.25tonnes and for data less than 1.25 tonnes. These two lines nowprovide a reasonable range of the estimated bollard pull roughly be-tween BPC100 of 1.21 to 1.27 tonnes per 100HP which result in anaverage of BPC100 as 1.24 tonnes per 100HP. So, the industry thumbrule/practice of using 1.25 tonnes per 100HP is somehow a justifiedvalue. In these two graphs, the author did not separate the bollard pullmeasured data based onwhether the shaft horse powermeasured or notduring the BPT.A larger data samplewill onlymake all these statisticalforecasts more accurate predictions.
In Figs. 15 and 16, some results of ahead and astern bollard pullmeasured data have been analyzed. From Fig. 15, it is observedthat the measured astern bollard pull is always less than the aheadbollard pull except a few data where some opposite trends arenoted. There could be some other reasons for having such fewdiscrepancies. The astern bollard pull is always less than the aheadbollard pull except for thrusters which are below the baselinewhere both ahead and astern pull should always be the sametheoretically as there is hardly any thrust deduction factor, e.g.,for a tractor tug with two azimuth thrusters in front of the tugbelow the hull.
In Fig. 16, again the ratio of astern bollard pull to ahead bollardpull has been shown. It should remain theoretically below or equal
Fig. 9 Ahead bollard pull versus BHP at 100% MCR
y = 0.0158xy = 0.0166x
0
50
100
150
200
250
0 3,000 6,000 9,000 12,000 15,000
Bolla
rd P
ull (
tonn
es)
Brake Horse Power (kW)
Ahead BP vs BHP @ 100% MCR
BHP based on Measured Sha� Power BHP based on Engine Ra�ng
Linear (BHP based on Measured Sha� Power) Linear ( BHP based on Engine Ra�ng)
Fig. 10 Ahead bollard pull versus BHP at 100% MCR
256 AUGUST 2018 JOURNAL OF SHIP PRODUCTION AND DESIGN

to 1 but because of discrepancies in some measured data, somevalues are seen to be more than 1. It is clearly observed that theratio varies from 0.8 to 1. For vessels, mainly tugs with azimuthstern drive, the value will be close to 1 if most of the thruster isbelow the baseline. However, if the thruster is above the baseline,the astern pull will be less and can be said around 0.8 times theahead bollard pull. For vessels like AHTSVs, the astern bollardpull is almost 0.4 times the ahead bollard pull. It is mainlybecause of Controllable Pitch Propeller (CPP) propulsion withrudders behind.
9. Discussion
Upon comparison of the guidelines of the stated classificationsocieties, critical parts of the rules are identified. The tabulatedcomparison of the directives/guidelines can then be found in Ap-pendix A. The adoption and formulation of the standardized set ofBPT code is found in Appendix B
A typical BPTR should then be provided to certify the vessel ofthe bollard pull value. Critical information and particulars are to beprovided in the report. A set of recommended format is provided inAppendix C. The report is to be attached with the various formsused by the surveyors to record data during the test.
Required documents such as calibration certificate of the load celland engine manufacturer recommendations for 100%MCR are alsoto be attached with the report upon submission to a classificationsociety for verification.
Forms are created to provide convenience for surveyors forconducting the test. These forms can be found in Appendix D and E,where the forms are to be used for the engineers/surveyors onshoreand on board the vessel, respectively.
Results have also shown that using a general rule to link the valueof bollard pull to installed power would be very much inaccurate. Itis because even with identical propulsion systems, vessels withdifferent hull lines and propeller geometry would result in signif-icant bollard pull results.
It is possible to estimate bollard pull, using numerical calcula-tions or even model-testing, regardless of its accuracy. However,verifying the values of bollard pull is only certifiable by theclassification societies by the means of full-scale testing.
To provide fair testing results, a uniform set of rules is to beused throughout all classification societies. In this connection,International Association of Classification Societies (IACS) canplay a major role. Bollard pull is a performance very muchrelated to the safety of operation like towing, anchor handling,etc. A wrong (misleading) bollard pull number on a certificate
Fig. 11 Ahead bollard pull versus power density at 100% MCR BHP
Fig. 12 Ahead bollard pull versus power density at 100% MCR BHP
AUGUST 2018 JOURNAL OF SHIP PRODUCTION AND DESIGN 257

can lead to a potential danger in real operational life of thevessel.
It is a practice for companies that conduct BPTs to use correctionsupon experiencing poor weather conditions. However, such cor-rections are not allowed and would result in an inaccurate value ofbollard pull. Therefore, this should not be allowed as it wouldcompromise the stability of the vessel if the vessel were to operatebeyond its capability. It would result in a breach of operationalsafety leading to unnecessary risks.
The data analysis of the regular BPTs indicates that some of theindustry practices are entirely valid. It also suggests that conducting atest without the shaft power measurement and alternatively setting a100% MCR number based on engine rating is either a gimmick or an
illusion to the parties involved. The truth is that such bollard pullnumber on a CS certificate is entirely not factual. The shipyard, theowner and the CS surveyor should exercise a right spirit of accuracyand quality in conducting/witnessing such an important test whichshould establish an unbiased fact (reality).
10. Conclusions
Directives/guidelines are being provided across most notableclassification societies.
However, it has been observed that the guidelines as recom-mended in the CS’s guidelines are not as definitive as it should be. Itmight thus cause the results of the bollard pull to be erroneous.
BPC100 = 1.2107
BPC100 = 1.2738
0.50.60.70.80.9
11.11.21.31.41.5
0 10 20 30 40 50 60 70 80 90 100
Ahea
d Bo
llard
Pul
l Coe
ffici
ent (
tonn
es/1
00H
P)
Number of Bollard Pull Tests (-)
Ahead BP Coefficient @100% MCR
<1.25 tonnes per 100HP >1.25 tonnes per 100HP
1.25 tonnes per 100HP Linear (<1.25 tonnes per 100HP)
Linear (>1.25 tonnes per 100HP)
Fig. 14 Ahead bollard pull coefficient at 100% MCR BHP
Fig. 13 Ahead bollard pull coefficient at 100% MCR BHP
258 AUGUST 2018 JOURNAL OF SHIP PRODUCTION AND DESIGN

Therefore, it is necessary to ensure a standardized procedure toprovide a true (fact) value of BPT. In turn, it would be a fairfunctionality indicator for vessels which are required to undergo theBPT and trial.
The literature related to the subject also revealed the importanceof conducting the BPT to obtain full-scale results. It would providethe ship owners with a form of verification during the delivery of thevessel.
As much as model-testing and the numerical solution canprovide a kind of an answer, it is unable to simulate the full-scaleenvironment. Therefore, it is safe to assume that BPT on a full-scalebasis would then be most accurate to act as a functionality indicatorfor Tugs, AHTs, and AHTSVs.
It is also to be noted that there are several similarities and, moreimportantly, differences, in the directives/guidelines of the different
classification societies. One significant difference would be thevalues of accuracy required by the classification societies for thecalibration of the load cell.
If possible, and feasible, the standardized code of procedureshould be recommended to classification societies. With the uni-form application of proceedings during the conduct of bollard pull,it is possible to create a fair environment for the certification for allBPTs for all types of vessels.
Most importantly, operational safety can also be assured if theconduct of the BPT is carried out appropriately, on a yearly basis.
Acknowledgment
The present work benefited from the input of Mr. Ong Hing Hui,Past BEng student at Newcastle University, who has done his final
Fig. 16 Ratio of astern and ahead bollard pull at 100% MCR BHP
Fig. 15 Measured ahead and astern bollard pull at 100% MCR BHP
AUGUST 2018 JOURNAL OF SHIP PRODUCTION AND DESIGN 259

year project on a similar topic. The author is also grateful toMr.WeiGan, an ex-student of the University of Western Australia forcompiling all the measured BPTs’ data and produce initial graphsunder the constant supervision of the author for almost 3 months.The author is also grateful to his classmate Mr. Makaraksha Sahahelping to create the final graphs and review the article with somecomments.
References
ABS. 2012 Part 5: Specialised Vessels and Services’, Rules for Building andClassing; Steel Vessels Under 90 Meters (295 Feet) in Length, Houston, TX:American Bureau of Shipping.
BSRA. 1965 Code of Procedure for Bollard Trials of Tugs, Report No. 366,London, SE1, UK: The British Shipbuilding Research Association.
BV. 1986 Bollard Pull Measurement and Certification, Paris, France: BureauVeritas.
DEV, A. K. 2013 Bollard Pull Test Result: Is it a fact or a gimmick or anillusion? What is then the reality? Public Lecture, Singapore.
DNV. 2011 Newbuildings Special Service and Type - Additional Class; OffshoreService Vessels, Tugs and Special Ships, Hovik, Norway: Det Norske Veritas.
GLNOBLE DENTON. 2010 Guidelines for the Approval of Towing Vessels, Hovik,Norway: Det Norske Veritas.
IMO. 1998 Guidelines for Safe Ocean Towing, MSC/Circ.884, London SE17SR, UK: International Maritime Organization.
ITTC. 2011 ‘Propulsion/Bollard Pull Test’, Recommended Procedures and Guide-lines, Americas, Europe, Asia and Pacific: International Towing Tank Conference.
LYTEWATER, M. P. L. 2009 Kaplan Propeller. www.lytewatermarine.com/commercial-marine-propellers/marine-propellers-kaplan.
NIELSEN, J. R. 2010 Optimising Propulsion Systems for AHTS Vessels,Offshore & Marine Technology, 2, 10–13.
RINA. 2011 Rules for the Certification of the Bollard Pull of Tugs, Genoa, Italy:Registro Italiano Navale.
STEERPROP. 2001 Bollard Pull Trial Code For Tugs with Steerprop Propulsors,Rauma, Finland: Steerprop Ltd.
ZAHALKA, C. P. 2012 Bollard Pull, Hamburg, Germany: Association ofHanseatic Marine Underwriters.
260 AUGUST 2018 JOURNAL OF SHIP PRODUCTION AND DESIGN
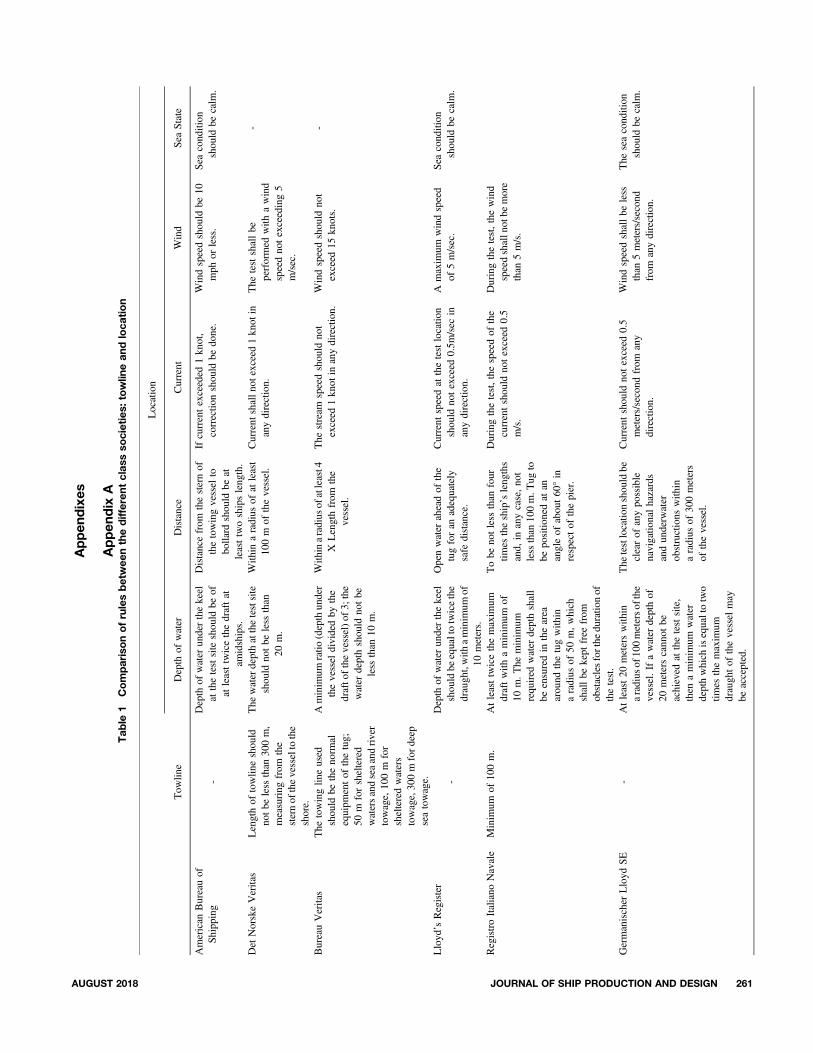
Appen
dixes
Appen
dix
ATab
le1
Comparisonofrulesbetwee
nthedifferen
tclas
sso
cieties:
towlin
ean
dloca
tion
Tow
line
Location
Depth
ofwater
Distance
Current
Wind
Sea
State
American
Bureauof
Shipp
ing
-Depth
ofwater
underthekeel
atthetestsite
should
beof
atleasttwicethedraftat
amidships.
Distancefrom
thesternof
thetowingvessel
tobo
llard
shou
ldbe
atleasttwoshipslength.
Ifcurrentexceeded
1kn
ot,
correctio
nshould
bedo
ne.
Windspeedshou
ldbe
10mph
orless.
Sea
condition
should
becalm
.
Det
NorskeVeritas
Lengthof
towlin
eshould
notbe
less
than
300m,
measuring
from
the
sternof
thevesseltothe
shore.
The
waterdepthatthetestsite
should
notbe
less
than
20m.
With
inaradius
ofat
least
100m
ofthevessel.
Current
shalln
otexceed
1kn
otin
anydirection.
The
testshallbe
performed
with
awind
speedno
texceeding5
m/sec.
-
BureauVeritas
The
towinglin
eused
should
betheno
rmal
equipm
entof
thetug;
50m
forsheltered
watersandseaandriver
towage,
100m
for
shelteredwaters
towage,30
0m
fordeep
seatowage.
Aminim
umratio
(depthunder
thevessel
dividedby
the
drafto
fthevessel)of
3;the
water
depthshould
notbe
less
than
10m.
With
inaradius
ofatleast4
XLengthfrom
the
vessel.
The
stream
speedshould
not
exceed
1kn
otin
anydirection.
Windspeedshou
ldno
texceed
15kn
ots.
-
Lloyd’s
Register
-Depth
ofwater
underthekeel
shouldbe
equaltotwicethe
draught,with
aminim
umof
10meters.
Openwater
aheadof
the
tugforan
adequately
safe
distance.
Current
speedat
thetestlocatio
nshould
notexceed
0.5m
/sec
inanydirection.
Amaxim
umwindspeed
of5m/sec.
Sea
condition
should
becalm
.
RegistroItaliano
Navale
Minim
umof
100m.
Atleasttwicethemaxim
umdraftwith
aminim
umof
10m.The
minim
umrequ
ired
water
depthshall
beensuredin
thearea
arou
ndthetugwith
inaradius
of50
m,which
shallbe
kept
free
from
obstaclesforthe
duratio
nof
thetest.
Tobe
notless
than
four
times
theship’sleng
ths
and,
inanycase,no
tless
than
100m.T
ugto
bepositio
nedat
anangleof
abou
t60
°in
respectof
thepier.
Duringthetest,thespeedof
the
currentshou
ldno
texceed
0.5
m/s.
Duringthetest,thewind
speedshallnotbe
more
than
5m/s.
Germanischer
Lloyd
SE
-Atleast20
meterswith
inaradius
of10
0metersofthe
vessel.Ifawater
depthof
20meterscann
otbe
achieved
atthetestsite,
then
aminim
umwater
depthwhich
isequaltotwo
times
themaxim
umdraughtof
thevessel
may
beaccepted.
The
testlocatio
nshouldbe
clearof
anypo
ssible
navigatio
nalhazards
andunderw
ater
obstructions
with
inaradius
of30
0meters
ofthevessel.
Current
shou
ldno
texceed
0.5
meters/second
from
any
direction.
Windspeedshallbe
less
than
5meters/second
from
anydirection.
The
seacond
ition
should
becalm
.
AUGUST 2018 JOURNAL OF SHIP PRODUCTION AND DESIGN 261

Table 2 Comparison of rules between the different class societies: vessel
Vessel
Trim Vessel Condition Machinery Engine(s)
American Bureau ofShipping
Even keeled or trimmed tointended operatingconditions.
Normal Ballast Condition, butno required to be down tosummer load line. -
Engine(s) should not beadjusted to operate inoverload conditions.Engine temperatures shouldbe at steady state during testrun at MCR (certifiedhorsepower per records).
Det Norske Veritas At even keel or at a trim bystern not exceeding 2% ofvessel length.
The vessel shall be at fullballast and half fuelcapacity.
Propeller(s) fitted whenperforming the test shall be thepropeller(s) used when thevessel is in normal operation.All auxiliary equipment drivenby the main engine(s) orpropeller shaft(s) should be inoperation during the test.
Shall be run at manufacturer’srecommended MCR.
Bureau Veritas Should not exceed 4% ofvessel’s length and inaccordance with normaloperating conditions of thevessel.
The vessel should be in fullballast and fuel capacity.
The propeller(s) and nozzle(s)fitted during the test should bethose fitted during normaloperation. All auxiliaryequipment driven by the mainengine(s) or propeller shaft(s)should be in operation duringthe test.
The maximum continuousoutput recommended by themanufacturer of the mainengine should not beexceeded during the tests.
Lloyd’s Register Comply with the intendedoperating trim.
Comply with the intendedoperating ballast condition.
All outfits must be in goodcondition and capable ofexerting/ withstanding a load ofnot less than two times theanticipated Maximum BollardPull. It is then assumed that allequipment will be part of thetug’s normal outfit. Propellersfitted when performing the testsshould be those used duringnormal service.
The maximum continuousoutput recommended by themanufacturer of the mainengine should not beexceeded during the tests.
Registro Italiano Navale Even keel condition witha maximum stern trim notgreater than the 2% of thevessel’s length.
Heavy ballast condition withthe fuel tanks filled to atleast 50% of their capacity.
Equipment used during the test isto be part of the actual tugequipment during normalservice. All auxiliarymachinery driven by the mainpropulsion engine(s) or by theshafting line(s) during normalservice are to be kept inoperation throughout the trial.
Shall be kept at themanufacturer’srecommended maximumcontinuous rating, on thebasis of which theclassification of the tug hasbeen requested, throughoutthe BPT.
Germanischer Lloyd SE As close as possible to thedraught and trim undernormal operatingconditions.
As close as possible to theballast conditions undernormal operatingconditions.
All the propellers and fuelinstalled and used during thetest are to be the same as thoseused during intended operatingconditions. All auxiliaryequipment driven by the mainengine(s) or propeller shaft(s)should be in operation duringthe test.
Shall be kept at the enginemanufacturer’srecommended maximumcontinuous rating (100%MCR) of the main engines,for a period of 10 minutesfor continuous bollard pull,110% MCR for 5 minutesfor a maximum BPT.
262 AUGUST 2018 JOURNAL OF SHIP PRODUCTION AND DESIGN

Table 3 Comparison of rules between the different class societies: instrumentation
Instrumentation
Load Cell Calibration Continuous read-outs Position of Load Cell Communications
American Bureauof Shipping
Fitted with swivels andtorque insensitive.Maximum scalereading should bea minimum or equal to[Max. Cont. Total H.P.X 50 (LBS.)]
Should be calibratedand suitable for usein the horizontalposition.
-
Should be located at theashore end of the towhawser.
A two-way voicecommunicationshould be providedbetween the vesseland shore station
Det Norske Veritas Load cell used for the testshall be approved byDNV
Calibrated for at leastonce a year. Theaccuracy of the loadcell shall be �2%within a range of�10°C to þ40°Candwithin the rangeof 25 and 200tonnes tension.
The instrument givinga continuous read-out alsoa recording instrumentrecording the bollard pullgraphically as a function oftime shall both beconnected to the load cell.
Load cell shall be fittedbetween the eye of thetowline and the bollard.
A communicationsystem shall beestablished betweenthe vessel and theperson(s)monitoring ashore,bymeans of VHF ortelephoneconnection.
Bureau Veritas Other methods ofmeasurement forinstance based on thereadings on winchequipment (tensionindicator, pressuregauge) may be acceptedsubject to compliancewith accuracyrequirements.
The cumulatedaccuracy of all themeasuringequipment is 5%withina temperature rangeof�20°C toþ40°C
Continuous read-outs anda recording of the bollardpull are recommended. Ifnot possible, readings aretaken every 30 seconds.
-
Recommended to haverecordingequipment ashore,and a reliabletelecommunicationsystem.
Lloyd’s Register Should producecontinuous readout innumerical andgraphical form. Theinstrument should becalibrated before eachapplication by theSociety or any otherrecognized authority.
Expected accuracy tobe within �2%.
The recordings of thedynamometer should becoupled with the recordingsof the main engine outputand shaft revolutions. Thedynamometer could be ofthe form of mechanical loadgauge or an electric loadcell.
Incorporated within thetowing wire system, belocated at the shore lineor on the tug.
-
Registro ItalianoNavale
The use of electric loadcell type measuringinstruments isrecommended insofaras they can beconnected to therecording equipmenteasily
Of not more than12 months beforethe date of the BPT.In temperaturesbetween 0 andþ40°C. Maximumdeviation from thenominal value is notmore than �2%
Shall be able to providea continuous reading of thetug pull and record thevalues measured either indigital format or by meansof a graph.
Connected directly to thetowline. Placed inproximity to the towinghook (on board) or tothe pier bollard(ashore).
Necessary to providean efficient two-waycommunicationsystem between thetug and the shorepersonnelresponsible formonitoring the pullmeasurements.
GermanischerLloyd SE
The calibration certificateof the load cell shouldbe provided prior thetest date.
Calibration must beless than 6 monthsbefore the test.Accuracy of �2%for the averagetemperatureobservedthroughout the test.
An autographic recordinginstrument that givesa continuous read-out of thebollard pull should beconnected to the load cell.Otherwise, the bollard pullis then the average value ofthe subsequent readings,recorded every 20 secondsintervals over the testperiod.
- -
AUGUST 2018 JOURNAL OF SHIP PRODUCTION AND DESIGN 263

Appendix C
BPTR
Project number: click here to enter a number. certificatenumber: click here to enter a number.Choose an item. “Enter Vessel Name.”
This is to certify that the undersigned Marine Surveyor did onClick here to enter a date attend the Choose an item. “Enter VesselName.”, IMO No. Enter IMO number., of Enter Ship Owner(s) asthe vessel stay afloat in the Enter Test Venue relative to a BPT and toreport as follows:
The vessel’s propulsion equipment consists of Enter No. of Engine(s)/EngineMaker. engine(s),Model EnterModelNumber. developing acombined output of Enter output in B.H.P.B.H.P (Enter Output in kW.kW) at Enter R.P.M. R.P.M. Each engine drives through a Enter Brandof Propulsion System. Model Enter Model of Propulsion System ofReduction Gear Ratio Enter Reduction Gear Ratio.
At the time of this BPT, there Choose Number of Surveyors.Surveyor(s) (Name of Surveyor) on the Choose Type of Vessel andChoose Number of Surveyors. Surveyor(s) (Name of Surveyor)with the Load Cell Operator.
The BPT was conducted at Start Time/ nd Time hours inthe ahead direction and Start Time/End Time hours in theastern direction. The conditions for the bollard pull were as follows:
Appendix B
BPT guidance checklistProject number: click here to enter a number. Certificate number: click here to enter a number
Description Yes No
1. General ☐ ☐
a. A proposed test program shall be submitted b the testing. ☐ ☐
b. The safe working load (SWL) shall not be less than 10% of the vessel’s designed value of the maximum static bollard pull for every testequipment, fittings and any connection points ashore.
☐ ☐
c. All machinery/equipment shall be approved by a competent body/bodies. All documents including relevant information regarding thevessel, machinery and equipment’s certification, etc. shall be prepared and submitted to the relevant body/bodies responsible forconducting the BPT.
☐ ☐
d. Before the test, ensure the documents addressed in item c. above shall be received by the relevant body/bodies conducting the BPT. ☐ ☐
2. Locationa. The water depth at the test location shall be at 3 to 4 times the vessel draught, with a minimum of 50 meters, within a radius of 100meters
from the vessel.☐ ☐
b. The test location shall be clear of navigational hazards and underwater obstructions such as submerged pilings, bulwarks, etc. withina radius of 300 meters from the vessel.
☐ ☐
c. The current shall be less than 0.5 meters/second from any direction. ☐ ☐
d. The wind speed shall be less than 5 meters/second from any direction. ☐ ☐
e. The conditions of the sea at the test location shall be calm, and must be of no swell or waves. ☐ ☐
3. Vessela. The vessel’s draught and trim shall be as near as possible to that of normal operating conditions. ☐ ☐
b. The propellers and fuel used for the test shall be the same used for normal operating conditions. ☐ ☐
c. Anymachinery or equipment driven by the main engine(s) or propeller shaft(s) during normal operations of the vessel must be connectedthroughout the entire period of the test
☐ ☐
4. Test ☐ ☐
a. Themeasured distance between the stern of the vessel and the bollard onshore must be at least 300meters. This distance is also the lengthof the hawser used for the test.
☐ ☐
b. An adequate two-way voice communication system shall be established between the vessel and the shore station, where themonitoring ofthe load cell is done.
☐ ☐
c. The Continuous Bollard Pull test shall be carried out at the main engine(s)’ recommended manufacturer’s maximum continuous rating(100%MCR), for a period of 10 minutes, with the vessel maintaining on a fixed course. The value of the continuous bollard pull is thenthe average reading for the period of 10 minutes.
☐ ☐
d. The Maximum Bollard Pull test should then be carried out at the manufacturer’s maximum rating (typically 110% MCR) of the mainengines, for the period of 5 minutes.
☐ ☐
f. An autographic recording instrument giving a continuous read-out and a recording instrument recording the bollard pull graphically asa function of time should be both connected to the load cell. The instruments shall (if possible) be placed and monitored ashore.
☐ ☐
g. A torsionmeter shall be installed to correlate the value of shaft power to the value of bollard pull to verify the consistency of the results. ☐ ☐
h. The load cell should be fitted between the eye of the hawser and the bollard. ☐ ☐
i. The figure certified as the vessel’s continuous bollard pull shall be the towing force recorded as beingmaintained without any tendency todecline for duration of not less than 10 minutes at 100% MCR.
☐ ☐
264 AUGUST 2018 JOURNAL OF SHIP PRODUCTION AND DESIGN

A Model Enter Model of Load Cell with Enter Load Rangecapacity, calibrated on Click here to enter a date was used. EnterCompany for Indicator. provided a computerized indicator withrecording/printing capabilities.
It is hereby certified that the vessel under the conditions describedover, exerted a Continuous Bollard Pull of Enter Bollard Pulltonnes over a minimum period of 10 minutes. It is also certified thatthe Maximum Bollard Pull of Enter Bollard Pull tonnes over aperiod of 5 minutes.
The BPT was witnessed, and this report prepared withoutprejudice as to rights and/or interests of whom it may concern.
Environmental conditions Ship condition
Wind/Direction Knots kts/Direction Draught forward Click here to enter text. mCurrent/Direction Knots kts/Direction Draught aft Click here to enter text. mWater depth Click here to enter text. m Draught amidships Click here to enter text. m
Equipment particularsMain hawser ength Click here to enter text. m Breaking load Click here to enter text. tonnesSpare hawser length Click here to enter text. m Breaking load Click here to enter text. tonnesWinch rated pull Click here to enter text. Winch brake Click here to enter text.
AUGUST 2018 JOURNAL OF SHIP PRODUCTION AND DESIGN 265

266 AUGUST 2018 JOURNAL OF SHIP PRODUCTION AND DESIGN

AUGUST 2018 JOURNAL OF SHIP PRODUCTION AND DESIGN 267

268 AUGUST 2018 JOURNAL OF SHIP PRODUCTION AND DESIGN


![EXECUTIVE SUMMARY - TUGS...Bollard pull ahead 65.4 ton Bollard pull astern 61.5 ton Speed ahead 12.7 knots Speed astern 12.2 knots Class LR 100 A1 Tug [ ] LMC UMS IWS TUGS ASD TUG](https://static.fdocuments.us/doc/165x107/5e78e85c135f044b6b43c95c/executive-summary-tugs-bollard-pull-ahead-654-ton-bollard-pull-astern-615.jpg)