Predicting Main Dimensions of Tug Boats Basing on Bollard Pull · Predicting Main Dimensions of Tug...
7
Predicting Main Dimensions of Tug Boats Basing on Bollard Pull Stephen Chidozie Duru 1 , Bawo Dominic Dumka 2 . 1 Head, Department of Marine Engineering, Niger Delta University, Amassoma, Bayelsa State, Nigeria. 2 Department Head, Hse – Agip Energy and Natural Resources Ltd, Port Harcourt, Nigeria Abstract The pull force a tugboat can exact when tied to an immovable pie bollard is termed the bollard pull, this is the maximum pull force she is designed to exact on her towing work. This force depends on the size dimensions, hull shape and design of her propulsion machinery. This work is a correlation analysis between the main dimension variables and bollard pull is carried out to obtain useful formulas for the design of future tug boats basing on optimum bollard pull. This analysis is based on a collation of world existing tug boat parameters shown in the paper. An appraisal example computation is also presented to show the method and validity of the derived formulas.. Keywords — Tugboat, bollard pull, regression, formulas, main dimensions. I. INTRODUCTION The bollard pull is the force a tug boat require to pull the ship or other marine equipment she is towing. It is classified into maximum bollard pull bpmax, steady bollard pull bps and sustained bollard pull bp, corresponding to force of the propulsion machinery running at maximum (for one minute) , nominal (five minutes), and 78 to 80 percent of nominal power of the main engine of the tug boat respectively. Measurement of the bollard pull is done by tethering the tug boat from her towing hook to a force measuring instrument and to the pier side bollard before the running of the propulsive machinery under calm sea condition see fig 1 below, FIG 1 Bollard test arrangement Bollard pull bp is expressed by various authorities namely [1], [2], [3], [4] show that bp = TT(1-t) - - - - - - - - - - - - - - - - - - (1) TT = f(Do,η pp ,PD) - - - - - - - - - - - - - - -(2) Where, η pp = η O / η i - - - - - - - - - - - -(3) t = t 1 ( , CB) + t 2 (Hull form) + t 3 (Do/L)- -(4) Where, TT = propeller Bollard thrust t = Thrust deduction factor Do = propeller nozzle diameter ηpp = propeller pump effiency PD = Delivered power (kw) η O =propeller open water efficiency η i = propeller ideal efficiency B = breadth of the tugboat at midships CB = block coefficient of tugboat L = length of the tugboat t 1 , t 2 , t 3 , functions of thrust deduction fraction. These are well known. In this work, however, the correlation analysis is on the B, D, T, P/L, P/B, P/D, LB, DT, P/T, LBD, LBT, P, and √L/B2 as independent variable and bp as independent variable. Where: P = Main engine Power (hp) D = Depth T = Design draft So far the correlation analysis of the main dimensions and the bollard pull bp of tug boats have not been investigated for the purpose of determination of main dimensions of projected tug boat. The result of this analysis will aid the prediction of main dimensions of projected tug boats at early design stage. This will also help in the purchase or hire of tug boats for tow or push contracts as the main dimensions of the tug can be estimated knowing the total resistance of the towed vessels. II. MATERIAL AND METHOD The data shown in Table 1 is a short part of 365 tug boat particulars collected (the sample sizes are shown in Table 2) for each of the regression analysis. These data are obtained from the internet adverts of various companies such as in [5], [6],[7], and others.
Transcript of Predicting Main Dimensions of Tug Boats Basing on Bollard Pull · Predicting Main Dimensions of Tug...

Predicting Main Dimensions of Tug Boats
Basing on Bollard Pull
Stephen Chidozie Duru1, Bawo Dominic Dumka 2. 1Head, Department of Marine Engineering, Niger Delta University, Amassoma, Bayelsa State, Nigeria.
2Department Head, Hse – Agip Energy and Natural Resources Ltd, Port Harcourt, Nigeria
Abstract
The pull force a tugboat can exact when tied to
an immovable pie bollard is termed the bollard pull,
this is the maximum pull force she is designed to
exact on her towing work. This force depends on the
size dimensions, hull shape and design of her
propulsion machinery. This work is a correlation
analysis between the main dimension variables and
bollard pull is carried out to obtain useful formulas
for the design of future tug boats basing on optimum
bollard pull. This analysis is based on a collation of
world existing tug boat parameters shown in the
paper. An appraisal example computation is also
presented to show the method and validity of the
derived formulas..
Keywords — Tugboat, bollard pull, regression,
formulas, main dimensions.
I. INTRODUCTION
The bollard pull is the force a tug boat require to pull
the ship or other marine equipment she is towing. It
is classified into maximum bollard pull bpmax, steady
bollard pull bps and sustained bollard pull bp,
corresponding to force of the propulsion machinery
running at maximum (for one minute) , nominal (five
minutes), and 78 to 80 percent of nominal power of
the main engine of the tug boat respectively.
Measurement of the bollard pull is done by tethering
the tug boat from her towing hook to a force
measuring instrument and to the pier side bollard
before the running of the propulsive machinery under
calm sea condition see fig 1 below,
FIG 1 Bollard test arrangement
Bollard pull bp is expressed by various authorities
namely [1], [2], [3], [4] show that
bp = TT(1-t) - - - - - - - - - - - - - - - - - - (1)
TT = f(Do,ηpp,PD) - - - - - - - - - - - - - - -(2)
Where, ηpp = ηO/ ηi - - - - - - - - - - - -(3)
t = t1(𝐵
𝐿, CB) + t2(Hull form) + t3(Do/L)- -(4)
Where,
TT = propeller Bollard thrust
t = Thrust deduction factor
Do = propeller nozzle diameter
ηpp = propeller pump effiency
PD = Delivered power (kw)
ηO =propeller open water efficiency
ηi = propeller ideal efficiency
B = breadth of the tugboat at midships
CB = block coefficient of tugboat
L = length of the tugboat
t1, t2, t3, functions of thrust deduction fraction.
These are well known.
In this work, however, the correlation analysis is
on the B, D, T, P/L, P/B, P/D, LB, DT, P/T, LBD,
LBT, P, and √L/B2 as independent variable and bp as
independent variable.
Where:
P = Main engine Power (hp)
D = Depth
T = Design draft
So far the correlation analysis of the main
dimensions and the bollard pull bp of tug boats have
not been investigated for the purpose of determination
of main dimensions of projected tug boat. The result
of this analysis will aid the prediction of main
dimensions of projected tug boats at early design
stage. This will also help in the purchase or hire of
tug boats for tow or push contracts as the main
dimensions of the tug can be estimated knowing the
total resistance of the towed vessels.
II. MATERIAL AND METHOD
The data shown in Table 1 is a short part of 365
tug boat particulars collected (the sample sizes are
shown in Table 2) for each of the regression analysis.
These data are obtained from the internet adverts of
various companies such as in [5], [6],[7], and others.
International Journal of Engineering Trends and Technology (IJETT) - Volume 63 Issue 2 - September 2018
ISSN: 2231 - 5381 http://www.ijettjournal.org Page 94

[Type text] Page 95
The mathematical model for regression formulas
fitted to the data were linear and none linear function.
These are functions of these types
Linear, Y = mx + c . . . . . . . . . . . . . . . . .1
Power, Y =mXc. . . . . . . . . . . . . . . . . . ..2
Exponential,Y = m ln(X) + c . . . . . . . . . . 3
Polynomial Y=aXn+ aXn-1+..+ aX1+c…..4
Where Y a main dimension function and,
X is the bollard pull bp of the tugboats
m, c, and n are constants determined by the
regression analysis.
These are well known mathematical procedures
according to reference[8], and others. The Microsoft
EXCEL add in software has these program for these
procedures and these are used for the regression
analysis in this work.
Numerous regression correlation were made
between different formulated tug parametric variables
and the bollard pull but only those reliable formulas
with correlation coefficient R2 greater than 0.8 are
selected and published in this paper in fig 2 to fig 14.
Table 2 show the summarized formulas of the
regression analysis where the number of data points N
and the regression coefficients R2 are also shown.
Table 3 and 4 show an example of the Microsoft
EXCEL spread-sheet method for using these formulas
to calculate the main dimensions of tug boat for a
particular bollard pull described below.
III. RESULT AND DISCUSSION
The resulting formulas from this work are shown
in diagrams (fig 2 to 14) and table 2. If, for example,
the required sustained bollard pull for a tow is
calculated to be 28mt. What will be the main
dimension and power of the tug for the tow? Table 3
show the formulas entered in EXCEL work-sheet as
Eq(1), Eq(2) etc for the computation of each of the
main dimensions. Appropriate combinations of these
formulas as shown in some cases are necessary to
compute a particular dimension of the projected tug
boat. Table 4 show the result of dimensions of tugs
that is required to carry out the towing work
effectively with the mean expected value of L =
28.08m, B = 8.58m, D = 3.69m T = 3.14m, and P
= 2211hp
IV. CONCLUSIONS
Bollard pull is the major important parameter in the
design and operation criteria of tug boats propulsion
system. This paper focuses on the determination of
the dimensional parameters length L, breadth B,
depth D, Draft T in meters and power P in horse
power of the tug as a function of the main bollard pull
bp in metric tons. The necessary formulas for
carrying out this task are derived by regression
analysis from data collated from 116 world existing
tug boats. The thirteen formulas derived and shown
have regression coefficient R2 greater than 0.8. This
formulation is very important for the prediction of the
optimum main particulars of the prospective or
projected tug boat needed to tow other marine
equipment (ships, barges, rigs, etc) as shown in the
example stated in this paper. The formulas can also be
used in a computer program for the design of tug
boats.
REFERENCES
[1] Dr Paul Mertes, Hans, J. H.,“Aspects of the Design Procedure
for Propellers Providing Maximum Bollard Pull”
International Tug Salvage Convention, Singapore 2008.
[2] Mohamed Ashraf Ahmed El Zaaliket al, “Theoretical and
Experimental Measurement of Bollard pull with emphasis on
Propellar diameter” International Journal of Multidisciplinery
and current Research Vol 3 2015.
[3] P.Zahalka , “Bollard Pull” Verein Hanseatisher
Transportversicherer GL, Germany 2010.
[4] Jaroslaw Artyszuk,” Types and Power of Habour Tugs – The
Latest Trends”, Prace Naukowe Politechniki, Warsaw, April,
2013
[5] Marintimesale Inc, “Tudboats for Sale”,www.
Maritimesale.com (2016) .
[6] Damen Trading and chartering, “Damen Stan Tugs for sale”,
www.damen.com (2016). [7] Marcon International Inc, “ Vessels sales”,
www.marcon.com(2016)
[8] Douglas C. Montgomery, George C. Runger(2002) “Applied
Statistics and Probability for Engineers”, John Wiley and
Sons, Inc, USA Pp 372 – 467. 2002
Table 1 A collection of the principal dimension of modern Tugboat including bollard pull bp
NAME CLASS BUILLT LAO(m) B(m) D(m) T(m) bp(mt) ME(hp)
140904 VW TURKEYBV 2016 14.8 5.9 3 2.15 19 1660
140113 VW SPAIN 2011 16 5.5 2.8 2.15 12.5 780
151118 VN ITALY 1986 19 5.37 2.75 2.28 2 577
130718-VN
ISTBUL
RINA 2011 19.95 7 3.2 2.2 15 1200
BEN FOSS 1980 23.71 8.00 3.34 2.95 26.4 1700
141057 vw hollandBV 2012 24.07 12.97 4 3.8 53.4 3820
121063-VO SPAIN RINA 1982 25 8.4 4.36 4.2 32 2030
160524-VW SPAIN 1968 25.86 6.4 3.05 3 12 825
151228 VW HOLLAND 2007 26 11.5 3.5 2.25 33 2400
International Journal of Engineering Trends and Technology (IJETT) - Volume 63 Issue 2 - September 2018
ISSN: 2231 - 5381 http://www.ijettjournal.org Page 95

BV
131028-vo holland bv 2005 26.09 7.94 4.05 3.75 50.7 3500
ARI CRUZ -
SINUK USABS 1995 26.15 8.69 3.05 2.51 11.34 1248
ES
TAURUSINDO CHINA/NKK 1997 26.45 7.96 3.47 3.19 15 1240
151103VW USABS 1982 27.43 9.75 3.41 2.59 23.5 2110
OLIKTOK 27.89 8.17 4.2 3.93 25 2100
9777-tg-om SINGAPORE 1995 28.4 6.5 4.11 3.47 39.05 2800
8710-TG-OM ITALI RINA 1985 28.55 6.56 3.82 3.14 8.7 1520
11326-TG-OM SingporeABS 2006 29 9 4.25 3.5 40 3200
11326-TG-OM ABS 29.1 9 4.25 3.5 30 2400
11346-TG-OM FRANCE GL 1976 29.2 8.5 4.15 3.5 30 1500
12592-TG-OM RUSSIA 1988 29.3 8.3 4.3 3.4 16 1604
CONTELLATION NS 2009 30.22 9 4.38 3.68 30 2400
Island Brave USA ABS 30.99 11.00 5.59 4.60 70 5364
11077-TG-OM BatamIn LR 2005 31 9 4.5 3.5 40 3000
11153-OT-OM SPAIN 2002 31.21 8.41 4.51 4 22.9 1716
T W Ocean 15 USA ABS 1998 31.52 11.28 5.49 4.27 53.8 3900
140821-VO BV 2014 31.65 9.14 4.2 3.65 40 3200
150909 VO USA ABS 2003 31.70 10.97 4.88 4.11 48.58 4200
TITO N
SETTIMO LR 2012 31.99 11.6 5.81 5.36 73 5364
ASD TYR USA ABS 32.00 11.58 5.94 5.36 83.45 6834
13082 TG-OM USA ABS 1999 32.00 10.36 5.03 4.88 62.6 4400
12985 TG OM USA ABS 2012 32.00 11.58 5.38 5.23 60.78 4720
11163-TG-OM turkishBV 32.5 11.7 5.6 4.3 65 5632
130643-VO CHINA ASD 2009 33 10 4.5 4.1 50 4000
141120 VO INDONESIA 1982 33.52 7.92 3.2 2.4 12 1273
CHEV
RICHMOND CHINA 2013 33.98 10 4.5 3.4 50 4000
Table 1. Continued
NAME CLASS BUILT LAO(m) B(m) D(m) T(m) bp(mt) ME(hp)
9547TGOM 2016 34.4 12.82 5.75 5.36 70 6303
9835-TG-OM CHina BV 2014 34.5 9.5 4.6 3.65 40 3200
5922-TG-OM MALAY BV 2016 35 11.5 5.62 4.8 62 5150
12885-TG-OM china BV 2014 36 10.97 5 4.1 40 3200
140413-VO china BV 2014 36 10.97 5 4.1 40 3200
120322-VW 36.02 10.6 4.8 3.6 64 5200
ocean Tower CHINA BV 2009 36.1 10.6 4.9 4 40 3200
ESCORT EAGLE LAUSABS 1970 36.58 9.45 4.54 4.11 37.5 3000
11321-TG-OM KOREA 2012 36.9 10 4.5 3.4 59.464 4500
11143 TUG OM 2007 37 10.6 4.95 4 40.85 3200
11275-TG-OM AFRCA/IRE 1978 37.3 10.84 4.9 4.3 40.6 3500
141137-VA LRDAMEN 1998 37.5 9.25 4.9 3.4 69 5000
International Journal of Engineering Trends and Technology (IJETT) - Volume 63 Issue 2 - September 2018
ISSN: 2231 - 5381 http://www.ijettjournal.org Page 96

SUIATTIEUS
CCS CSA
CSM 2012 37.7 10.4 4.8 3.65 65 5200
AHT LRCHINA 37.99 11.00 5.00 3.81 60 4960
Liberty CHINA 2014 50 15.5 7.7 5.5 105 8400
HERCULES CHINABV 2012 58.7 14.6 5.5 4.75 66 4890
ASTERI KEPPEL 2004 60 16 6 5 78.3 6000
150336 VA SINGAPORE 2000 60 13.8 6.8 5.6 124 8000
9397-TG-OM
GERMANY
ABS 1982 64.5 13.82 6.9 5.91 110 8160
140929 US ABS 2015 66.5 16 6.5 5.12 80 6400
9397-TG-OM 26.15 7.95 4.05 3.45 38 2720
140929-VA DAMEN 1999 26.15 7.95 4.05 3.45 38 2720
M MORAN 2012 36.6 10.5 4.6 3.3 51 4800
Robust SINGAPORE 2013 81 16.8 7.5 6.4 120 7000
OCEAN Wrestler SINGAPORE 2013 81 16.8 7.5 6.4 120 7000
150632 AUTR 2013 91 22 9.6 8 240 21456
STAN2608 DAMEN 26.15 7.95 4.05 3.45 38 5440
Table 2 Tugboat design formulas as a function of bollard pull(x = bp) in metric tonnes.
N R2 Formula Eq. no
116 0.900 B = -2E-04x2 + 0.0912x + 5.78 - - - - - - - - - - - - - - - - Eq1
83 0.898 D = -7E-05x2 + 0.046x + 2.7135 - - - - - - - - - - - - - - - Eq2
60 0.801 T = -6E-05x2 + 0.0379x + 2.2631- - - - - - - - - - - - - - - Eq3 48 0.897 P/L = 0.0002x3- 0.0105x2 + 1.9129x + 27.443 - - - - - Eq4
60 0.858 P/B = 0.0003x3 – 0.0928x2 + 11.765x - - - - - - - - - - - Eq5
60 0.916 P/D = 0.0006x3 – 0.2093x2 + 25.759x - - - - - - - - - - - Eq6
116 0.906 LB = 0.0102x2 + 5.4694x + 50 - - - - - - - - - - - - - - - - Eq7
66 0.820 DT = 0.0005x2 + 0.4277x - - - - - - - - - - - - - - - - - - - Eq8
60 0.836 P/T = 0.0007x3 – 0.2549x2 + 31.339x - - - - - - - - - - - Eq9 60 0.882 LBD = 0.2457x2 + 22.939x - - - - - - - - - - - - - - - - - - - Eq10D
60
116
116
48
0.879
0.967
0.818
0.896
LBT = 0.1953x2 + 23.382x - - - - - - - - - - - - - - - - - -
P = 0.0562x2 + 75.309x - - - - - - - - - - - - - - - - - - - -
(√L)/ B2 = 0.3725x-0.483 - - - - - - - - - - - - - - - - - - - - -
P/L = 0.0002x3- 0.0105x2+1.9129x+27.443 - - - - - - -
Eq10T
Eq11
Eq12
Eq13
53
79
60
60
103
0.863
0.891
0.812
0.836
0.872
bp/L= 0.0937x0.7037 - - -- - - - - - - - - - - - - - - - - - - - -
P/D = 0.0005x3-0.1657x2+21.602x+93.902- - - - - - - -
DT = 0.3367x + 4.0752 - - - - - - - - - - - - - - - - - - - - -
BT = 0.7509x + 7.8674 - - - - - - - - - - - - - - - - - - - - -
BD = 0.0006x2 + 0.6904x + 14.119 - - - - - - - - - - - - -
Eq14
Eq15
Eq16
Eq17
Eq 18
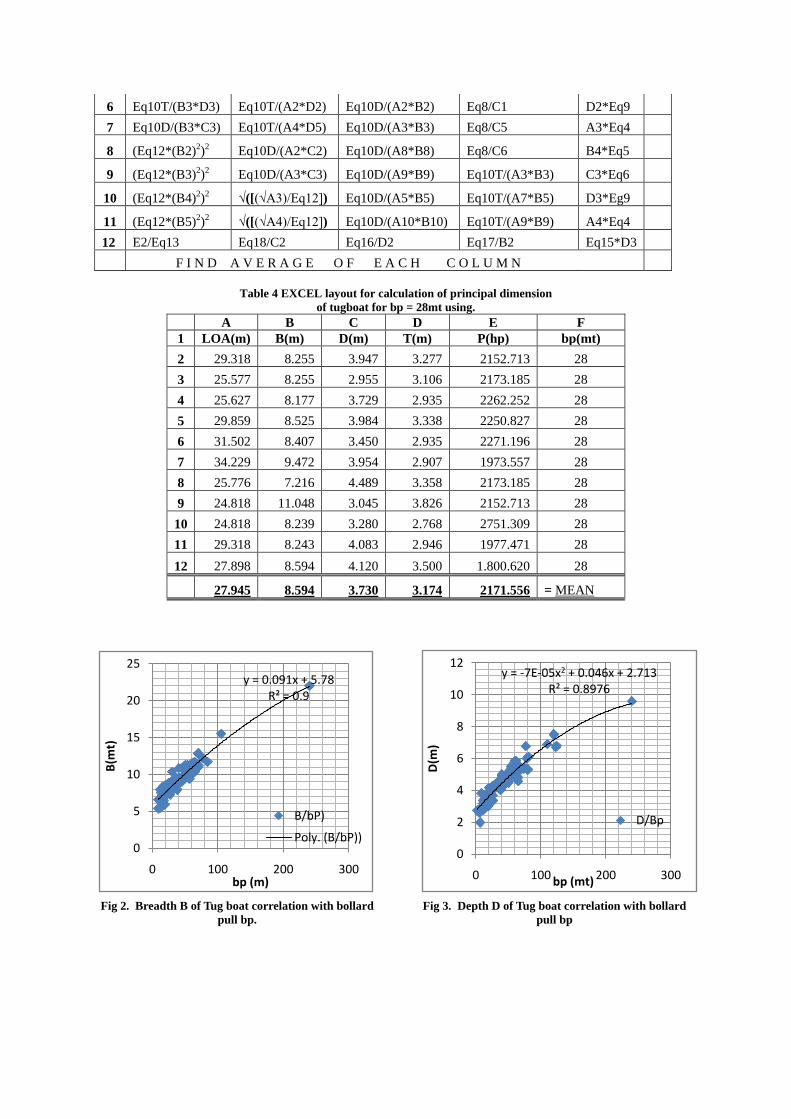
Table 3 EXCEL layout for calculation of principal dimension
of tugboat for bp = 28mt using.
A B C D E F
1 LOA(m) B(m) D(m) T(m) P(t) (t)
2 bp/Eq14 Eq 1 Eq2 Eq3 Eq11 bp
3 Eq8/B2 Eq7/A3 Eq 11/EQ6 Eq11/EQ9 B2*Eq5
4 Eq10D/(B2*C2) Eq11/EQ5 Eq8/D3 Eq8/C2 A2*Eq4
5 Eq10T/(B2*D2) √([(√A2)/Eq12]) Eq10D/(A4*B4) Eq9T/(A2*B2) C2*Eq6
International Journal of Engineering Trends and Technology (IJETT) - Volume 63 Issue 2 - September 2018
ISSN: 2231 - 5381 http://www.ijettjournal.org Page 97
6 Eq10T/(B3*D3) Eq10T/(A2*D2) Eq10D/(A2*B2) Eq8/C1 D2*Eq9
7 Eq10D/(B3*C3) Eq10T/(A4*D5) Eq10D/(A3*B3) Eq8/C5 A3*Eq4
8 (Eq12*(B2)2)2 Eq10D/(A2*C2) Eq10D/(A8*B8) Eq8/C6 B4*Eq5
9 (Eq12*(B3)2)2 Eq10D/(A3*C3) Eq10D/(A9*B9) Eq10T/(A3*B3) C3*Eq6
10 (Eq12*(B4)2)2 √([(√A3)/Eq12]) Eq10D/(A5*B5) Eq10T/(A7*B5) D3*Eg9
11 (Eq12*(B5)2)2 √([(√A4)/Eq12]) Eq10D/(A10*B10) Eq10T/(A9*B9) A4*Eq4
12 E2/Eq13 Eq18/C2 Eq16/D2 Eq17/B2 Eq15*D3
F I N D A V E R A G E O F E A C H C O L U M N
Table 4 EXCEL layout for calculation of principal dimension
of tugboat for bp = 28mt using.
A B C D E F
1 LOA(m) B(m) D(m) T(m) P(hp) bp(mt)
2 29.318 8.255 3.947 3.277 2152.713 28
3 25.577 8.255 2.955 3.106 2173.185 28
4 25.627 8.177 3.729 2.935 2262.252 28
5 29.859 8.525 3.984 3.338 2250.827 28
6 31.502 8.407 3.450 2.935 2271.196 28
7 34.229 9.472 3.954 2.907 1973.557 28
8 25.776 7.216 4.489 3.358 2173.185 28
9 24.818 11.048 3.045 3.826 2152.713 28
10 24.818 8.239 3.280 2.768 2751.309 28
11 29.318 8.243 4.083 2.946 1977.471 28
12 27.898 8.594 4.120 3.500 1.800.620 28
27.945 8.594 3.730 3.174 2171.556 = MEAN
Fig 2. Breadth B of Tug boat correlation with bollard
pull bp.
Fig 3. Depth D of Tug boat correlation with bollard
pull bp
y = 0.091x + 5.78R² = 0.9
0
5
10
15
20
25
0 100 200 300
B(m
t)
bp (m)
B/bP)
Poly. (B/bP))
y = -7E-05x2 + 0.046x + 2.713R² = 0.8976
0
2
4
6
8
10
12
0 100 200 300
D(m
)
bp (mt)
D/Bp
International Journal of Engineering Trends and Technology (IJETT) - Volume 63 Issue 2 - September 2018
ISSN: 2231 - 5381 http://www.ijettjournal.org Page 98

Fig 4. Draft T of Tug boat correlation with bollard pull
bp.
Fig 5. bp/L of Tug boat correlation with bollard pull bp
Fig 6.Power P/Breadth B ratio of Tug boat correlation
with bollard pull bp.
Fig 7. Power P/ Depth D ratio of Tug boat boat
correlation with bollard pull bp
Fig 8. Length L* breadth B of Tug boat correlation with
bollard pull bp Fig 9. Depth D* draft T of Tug boat correlation with
bollard pull bp
Fig 10.Power P/Draft T ratio of Tug boat correlation
with bollard pull bp
Fig 11. LBD, and LBT cubic numbers of tug boat
correlation with bp
y = 2E-06x3 - 0.001x2 + 0.228x + 1.325
R² = 0.9635
0
5
10
15
20
25
30
0 100 200 300
bP
/D (
t/m
)
bp(t)
((bp/D)/bp
y = -6E-05x2 + 0.037x + 2.263R² = 0.8012
0
2
4
6
8
10
0 100 200 300
T(m
t)
bp (t)
T/bp
y = - 0.092x2 + 11.76xR² = 0.8579
0
200
400
600
800
1000
1200
0 100 200 300
P/B
(hp
/m)
bp (t)
(P/B)/bpPoly. ( (P/B)/bp)
y = - 0.209x2 + 25.75xR² = 0.9156
0
500
1000
1500
2000
2500
0 100 200 300
bp
/D(h
o/m
)
bp (t)
bP(HP)/ (P/D)
y = 5.469x + 50R² = 0.9061
0
500
1000
1500
2000
2500
0 100 200 300
LB(m
^2)
bp(t)
LB/bp
y =-0.0005x2 0.427xR² = 0.8202
0
20
40
60
80
100
0 100 200 300
DT(
m^2
)
bp(t)
DT/bp
Poly. (DT/bp)
y = 0.0007x3 - 0.2549x2 + 31.33x
R² = 0.8355
0
500
1000
1500
2000
2500
3000
0 100 200 300
P/T
(h
p/m
)
bp (t)
(P/T)/bp
Poly. ((P/T)/bp)
y = 0.1953x2 + 23.382xR² = 0.8794
y = 0.2457x2+22.939xR² = 0.8821
0
5000
10000
15000
20000
25000
0 100 200 300
LBD
, LB
T (m
^3)
bp(t)
LBT/bpT
LBD/bp
International Journal of Engineering Trends and Technology (IJETT) - Volume 63 Issue 2 - September 2018
ISSN: 2231 - 5381 http://www.ijettjournal.org Page 99

Fig 12.Power P of Tug boat correlation with bollard
pull bp.
Fig 13. (√L)/B2 ratio of Tug boat correlation with
bollard pull bp
Fig 14. Power P/ Length L ratio of Tug boat Correlated Fig 15 bp/L correlation with bollard correlated
with bollard pull bp with bollard pull bp
Fig 16. Power P/ Depth d ratio of Tug boat Correlated
with bollard pull bp
Fig 18. Power P/ Length L ratio of Tug boat
Correlated with bollard pull bp
Fig 17 bp/L correlation with bollard correlated with
bollard pull bp
Fig 19 bp/L correlation with bollard correlated with
bollard pull bp
y = 0.0937x0.7037
R² = 0.8631
0
0.5
1
1.5
2
2.5
3
0 50 100 150
bp
/L(t
on
s/m
)
bp(t)
bp/(bp/L)
y = 0.000x3 - 0.165x2 + 21.602x + 93.902
R² = 0.8913
0
500
1000
1500
2000
2500
0 100 200 300
P/D
(to
ns/
m)
bp(t)
((P/D)/bp
Poly. (((P/D)/bp)
y = 0.0562x2 +75.309xR² = 0.9673
0
5000
10000
15000
20000
25000
0 100 200 300
P(h
p)
bP(t)
BP/P
y = 0.372x-0.483
R² = 0.8179
0
0.02
0.04
0.06
0.08
0.1
0.12
0.14
0 100 200 300
L^0
.5/B
^2(1
/m^3
)
bp(t)
(L^05/B^2)/bp
y = 0.000x3 - 0.010x2 + 1.912x + 27.44
R² = 0.8964
0
50
100
150
200
250
0 20 40 60 80 100
P/L
(hp
/m)
bp(t)
P/LPoly. (P/L)
International Journal of Engineering Trends and Technology (IJETT) - Volume 63 Issue 2 - September 2018
ISSN: 2231 - 5381 http://www.ijettjournal.org Page 100

![DAMEN RSD TUG 2513 Twin Fin - Damen GreenX100 A1 Escort Tug Fire Fighting Ship 1 (2400 m³) [X] ... BOLLARD PULL AHEAD 71.0 ton (m) ... DAMEN RSD ® TUG 2513 Twin Fin ... · 2016-10-20](https://static.fdocuments.us/doc/165x107/5ac7c8d97f8b9a42358bc472/damen-rsd-tug-2513-twin-fin-damen-greenx100-a1-escort-tug-fire-fighting-ship-1.jpg)