Vapor-Gas Bubble Evolution and Growth in Extremely · PDF fileVapor-Gas Bubble Evolution and...
17
John Kizito North Carolina A&T State University, Greensboro, North Carolina R. Balasubramaniam National Center for Space Exploration Research Center, Glenn Research Center, Cleveland, Ohio Henry Nahra, Juan Agui, and Duc Truong Glenn Research Center, Cleveland, Ohio Vapor-Gas Bubble Evolution and Growth in Extremely Viscous Fluids Under Vacuum NASA/TM—2009-215606 March 2008 AIAA–2009–1147 https://ntrs.nasa.gov/search.jsp?R=20090019007 2018-05-19T22:08:05+00:00Z
-
Upload
truongminh -
Category
Documents
-
view
222 -
download
0
Transcript of Vapor-Gas Bubble Evolution and Growth in Extremely · PDF fileVapor-Gas Bubble Evolution and...

John KizitoNorth Carolina A&T State University, Greensboro, North Carolina
R. BalasubramaniamNational Center for Space Exploration Research Center, Glenn Research Center, Cleveland, Ohio
Henry Nahra, Juan Agui, and Duc TruongGlenn Research Center, Cleveland, Ohio
Vapor-Gas Bubble Evolution and Growth in Extremely Viscous Fluids Under Vacuum
NASA/TM—2009-215606
March 2008
AIAA–2009–1147
https://ntrs.nasa.gov/search.jsp?R=20090019007 2018-05-19T22:08:05+00:00Z

NASA STI Program . . . in Profi le
Since its founding, NASA has been dedicated to the advancement of aeronautics and space science. The NASA Scientifi c and Technical Information (STI) program plays a key part in helping NASA maintain this important role.
The NASA STI Program operates under the auspices of the Agency Chief Information Offi cer. It collects, organizes, provides for archiving, and disseminates NASA’s STI. The NASA STI program provides access to the NASA Aeronautics and Space Database and its public interface, the NASA Technical Reports Server, thus providing one of the largest collections of aeronautical and space science STI in the world. Results are published in both non-NASA channels and by NASA in the NASA STI Report Series, which includes the following report types: • TECHNICAL PUBLICATION. Reports of
completed research or a major signifi cant phase of research that present the results of NASA programs and include extensive data or theoretical analysis. Includes compilations of signifi cant scientifi c and technical data and information deemed to be of continuing reference value. NASA counterpart of peer-reviewed formal professional papers but has less stringent limitations on manuscript length and extent of graphic presentations.
• TECHNICAL MEMORANDUM. Scientifi c
and technical fi ndings that are preliminary or of specialized interest, e.g., quick release reports, working papers, and bibliographies that contain minimal annotation. Does not contain extensive analysis.
• CONTRACTOR REPORT. Scientifi c and
technical fi ndings by NASA-sponsored contractors and grantees.
• CONFERENCE PUBLICATION. Collected
papers from scientifi c and technical conferences, symposia, seminars, or other meetings sponsored or cosponsored by NASA.
• SPECIAL PUBLICATION. Scientifi c,
technical, or historical information from NASA programs, projects, and missions, often concerned with subjects having substantial public interest.
• TECHNICAL TRANSLATION. English-
language translations of foreign scientifi c and technical material pertinent to NASA’s mission.
Specialized services also include creating custom thesauri, building customized databases, organizing and publishing research results.
For more information about the NASA STI program, see the following:
• Access the NASA STI program home page at http://www.sti.nasa.gov
• E-mail your question via the Internet to help@
sti.nasa.gov • Fax your question to the NASA STI Help Desk
at 301–621–0134 • Telephone the NASA STI Help Desk at 301–621–0390 • Write to:
NASA Center for AeroSpace Information (CASI) 7115 Standard Drive Hanover, MD 21076–1320

John KizitoNorth Carolina A&T State University, Greensboro, North Carolina
R. BalasubramaniamNational Center for Space Exploration Research Center, Glenn Research Center, Cleveland, Ohio
Henry Nahra, Juan Agui, and Duc TruongGlenn Research Center, Cleveland, Ohio
Vapor-Gas Bubble Evolution and Growth in Extremely Viscous Fluids Under Vacuum
NASA/TM—2009-215606
March 2008
AIAA–2009–1147
National Aeronautics andSpace Administration
Glenn Research CenterCleveland, Ohio 44135
Prepared for the47th Aerospace Sciences Meeting and Exhibitsponsored by the American Institute of Aeronautics and AstronauticsOrlando, Florida, January 5–8, 2009

Acknowledgments
The authors thank Timothy Brady, Michael Fowler (NASA JSC), Edward Pierson (Lockheed Martin) and Carol Quinn (NASA GRC) for helpful discussions and providing funding for the effort.
Available from
NASA Center for Aerospace Information7115 Standard DriveHanover, MD 21076–1320
National Technical Information Service5285 Port Royal RoadSpringfi eld, VA 22161
Available electronically at http://gltrs.grc.nasa.gov
Trade names and trademarks are used in this report for identifi cation only. Their usage does not constitute an offi cial endorsement, either expressed or implied, by the National Aeronautics and
Space Administration.
Level of Review: This material has been technically reviewed by technical management.

Vapor-Gas Bubble Evolution and Growth in Extremely Viscous Fluids Under Vacuum
John Kizito
North Carolina A&T State University Greensboro, North Carolina 27411
R. Balasubramaniam
National Center for Space Exploration Research Center Glenn Research Center Cleveland, Ohio 44135
Henry Nahra, Juan Agui, and Duc Truong
National Aeronautics and Space Administration Glenn Research Center Cleveland, Ohio 44135
Abstract
Formation of vapor and gas bubbles and voids is normal and expected in flow processes involving extremely viscous fluids in normal gravity. Practical examples of extremely viscous fluids are epoxy-like filler materials before the epoxy fluids cure to their permanent form to create a mechanical bond between two substrates. When these fluids flow with a free liquid interface exposed to vacuum, rapid bubble expansion process may ensue. Bubble expansion might compromise the mechanical bond strength. The potential sources for the origin of the gases might be incomplete out-gassing process prior to filler application; regasification due to seal leakage in the filler applicator; and/or volatiles evolved from cure reaction products formed in the hardening process. We embarked on a study that involved conducting laboratory experiments with imaging diagnostics in order to deduce the seriousness of bubbling caused by entrained air and volatile fluids under space vacuum and low gravity environment. We used clear fluids with the similar physical properties as the epoxy-like filler material to mimic the dynamics of bubbles. Another aspect of the present study was to determine the likelihood of bubbling resulting from dissolved gases nucleating from solution. These experimental studies of the bubble expansion are compared with predictions using a modified Rayleigh-Plesset equation, which models the bubble expansion.
Nomenclature Su Suratman number ρl density of the liquid μ liquid viscosity R instantaneous radius of the bubble σ gas/liquid surface tension P pressure of the gas inside the bubble
P∞ pressure in the liquid Ro radius of the bubble at steady state Pi initial pressure Ri initial radius of the gas bubble
Introduction Formation of vapor and gas bubbles, and voids is normal
and expected in flow processes involving extremely viscous fluids in normal gravity. In space and microgravity, the presence of bubbles in fluids may cause problems like bubble expansion especially when the fluid involved is intended to be an adhesive joining two solid materials upon bonding. In a preliminary study (ref. 1), we determined analytically the bubble volume fraction that can be produced from different potential bubble sources. However, the only way to quantitatively evaluate the dynamics of the bubble expansions is to perform a series of experiments under vacuum. The present study describes both analytical and experimental methods used to predict the behavior of gas and/or vapor bubbles in a highly viscous fluid when the ambient pressure suddenly changes to vacuum. The study may be used to understand bubble distribution and void formation during the dispensing and precuring stages of epoxy-like adhesives in microgravity under vacuum.
The following potential sources were identified for the origin of the gases, that encompass process variables as well as inherent phenomena in the curing process: (i) incomplete out-gassing, (ii) regasification due to leakage and off-gassing, (iii) leakage of pressurized gases used in the dispensing of the fluid, (iv) introduction of gases from other components required for adhesive bond strengthening, (v) volatiles evolved from cure reaction products (for example ethanol). Whereas voids and bubbles cannot be avoided, managing the void distribution may be essential to the quality of the adhesive joint which will ensure the structural integrity and thermal performance of the cured joint.
NASA/TM—2009-215606 1

In this paper, we set out to determine the dynamics of gases, ethanol and dissolved air in a viscous fluid subjected to vacuum as a function of temperature and initial mass fraction. Viscous fluids, for example silicone oil, mimic epoxy-like material so these are used in the experiments. We evaluate the expansion of an air/vapor bubble under normal gravity, and vacuum at room temperature. In addition, we evaluate vapor and gas bubble expansion and evolution at two other temperatures, 45 and 100 °F, subjected to a vacuum pressure. At those conditions, we assess the effect of bubble expansion from dissolved gases. Lastly, we compare growth rates of ethanol vapor/air bubbles obtained from experiments with those obtained from theoretical predictions (Rayleigh-Plesset equation).
Analytical Methods A theoretical model based on the Rayleigh-Plesset equation
(refs. 2 and 3) and the ideal gas law was used to model the expansion process of an air bubble. The experimentally observed bubble sizes are larger than those predicted by this model, suggesting that there is mass transfer from the liquid to the bubble as it expands. Such mass transfer is not accounted for in the Rayleigh-Plesset model. When air bubbles were not initially present in the liquid, however, dissolved gas that is likely to be present in the liquid was not nucleated in any of the experiments, and the liquid remained bubble free.
Expansion of a Gas Bubble From an Initial Small Size
The process of expansion of a spherical gas bubble that has a small size initially is analyzed below. The analysis is performed using the classic Rayleigh-Plesset equation (ref. 4). In this analysis, the bubble is assumed to grow in a liquid that is of infinite extent. The growth of the bubble is spherically symmetric. There is no motion in the liquid, other than that induced by the expansion of the bubble. We assume that any translational motion of the bubble (such as its rise velocity due to buoyancy) is either absent or negligible compared with its rate of expansion. The Rayleigh-Plesset equation for the expansion of a gas bubble can be written as follows.
RRPP
RRRRl
&&&& μ−−+
σ−=⎟
⎠⎞
⎜⎝⎛ +ρ ∞ 42
23 2 (1)
where ρl is the density of the liquid, μ is its viscosity, R is the instantaneous radius of the bubble, σ is the gas/liquid surface tension, P is the pressure of the gas inside the bubble, and P∞ is the pressure in the liquid. The dot above R denotes a time derivative. In the space environment of microgravity where the viscous material is exposed to vacuum, P1 may be set equal to zero. We assume that the gas within the bubble obeys the ideal gas law, and there is no exchange of mass between the bubble and the liquid. Further, we assume that the temperature of the gas does not change when it expands. We
do not consider any changes to the temperature of the gas or the liquid in our analysis. Using Boyle’s law (P1V1 = P2V2), the instantaneous pressure within the gas may be written as
3
3
RRPP ii= (2)
where Pi and Ri denote the pressure and radius of the gas bubble at the initial time before its expansion. The Rayleigh-Plesset equation can then be written as
RR
RPiR
RRRR i
l&
&&& μ−+σ
−=⎟⎠⎞
⎜⎝⎛ +ρ 42
23
3
32 (3)
The above equation has a solution at steady state. That is, if a bubble of radius Ri and pressure Pi is introduced at time t = 0 into a liquid which has a zero pressure, one can determine the eventual size of the bubble after the gas fully expands and achieves equilibrium. At equilibrium, the pressure within the bubble is determined by the capillary force. The expression for the expanded radius Ro of the bubble at steady state is given below.
213
2 ⎟⎟⎠
⎞⎜⎜⎝
⎛σ
= iio
RPR (4)
The equations for the expansion of the bubble are now cast in terms of dimensionless variables. Let
σμ
==== oo
o
ii
oo
RtRRr
ttt
RRr ,,
ˆ, (5)
where denotes the physical time. The equations for the expansion of the bubble can be written as
t̂
rr
rrrrr
&&&&
42223Su
32 −+−=⎟⎠⎞
⎜⎝⎛ + (6)
00, === tatrrr i & (7)
where μμσ == capolol VRpRp
2Su is the Suratman number, and ri is
the scaled initial radius of the bubble. The expansion of the bubble is controlled by these two dimensionless parameter. The Suratman number can be regarded as a Reynolds number that is based on the characteristic capillary velocity Vcap = μ
σ
In order to get a feel for the values of the various parameters, consider the expansion of a gas bubble that has an initial radius of 100 μm, and a pressure of 1/2 atm. Assume a value of 20 dyne/cm for the surface tension, which is a typical value for the silicone oil/air interface. Let the viscosity of the liquid be μ = 3000 P, which is comparable to the initial viscosity of epoxy-like material. Using these values, we obtain Ro = 1.125 mm, to = 16.875 sec, ri = 0.089, Su = 2×10⁻⁷. If the initial radius of the bubble is 30 μm, then we obtain Ro = 0.185 mm, to = 2.78 sec, ri = 0.162, Su = 4×10⁻⁸. The
NASA/TM—2009-215606 2

results for expansion of the bubble for various values of ri and Su are displayed in Figures 1 to 6.
From these figures we see that when Su is less than 1, the expansion of the bubble achieves a steady state when the scaled time is approximately 5. For completeness, we also show the behavior of the bubble expansion for Su larger than one. Figure 3 reveals that when Su is 10, the dynamics of the expansion is quite complicated, and the instantaneous radius of the bubble attains its steady value in an oscillatory manner. The smaller the initial size of the bubble, the larger the overshoot beyond the steady value. Such behavior is a consequence of the importance of inertial forces in the liquid, as the bubble expands. The Suratman number is likely to be of the order of magnitude of 10−7 in the joint bonding experiments using epoxy-like material, and behavior depicted in Figure 3 is not anticipated to occur for these types of fluids.
Figures 1 and 2 show that for Su much less than 0.1 and ri = 0.3, the expansion of the bubble is practically independent of Su and ri. The results for the expansion of the bubble in terms of physical (dimensional) quantities are shown in Figures 5 and 6, when the viscosity of the liquid is 30600 and 306000 P, respectively. Note that in all these cases, the bubble expands to a final size of 0.0185 cm. We have not considered any exchange of mass between the bubble and the liquid during the expansion process.
NASA/TM—2009-215606 3

If there is mass transfer, then the momentum equation (which results in the Rayleigh-Plesset equation) must be coupled with the convective-diffusion equation for the species that is exchanged between the gas and the liquid, and the problem is quite complicated. The effect of convective-diffusion in the absence of expansion due to a reduction in the pressure has been studied and documented in the literature. The reader is referred to Venerus and Yala (ref. 5) for typical transport models with mass diffusion.
Expansion of a Gas Bubble in a Liquid with a Time-Dependent Viscosity
Following the derivation of the Rayleigh-Plesset equation given in Reference 4, it can be shown that the Rayleigh-Plesset equation given in Eq. (1) is valid when the viscosity of the liquid is a function of time (but not a function of space, i.e., the viscosity of the entire liquid changes uniformly with time). In what follows, we have used the Rayleigh-Plesset equation to model the changes in the viscosity with time. The viscosity was assumed to vary from an initial value of 3500 P to approximately 300,000 P after 10 hr. The viscosity may still evolve after 10 hr. This viscosity data has been used in Eq. (1) to model the growth of a gas bubble with an initial size of 0.003 cm, and an initial pressure of 1/2 atm. The liquid/gas surface tension is assumed to have a constant value of 20 dyne/cm. The data still shows the expansion of the bubble under these conditions; the final size attained by the bubble is independent of the viscosity of the liquid and the bubble size is equal to 0.0185 cm just like the cases above. It is evident that the expansion of the bubble nearly achieves its asymptotic value for times larger than approximately 10 sec. Furthermore, the variation of the viscosity does not affect the expansion of the bubble for such short times—the plot of the radius of the bubble versus time with the liquid viscosity being constant and equal to 3500 P is virtually indistinguishable.
Nucleation of a Vapor or Dissolved-Gas Bubble in a Liquid
In the expansion of the bubble we have considered thus far, a gas bubble was initially present in a liquid. The expansion of the bubble was then analyzed due to a reduction in the pressure of the liquid, when it is exposed to the vacuum of space. Bubbles may also form and grow in a liquid without being initially present. This happens, for example, when the liquid contains dissolved gas. Upon a reduction in the pressure of the liquid, the gas comes out of solution in the form of bubbles. These bubbles subsequently grow due to the reduction in the liquid’s pressure. If the liquid does not contain dissolved gas and the pressure in the liquid falls below the saturation pressure at the prevailing temperature a bubble containing the pure vapor of the liquid will form. The process by which small bubbles of dissolved gas or pure vapor form in the liquid is called nucleation. Nucleation is further classified
as homogeneous or heterogeneous nucleation. Refer to Reference 4 and references contained therein for more detailed descriptions of homogeneous and heterogeneous nucleation.
Heterogeneous nucleation is more common; in this case pre-existing gas and vapor pockets, typically trapped in cavities, crevices and cracks on the solid surfaces containing the liquid, collectively called nucleation sites, promote the growth and appearance of macroscopic vapor bubbles. As the pressure of the liquid is reduced, more and more nucleation sites become capable of generating and releasing bubbles into the liquid. An increase in temperature also leads to the activation of additional nucleation sites. Whether a nucleation site becomes active or not depends on many parameters. In the case of a conical cavity for example, the liquid pressure necessary to cause the trapped vapor to grow depends on the half-angle of the cone and the contact angle of the liquid at the intersection of the liquid, vapor and solid.
In homogeneous nucleation, gas or vapor nuclei form in the liquid naturally as a result of intrinsic thermal motion of the molecules. Gas nuclei are formed in the bulk of the liquid, and not necessarily at the bounding solid surfaces. The origins for the nuclei are the fluctuating thermal motions in the liquid. These fluctuations must be of sufficient strength to locally rupture the liquid. Homogeneous nucleation theory recognizes that liquids possess a tensile strength, much like solids. The tensile strength of a liquid is defined as Δpc = pv − p where pv is the saturated vapor pressure at the prevailing temperature and p is the pressure in the liquid below the saturation pressure at which the liquid ruptures and voids are formed. From the theory of homogeneous nucleation, the following expression for Δpc is obtained.
c
c Wp
316 3πσ
=Δ (8)
where σ is the surface tension and the critical work Wc is usually determined via the expression
(9) GbkTWc =
where k is Boltzmann’s constant, T is the temperature of the liquid, and Gb is the Gibbs number, usually assumed to be 11.5 to determine the critical work Wc. Lienhard and Karimi (ref. 6) found that in the case of homogeneous nucleation in water, use of the temperature at the critical point TC instead of T in the above expression yields a more accurate criterion for Δpc when compared with experimental results. The tensile strengths of liquids required for homogeneous nucleation calculated from the expression given above can be as large as a few hundred atmospheres, away from the liquid’s critical point. For ethanol, using the critical temperature of 516 K and a surface tension of 20 dyne/cm yields Δpc = 399 atm. In the experiments we have performed with ethanol drops suspended in a silicone oil of viscosity 3000 P that is reported below, the lowest pressure that the liquid was subjected to was close to zero; we did not have any
NASA/TM—2009-215606 4
provision for subjecting the liquid to negative pressures, such as in experiments conducted using Berthelot tubes (see Richards and Trevena (ref. 7) for example). Therefore it is extremely unlikely to encounter homogeneous nucleation. Indeed none was observed, as reported below in the experimental section.
NASA/TM—2009-215606 5
Experimental Design Methods and Materials Experimental Design
We show the seriousness of bubbling caused by air bubbles and ethanol under vacuum in a model transparent fluid. The fluid used is silicone oil whose viscosity is similar to the starting viscosity of adhesive which might be used in space under vacuum. An experimental apparatus of small size was constructed that is capable of achieving high vacuum. The apparatus consists of a vacuum chamber constructed from a stainless steel block, a main vacuum pump and a vapor diffusion pump together with a cold trap that uses liquid nitrogen. The pressure was monitored by using a thermocouple pressure gauge and a cold cathode gauge.
Experiments on air bubbles and ethanol drops were conducted in a small cuvette placed within the vacuum chamber. The bubbles or drops were inserted into the cuvette under ambient pressure. The test cell was then quickly transferred into the vacuum chamber, and the vacuum pumps were operated. A long working distance microscope was used to image the bubbles and drops. The results of the experiments show that air bubbles present in the liquid undergo a tremendous expansion when the liquid is exposed to vacuum.
We therefore developed a test plan that involves conducting experiments with imaging diagnostics in order to deduce the
seriousness of bubbling caused by air bubbles and ethanol under vacuum. Another aspect of the tests is to determine the effect on bubbling from dissolved gases. These experimental studies of the bubble expansion will be compared with predictions using the Rayleigh-Plesset equation that models the bubble expansion.
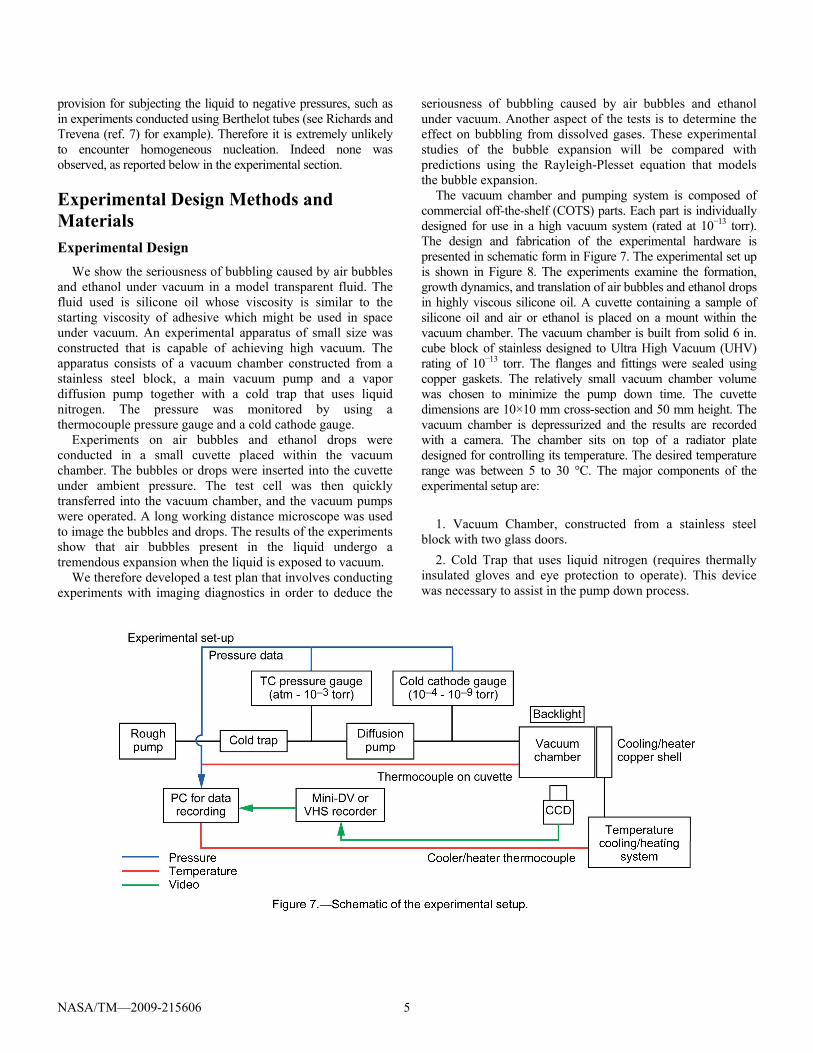
The vacuum chamber and pumping system is composed of commercial off-the-shelf (COTS) parts. Each part is individually designed for use in a high vacuum system (rated at 10−13 torr). The design and fabrication of the experimental hardware is presented in schematic form in Figure 7. The experimental set up is shown in Figure 8. The experiments examine the formation, growth dynamics, and translation of air bubbles and ethanol drops in highly viscous silicone oil. A cuvette containing a sample of silicone oil and air or ethanol is placed on a mount within the vacuum chamber. The vacuum chamber is built from solid 6 in. cube block of stainless designed to Ultra High Vacuum (UHV) rating of 10−13 torr. The flanges and fittings were sealed using copper gaskets. The relatively small vacuum chamber volume was chosen to minimize the pump down time. The cuvette dimensions are 10×10 mm cross-section and 50 mm height. The vacuum chamber is depressurized and the results are recorded with a camera. The chamber sits on top of a radiator plate designed for controlling its temperature. The desired temperature range was between 5 to 30 °C. The major components of the experimental setup are:
1. Vacuum Chamber, constructed from a stainless steel
block with two glass doors. 2. Cold Trap that uses liquid nitrogen (requires thermally
insulated gloves and eye protection to operate). This device was necessary to assist in the pump down process.
3. Vapor Diffusion Pumps that required careful handling due to the high temperature swing under which it operated. The diffusion pump was initially air cooled but subsequently modified with cooling tubes via a cooling bath (–40 °C) to assist in the pump down process.
4. Main Roughing Vacuum Pump which is the work horse of the system. The 1/3 hp roughing vacuum pump with an inlet and outlet ports has pumping rate of 120 LPM and achieves 5×10⁻⁴ torr ultimate pressure. It has an antisuck back valve; oil mist eliminator and 20 in. bellow connection to the cold trap.
5. Thermocouple (TC) pressure gauge with an analog output. The TC pressure gauge senses vacuum by measuring the temperature rise of an electrically heated fine-wire sensor exposed to a vacuum. Its digital display has an output from 760 to 0.001 torr. The TC has better resolution and readability than analog instruments. The linearization and temperature compensation are done electronically therefore no user calibration or adjustment is ever necessary.
6. To measure the Ultra High Vacuum (UHV), we used a Cold Cathode Gauge Controller which displays vacuum pressure as measured from an inverted magnetron gauge tube. The vacuum measurements were based on ionization of the residual gas in the chamber. The controller was designed to cover the range from 3×10⁻¹⁰ to 10−2 torr (mbar), and controls two relays with independent set points. We were not able to operate this gauge above 10−4 torr. Also we used the voltage analog output to monitor and log the UHV pressure. The output is logarithmic, calibrated, 12-bit resolution, 0.5 V/decade; the source impedance for the output is 1 KΩ. The output voltage pressure relationship is calculated from: P = 10−10×102V torr.
7. O-rings and fittings: We avoided o-rings or any elastomers because these are known to cause out-gassing below 10−6 torr. Instead we used all metal seals—what is known as conflate style vacuum.
8. Long working distance microscope: We built a long working distance microscope using 125XL Lens system 125C zoom module with Iris, 15 mm fine focus, 1.0XTV tube and 0.25X auxiliary lens. The magnification of the lens system was set at 0.6X, 1X, 2X, 3X, 4X, 5X and 6X.
Methods and Procedures
A measured quantity of air or ethanol (0.1 to 100 µliters) was injected into a cuvette containing the host material. The behavior of the droplet/bubble was observed and recorded. The host material is silicone oil with a viscosity of 300,000 cSt (2910 P). Silicone oil was chosen because of its stable viscosity and its transparent optical properties. The data consists of captured images and analysis of the droplet/bubble behavior (via software and image analysis). Different tests were conducted by varying the amount of the injected droplet or bubble and host material. In each case, the growth of the
droplet or the bubble was monitored for a sufficiently long time (5 to 6 hr). The various steps involved in the experiments are: cuvette preparation, debubbling of the silicone oil, insertion of air bubble or ethanol drop, establishment of a vacuum, and monitoring and data acquisition.
Monitoring and Data Acquisition
The data from the pressure gauges and temperature thermocouples was electronically recorded using a data acquisition system. . We carried experiments to determine the time taken for the system to pump down to vacuum pressures. The system required less than 45 sec to pump down to pressures under 1 torr. The temporal pressure relationship derived from experimental data is shown in Eq. (10). The time axis in this curve is the time from the start of the data acquisition. It turns out that the analog output of the electronic controller board processing the pressure transducer signal is available only for pressures less than approximately 20 torr (that corresponds to voltages less than 5 V). The data is fit very well by an exponential curve. We have extrapolated the curve backwards in time and determined the time at which the pressure equals 760 torr. This time is assumed to be the time t = 0 for the expansion process. Based on this curve we
NASA/TM—2009-215606 6

assume that the pressure in the test cell at any time t may be represented as
NASA/TM—2009-215606 7
) (10) ( ) ( ) ( tppptp fif 2421.0exp −−+=∞
has been obtained using software decomposition techniques. The software has successfully captured the growth dynamics of the air bubble exposed to vacuum.
Results where pi and pf are the initial and final pressures that the test cell is subjected. Many tests were performed to make sure that the apparatus
was working as designed. The outcomes of the study as well as experiments on the growth of air bubbles and ethanol drops are presented next.
Measurements The specific gravity of the silicone oil is approximately
0.978, its surface tension is 21.6 mN/m (dynes/cm) and the index of refraction is 1.4. The specific gravity of ethanol is 0.789 and the index of refraction is 1.36. Therefore, the interface between ethanol and silicone oil could be clearly seen in the experiments. To measure the size and location of bubbles and drops in the cuvette, images were taken using a long distance working microscope composed of the following: a 125XL lens and threaded TV tube attached to a CCD video camera module. The images were digitized using software. The droplet position and size were tracked as a function of time using the following methods.
Growth Dynamics of an Air Bubble The size of an air bubble inserted into the silicone oil
dramatically increases when the cuvette is subjected to a vacuum. The growth of a typical air bubble is shown in Figure 9. As mentioned earlier, a program script has been used to generate the outline of the bubble.
Figure 9 shows that the bubble grows to fill up the entire cuvette. The swelling of the liquid surface caused by the growing bubble is clearly seen. Since the liquid is incompressible, the liquid level in the cuvette rises to accommodate the increase in the volume of the bubble. If several bubbles are present initially, their growth causes a large increase in the volume, and the liquid can spill from the cuvette.
Manual Determination of Droplet Profile The digitized images are viewed in imaging software and
pixel coordinates of the outer edge of the droplet are determined using a point and click method (e.g., a pixel is selected with a mouse and pixel coordinates are displayed on the screen). These pixel coordinates are converted to Cartesian coordinates using a spreadsheet.
We also observed dissolution of an air bubble when it is injected into the silicone oil under atmospheric pressure. The shrinkage of the air bubble and its eventual collapse depends on whether the silicone oil was degassed or not in the degassed liquid; the dissolution of the bubble was observed to be much faster than in the nondegassed liquid. In performing experiments to observe the dynamics of the bubble growth, we took advantage of the bubble dissolution mentioned above to control the initial size of the bubble. After a bubble is inserted into the cuvette, its size was monitored and the vacuum pumps were turned on when the bubble size decreased to the desired value.
Automated Determination of Droplet Profile Digitized images are processed using a script program to
produce outlines of the droplets. The coordinates produced by script are imported into a spreadsheet. Figure 9 shows a sequence of digitized images. The silhouette of an air bubble

Figure 11 shows the experimental result for the growth of
an air bubble. The initial radius of the bubble is 0.477 mm. The silicone oil used in this experiment was not degassed. The pressure was lowered at t = 0 from 760 torr (1 atm) to 61 torr. Also, Figure 11 shows the theoretical prediction from the
Rayleigh-Plesset equation for this bubble, assuming that the pressure reduction is achieved instantaneously. The theoretical result predicts the final radius of the bubble to be approximately 1.1 mm, and the expansion process to be completed in approximately 0.2 sec. This is different from the experimental result, as can be seen from the comparison in Figure 11.
In Figure 11, we have also included the theoretical prediction when the pressure in the test cell is calculated from Eq. (10). The experimentally measured bubble radius is initially in agreement with this theoretical prediction, but is eventually larger than the theoretically predicted size. Figure 12 shows the experimental result for another bubble with an initial radius of 0.457 mm. In this case the silicone oil used was initially degassed. The cuvette was subjected to a lower pressure of 4.6 torr at t = 0. This bubble eventually elongates due to the confining nature of the walls of the cuvette. We tracked the size of the bubble as it grows, and included data only when the bubble is un-deformed.
Figure 12 shows the prediction from the Rayleigh-Plesset theory for this bubble assuming the pressure reduction to be instantaneous, and the comparison of the experimental result with the theoretical prediction, where the test cell pressure is a function of time, which is obtained from Eq. (10). In this case as well, the experimentally observed bubble size is larger than the theoretical prediction. We speculate that the difference between the experimental and theoretical results is due to mass transfer from the liquid to the growing bubble. The experimental results clearly show that the bubble does not achieve an equilibrium size and continues to grow well beyond the equilibrium size predicted by the Rayleigh-Plesset model. This suggests that dissolved gas is being transferred from the liquid to the bubble as the bubble grows in response to the reduction is pressure. This is surprising for the results shown in Figure 12 for which we presumed the liquid to be initially degassed.
Behavior of an Ethanol Droplet in Viscous Fluid
Homogeneous Nucleation
When ethanol drops were inserted into the silicone oil and the cuvette was subjected to a vacuum, we did not in general observe vaporization and flashing of the drops of ethanol in the bulk of the silicone oil. In other words, no homogeneous nucleation of ethanol vapor, followed by its growth, was observed in any of the experiments we performed. The typical behavior of an ethanol drop injected into the bulk of the silicone oil, away from the walls of the cuvette was as follows. Initially, the ethanol drop was totally encapsulated by the silicone oil. Since ethanol is lighter than the silicone oil, the buoyancy force caused the drop to move toward the silicone oil interface at the top of the cuvette. As the drop reached the interface, it is flattened as shown in Frame 1 in Figure 13. Ethanol diffuses through the thin layer of silicone oil above the drop to the vacuum at the top of the cuvette. The vacuum
NASA/TM—2009-215606 8

level above the cuvette was approximately 1×10⁻⁴ torr during the time the ethanol diffuses into the space above the cuvette.
Subsequently, when the silicone oil between the flattened drop and the interface drains, the drop flashes into vapor, as seen in Frame 20 in Figure 13. Each frame was 1/30 of a second apart. Flashing is detected by sudden opaqueness of the drop in the image. Note that the expanding vapor has “poked” through the interface (a few residual silicone oil drops are seen at the top of Frame 20), and escaped into the vacuum at the top of the cuvette. Soon after flashing, the volume occupied by the drop is seen to be occupied by vapor, which eventually escapes into the vacuum as well. After the drop flashed, the pressure dropped to approximately 1×10⁻⁶ torr. The entire process from injection of the drop (of volume 100 µliter) to when it reached the interface, diffused, and eventually flashed was about 3 1/2 hr.
Heterogeneous Nucleation Heterogeneous nucleation of ethanol vapor, and its
subsequent growth was observed in a few instances, and are listed below.
Nucleation from the wall.—Ethanol vapor nucleated from the wall of the cuvette in two different experiments, and is shown in Fig 14, showing that the nucleation and growth process repeats itself in a periodic manner. In this experiment the vapor nucleated from the walls of the cuvette.
The ethanol drop was initially deployed at the bottom of the cuvette, and the drop moved to the interface and escaped from the cuvette as mentioned in the discussion above. Subsequently we observed the heterogeneous nucleation process shown in Figure 14. Before the vapor nucleated, no ethanol drop was visible in the cuvette. We speculate that some ethanol from the drop must have dissolved in the silicone oil, and the dissolved ethanol found a favorable nucleation site at the bottom of the cuvette. Once the nucleation site became active, the process repeats for quite some time, presumably until all the dissolved material is depleted. A rising ethanol drop came close to this side wall of the cuvette earlier in the experiment; presumably there was some dissolution and the dissolved ethanol found a favorable nucleation site here as well.
Nucleation/Growth by Contact of a Drop With a Gas/Vapor Bubble
We observed the vaporization of ethanol drops when the drop came into contact with a growing gas bubble or a pre-existing gas bubble at equilibrium (nongrowing). In another experiment, glass beads were present in the injected ethanol drops. Trapped air or a nucleation site on the glass bead(s) led to the growing bubble. This growing bubble escaped from the interface of the silicone oil at the top of the cuvette. In this process, a few gas bubbles were created that remained in equilibrium within the silicone oil, near the interface. These bubbles are not growing—the pressure of the gas within the bubble must therefore be the equilibrium pressure for its size.
Conclusion Based on the results of our work we conclude that free gas
bubbles released into the silicone oil is the most likely source for bubble expansion under vacuum. Off-gassing of gases dissolved in the liquid does not appear to be a threat. There is some potential for the formation and growth of ethanol bubbles by heterogeneous nucleation. We have performed theoretical and experimental work on the expansion of a gas bubble and the nucleation of vapor bubbles in ethanol and bubbles of dissolved gas. The transparent liquid used in the experiments is a silicone oil of viscosity 300,000 cSt (2910 P), and remains constant with time. The expansion of a gas bubble has been theoretically modeled using the Rayleigh-Plesset equation, and the ideal gas law. The model predicts that when the viscosity of the liquid is 3500 P and independent of time, the expansion of a bubble of initial radius equal to 30 μm is nearly completed in approximately 15 sec. With the time varying viscosity, our theoretical prediction show that the time scale for the change in viscosity is too slow compared to the expansion time of the bubble, and virtually identical results are obtained when the viscosity is assumed to be equal to its initial viscosity. Results from homogeneous nucleation theory have been used to show that it is very unlikely that homogeneous nucleation can be achieved in these experiments.
Pre-existing air bubbles present in the liquid undergo a tremendous expansion when the liquid is exposed to vacuum. The results from experiments for the expansion of air bubbles are not in quantitative agreement with the theoretical model used. We
NASA/TM—2009-215606 9

NASA/TM—2009-215606 10
suspect that there might be mass transfer of dissolved gas from the liquid to the bubble as it grows in response to the pressure reduction. This effect is not included in the theoretical model, and more work needs to be performed to close the gap between the theoretical and experimental results. Due to the confining effect of the walls (ref. 8) of the cuvette used in the tests, the bubbles were observed to significantly elongate in the long dimension of the cuvette as they expand. We have also performed experiments on the behavior of nondegassed samples of silicone oil subjected to vacuum, and silicone oil in which ethanol drops are present. We found that (i) dissolved gas was not nucleated from the liquid in any of the experiments, (ii) vapor bubbles of ethanol were not generated from the ethanol drop in bulk of the silicone oil by homogeneous nucleation in any of the experiments, (iii) heterogeneous nucleation of ethanol vapor bubbles was observed in some cases when the ethanol drop came into contact with the wall of the cuvette, or came into contact with a pre-existing gas bubble. Even here, we find that in some, but not all the experiments, vapor bubbles were formed. We found that once a vapor bubble nucleated from the wall, the nucleation site was active throughout the course of the particular experiment. We did incorporate glass beads in some of the experiments, but the presence of the glass beads in causing nucleation of ethanol vapor is inconclusive.
References 1. Nahra, H.K., and Balasubramaniam, R., “Behavior of Bubble
Formation in Tile Repair Materials in Space Environment,” preliminary draft sent to the NASA Safety and Engineering Board, 5 May, 2005
2. Plesset, M.S., and Prosperetti, A., “Bubble dynamics and cavitation,” Annu. Rev. Fluid Mech. 9, 1977, pp. 145–185
3. Prosperetti, A., “Free oscillations of drops and bubbles: the initial-value problem,” J. Fluid Mech. 100, 1980, pp. 333–347.
4. Brennen, E., Cavitation and Bubble Dynamics, Oxford University Press, 1995
5. Venerus, D.C., and Yala, N., “Transport Analysis of Diffusion-Induced Bubble Growth and Collapse in Viscous Liquids,” AIChE J., 43(11), 1997, pp. 2948–2959.
6. Lienhard J.H., and Karimi, A., “Homogeneous Nucleation and the Spinodal Line,” J. Heat Transfer, 103, 1981, pp. 61–64.
7. Richards, B.E., and Trevena, D.H., “The measurement of positive and negative pressures in a liquid contained in a Berthelot tube,” J. Phys. D: Appl. Phys. 9, pp. 123–126
8. Popinet, S., and Zaleski, S., “Bubble collapse near a solid boundary: a numerical study of the influence of viscosity,” J. Fluid Mech., vol. 464, 2002, pp. 137–163.

REPORT DOCUMENTATION PAGE Form Approved OMB No. 0704-0188
The public reporting burden for this collection of information is estimated to average 1 hour per response, including the time for reviewing instructions, searching existing data sources, gathering and maintaining the data needed, and completing and reviewing the collection of information. Send comments regarding this burden estimate or any other aspect of this collection of information, including suggestions for reducing this burden, to Department of Defense, Washington Headquarters Services, Directorate for Information Operations and Reports (0704-0188), 1215 Jefferson Davis Highway, Suite 1204, Arlington, VA 22202-4302. Respondents should be aware that notwithstanding any other provision of law, no person shall be subject to any penalty for failing to comply with a collection of information if it does not display a currently valid OMB control number. PLEASE DO NOT RETURN YOUR FORM TO THE ABOVE ADDRESS. 1. REPORT DATE (DD-MM-YYYY) 01-03-2009
2. REPORT TYPE Technical Memorandum
3. DATES COVERED (From - To)
4. TITLE AND SUBTITLE Vapor-Gas Bubble Evolution and Growth in Extremely Viscous Fluids Under Vacuum
5a. CONTRACT NUMBER
5b. GRANT NUMBER
5c. PROGRAM ELEMENT NUMBER
6. AUTHOR(S) Kizito, John; Balasubramaniam, R.; Nahra, Henry; Agui, Juan; Truong, Duc
5d. PROJECT NUMBER
5e. TASK NUMBER
5f. WORK UNIT NUMBER WBS 825080.01.02.20.01
7. PERFORMING ORGANIZATION NAME(S) AND ADDRESS(ES) National Aeronautics and Space Administration John H. Glenn Research Center at Lewis Field Cleveland, Ohio 44135-3191
8. PERFORMING ORGANIZATION REPORT NUMBER E-16896
9. SPONSORING/MONITORING AGENCY NAME(S) AND ADDRESS(ES) National Aeronautics and Space Administration Washington, DC 20546-0001
10. SPONSORING/MONITORS ACRONYM(S) NASA
11. SPONSORING/MONITORING REPORT NUMBER NASA/TM-2009-215606; AIAA-2009-1147
12. DISTRIBUTION/AVAILABILITY STATEMENT Unclassified-Unlimited Subject Categories: 34 and 27 Available electronically at http://gltrs.grc.nasa.gov This publication is available from the NASA Center for AeroSpace Information, 301-621-0390
13. SUPPLEMENTARY NOTES
14. ABSTRACT Formation of vapor and gas bubbles and voids is normal and expected in flow processes involving extremely viscous fluids in normal gravity. Practical examples of extremely viscous fluids are epoxy-like filler materials before the epoxy fluids cure to their permanent form to create a mechanical bond between two substrates. When these fluids flow with a free liquid interface exposed to vacuum, rapid bubble expansion process may ensue. Bubble expansion might compromise the mechanical bond strength. The potential sources for the origin of the gases might be incomplete out-gassing process prior to filler application; regasification due to seal leakage in the filler applicator; and/or volatiles evolved from cure reaction products formed in the hardening process. We embarked on a study that involved conducting laboratory experiments with imaging diagnostics in order to deduce the seriousness of bubbling caused by entrained air and volatile fluids under space vacuum and low gravity environment. We used clear fluids with the similar physical properties as the epoxy-like filler material to mimic the dynamics of bubbles. Another aspect of the present study was to determine the likelihood of bubbling resulting from dissolved gases nucleating from solution. These experimental studies of the bubble expansion are compared with predictions using a modified Rayleigh-Plesset equation, which models the bubble expansion. 15. SUBJECT TERMS Bubbles; Pressure; Viscosity; Gas; Density; Temperature; Viscous; Vacuum
16. SECURITY CLASSIFICATION OF: 17. LIMITATION OF ABSTRACT UU
18. NUMBER OF PAGES
16
19a. NAME OF RESPONSIBLE PERSON STI Help Desk (email:[email protected])
a. REPORT U
b. ABSTRACT U
c. THIS PAGE U
19b. TELEPHONE NUMBER (include area code) 301-621-0390
Standard Form 298 (Rev. 8-98)Prescribed by ANSI Std. Z39-18