Controlled electrochemical gas bubble release from ...
32
HAL Id: hal-00642540 https://hal.archives-ouvertes.fr/hal-00642540 Submitted on 18 Nov 2011 HAL is a multi-disciplinary open access archive for the deposit and dissemination of sci- entific research documents, whether they are pub- lished or not. The documents may come from teaching and research institutions in France or abroad, or from public or private research centers. L’archive ouverte pluridisciplinaire HAL, est destinée au dépôt et à la diffusion de documents scientifiques de niveau recherche, publiés ou non, émanant des établissements d’enseignement et de recherche français ou étrangers, des laboratoires publics ou privés. Controlled electrochemical gas bubble release from electrodes entirely and partially covered with hydrophobic materials Charles Brussieux, Philippe Viers, Herve Roustan, Mohammed Rakib To cite this version: Charles Brussieux, Philippe Viers, Herve Roustan, Mohammed Rakib. Controlled electrochemical gas bubble release from electrodes entirely and partially covered with hydrophobic materials. Electrochim- ica Acta, Elsevier, 2011, 56 (20), pp.7194-7201. 10.1016/j.electacta.2011.04.104. hal-00642540
Transcript of Controlled electrochemical gas bubble release from ...

HAL Id: hal-00642540https://hal.archives-ouvertes.fr/hal-00642540
Submitted on 18 Nov 2011
HAL is a multi-disciplinary open accessarchive for the deposit and dissemination of sci-entific research documents, whether they are pub-lished or not. The documents may come fromteaching and research institutions in France orabroad, or from public or private research centers.
L’archive ouverte pluridisciplinaire HAL, estdestinée au dépôt et à la diffusion de documentsscientifiques de niveau recherche, publiés ou non,émanant des établissements d’enseignement et derecherche français ou étrangers, des laboratoirespublics ou privés.
Controlled electrochemical gas bubble release fromelectrodes entirely and partially covered with
hydrophobic materialsCharles Brussieux, Philippe Viers, Herve Roustan, Mohammed Rakib
To cite this version:Charles Brussieux, Philippe Viers, Herve Roustan, Mohammed Rakib. Controlled electrochemical gasbubble release from electrodes entirely and partially covered with hydrophobic materials. Electrochim-ica Acta, Elsevier, 2011, 56 (20), pp.7194-7201. �10.1016/j.electacta.2011.04.104�. �hal-00642540�
* Corresponding author, Tel +33 1 41 13 15 56; e-mail: [email protected]
Controlled electrochemical gas bubble release from electrodes entirely and
partially covered with hydrophobic materials
Brussieux Cx., Viers Ph.x, Roustan H.+ ,Rakib M.*x
x Ecole Centrale Paris, Laboratoire de Génie des Procédés et Matériaux
Grande Voie des Vignes, 92295 Châtenay-Malabry Cedex
+ Rio-Tinto Alcan Aluval-EMRA
725 rue Aristide Berges BP 7-38341 Voreppe Cedex
Abstract
This paper deals with an experimental study on millimetre-size
electrochemically evolved hydrogen bubbles. A method to generate gas bubbles
controlled in number, size at detachment and place on a flat electrode is reported.
Partially wetted composite islands are implemented on a polished metal substrate.
As long as the island size is lower than a limit depending on its wettability, only one
bubble spreads on the island and its size at detachment is controlled by the island
perimeter. The composite, a metal-polytetrafluoroethylene (Ni-PTFE), is obtained by
an electrochemical co-deposition process. On the contrary to predictions of available
models for co-deposition, at current densities beyond Ni2+ limiting current density, the
mass ratio of PTFE in the deposit strongly increases. A mechanism is proposed to
describe co-deposition when hydrogen bubbles are co-evolved. The observation of
gas evolution on fully hydrophobic electrodes highlights the fact that bubbles growth
rate on such electrodes differs from growth rates when bubble growth is controlled by
mass transport of dissolved gas. The more a bubble grows by coalescence the more
its foot expands on the electrode the bigger its size at detachment. This triple line
creeping mechanism explains why, when attached bubbles coalesce many times
before detaching, their size at detachment increases with current density.

2
Keywords: gas evolving electrode, Ni PTFE, controlled bubbles, wettability,
hydrophobic electrode
1. Introduction
Electrochemical gas evolution was studied thoroughly in aqueous solutions for
its applicability in numerous industrial processes [1-4]. This study was undertaken
with the aim to gain new insights on four persistent problems in the description of gas
evolving electrolysis, namely:
- Most of the available data and models refer to hydrogen, oxygen and
chlorine evolving in the form of small bubbles on well wetted electrode materials.
These descriptions are irrelevant to characterize bubbles observed during
electrolysis in molten salts. To illustrate this point, fluorine bubbles obtained in KF-
2HF melts are described in [5].
- Despite recent developments [6-9] enabling a precise mathematical
description of attached bubbles and drops by overcoming the boundary condition
problem in fluid mechanics equations brought by the infinite viscous diffusion at the
triple line [10], modelling the bubbles size at detachment remains an open question
[11]. In aqueous electrolytes with well wetted electrode materials the anchoring area
of electrochemically evolved bubbles is difficult to observe and consequently was
rarely studied.
- Models of gas evolving electrolysers are becoming more and more reliable
thanks to the use of Eulerian or Lagrangian descriptions of the disperse phase flow.
See [12-13] for recent examples. However, the amplitude of the forces responsible
for the variations of the width of the bubble plume is still a subject of discussion [14].
As a consequence, the lift force and turbulent dispersion forces are used to tune
models implying that experimental checks are required.

3
- To the best of our knowledge, a simple way to obtain gas bubbles which are
controlled in number, size at detachment and place on a flat electrode during water
electrolysis was never reported. Repeatable bubbles were obtained by water
electrolysis on a small electrode when only one bubble settles on the electrode; this
has been illustrated in various aspects [15-18]. On flat electrodes, artificial cavities or
the border of the electrode can be used to obtain repeatable bubbles [19-20] in small
number and with small size at detachment. Electrodes on which the average bubble
size at detachment is controlled have been reported [21-23] but the exact number of
bubbles and the size of each bubble were not known.
This study is focused on a way to obtain a highly hydrophobic electrode material
to examine the gas release on electrodes with a high gas coverage on which the
bubble anchoring area are viewable and the detached populations shifted to higher
size. The gas release was examined on two kinds of electrodes, electrodes fully
covered with a hydrophobic material and electrodes partially covered with
hydrophobic material. On the second kind of electrodes, bubbles from the
hydrophobic material are controlled in number and size at detachment.
2. Experimental details
2.1 Hydrophobic electrode preparation and testing
Square 2.25 cm2 copper electrodes bordered with epoxy resin were covered
with a cathodic deposit of Ni-PTFE composite. The cell was cubic and contained 0.75
L of the bath proposed by Bouazaze et al. [23]. The bath is composed of a PTFE
suspension supplied by Aldrich (60% mass) and of a solution of NiSO4 0.26 mol L-1,
H3BO3 0.11 mol L-1, NH4Cl 0.11 mol L-1, Triton X100 0.01 mol L-1 in water at pH 6.
Thirty electrodes were prepared varying the PTFE suspension mass ratio from 0 to

4
40% and the average deposition current density between 25 and 600 A m-2. Each
deposition was carried out under galvanostatic control with an Autolab PGSTAT30
potentiostat/galvanostat for 30 minutes. The anode was a flat 8 cm2 nickel electrode.
The anode and the cathode were parallel with a 1 cm gap. The bath was stirred.
After the deposition process the electrodes were cleaned in an ultrasonic bath
containing ethanol 95%. A white lightly-green crust which can form at cathodic
current densities beyond 150 A m-2 was then scraped to reveal a shiny black deposit.
In order to characterize these deposits, three types of measurements were
performed.
- The wettability of the deposits was measured with a TECLIS tensiometer using a
dynamic sessile distilled water drop contact angle measurement. The sessile drop
volume was initially 5 µL and then successively filled and drained at 0.1 µL s-1
between the advancing and receding contact angle.
- The deposits surface was observed using a scanning electron microscope with a
field emission gun (SEM-FEG).
- The H2 gas release during water electrolysis was observed on the deposits with a
technique described in §2.3.
2.2 Design of an electrode partially covered with hydrophobic islets using
photolithography and electrochemical co-deposition
A hydrophobic material was deposited on disc shaped islands with a
photolithographic method on flat copper electrodes. The electrodes were the face of
a 28 mm diameter polished copper disc. The borders of the disc were embedded with
an insulating resin which wets metal well. A photoresist was sprayed on the
electrode. After a drying time the electrode was exposed to UV light under a negative
transfer paper mask and then revealed. Different mask layouts have been tested.
5
Mask layout examples are shown in figure 1. On figure 1-(A), rows of pairs of
anchoring sites were placed with an increasing gap, this layout was used to observe
the impact of coalescence on bubble size at detachment. The layout on figure 1-(B)
was used to observe the impact of the hydrophobic islet size on bubble size at
detachment.
Although the deposition technique used is slightly different than previously
(§2.1), the cell, bath composition and stirring were unchanged. A disc electrode was
horizontal facing upwards at 3 cm from the anode. A L-shaped saturated calomel
reference electrode was used to control the deposition potentiostatically. Hereafter
the potentials are expressed after ohmic drop correction. The deposits on the
unmasked part of the electrode were realised with 100 cycles of 30 s at Edep = -1.25
V / SCE followed by 30 s at - 0.6 V / SCE with a potentiostat. Experimentally, at -1.25
V / SCE the average deposition current density on the unmasked surface is between
300 and 600 A m-2 whatever the mask layout and the deposition conditions. After
deposition the photoresist was cleaned. The electrode was rinsed with 95 % ethanol
and dried.
2.3 Gas release observation and bubble size measurement
A cubic transparent polycarbonate 10 cm large cell was filled with 0.85 L of 0.5
mol L-1 NaOH. The electrodes were conditioned for 500 s at 500 A m-2. Electrolysis
was realised under galvanostatic control. Hydrogen was evolved at the cathode and
oxygen at the anode. The modified electrode was mounted as a cathode. The anode
was a 3 cm diameter graphite disc parallel to the cathode at a distance of 6 cm. The
cell was splitted into two compartments with a Z-shaped filter paper. The cell could
rotate at 180° around the observation axis, tangential to the cathode. When not
specified, the results have been obtained with a horizontal electrode facing upwards.
6
Any bubbles present in the cell were removed prior to experiment. The observations
were done with a high speed camera (PCO 1200hs) mounted on a microscope
(Zeiss STEMI SV-11) placed on a horizontal rack. A mirror may be placed between
the electrodes for direct periscope observations of the gas release. The electrodes
were illuminated with a fiber optic cold light source.
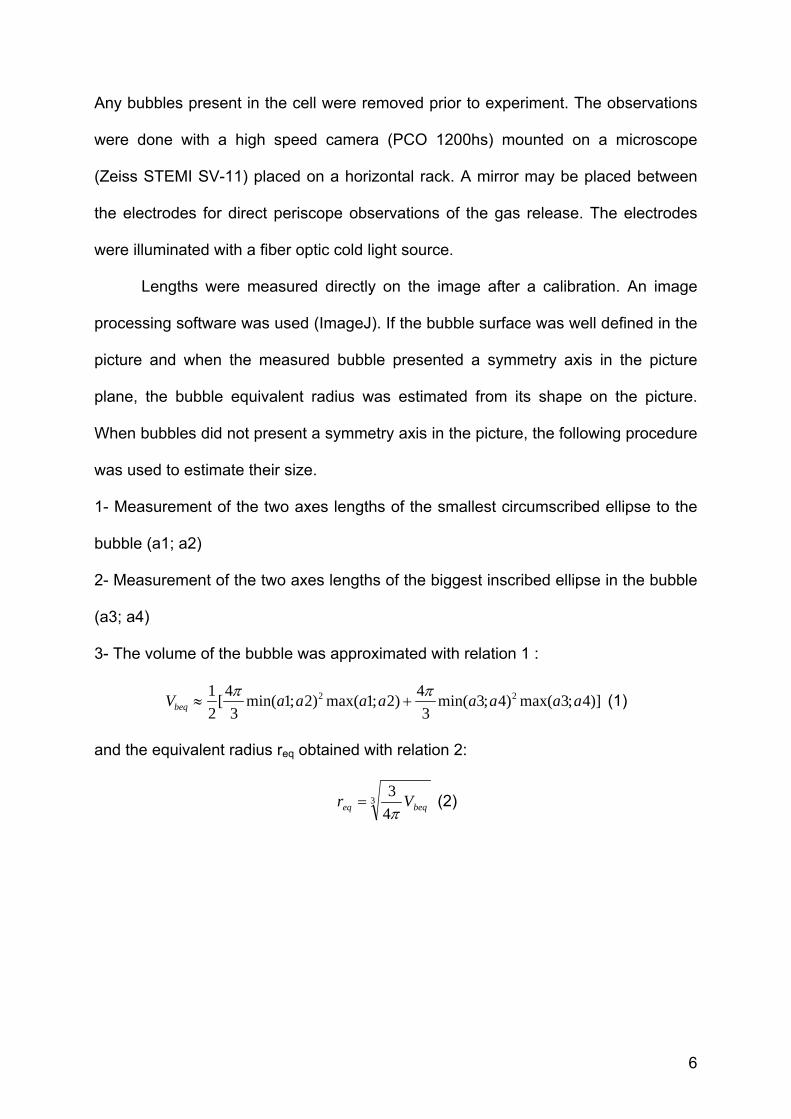
Lengths were measured directly on the image after a calibration. An image
processing software was used (ImageJ). If the bubble surface was well defined in the
picture and when the measured bubble presented a symmetry axis in the picture
plane, the bubble equivalent radius was estimated from its shape on the picture.
When bubbles did not present a symmetry axis in the picture, the following procedure
was used to estimate their size.
1- Measurement of the two axes lengths of the smallest circumscribed ellipse to the
bubble (a1; a2)
2- Measurement of the two axes lengths of the biggest inscribed ellipse in the bubble
(a3; a4)
3- The volume of the bubble was approximated with relation 1 :
)]4;3max()4;3min(3
4)2;1max()2;1min(
3
4[
2
1 22 aaaaaaaaVbeq
(1)
and the equivalent radius req obtained with relation 2:
3
4
3beqeq Vr
(2)
7
3. Results and discussion
3.1 Hydrophobic deposits, impact of the current density during deposition on
PTFE mass ratio and wettability
The PTFE distribution on the deposits surface was observed with SEM-FEG.
In the pictures presented hereafter in figures 2, 3 and 4 the PTFE appears in the form
of blurred rounded patterns. We define the current density during deposition jdep as
the ratio of the cell current to the initial geometrical electrode surface.
-The deposits prepared with current density jdep < 100 A m-2 are very porous with
pores similar to those obtained using similar deposition bath without PTFE [24].
Those deposits have a metallic grey visual aspect and PTFE is present on dispersed
micrometric clusters and in the pores. An example of SEM-FEG pictures of such a
deposit is given in figure 2.
- Near jdep = 100 A m-2 the deposits are columnar. The Ni columns width decrease
but their heights increase with increasing current densities and PTFE clusters are
present at the columns base. Those deposits have a grey-dark or a grey marbled
visual aspect. Examples are given in figure 3. In this figure the columns size and
PTFE clusters at the columns base appear clearly.
- For jdep > 150 A m-2 the deposits are covered with a white, light green and not
adhesive crust composed mostly of PTFE. Once the crust removed, a shiny black
deposit appears. This deposit is composed with a dense thin nickel dendrites network
with PTFE filling the inter dendrites spaces. Pictures of a shiny black deposit are
given in figure 4.
Figure 5 shows the measured advancing and receding contact angles of a
deionised water droplet on the deposits versus the average current density during the
co-deposition process for the whole experimental range of PTFE suspension mass-

8
ratio in the deposition bath. Until jdep = 100 A m-2, the deposit wettability increases
with an increasing deposition current density. This increase in wettability denotes a
decrease in the PTFE mass-ratio in the deposit in agreement with an existing model
[25] assuming a mechanism of adsorbed particles entrapment for Ni-PTFE
electrochemical deposition or with a sedimentation co-deposition mechanism [23]. At
current densities higher than 100 A m-2 the electrode material wettability decreases
again and is very small when the deposition current density is higher than
approximately 300 A m-2.
To explain the increase in PTFE ratio in the deposits beyond 100 A m-2, we
propose the following mechanism consisting of the combined intervention of three
phenomena. The first process of the mechanism is the destabilisation of the PTFE
suspension in the bath by growing H2 bubbles. During this step the surfactants
stabilizing the PTFE suspension are captured at the bubbles/electrolyte interfaces
letting the PTFE particle free to aggregate. The second process is the aggregation of
free PTFE particles with clusters of PTFE particles on the electrode surface. The last
phenomenon is the electrochemical growth of the Ni deposit trapping the clusters at
the surface. Such a mechanism would lead to a PTFE content related to the surface
of H2 bubbles evolved. A complementary experiment proved that metal deposition is
not necessary for the formation of PTFE clusters on a metal cathode. During this
experiment the formation of pure PTFE clusters on a pure Ni cathode was observed
after water electrolysis in a bath composed of PTFE suspension and NaOH.
3.2 Gas release from an electrode fully covered with a hydrophobic deposit
An electrode prepared as described in §2.1 will be called a hydrophobic
electrode. The current density during water electrolysis jwel is the ratio of the cell
current during water electrolysis to the geometrical electrode surface taking into

9
account the surface covered with Ni-PTFE and the uncovered surface when this last
one exists. The size distribution of the H2 bubbles population during water electrolysis
on these electrodes was measured. A Ni-PTFE electrode prepared at high deposition
current density evolved large size H2 bubbles, their diameter can attain one
centimeter. Figure 6 presents pictures of a 5.5 mm equivalent diameter H2 bubble
before and after detachment from a shiny black Ni-PTFE electrode material.
A striking aspect of the gas release from highly hydrophobic electrodes is the
high gas coverage and the very important link between bubble size at detachment
and current density. The high gas coverage implies that bubbles grow more due to
coalescence rather than from mass transport with dissolved gas. The coalescence of
two bubbles produces a third bubble. Considering that the biggest of the two initial
bubbles is the third bubble, the volume of this locally biggest bubble increases
linearly with time. Between important size fluctuations, the mature bubbles equivalent
radius is proportional to the cube root of residence time and the growth rate is a
function of average current density jwel and anchoring area circumference. This
aspect of gas release at hydrophobic electrodes is in contrast to the common
aqueous gas evolving electrolysis case where the growth is due to dissolved gas
mass transfer from the electrode to the bubble surface. In this common case the
bubble radius is proportional to the square root of residence time and the growth rate
is a function of gas supersaturation in the bubble vicinity [26-28].
Since on highly hydrophobic electrodes, the triple line is observable without
experimental effort it was possible to notice that besides the fact that bubble size at
detachment is a function of the electrode material wettability, the bubble size at
detachment turns out to be highly dependent on the growth dynamics of its triple line.
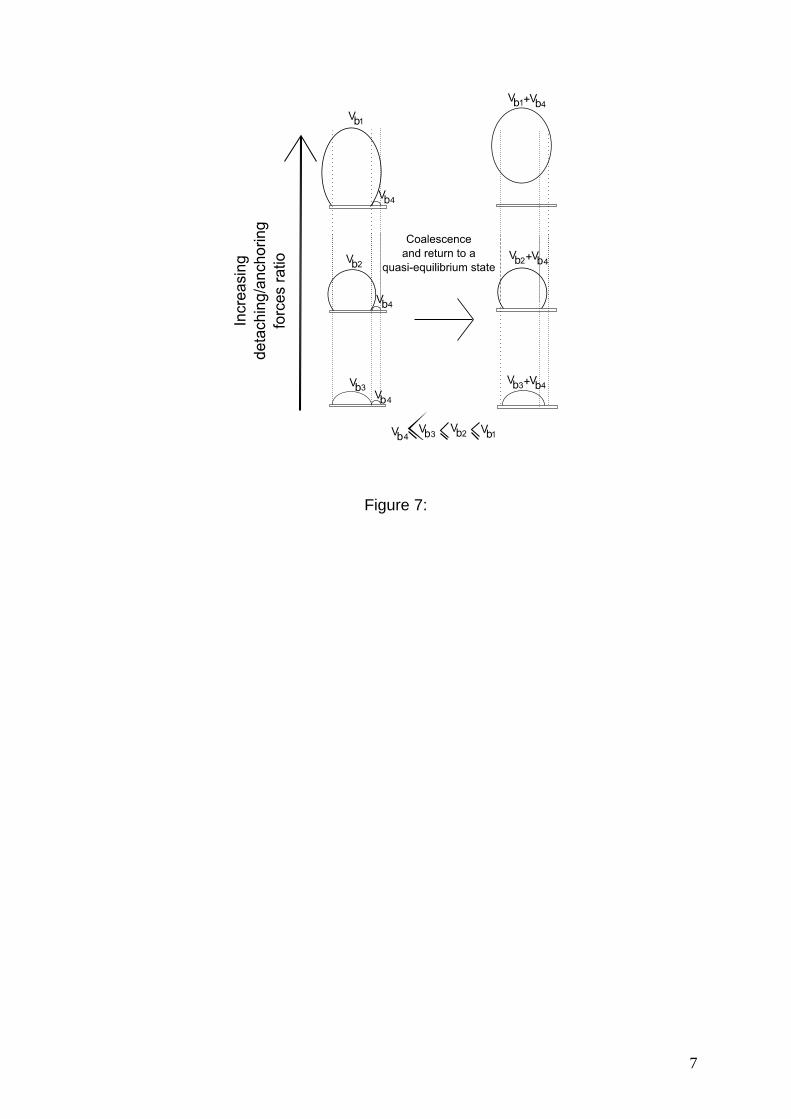
The outcome of coalescence is generally an increase in triple line length or the

10
bubble detachment. When coalescence does not lead to a detachment, the smaller
the detaching/attaching force ratio, the higher the ratio between the two triple lines
length before coalescence and the triple line length after coalescence. An impacting
parameter is the volume ratio between the two bubbles. When both volumes are
similar, the triple lines position changes more than when the two coalescing bubbles
volumes are very different. This phenomenon is schematically depicted in figure 7 but
would deserve a mathematical description. As long as the detachment forces tend to
increase with bubble volume, most increase in triple lines lengths occurs in the early
moments after nucleation. Mature bubbles approaching their size at detachment only
see their triple line modified if coalescence occurs with a similar size bubble.
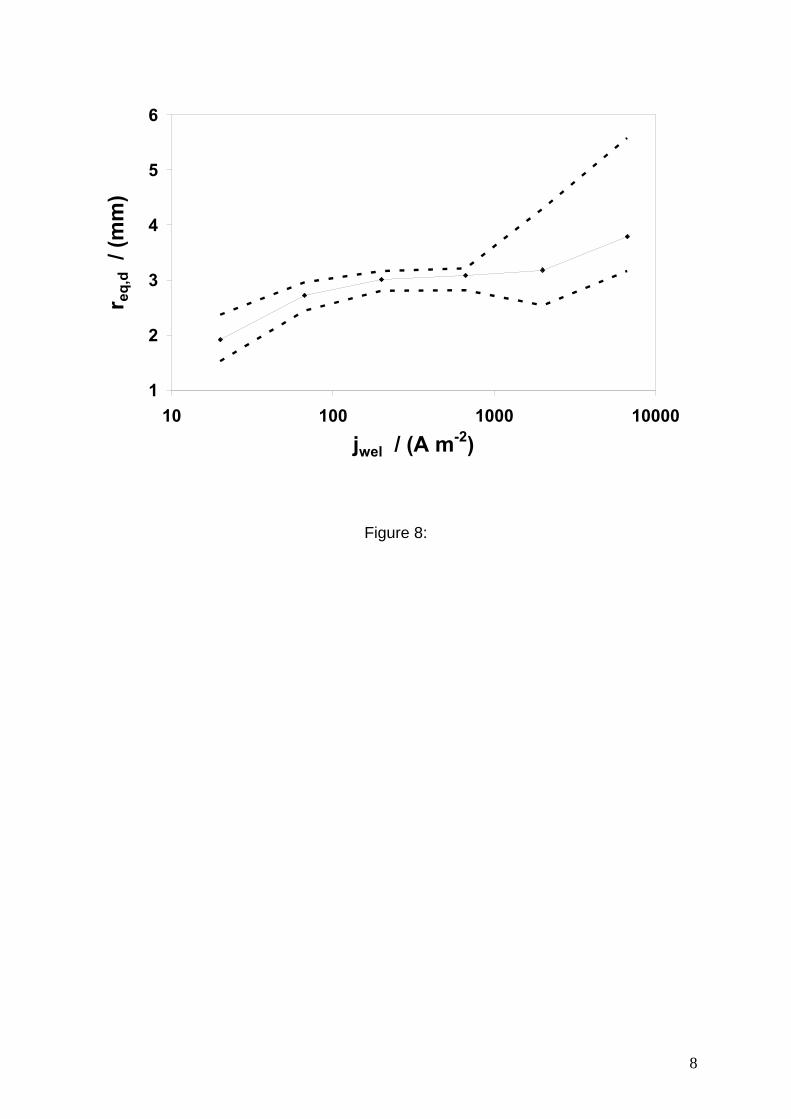
The coalescence frequency between attached bubbles is related to the rate of
gas evolution, thus bubble triple line length growth rate increases with increasing
current density. As long as the bubble size at detachment is increasing with
increasing triple line length, the bubble size at detachment is increasing with
increasing current density. This effect is especially pronounced on hydrophobic
electrodes as shown in figure 8.
3.3 Gas release observations from a partially covered electrode
The copper electrode partially covered with Ni-PTFE islets produce small H2
bubbles from the uncovered surface and bigger H2 bubbles from the composite islets.
As long as the hydrophobic islands are sufficiently small, only one large bubble
settles on each hydrophobic islands of the electrode. The biggest covered islands
depend on the detaching/anchoring forces ratio; the detaching forces are buoyancy
and hydrodynamic forces. In stagnant NaOH, the largest hydrophobic islets covered
with only one bubble on a flat electrode facing upwards were 2 mm in diameter.
Bubbles covering a hydrophobic disc are formed by the coalescence of micrometre

11
dimension bubbles which have nucleated on the entire hydrophobic site surface. This
site-covering step is very short in duration compared to the residence time of the
formed bubble. As a consequence there is no waiting time between a detachment
and the following nucleation for the bubbles attached at the Ni-PTFE discs. At this
point, the bubbles attached on the Ni-PTFE islets differ from the common nucleation
behaviour on a nucleation site for which a waiting time can be observed between a
detachment and the successive nucleation [28]. Therefore strictly speaking the term
“waiting time” is not appropriate since there is not only one nucleation site on the
hydrophobic islet. In stagnant electrolyte at current densities lower than jwel ≈ 50 A m-
2 nucleation only occurs on those hydrophobic islands. Beyond jwel ≈ 50 A m-2 H2 is
evolved on the entire electrode but the H2 bubbles from the copper part of the
electrode are of about 20-100 µm in diameter and do not modify the behaviour of
bubbles settling on hydrophobic islands below jwel = 20 kA m-2. Figure 9 presents the
measured bubble equivalent radius for eleven consecutives bubbles from the same
anchoring site versus time compared to an optimised elreq tKr , law. For this
measurement the sampling frequency was not sufficient to observe the radius at the
very first moments of the bubble life but the absence of a noticeable “waiting time” is
observed.
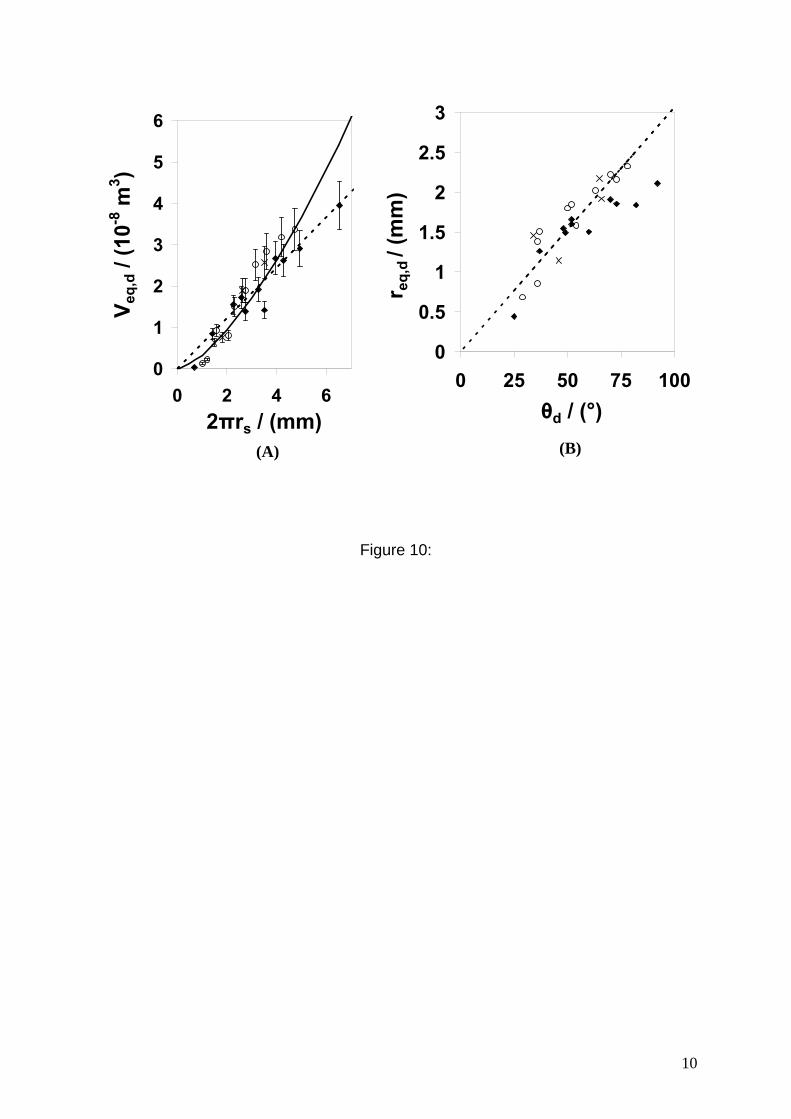
The detachment size and contact angle before detachment were controlled by
the perimeter of the bubble triple line length. If a bubble fully covers a hydrophobic
disc its size at detachment is controlled by the islet perimeter. Figure10-(A) presents
a plot of bubbles’ volume at detachment versus the anchoring site perimeter on
electrodes covered with hydrophobic islets varying in size. The data are compared
with a fitted linear and a fitted 3/2 power law. The contact angle varies all along the
bubble life. Figure 10-(B) is the plot of measured radius at detachment versus contact

12
angle just before detachment and compares the results with the well known
correlation 3 [29]. It confirms that the contact angle at detachment of an axisymmetric
bubble is an indirect measure of the bubble anchoring zone.
)/(0104.0 gr dd (3)
The observation of bubbles coalescing from their equatorial diameter as shown in
Figure 11-(A) lead to the conclusion that two neighbouring bubbles behave in
different ways depending on the distance between their anchoring line and their site
size. These observation are summarized by figure 11-(B) which presents results
obtained with rs = 150 µm at jwel =10 A m-2. rdi is the radius at detachment from a
single site producing a single bubble not subjected to coalescence, L is the smallest
distance between sites centre. The following details are observed:
L/2 < 0.2 rdi the newly formed bubble remains attached on the two sites and
then will detach at a radius greater than rdi,(rs = 150 µm).
0.2 rdi < L/2 < 0.4 rdi the newly formed bubble can remain on the two sites or
can remain on one site or can detach.
0.4 rdi < L/2 <0.6 rdi the newly formed bubble can only remain on one site or
detach. When the bubble remains on only one hydrophobic islet its size at
detachment tends to be lower than rdi because of further coalescence with
other bubbles forming at the second islet.
0.6 rdi < L/2 < rdi the newly formed bubble always detach. This aspect is
interesting because it highlights the importance of dynamic effects on the
outcome of coalescence. When coalescence occurs between two bubbles
whose radii are r ≥2-1/3 rdi , the sum of their volume is higher or equal than Vbi
and the occurrence of detachment is understandable. The fact that bubbles
can detach at coalescence with radii below 2-1/3 rdi is thus proof of the impact
13
of dynamic effects. Such experiments are a way to quantify the impact of
dynamic effects on triple lines behaviour and are of interest to benchmark
models which are still to be developed.
L/2 > rdi no coalescence occurs and rd = rdi
Such a finding is not providing a deep insights in the bubble size at detachment
problem but could be useful to benchmark future mathematical tools inspired from [6-
9] which are required to solve the problem of bubble size at detachment. This
problem must be solved to allow the simulation of processes at gas evolving
electrodes.
4. Conclusion
A new method to produce repeatable bubbles growing from supersaturation
was assessed. The method consists of the creation of anchoring sites where
wettability is subjected to significant microscopic variations on a well wetted material.
The anchoring properties of the material are related to the biggest area covered by a
bubble or the biggest bubbles at detachment or to the maximum bubble contact
angle observed before detachment. We have observed that coalescence can lower
drastically bubble size at detachment. Depending on the anchoring properties of the
material and distance between bubbles, coalescing bubbles can remain attached and
cover a bigger electrode area or detach within a period of the gravito-capillary
oscillations of the newly formed bubble. Such controlled bubbles are of interest for
the study of gas evolving electrodes, and particularly, the study of electrode
screening, ohmic drop and mass transfer processes. A controlled population of
attached bubbles allow to envisage the development of experimental checks for
bubble induced mass transfer models [1,2], supersaturation lowering effect of

14
attached bubbles [30] and gas evolution efficiency models [31-32]. Such bubbles also
facilitate surface tension measurements by the pendant bubble method.
The study of gas release during water electrolysis from a hydrophobic
electrode is of interest because of its similarity with gas release in some molten salt
electrolysis. The study highlights the fact that bubble dynamics on partially wetted
electrode is very different to bubble dynamics from well wetted electrodes. On
hydrophobic electrodes the bubble size at detachment increase with increasing
current density because of a relation between bubble anchoring zone and nucleation
frequency. Between large size changes due to coalescence with same size bubbles,
bubbles volume increase linearly with time proportionally to bubble circumference
and to gas evolution rate.
The Ni-PTFE electrochemical deposition was studied to obtain a hydrophobic
charge-conducting surface. It was shown that at very high current density large PTFE
clusters are formed. It was suggested that this phenomenon results from the
destabilisation of PTFE suspension by the co-evolved gas.
List of symbols
Dimensional quantities:
d Diameter (m)
E Electrode polarisation (V vs. reference)
g Earth gravitational acceleration ~9.81 (m s-2)
j Current density (A m-2)
K Bubble growth rate coefficient (m s-1/2)
L Distance between two nearest Ni-PTFE islets’ centre (m)
r Radius (m)
t Time (s)
15
V Volume (m3)
θ Contact angle (°)
σ Surface tension liquid-gas interface here~7.5 10-2 (20°C) (N m-1)
Δρ Density difference between electrolyte and gas ~103 (kg m-3)
Subscripts:
c At coalescence
d At detachment
dep Deposition
el Electrode
eq Equivalent
i Isolated - not coalescing
r Residence
s Ni-PTFE disc shaped island
wel Water electrolysis
Other:
max, min Maximum and minimum functions
Bibliography
[1] H. Vogt, in: E. Yeager (Ed.) , J. O. M. Bockris (Ed.) , B. E. Conway (Ed.)
Comprehensive treatise of electrochemistry, Vol. 6, Plenum Press, New York,
1983.
[2] P. J. Sides, in B. E. Conway (Ed.), J. O. M. Bockris (Ed.) and R. E. White (Ed.)
Modern aspects of electrochemistry, Vol.18, Springer, Berlin, 1987.
[3] H. Wendt, G. Kreysa, in Electrochemical Engineering, Springer, Berlin, 1999
[4] H. Vogt, G. Kreysa, Electrochemical reactors, in: Ullmann's Encylopedia of
Industrial Chemistry, Wiley, Weinheim, 2008.

16
[5] H. Groult, J. Fluorine Chem. 119 (2003) 173.
[6] E. B. Dussan, R. T. P. Chow, J. Fluid Mech. 137 (1983) 1.
[7] E. B. Dussan, J. Fluid Mech. 151 (1985) 1.
[8] P. D. M. Spelt, J. Comput. Phys. 207 (2005) 389.
[9] J. B. Dupont, D. Legendre, J. Comput. Phys. 229 (2010) 2453.
[10] C. Huh, L. E. Scriven, J. Colloid Interface Sci. 35 (1971) 85.
[11] H. Vogt, Electrochim. Acta 34 (1989) 1429.
[12] F. Jomard, J. P. Feraud, J. Morandini, Y. D. T. Couvat, J. P. Caire, J. Appl.
Electrochem. 38 (2008) 297.
[13] T. Nierhaus, H. Van Parys, S. Dehaeck, J. Van Beeck, H. Deconinck, J.
Deconinck, A. Hubin, J. Electrochem. Soc. 156 (2009) 139.
[14] T. Hibiki, M. Ishii, Chem. Eng. Sci. 62 (2007) 6457.
[15] H. F. A. Verhaart, R. M. Dejonge, S. J. D. Vanstralen, Int. J. Heat Mass Transfer
23 (1980) 293.
[16] C. W. M. P. Sillen, Thesis, Eindhoven Technical University, Eindhoven, 1983.
[17] N. P. Brandon, G. H. Kelsall, J. Appl. Electrochem. 15 (1985) 475.
[18] R. L. Stover, Thesis, Ernest Orlando Lawrence Berkley National Laboratory,
Berkley, 1996.
[19] A. Volanschi, W. Olthuis, P. Bergveld, Sens. Actuators, A 52 (1996) 18.
[20] C. Gabrielli, F. Huet, R. P. Nogueira, Electrochim. Acta 50 (2005) 3726.
[21] O. Teschke, F. Galembeck, J. Electrochem. Soc. 131 (1984) 1095.
[22] M. U. Kleinke, M. A. B. de Moraes, O. Teschke, J. Electrochem. Soc. 133 (1986)
1815.

17
[23] H. Bouazaze, S. Cattarin, F. Huet, M. Musiani, R. P. Nogueira, J. Electroanal.
Chem. 597 (2006) 60.
[24] F. Huet, M. Musiani, R. P. Nogueira, J. Solid State Electrochem. 8 (2004) 786.
[25] P. Bercot, E. Pena-Munoz, J. Pagetti, Surf. Coat. Technol. 157 (2002) 282.
[26] L. E. Scriven, Chem. Eng. Sci. 10 (1959) 1.
[27] J. P. Glas, J. W. Westwater, Int. J. Heat Mass Transfer 7 (1964) 1427.
[28] W. M. Buehl, J. W. Westwater, AIChE J. 12 (1966) 571.
[29] W. Fritz, Phys. Z. 36 (1935) 379.
[30] Dukovic J., Tobias C. W., J. Electrochem. Soc. 134, (1987) 331
[31] Vogt H., Electrochim. Acta, 56 (2011) 1409
[32] Vogt H., Electrochim. Acta, 56 (2011) 2404
Acknowledgments
This work was done within the framework of the project MAPR-0022 AMELHYFLAM.
The authors want to acknowledge the ANR (Agence Nationale pour la Recherche) for
its financial support and to thank all the partners involved in the project.

18
Figures captions
Figure 1: Scheme of positive masks used for insulation
Figure 2: SEM-FEG picture of a deposit surface prepared with à 40% mass PTFE
suspension bath with a current density lower than 100 A m-2 showing the porosity of
those deposits
Figure 3: SEM-FEG picture of deposits surface prepared with à 40% mass PTFE
suspension bath with a current density between 100 A m-2 and about 300 A m-2.
Black arrows are pointing at PTFE particles
Figure 4: SEM-FEG picture of deposits surface prepared with à 40% mass PTFE
suspension bath with a current density beyond 300 A m-2. Most hydrophobic deposit
produced
Figure 5: Impact of average current density during the Ni-PTFE co-deposition on
measured advancing and receding contact angles
Figure 6: Consecutive pictures of a 5.5mm diameter bubble detaching from a Ni-
PTFE cathode at jwel = 7 kA m-2 prepared at jdep = 300 A m-2 - Small H2 bubbles are
evolved from the border line of the electrode and big bubbles from the electrode
center
Figure 7: Schematic description of the outcome of coalescence between attached
bubbles
Figure 8: Plot of the average detached bubble equivalent radius (continuous line) and
extremal detached radius (dashed line) from a Ni-PTFE prepared at jdep = 300 A m-2
versus average current density during water electrolysis – Bubbles from the electrode
border not taken into account

19
Figure 9: Equivalent radius of a bubble growing from a site versus time at 200 A m-2,
comparison with a r = K tr0.5 optimised model
Figure 10 (A): Bubble volume at detachment versus hydrophobic islet perimeter from
three different electrodes ( , , ) at jwel =10 A m-2
(B): Bubble radius at detachment versus contact angle before detachment at jwel =10
A m-2 from three different electrodes ( , , ) compared to the Fritz correlation [29]
(dashed line)
Figure 11 (A): A sequence of photos of the same electrode on which bubbles in rows
are coalescing from their equator with an increasing distance between anchoring
sites jwel = 100 A m-2
(B): Radius at detachment versus the half distance between sites relatively to radius
at detachment from an isolated site, rs = 150µm, rd,i = 1mm
Figure 12: Acknowledgment figure: The acronym of the project “AMELHYFLAM”, the
Eiffel tower and ECP for Ecole Centrale Paris “written” with hydrogen bubbles on a
vertical 3 cm diameter copper electrode along a water electrolysis at jwel ~ 100 A m-2

1
Figure 1:

2
Figure 2:

3
Figure 3:

4
Figure 4:

5
0
30
60
90
120
150
180
0 150 300 450 600jdep / (A m-2)
Co
nta
ct a
ng
le (
°)
Advancing contact angle
Receding contact angle
Figure 5:

6
Figure 6:
7
Figure 7:
8
1
2
3
4
5
6
10 100 1000 10000
jwel / (A m-2)
r eq
,d /
(m
m)
Figure 8:

9
0
0.2
0.4
0.6
0.8
1
0 100 200 300 400twel / (s)
r eq /
(mm
)MeasurementModel: rd=1.42 E-4 sqrt(tr)
Figure 9:
10
0
0.5
1
1.5
2
2.5
3
0 25 50 75 100
θd / (°)r e
q,d
/ (m
m)
0
1
2
3
4
5
6
0 2 4 6
2πrs / (mm)
Veq
,d /
(10-8
m3)
(A) (B)
Figure 10:

11
Figure 11:

12
Figure 12: