Scott Thaller Van Allen Probes EFW meeting University of Minnesota June 10-12, 2014.
Van Allen probes, NOAA, GOES, and ground observationsof an intense EMIC wave event extending over 12 hin magnetic local timeM. J. Engebretson1, J. L. Posch1, J. R. Wygant2, C. A. Kletzing3, M. R. Lessard4, C.-L. Huang4,H. E. Spence4, C. W. Smith4, H. J. Singer5, Y. Omura6, R. B. Horne7, G. D. Reeves8, D. N. Baker9,M. Gkioulidou10, K. Oksavik11,12, I. R. Mann13,14, T . Raita15, and K. Shiokawa16
1Department of Physics, Augsburg College, Minneapolis, Minnesota, USA, 2School of Physics and Astronomy, University ofMinnesota, Twin Cities, Minneapolis, Minnesota, USA, 3Department of Physics and Astronomy, University of Iowa, Iowa City, Iowa,USA, 4Space Science Center, University of New Hampshire, Durham, New Hampshire, USA, 5Space Weather Prediction Center,NOAA, Boulder, Colorado, USA, 6Research Institute for Sustainable Humanosphere, Kyoto University, Kyoto, Japan, 7BritishAntarctic Survey, Cambridge, UK, 8Space Science and Applications Group, Los Alamos National Laboratory, Los Alamos, NewMexico, USA, 9Laboratory for Atmospheric and Space Physics, University of Colorado Boulder, Boulder, CO, USA, 10The JohnsHopkins University Applied Physics Laboratory, Laurel, Maryland, USA, 11Birkeland Centre for Space Science, Department of Physicsand Technology, University of Bergen, Bergen, Norway, 12The University Centre in Svalbard, Longyearbyen, Norway, 13Departmentof Physics, University of Alberta, Edmonton, Alberta, Canada, 14NASA/Goddard Space Flight Center, Greenbelt, Maryland, USA,15Sodankylä Geophysical Observatory, University of Oulu, Sodankylä, Finland, 16STELAB, Nagoya University, Toyokawa, Japan
Abstract Although most studies of the effects of electromagnetic ion cyclotron (EMIC) waves on Earth’souter radiation belt have focused on events in the afternoon sector in the outer plasmasphere or plumeregion, strong magnetospheric compressions provide an additional stimulus for EMIC wave generationacross a large range of local times and L shells. We present here observations of the effects of a wave event on23 February 2014 that extended over 8 h in UT and over 12 h in local time, stimulated by a gradual 4 h rise andsubsequent sharp increases in solar wind pressure. Large-amplitude linearly polarized hydrogen band EMICwaves (up to 25 nT p-p) appeared for over 4 h at both Van Allen Probes, from late morning through localnoon, when these spacecraft were outside the plasmapause, with densities ~5–20 cm�3. Waves were alsoobserved by ground-based induction magnetometers in Antarctica (near dawn), Finland (near local noon),Russia (in the afternoon), and in Canada (from dusk to midnight). Ten passes of NOAA-POES and METOPsatellites near the northern foot point of the Van Allen Probes observed 30–80 keV subauroral protonprecipitation, often over extended L shell ranges; other passes identified a narrow L shell region ofprecipitation over Canada. Observations of relativistic electrons by the Van Allen Probes showed that thefluxes of more field-aligned and more energetic radiation belt electrons were reduced in response to boththe emission over Canada and the more spatially extended emission associated with the compression,confirming the effectiveness of EMIC-induced loss processes for this event.
1. Introduction
The focus of this paper is on the widespread electromagnetic ion cyclotron (EMIC) waves observed by the twinVan Allen Probes spacecraft (originally denoted Radiation Belt Storm Probes, RBSP), by proton detectors on thelow-altitude NOAA and METOP satellites, and by ground-based magnetometer arrays in Finland, Antarctica,Canada, and Russia during a strong solar wind compression on 23 February 2014, and on losses ofultrarelativistic electrons in Earth’s outer radiation belt associated with these waves. Previous studies of theimpact of solar wind compressions have produced mixed results: Millan and Thorne [2007] suggested thatradiation belt electron losses due to solar wind compressions could be a result of electron precipitation,whereas observations using low-altitude polar-orbiting POES satellites by Horne et al. [2009] found littleevidence of precipitation associated with these types of events. The comprehensive ground- andspace-based observations reported here provide a new set of data that can help assess the importance ofcompression-induced precipitation from a different perspective.
Cornwall [1965] and Liemohn [1967] were some of the first to describe how temperature anisotropies in hotelectrons and protons were unstable, via cyclotron instabilities, to the generation of VLF and ULF waves,
ENGEBRETSON ET AL. EMIC WAVES AND THE RADIATION BELTS 5465
PUBLICATIONSJournal of Geophysical Research: Space Physics
RESEARCH ARTICLE10.1002/2015JA021227
Key Points:• Compression-induced EMIC waveswere observed across 12 h of local time
• EMIC-triggered emissions appearedduring the strongest compression
• Intense EMIC waves outside theplasmasphere depleted theradiation belts
Correspondence to:M. J. Engebretson,[email protected]
Citation:Engebretson, M. J., et al. (2015), Van Allenprobes, NOAA, GOES, and groundobservations of an intense EMIC waveevent extending over 12 h in magneticlocal time, J. Geophys. Res. Space Physics,120, 5465–5488, doi:10.1002/2015JA021227.
Received 19 MAR 2015Accepted 19 JUN 2015Accepted article online 24 JUN 2015Published online 21 JUL 2015
©2015. American Geophysical Union.All Rights Reserved.

respectively. While generation of these waves clearly came at the expense of their respective unstableparticle populations and tended to cause reductions in their fluxes because of the induced pitch anglediffusion that led to subsequent increased precipitation into the ionosphere, depletion of relativisticradiation belt electrons by EMIC waves was also suggested in early theoretical studies over three decadesago [Thorne and Kennel, 1971; Lyons and Thorne, 1972] and more recently included as one of several majorloss processes by Horne and Thorne [1998] and Millan and Thorne [2007]. During this past decade theeffectiveness of EMIC waves has been tested and significantly circumscribed [e.g., Summers and Thorne,2003; Summers et al., 2007a, 2007b; Shprits et al., 2013]. In particular, Shprits et al. [2013] pointed out thatEMIC-induced scattering should be more effective than other loss processes for electrons with energiesabove 2MeV.
Two recent studies have further refined the parameters for effectiveness of these waves in depletingrelativistic electrons. Usanova et al. [2014] used Van Allen Probes Relativistic Electron Proton Telescope(REPT) data in conjunction with ground-based Canadian Array for Realtime Investigations of MagneticActivity (CARISMA) observations of EMIC waves to show that the loss of highly relativistic radiation beltelectrons (2–8MeV) caused by EMIC wave interactions was confined to pitch angles below ~45°. Usanovaet al. [2014] also presented model pitch angle diffusion calculations that were consistent with theseobservations: diffusion was very fast at low pitch angles and significantly (orders of magnitude) slowertoward high pitch angles, and also increased significantly with energy from 2.3MeV to 7.1MeV. Kerstenet al. [2014] performed a simulation study of the effectiveness of EMIC waves in causing losses of electronsfrom the radiation belts, using EMIC wave data from the CRRES satellite mission and found these wavescaused a significant reduction in the electron flux for energies greater than 2MeV but only for pitch angleslower than about 60°.
Although it is well documented that solar wind compressions stimulate EMIC wave activity in the outerdayside magnetosphere [e.g., Olson and Lee, 1983; Anderson and Hamilton, 1993; Fuselier et al., 2004], inthe past decade a number of event studies and statistical surveys have shown that large increases in solarwind dynamic pressure can stimulate compressions of the magnetosphere across a wide range of localtimes. Lee et al. [2005] presented examples showing significant variation in the nightside response to solarwind dynamic pressure pulses (often a simple magnetic field compression at all local times but in othercases depressions near midnight) and Lee et al. [2007] noted that large purely compressional events (withno substorm onset) led to overall global (and quasi-simultaneous in magnetic local time (MLT)) increasesof energetic neutral atom fluxes, due to ions adiabatically energized by the compressions.
A statistical study by Lyons et al. [2005] found a similar result: under not strongly southward interplanetarymagnetic field (IMF) conditions, solar wind dynamic pressure enhancements compressed the entiremagnetosphere, leading to a prompt global auroral enhancement (both dayside and nightside) with noevidence for substorm bulge-region aurora or current wedge formation. They pointed out that such globalenhancements of the aurora could not be related to an azimuthally localized current wedge and seemedclearly to be a result of the global energization of magnetospheric particles by the compression of themagnetosphere that accompanies an enhancement in dynamic pressure. However, under steady, stronglysouthward IMF conditions, Lyons et al. [2005] found that a dynamic pressure enhancement was found tocause both compressive auroral brightening away from the bulge region and a Harang region substormauroral brightening. These two auroral enhancements merged together, leading to a very broad auroralenhancement covering ~10–15 h of MLT.
Although the above studies did not specifically look at EMIC waves or the proton aurora they can stimulate,other more recent studies have done so. Meurant et al. [2003] traced the progression of both proton andelectron aurora in MLT and UT toward the nightside after a strong solar wind compression on 28 April2001 following an extended interval of very quiet solar wind and IMF conditions. Nightside protonprecipitation was stimulated at slightly lower latitude than the electron aurora, and the location of protonprecipitation on the nightside was distributed symmetrically across the midnight–noon axis.
Zhang et al. [2005] studied a number of nightside detached auroras (NDA) during highly disturbed conditionsusing auroral imager data from Thermosphere Ionosphere Mesosphere Energetics and Dynamics (TIMED)spacecraft and Imager for Magnetopause-to-Aurora Global Exploration (IMAGE) spacecraft as well as DMSPparticle data, and found that NDA occurred during the recovery phase of intense magnetic storms
Journal of Geophysical Research: Space Physics 10.1002/2015JA021227
ENGEBRETSON ET AL. EMIC WAVES AND THE RADIATION BELTS 5466

(Dst<�130) or a growth phase withsudden increase of Dst, and were locatedbetween 1900 and 0300MLT. Zhang et al.[2008] described an event on 21 January2005 when a fast interplanetary shock com-pressed the magnetosphere and caused
detached proton auroras in the dayside, duskside, and nightside ionosphere. EMIC waves were directlyassociated with the dayside subauroral emissions, and ring current simulations suggested that ~10 keVprotons were the source of the duskside and nightside subauroral emissions. Søraas et al. [2013] reportedtwo instances of nightside postmidnight subauroral proton precipitation at ring current energies and protonauroras observed during the recovery phases of a two-main-phase storm; in each case the intensity andlongitudinal extension of the arc were modulated by the solar wind dynamic pressure.
In contrast to the localized dusk sector EMIC waves stimulated by fresh injections of ring current ions oftenused in simulations during the main phase of a magnetic storm, the compression-related waves reportedhere occurred prior to the onset of a magnetic storm (the third in 4 days) and were accompanied by littleevident substorm activity. Because of the large amplitude of these waves and their unusually large extentin local time and L shell this event provides a clear demonstration of the effectiveness of EMIC wavesstimulated by strong solar wind compressions in depleting radiation belt electrons. In section 2 below wedescribe the instrumentation used in this study. Section 3 describes the geomagnetic conditions duringthis event and presents wave observations from the Van Allen Probes, from other high-altitude spacecraft,and from ground-based magnetometer arrays. Section 4 presents NOAA/METOP observations ofprecipitating ring current protons. Section 5 presents Van Allen Probes observations of ultrarelativisticelectrons during and after this intense wave event, and section 6 provides a discussion and summary ofthese observations, of several recent theoretical studies of the effects of EMIC waves on these electrons,and of their implications.
2. Data Sources
The Van Allen Probes consist of two identically instrumented spacecraft with apogees of 5.8 RE, perigee ∼ 600 km,and an orbital period of 9 h. Their near-equatorial orbits are inclined 10° with respect to the equator, enablingnominal sampling to magnetic latitudes of 0° ± 21° [Mauk et al., 2013]. Magnetometer data used in this studywere obtained by the EMFISIS (Electric and Magnetic Field Instrument Suite and Integrated Science)instrument package, which measures vector magnetic fields at a cadence of 64 vector samples/s, for a Nyquistrate of 32Hz [Kletzing et al., 2013].
The Electric Fields and Waves (EFW) instrument on the Van Allen Probes uses two orthogonal centripetallydeployed booms in the spin plane with tip-to-tip separations of 100m to measure vector electric fields inthe spin plane at a cadence of 32 vector samples/s, for a Nyquist rate of 16Hz [Wygant et al., 2013]. Thethird component of the electric field is measured by two spherical sensors separated by ∼15m, deployedat the ends of two stacer booms oppositely directed along the spin axis of the spacecraft. In addition, thepotential of the orthogonal booms was used to determine the plasma number density.
Energetic ions and electrons were measured using several instruments. As part of the Energetic Particle,Composition, and Thermal Plasma (ECT) suite [Spence et al., 2013] relativistic electron fluxes weremeasured by the Relativistic Electron Proton Telescope (REPT) [Baker et al., 2013], which pointsperpendicular to the spin axis of the spacecraft. REPT resolves electrons with energies from ∼1.6MeV to∼20MeV. Ions with energies from ≤ 20 eV or spacecraft potential (whichever is greater) to≥ 45 keV weremeasured by the ECT/HOPE (Helium Oxygen Proton Electron) mass spectrometer instrument [Funstenet al., 2013].
Geomagnetic field conditions at geostationary orbit (6.6 RE) were determined using vector fluxgatemagnetometer data from the GOES 13 and 15 spacecraft [Singer et al., 1996]. Table 1 lists the coordinatesof these spacecraft. Data were sampled at a 0.512 s cadence, for a Nyquist frequency of 0.976Hz.
EMIC waves were observed during this interval of solar wind compression by four ground arrays of induction(search coil) magnetometers: (1) Halley (L = 4.7) and South Pole Station (L = 14.1) [Engebretson et al., 2008a]
Table 1. Coordinates of GOES 13 and 15
Station SM Latitude UT of Local Noon L
GOES 13 10°N 17:12 6.8GOES 15 4.5°N 21:21 6.6
Journal of Geophysical Research: Space Physics 10.1002/2015JA021227
ENGEBRETSON ET AL. EMIC WAVES AND THE RADIATION BELTS 5467

and AAL-PIP PG4 (L =9.7) [Musko et al., 2009] in Antarctica; (2) Kilpisjarvi (L = 5.9—partial data), Ivalo (L=5.8),Sodankyla (L=5.2), Rovaniemi (L=4.9—partial data), and Nurmijarvi (L = 3.3), part of the Finnish pulsationmagnetometer chain [Yahnina et al., 2008]; (3) Fort Churchill (L = 7.23), Dawson (L=6.12), Ministik Lake(L=4.18), Rabbit Lake (L=6.44), and Thief River Falls (L = 3.53), part of the CARISMA induction coil array [Mannet al., 2008]; and (4) Magadan, Russia (L=2.97) and Moshiri, Japan (L=1.63), part of the Solar-TerrestrialEnvironment Laboratory (STEL) induction magnetometer network [Shiokawa et al., 2010]. No higher-latitudestation in the STEL array recorded useful data on this day. Shown here are data from Halley, Ivalo, MinistikLake, and Magadan, representative of the other stations in their respective arrays, and with the largest waveamplitudes. We also show induction magnetometer data from Mondy, Siberia, part of the UnitedGeomagnetic Observatory of the Solar-Terrestrial Physics Institute, Irkutsk, Russia. Table 2 lists the geographicand geomagnetic coordinates for these five stations, alongwith their L shells and the universal time of local noon.
EMIC waves, with frequencies in the Pc1 and Pc2 range (with frequencies between 0.1 and 5.0 Hz) havetraditionally been observed using magnetometers, both on the ground and in space. Because a necessaryconsequence of ion cyclotron wave emission is scattering of hot protons into the loss cone, during thepast decade low Earth orbit observations of localized, subauroral precipitation of ring current protons bythe NOAA POES and METOP spacecraft, in Sun-synchronous near-polar orbits at ~ 850 km altitude, havebeen shown to be a useful proxy for the occurrence of EMIC waves in the same regions [e.g., Sakaguchiet al., 2007; Sandanger et al., 2007; Yahnin et al., 2009; Usanova et al., 2010]. In this study we also use POESand METOP observations, in particular from the Medium Energy Proton and Electron Detector (MEPED)[Evans and Greer, 2000], which detects ions in three energy bands (30–80, 80–250, and 250–800 keV) butprovides neither mass resolution nor charge state. One detector at each energy looks upward along theEarth-satellite radial vector and views ions in the local loss cone, while the other MEPED detector looksnormal to the first detector and observes ions slightly outside the loss cone.
3. Observations
Figure 1 presents the solar wind and interplanetary magnetic field (IMF) context within which this wave eventoccurred. As the data shown in Figure 1 indicates, near 0200UT on 20 February the solar wind velocity Vswincreased rapidly to over 700 km/s (Figure 1d) and the IMF north-south Bz component began the first oftwo negative excursions to near �10 nT (Figure 1c), resulting in a magnetic storm with a double mainphase (with minima of the SYM-H index of �102 nT at 0555UT and �95 nT at 1145UT, Figure 1h). After aninitial rapid recovery later that day, a gradual increase of SYM-H for several days was interrupted only bysmall decreases near the beginning and end of 22 February. Following a solar wind proton density andflow pressure increase (Figures 1e and 1f) during 23 February, the IMF Bz component again turnedsouthward (Figure 1c), prompting another, weaker magnetic storm (with SYM-H minimum of – 63 nT at2250UT). No subsequent geomagnetic activity occurred until late on 27 February.
Figure 2 shows a more detailed view of the context of this event, from 0100 to 1100UT on 23 February. TheIMF exhibited mostly gradual variations from being mostly sunward (Bx largest, Figure 2a) from 0100 to0300UT, mostly northward (Bz largest, Figure 2c) from 0330 to 0700UT, sunward and eastward from0700 to 0800UT, and mostly westward from 0800 to 1000UT, at which time Bz became more southward.
Table 2. Coordinates of the Search Coil Magnetometer Sites Used in This Studya
Geographic Geomagnetic
Station Latitude East Longitude Latitude East Longitude L UT of Local Noon
Halley �75.50 333.40 �62.26 29.89 4.69 1444Ivalo 68.55 27.28 65.37 107.87 5.85 0908Ministik Lake 53.35 247.03 60.47 309.26 4.18 2001Magadan 60.0 150.9 54.25 220.69 2.98 0237Mondy 51.62 100.92 47.41 174.78 2.22 0519
aCorrected geomagnetic coordinates and universal time (UT) of local magnetic noon (MLT) have been computed forepoch 2014 and an altitude of 100 km using the NSSDC Modelweb facility (http://omniweb.gsfc.nasa.gov/vitmo/cgm_vitmo.html).
Journal of Geophysical Research: Space Physics 10.1002/2015JA021227
ENGEBRETSON ET AL. EMIC WAVES AND THE RADIATION BELTS 5468
The solar wind flow pressure (Psw, Figure 2d) was steady from 0100 to 0300UT, increased gradually from 0300to 0600UT, and after a slight decrease rose sharply to 8.5 nPa at 0700UT. Psw rose further during the nexthour and dropped sharply at 0800UT, but continued at levels above 6 nPa until 1100UT. The SYM-H index(Figure 2e) tracked the gradual increase and sharp rise of Psw, from 0100 to 0700, and remained above ornear 0 nT throughout the interval. The good correlation between low-latitude magnetic records (on whichthe Dst and SYM-H indices are based) and solar wind pressure variations during northward IMF conditionshas been well documented [e.g., Francia et al., 1999, and references therein], and qualitatively correspondsto increases in the Chapman-Ferraro currents at the magnetopause.
3.1. Van Allen Probes Wave Observations
Figure 3 shows observations from three instruments on RBSP-B: a 0–5Hz Fourier spectrogram of differencedEMFISIS magnetic field data (Figure 3a), the local electron density determined from the spacecraft potentialrecorded by the EFW spin plane booms (Figure 3b), and the spin-averaged differential proton flux measuredby the HOPE instrument (Figure 3c). The magnetic local time (MLT), magnetic latitude (MLAT), and spacecraft
Figure 1. Five minute averaged solar wind and interplanetary magnetic field (IMF) data timeshifted to the nose of the bowshock, obtained from the OMNI database at http://cdaweb.gsfc.nasa.gov from 00 UT 20 February to 00 UT 28 February2014. (a–c) The x, y, and z components of the IMF in GSM coordinates. (d) The solar wind flow speed, (e) the solar windplasma density, (f) the solar wind pressure, (g) the 5min AE index, and (h) the SYM-H index.
Journal of Geophysical Research: Space Physics 10.1002/2015JA021227
ENGEBRETSON ET AL. EMIC WAVES AND THE RADIATION BELTS 5469

altitude data (RE, in Earth radii) shownbelow Figure 3b were obtained fromthe Satellite Situation Center (SSCweb)facility at NASA/Goddard Space FlightCenter. The MacIlwain L shell parameterwas calculated for 90° pitch angleelectrons using the OP77Q [Olsonand Pfitzer, 1982] external magneticfield model and the InternationalGeomagnetic Reference Field (IGRF)internal magnetic field model, and theRoederer L* parameter [Roederer, 1970]was calculated for 90° pitch angle elec-trons using the TS05 [Tsyganenko andSitnov, 2005] external field model andthe IGRF internal magnetic field model.
Shown in Figure 3a is the By (east-west)transverse component of the differ-enced magnetic field, in local field-aligned coordinates. Differencing isused in these Fourier spectrograms tofacilitate display of a wide range ofspectral power by removing the f �2
falloff in spectral power with fre-quency, while retaining informationabout the absolute background inten-sity. Anderson et al. [1992a] andTakahashi et al. [1990] give a quantita-tive relationship between spectralpower calculated from differencedand undifferenced data. EMIC wavesbetween 2 and 2.5 Hz appeared near0240UT (0900MLT), immediately afterthe spacecraft passed outward througha sharp plasmapause (Figure 3b), andapproximately at the time Psw beganits gradual increase (Figure 2d). Therewas no evidence of a plasmasphericplume during the times waves wereobserved; the electron density variedgradually with L throughout the apo-
gee pass, and waves appeared only during times the electron density ne was below 20 cm�3. All the wavepower from 0220 through 0800UT (near 1400MLT) was near or above the yellow line in Figure 3a, whichshows the local He+ gyrofrequency (ΩHeþ ), thus in the “hydrogen band.” During the first part of the wave
interval these waves were at or nearΩHeþ. After 0700UT, however, these waves often filled a substantial frac-
tion of the band fromΩHeþ toΩHþ. Because RBSP-B was located south of themagnetic equator (from ~�20°
to�14°MLAT during the wave interval), we infer that the waves weremost likely generated closer to themag-netic equator, where the magnitude of B on these field lines was slightly lower. An intense but still sinusoidalburst of wave activity appeared between 0705 and 0707UT, coincident with a sudden 34nT increase andovershoot in the total magnetic field (evident in the white ΩHþ line in Figure 3a). Intense wave activity
resumed after 0717 but ceased at 0758UT (near 1350MLT) well before the spacecraft reentered the plasma-sphere at or after 0835UT.
Figure 2. One minute averaged solar wind and interplanetary magneticfield (IMF) data timeshifted to the nose of the bow shock, obtainedfrom the OMNI database at http://cdaweb.gsfc.nasa.gov from 01 UT to11 UT 23 February 2014. (a–c) The x, y, and z components of the IMF inGSM coordinates. (d) The solar wind flow pressure, and (e) the SYM-Hindex, respectively.
Journal of Geophysical Research: Space Physics 10.1002/2015JA021227
ENGEBRETSON ET AL. EMIC WAVES AND THE RADIATION BELTS 5470

EMIC waves appeared essentially continuously (but with considerable variation in amplitude) in the L shellrange from 4 to 5.7 (apogee). HOPE proton data (Figure 3c) showed enhanced ring current fluxes withenergy centered near 10 keV during the entire duration of the wave event, beginning near the time RBSP-Bexited the plasmasphere and decreasing gradually at and after the time it reentered the plasmasphere.Large fluxes of plasma sheet protons (<1 keV) were also present during the entire wave event.
RBSP-A, in a similar orbit but ~ 1 h behind RBSP-B, first observed strong Pc1 waves near 0340UT (0900MLT),when it also passed outside the plasmapause (Figure 4). The frequency of these waves was also aboveΩHeþ .
The spurious constant tone at 1.4 Hz was produced by a heater near the sensor. A similarly intense sinusoidalwave burst appeared between 0705 and 0707 coincident with a 35 nT increase in B, and intense wavesceased near 0758UT (1300MLT), but much less intense waves in the helium band appeared between 0840and 0950UT. HOPE proton data (Figure 4c) again showed enhanced ring current and plasma sheet fluxesduring the duration of the wave event.
The end of intensewaves at both RBSP spacecraft at 0758UT occurred simultaneouswith a rapid decrease in totalmagnetic field. The 15nT decrease at RBSP-A can be seen in both thewhite and the yellow traces in Figure 4a, butthe significantly smaller decrease at RBSP-B (�4nT) is not easily discernible in the yellow trace in Figure 3a.
Wave amplitudes at both RBSP spacecraft often exceeded 5 nT and at 0705UT peaked above 12 nT (RBSP-A)and 10 nT (RBSP-B); amplitudes also peaked at 11 nT (B) at 0741 and 0743UT. These amplitudes are
Figure 3. Stacked plot of RBSP-B EMFISIS, EFW, and HOPE data from 01 to 11 UT 23 February 2014. (a) The By (east-west)transverse component of the magnetic field in local field-aligned coordinates. The vertical axis in this panel showsfrequency from 0 to 5 Hz and power in nT2-Hz is encoded according to the color bar at the right. Total magnetic field datawere used to calculate the local H+, He+, and O+ gyrofrequencies, which are plotted in white, yellow, and red, respectively.(b) The electron density determined from the spacecraft potential recorded by the EFW spin plane booms. (c) Thespin-averaged differential proton flux measured by the HOPE instrument.
Journal of Geophysical Research: Space Physics 10.1002/2015JA021227
ENGEBRETSON ET AL. EMIC WAVES AND THE RADIATION BELTS 5471

sufficiently large for nonlinear effects to occur: Figure 5 shows a 0 to 5Hz Fourier spectrogram from 0700 to0800UT of the transverse components of RBSP-A magnetic field data (a and b) in local field-alignedcoordinates, as well as their color-coded ellipticity (c), where �1 indicates left-hand circular polarization,0 indicates linear polarization, and +1 indicates right-hand circular polarization. Rising-tone-triggeredemissions [Pickett et al., 2010; Omura et al., 2010; Grison et al., 2013] with both linear and left-handpolarizations were observed (at both spacecraft) when the waves were most intense, for example, at RBSP-Abetween 0726 and 0729UT. With the exception of these rising tones, the waves were predominantly linearlypolarized. This is consistent with the GOES 10 observations of hydrogen band waves and simulated spectrapresented by Denton et al. [2014] and with the statistical results of Anderson et al. [1992b].
3.2. Wave Observations at Geosynchronous Orbit and on the Ground
Figure 6 shows 0–1Hz Fourier spectrograms of differenced HE component (radially inward) magnetic fielddata from (a) GOES 13 and (b) GOES 15 and of differenced X component (north-south) search coil (dB/dT)data from (c) Halley, Antarctica, (d) Ivalo, Finland, (e) Mondy, Russia, (f) Magadan, Russia, and (g) MinistikLake, Canada, from 0100 to 1100UT 23 February 2014. Figure 6a also shows the local Heþ and O+
gyrofrequencies as white overplotted lines, and Figure 6b shows these frequencies as well as the H+
gyrofrequency during the last 4 h of the time interval shown. Figure 6h repeats the OMNI flow pressurefrom Figure 2e.
No sustained EMIC wave activity appeared at GOES 13 during the interval shown. The 0708UT solar windpressure spike was associated with decreases in total B field at both GOES 13 and 15 (Figures 6a and 6b).No waves were observed during this time at GOES 13 (L = 6.8, 0204MLT), but at GOES 15 (L = 6.6,2200MLT) there was a nearly simultaneous 0.2–0.5 Hz wave burst with amplitude up to 3 nT, followed by<1 nT amplitude activity near 0.2 Hz for ~30min. The onset of EMIC wave activity at GOES 15 associated
Figure 4. Stacked plot of RBSP-A EMFISIS, EFW, and HOPE data from 01 to 11 UT 23 February 2014, as in Figure 3.
Journal of Geophysical Research: Space Physics 10.1002/2015JA021227
ENGEBRETSON ET AL. EMIC WAVES AND THE RADIATION BELTS 5472

with a local reduction in total magnetic field (as opposed to an increase) is an example of the variability innightside responses to solar wind dynamic pressure pulses reviewed in section 1. The 0800UT solar windpressure drop was accompanied by a small increase in B at GOES 13 (L = 6.8, 0255MLT), and a strong~0.5 Hz wave burst. The total field at GOES 15 continued to drop from 0710 to ~0915UT and exhibited aslight decrease at 0800UT (L = 6.6, 2251 MLT); beginning at 0740, the GOES 15 magnetometer data weredominated by broadband noise.
The solar wind pressure spike at 0708UT caused wave bursts to appear at all five ground stations, andcompression-related wave activity appeared between ~0710 and 0800UT at all ground stations exceptMinistik Lake, which was then located near midnight local time. At Halley (Figure 6c) wave activity near 2Hzbegan weakly at 0220UT (23.7MLT), intensified slightly at 0240UT (0MLT), at the same time it appeared atRBSP-B (at ~9MLT), and fell gradually in frequency to ~1Hz near 0400UT. Wave power from 0.5 to ~3Hz(probably ducted from a range of L shells, as will be discussed below) appeared from 5 to 7UT, as Halleymoved from 2.2 to 4.2MLT. An intense wave burst with continuous frequency from 0.5 to 3.5Hz appeared at0708, shortly after the large jump in solar wind pressure. Moderately strong, relatively wideband wave powerresumed at Halley from 0715 to 0800UT, and bursts of medium to strong wave power between 0.7 and1.7Hz continued from 0820 to 1050UT, as it rotated into the postdawn local time sector (~8MLT).
Wave activity at Ivalo (Figure 6d) began with the burst at 0708UT, and from that time to 1050UT closelyresembled that observed at Halley, despite their 6 h difference in MLT. This activity also resembled thatobserved at RBSP-A from 0700 until 0950UT, when that spacecraft moved into the plasmasphere, exceptthat wave power at Ivalo remained similar both before and after 0800UT, but power decreased greatly atRBSP-A after 0800UT.
Wave activity at Mondy (Figure 6e) began weakly near 0540UT (~1225MLT), near the time of a strong waveburst at RBSP-B, and was most intense from 0708 to 0800UT (1350–1440MLT), during the time of thestrongest magnetospheric compression. Weaker wave power appeared between 0830 and 1040UT, withtemporal variations very similar to those observed at Halley and Ivalo, each separated by several hours inlocal time.
Figure 5. Spectrograms of the transverse components of RBSP-A EMFISIS magnetic field data and their ellipticity from 0700to 0800 UT 23 February 2014. (a) The Bx (radial) component and (b) the By (east-west) transverse component of themagnetic field in local field-aligned coordinates. The vertical axis in these panels shows frequency from 0 to 5 Hz, andpower in nT2-Hz is encoded according to the color bar at the right of these panels. (c) The ellipticity, with blue indicatingleft-hand polarization and red indicating right-hand polarization according to the color bar at the right. The ellipticity isblanked out if the wave power level is less than 10�3 nT2-Hz in both the Bx and the By components.
Journal of Geophysical Research: Space Physics 10.1002/2015JA021227
ENGEBRETSON ET AL. EMIC WAVES AND THE RADIATION BELTS 5473

Wave activity at Magadan (Figure 6f),located in the late afternoon sector,appeared above background levels from0708UT to 0800UT (1630–1720MLT).During this interval the wave occurrenceand intensity matched that seen atMondy (in the early afternoon sector)and at Halley (in the predawn sector)quitewell.Weakerwave activity appearedat Magadan near 0900 and from ~1015to 1040UT, again with some similaritiesto the activity observed at Halley, Ivalo,and Mondy.
Wave activity at Ministik Lake (Figure 6g,representative of that observed at sev-eral CARISMA stations) was observedfrom 0130 to 0230UT near dusk, andmore intense continuous activity wasobserved from 0330 to 0730UT, nearmidnight local time. Wave frequenciesremained between 0.2 and 0.8Hzthroughout this interval, and, except forthe weak burst at 0708UT, the waveactivity showed no similarity to thewaves observed at the GOES, RBSP, orTime History of Events and MacroscaleInteractions during Substorms (THEMIS)spacecraft. This lack of similarity, as wellas the relatively low frequency, suggeststhat these waves may have beengenerated by westward drifting freshlyinjected ring current ions. Two short-livedincreases in the AE index near the end ofthe previous day (to 771nT at 1655UTand to 340nT at 2105UT, Figure 1)
Figure 6. Fourier spectrograms of differencedHE component fluxgate magnetometer datafrom (a) GOES 13 and (b) GOES 15, and ofdifferenced north-south (x) component searchcoil (dB/dT) data from (c) Halley, Antarctica,(d) Ivalo, Finland, (e) Mondy, Russia, (f) Magadan,Russia, and (g) Ministik Lake, Canada, from 0100to 1100UT 23 February 2014. The vertical axis inFigures 6a and 6b shows frequency from 0 to0.976Hz, and power in nT2-Hz is encodedaccording to the color bar at the right. Totalmagnetic field data were used to calculate thelocal H+, He+, and O+ gyrofrequencies, whichare overplotted in white and described in thetext. The vertical axis in Figures 6c–6g showsfrequency from 0 to 5Hz, and power in arbitraryunits is encoded according to the color bar atthe right. Figure 6h repeats Figure 2d showingthe solar wind flow pressure.
Journal of Geophysical Research: Space Physics 10.1002/2015JA021227
ENGEBRETSON ET AL. EMIC WAVES AND THE RADIATION BELTS 5474

may indicate injections of ring cur-rent protons that could occasionthe observed dusk sector waves,but the AE index was very low from0000 to 1000UT on 23 February.
Figure 7 is a schematic summary ofthe locations at and inside geosyn-chronous orbit where EMIC waveswere detected between 0100 and1100UT on this day. Narrow-colored curves in this figure showthe locations in MLT and L shell ofVan Allen Probes A and B, of GOES13 and 15, and of Halley, Ivalo,Mondy, Magadan, and MinistikLake. Because of latitudinal ductingin the ionosphere, the L shell of theobserving ground station may notmatch the L shell on which theEMIC wave occurred. In the caseof Ministik Lake, however, POESoverflights observed localized pro-ton precipitation at L = 4.8 (asdetailed in the next section), andthis value was used in Figure 7.
The light blue shaded region in theupper part of Figure 7 is an inferreddemarcation of the region withinwhich hydrogen band waves wereobserved between 0700 and0800UT. We have limited the Lshell range, using the lower L
limits of waves observed by RBSP-A and -B, to L ~ 4. The upper L limit was set to L = 6, based onPOES/METOP observations of subauroral proton precipitation that often reached to even higher magneticlatitudes. The local time range extends from predawn (4.2MLT, based on Halley data, Figure 6c) to neardusk (17.4MLT, based on Magadan data, Figure 6f).
The approximate region in which helium band waves were observed in the dusk sector is shown in lightpurple, extending slightly in both MLT and L from the orange line in Figure 7 that depicts the MLT extentof activity at Ministik Lake.
To the best of our knowledge, no other high-altitude spacecraft observed significant EMIC wave activity inthe inner magnetosphere during this time interval. THEMIS A, D, and E all observed short bursts of EMICwaves, but all except an interval of weak 0.7 Hz waves near 0550UT at 1520MLT, L ~ 6.2 occurred beyondL = 6.6. The Cluster spacecraft were in the solar wind upstream of the bow shock, ~10 RE south of theSun-Earth line, and GEOTAIL was ~30 RE upstream from Earth, ~ 10 RE north of the Sun-Earth line.
4. NOAA/METOP Observations
Observations of precipitating protons by the MEPED instrument on NOAA and METOP spacecraft serve twopurposes in this study. First, observations in the dusk sector provide information on the L shells at which theEMIC activity detected by CARISMAmagnetometers originated. Second, observations in the late morning andnoon sector confirm the presence of EMIC activity over a range of L shells, thus extending the single-pointobservations of the RBSP spacecraft.
Figure 7. A plot of the L versus MLT locations of five ground stations (Halley,Antarctica; Ivalo, Finland; Mondy, Russia; Magadan, Russia; and Ministik Lake,Canada) and four spacecraft (Van Allen Probes A and B and GOES 13 and 15)that observed EMIC waves during the 23 February 2014 compression event.Narrow gray curves indicate locations as a function of time from 0200 to1100 UT (time increases counterclockwise), and wider curves indicate locationsat which EMIC waves were observed. POES data were used to specify the L shellfor the Ministik Lake curve, as explained in the text. Shown in light blue is aninferred demarcation of the region within which hydrogen band waves wereobserved between 0700 and 0800 UT. The region in which helium band waveswere observed is shown in light purple.
Journal of Geophysical Research: Space Physics 10.1002/2015JA021227
ENGEBRETSON ET AL. EMIC WAVES AND THE RADIATION BELTS 5475

Three passes in the dusk sector near 0400UT observed narrow latitudinal bands of precipitating protons inthe 30–80 keV and 80–250 keV channels at subauroral latitudes (Table 3). Figure 8 shows data from theNOAA 16 spacecraft, which observed a narrow spike of 30–250 keV precipitating protons between 62.5and 63.2° MLAT (highlighted with gray shading), with fluxes essentially equal to those of trapped protons,while the > 30 keV electrons were still mostly trapped. The narrow proton spike was located wellequatorward of the auroral zone, which is the wider area of high proton flux between 67 and 72° MLAT inFigure 8. Two other spacecraft (NOAA 15 and METOP 02) traversed the same magnetic local time regiona few minutes later and observed similarly intense, narrow spikes (data not shown). Based on theseobservations, we used a value of L = 4.8 to plot the MLT location of the CARISMA observations of EMICwaves shown in Figure 8.
Ten Northern Hemisphere passes of NOAA and METOP spacecraft near the magnetic foot point of theRBSP/Van Allen Probes provide proxy information on the L shell extent of the EMIC wave region between0430 and 0930UT. A detailed presentation of two of these passes is given in Appendix A, and Figure 9shows a stacked plot of the 30–80 keV channel from all 10 passes. In this figure time runs downward and isindicated in each panel as the time of closest conjunction between NOAA/METOP and RBSP-A and -B.Black arrows are used to highlight intense spikes of subauroral proton precipitation. Gray shading showsthe approximate magnetic latitude of RBSP-A and -B, indicating that during several passes the lowest-latitude precipitation appeared at the same MLAT traversed by the Van Allen Probes. Consistent withFigures 3 and 4, no subauroral energetic proton precipitation was observed before 0500 or after 0800UT.In addition, consistent with the wider range of frequencies of enhanced EMIC wave power seen in theHalley data than in the Ministik Lake data, and the observations by RBSP-A and -B of strong EMICwave power from L~ 4 out to their apogees beyond L = 6, this succession of passes shows spikes of
subauroral proton precipitation overa wide temporally varying rangeof magnetic latitudes, from ~60 toover 65° and at times 70°MLAT, asindicated by the black arrows inFigure 9. The latitudinal width ofthe proton spikes varied from ~1°to over 3°. On several passes upto three subauroral proton spikesare evident (e.g., METOP 02 at0753UT and possibly NOAA 18at 0711UT).
5. Effects on RadiationBelt Electrons
Figure 10 shows pitch angle distri-butions of differential electronfluxes at L* = 4.5 in the 2.3, 4.5,and 5.6MeV energy channels,respectively, from RBSP-A and -BREPT level 3 data from 20 to 27February 2014. The colors corre-spond to the logarithm of the
Figure 8. Trapped (dash-dotted lines) and precipitating (solid lines) energeticparticle fluxes observed by the MEPED instrument on NOAA 16 during its passthrough the dusk local time sector near 0350 UT 23 February 2014. Fluxes of (a)> 30 keV electrons, (b) 30–80 keV protons, and (c) 80–250 keV protons, respectively.
Table 3. Times and Locations of NOAA/METOP Observations of Precipitating Protons in the 30–80 and 80–250 keVEnergy Ranges in the Dusk Sector
Spacecraft Time (UT) Hemisphere Magnetic Local Time L Shell Range
NOAA 16 0349 North 20.3 4.69–4.92NOAA 15 0354 South 19.8 4.48–4.63METOP 02 0413 North 20.4 4.69–5.02
Journal of Geophysical Research: Space Physics 10.1002/2015JA021227
ENGEBRETSON ET AL. EMIC WAVES AND THE RADIATION BELTS 5476

fluxes, in units of cm�2 s�1 sr�1MeV�1. Figures 10dand 10h repeat the SYM-H index for these samedays from Figure 1h.
Fluxes in all three energy ranges were low at thebeginning of 20 February, but by 1200UT, afterthe second large rise in Dst after a ~100 nTdouble-peaked storm, they had increased byroughly an order of magnitude. A further fluxincrease occurred near the end of 21 February,after which time a small storm caused reductionsin fluxes, again in all three energy ranges. Largerflux increases, more isotropic in the 2.3MeV range(Figures 10a and 10e) than in the higher energyranges (Figures 10b, 10c, 10f, and 10g), occurrednear the end of 22 February. A subsequent drop influx, clearest in the two higher energy ranges,occurred at both spacecraft during the secondpass on 23 February. This was followed immediatelyby the largest flux increase of this interval, beginningnear the time of the large solar wind compressionon 23 February. Fluxes in all three energy rangesdecreased after ~1800UT 23 February, with steeperdrops occurring at the higher energies, during themain phase of a �60nT storm. Fluxes in all threeenergy ranges also decreased during half orbits nearthe beginning of 25 and 26 February and decreasedsharply during the main phase of a ~100nT storm atthe end of 27 February.
The black arrows above Figures 10d and 10h indicatethe times of intervals of strong EMIC waves observedby either of the Van Allen Probes outside L=3(Table 4), and the blue arrow indicates the durationof strong EMIC waves on 23 February 2014. Nostrong EMIC waves were observed at Halley or atstations in the Finnish, CARISMA, or STEL arraysexcept those already noted on 23 February, but wenote that the available ground stations covered onlya limited range of local times. We note also thatduring the 20–28 February interval, even thoughRBSP-A and -B were separated by only 1h alongvery similar trajectories, only two instances ofstrong near-simultaneous wave activity at bothspacecraft occurred, the first during the longcompression-induced wave interval on 23 February,
Figure 9. NOAA 30–80 keV precipitating proton data for aseries of 10 dayside NOAA/METOP passes between 0430and 0930 UT on 23 February 2014. Time runs downward,and the approximate time of closest conjunction betweenNOAA and the Van Allen Probes is indicated in eachpanel. Gray shading shows the approximate magneticlatitude of RBSP-A and -B, and black arrows highlightintense spikes of subauroral precipitation.
Journal of Geophysical Research: Space Physics 10.1002/2015JA021227
ENGEBRETSON ET AL. EMIC WAVES AND THE RADIATION BELTS 5477

and the second between 0700 and 0840 on 26 February, during which wave activity at the two spacecraftoccurred roughly 1 h earlier at RBSP-B than at RBSP-A. Although during this latter event, the waves occurredat similar MLT and L shell values, they did not overlap (Table 4). All the EMIC events observed by only one ofthe Van Allen Probes during this interval were thus highly localized in both space and in time.
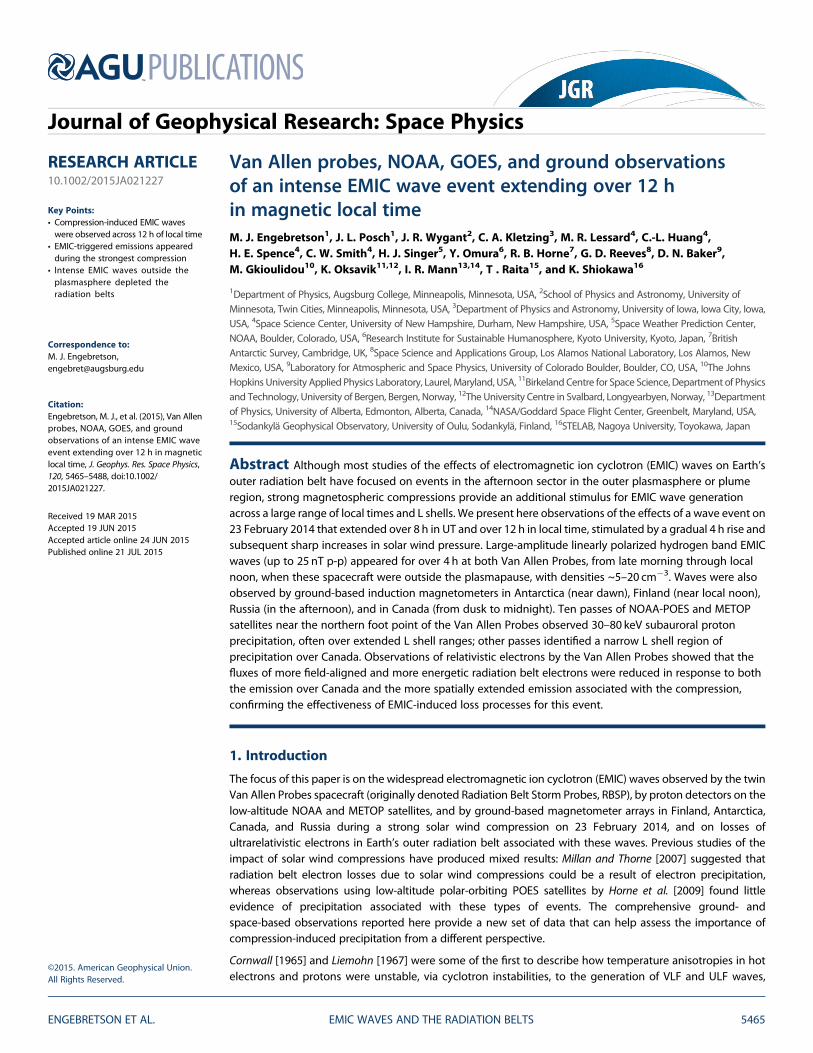
Figure 11 shows this same REPT flux data as Figure 10, but normalized by the 90° pitch angle flux and using alinear color bar scale, following the format used by Usanova et al. [2014]. Note that the relativistic electron fluxlevels during the period in October 2012 shown by Usanova et al. [2014] were an order of magnitude higher
Figure 10. Pitch angle spectra of relativistic electron fluxes observed by the REPT instrument on (a–c) RBSP-Aand (e–g) RBSP-B from 20 to 27 February 2014. Figures 10a–10c and 10e–10g show pitch angle distributions of differentialelectron fluxes at L* = 4.5 ± 0.1 in the 2.3, 4.5, and 5.6MeV energy channels, respectively. The colors correspond to thelogarithm of the fluxes, in units of cm�2 s�1 sr�1MeV�1, according to the color bars at the right of each panel. Figures 10dand 10h repeat the SYM-H index from Figure 1h for these same days. Black arrows above Figures 10d and 10h indicate intervalsof strong EMIC waves observed by either of the Van Allen Probes, and the blue arrow indicates the interval of EMIC wavesfrom 0100 to 0800UT 23 February 2014.
Table 4. Intense EMIC Wave Events Observed by the Van Allen Probes, 20–28 February 2014
Date Spacecraft Time (UT) Band Magnetic Local Time L Shell Range Frequency
Feb. 20 B 0325–0350 H 10.7–11.0 5.5–5.9 1.4–2.0 HzA 0600–0715 He 11.6–12.4 6.2–6.3 0.2–0.4 HzB 1750–1800 He 15.3–15.7 3.4–3.0 1.0–1.4 Hz
Feb. 22 B 0235 H 12.1 6.3 0.6–1.1 HzB 1800–1830 H 9.9–10.4 4.3–4.8 1.6–2.2 HzB 2030–2140 H 12.0–12.7 5.8–5.6 0.8–1.2 Hz
Feb. 23 A,B 0240–0800 H 9.2–13.8 4.0–6.4 0.9–3.5 HzFeb. 24 A 1700–1730 H, He 10.9–11.3 5.2–5.5 0.4–1.2 HzFeb. 25 B 0350–0400 He 12.7–12.8 6.1–6.0 0.3–0.4 HzFeb. 26 B 0700–0720 He 12.7–12.9 6.0–5.8 0.4–0.5 Hz
A 0800–0840 He 13.0–13.6 5.8–5.2 0.5–0.6 HzFeb. 27 B 1710–1810 H, He 11.93–12.1 5.6–5.8 0.5–1.4 Hz
B 2020–2045 H, He 13.6–14.1 4.7–4.3 0.5–1.5 Hz
Journal of Geophysical Research: Space Physics 10.1002/2015JA021227
ENGEBRETSON ET AL. EMIC WAVES AND THE RADIATION BELTS 5478
than those during this interval, so there is more scatter in the data, especially at the highest energy (5.6MeV),because of lower particle counts.
The 23 February wave event (blue arrow) occurred simultaneous with a sharp temporary reduction in electronfluxes in all three energy ranges (Figure 10) and caused a narrowing of the normalized pitch angle distributionin each of the three ranges at both spacecraft during the subsequent pass (Figures 11a–11c and 11e–11g), butthe narrowing was most pronounced at the higher energies (Figures 11b, 11c, 11f, and 11g). This narrower-angle range of trapped electron fluxes at higher energies is consistent with EMIC wave-induced lossesobserved by Usanova et al. [2014] and modeled by both Usanova et al. [2014] and Kersten et al. [2014].The other EMIC wave events appeared to have no consistent temporal relation across energies tochanges in either absolute flux (Figure 10) or normalized flux (Figure 11).
In order to focus more clearly on the effects of these EMIC waves on the fluxes of ultrarelativistic electronsfluxes, we show in Figure 12 the normalized pitch angle distribution of 5.6MeV electrons from 0000UTthrough 2400UT 23 February 2014, as observed by both RBSP-A (a) and -B (c), shown whenever therespective spacecraft were at L shells above 3.0.
Immediately below each pitch angle spectrogram, in Figures 12b and 12d, are plots of the corresponding Land L* values traversed by RBSP-A and -B, respectively. The approximate L shells and times of most intenseEMIC waves observed at Ministik Lake and at the Van Allen Probes are represented in both Figures 12b and12d by orange and blue rectangles, respectively. Intense waves at Ministik Lake began near 0400UT andended near 0720UT, and as noted above, their location was narrowly confined near L = 4.8. Althoughwaves were observed by RBSP-A beginning near 0220UT and by RBSP-B near 0340UT, triggered EMICemissions were observed only between 0705 and 0800UT, in the L range between 5.7 and 4.7. Theabsence of wave activity after 0800UT was temporal, because of the sudden drop in solar wind pressure,and thus not necessarily spatial. POES precipitating proton data shown in Figure 9 indicates that EMICwave activity extended to L~4, so it is possible that the L range of triggered emissions might have extendedto this lower L value (as discussed in the following paragraphs). The region shaded more lightly in blue thus
Figure 11. Pitch angle distributions of differential electron fluxes, normalized by the 90° pitch angle flux, at L* = 4.5 ± 0.1 inthe 2.3, 4.5, and 5.6 MeV energy channels, respectively, observed by the REPT instrument on (a–c) RBSP-A and (e–g) RBSP-Bfrom 20 to 28 February 2014. The fluxes are plotted on a linear scale according to the color bar at the right. Figures 11d and11h and arrows above them repeat the SYM-H index and intervals of strong EMIC waves, as in Figure 10.
Journal of Geophysical Research: Space Physics 10.1002/2015JA021227
ENGEBRETSON ET AL. EMIC WAVES AND THE RADIATION BELTS 5479

extends from L=4.7 down to L=4.0, which was also the L value at which RBSP-B encountered the plasmapausenear 0835UT (RBSP-A encountered the PP near 1000UT at L = 3.5).
The vertical black arrow connecting Figures 12a and 12b near 0425UT indicates the time that RBSP-A crossedL = 4.8 on its outbound pass, some 30min after the onset of EMIC activity at Ministik Lake (indicated by theleft end of the orange shaded region). The normalized pitch angle distribution observed by RBSP-A(Figure 12a) at this time was sharply narrowed to near 90° for a short interval. In contrast, no similarnarrowing was observed on RBSP-B (Figure 12c) during any of the outbound pass from 0230 to 0530UT.This is consistent with the lack of overlap in Figure 12d between the L versus time trace and the orangeshaded region, and the contrasting overlap between these two in Figure 12b.
The normalized pitch angle distributions at both RBSP-A and -B narrowed suddenly shortly after 0710UT,corresponding to the time of onset of the triggered EMIC emissions (indicated by the left end of the blueshaded regions). This region, much wider in L than that observed near 0430 in RBSP-A near L = 4.8,extended down to approximately L = 4 at both spacecraft (vertical black arrows connecting Figures 12aand 12b near 0940UT, and connecting Figures 12c and 12d near 0835UT).
On the subsequent outbound pass of both RBSP-A and -B, the normalized pitch angle distributions becamewider below L= 4.8, but remained very narrow at higher L values until ~1500UT, at which time the mainphase of a magnetic storm was under way (Figure 1). Pitch angle distributions at both RBSP-A and -B wereagain wider during the final inbound and outbound passes on this day. This indicates that either therewere no additional EMIC waves during this storm main phase interval (consistent with their absence inavailable ground-based data) or if they occurred but were undetected, they were ineffective in causing anet depletion of ultrarelativistic electrons.
Figure 12. Normalized pitch angle distributions of 5.6 MeV electrons observed by the Van Allen Probes from 0000 UTthrough 2400 UT 23 February 2014. (a and c) The normalized fluxes, according to the color bar at the right, and (b andd) The L and L* values corresponding to the given times. The vertical arrows and shaded regions are described in the text.
Journal of Geophysical Research: Space Physics 10.1002/2015JA021227
ENGEBRETSON ET AL. EMIC WAVES AND THE RADIATION BELTS 5480

6. Discussion
The waves observed during this event are of interest in their own right for understanding the spatial extent ofEMIC phenomena in Earth’s magnetosphere when it is strongly compressed, and also because of theirassociation with reductions in fluxes of ultrarelativistic electrons. The intensification of radiation belt fluxesduring 22 and 23 February (during nonstorm conditions) shown in Figure 10 is of interest as well, andthere is evidence that chorus plays a major role [Liu et al., 2015; S. Wing, personal communication, 2014],but this intensification is beyond the scope of this study. In this section we review several features of EMICwaves that are relevant to this study, and the conditions under which EMIC waves are effective indepleting the radiation belts.
6.1. Location, Occurrence, and Properties of EMIC Waves
Much of the early theoretical and observational effort on EMIC waves was focused on regions near theplasmapause, and many recent studies have focused on their association with plasmaspheric plumes.However, several comprehensive satellite surveys have shown that waves occurred much more often athigher L shells than in the region of the plasmapause: Anderson et al. [1992a] and Keika et al. [2013],based on Active Magnetospheric Particle Tracer Explorers CCE data; Fraser and Nguyen [2001], based onCRRES data; and Min et al. [2012] and Usanova et al. [2012], based on THEMIS data. Statistically, thesestudies found only a minor enhancement in occurrence near the plasmapause. Theoretical supportand statistical evidence for wave generation in plumes (regions of increased density outside theplasmapause) appears to be stronger [e.g., Clausen et al., 2011], but a study by Posch et al., 2010comparing plume observations at geosynchronous orbit to EMIC observations from auroral groundstations, which because of horizontal ducting can sense waves originating over a wide L range, foundonly modest support for such an association.
Our current understanding is summarized well by Keika et al. [2013]: Two independent major processescause EMIC wave excitation in the closed field line region of Earth’s magnetosphere. The first externallytriggers mostly H band waves on the dayside in the outer magnetosphere, because of solar windcompressions. The second internally excites mostly He band waves on the dusk-to-afternoonside in theinner magnetosphere during storm times, because of fresh injections of ions from the plasma sheet intothe plasmapause and plume regions. In both processes some of the free energy in an anisotropic, morepancake-like velocity distribution of protons in the energy range from ~1 to ~200 keV is converted intowave energy, with the result that the pitch angle distribution tends to a more isotropic one, and afraction of the energetic protons have their pitch angles moved into the loss cone, in which case thecomponent of their motion parallel or antiparallel to the local magnetic field will cause them to reachthe ionosphere and precipitate.
Keika et al. [2013] also noted that morning sector waves grow in resonance with lower energy ions thanafternoon waves, consistent with lower energy plasma sheet ions convecting eastward from the tail,around the morningside. No plume is needed to trigger these waves. Such kilovolt-range protons areevident in both Figures 3 and 4 during the entire wave occurrence interval at both Van Allen Probes, andsimilar ~keV ion data were associated with EMIC waves in the outer dayside magnetosphere duringcompressions reported by Engebretson et al. [2002].
We have also noted in the introduction above that EMIC waves were observed throughout the morningsector, beginning shortly after midnight local time, and that this location is common during strongmagnetospheric compressions. An additional event, on 17 January 2013, shows this same location: on thisday both Van Allen Probes as well as near-conjugate ground-based observatories recorded intense EMICwaves shortly after midnight that were stimulated by a strong magnetospheric compression [Weaver et al.,2013; M. R. Lessard, manuscript in preparation]. Although several major statistical studies [e.g., Andersonet al., 1992a; Fraser and Nguyen, 2001] have indicated that the occurrence rate of EMIC waves inpostmidnight local times are extremely low, a more detailed look at the observations of Anderson et al.[1992a] shows that at low L (3< L< 5) the few events observed were relatively evenly distributed in localtime. A similar pattern was found in the statistical study of CRRES data by Halford et al. [2010], who studiedEMIC events before, during, and after magnetic storms: for L> 5 events most often occurred in the regionfrom noon to dusk during the main and recovery phases of magnetic storms, but for L< 5 their Figure 4indicates a much more uniform distribution in MLT during all three storm phases. We note also that the
Journal of Geophysical Research: Space Physics 10.1002/2015JA021227
ENGEBRETSON ET AL. EMIC WAVES AND THE RADIATION BELTS 5481
CRRES mission did not complete one full precession in local time and thus did not collect much data in thedawn to noon sector.
The contrast between the radially narrow EMIC waves observed on this day in the dusk sector and the radiallyextended wave region in the dawn and noon sectors is striking, but several previous studies have also notedthe wide variety of radial widths exhibited by EMIC waves on the dayside during large magnetosphericcompressions. Low-altitude polar-orbiting satellite observations by Magsat [Iyemori and Hayashi, 1989],Viking [Erlandson et al., 1990], and ST-5 [Engebretson et al., 2008b] showed that regions of EMIC wavegeneration were often very narrow in L, down to ~ 0.1 L. However, Engebretson et al. [2002] reported bothnarrow and wide radial widths (up to and even exceeding 5 RE), in observations from Polar, in a highlyelliptical orbit in the outer dayside magnetosphere; the events with large radial width occurred duringintervals of strong magnetospheric compressions.
The large radial width of the waves observed by the Van Allen Probes during this event and their locationoutside the plasmapause are also consistent with the observations by Yahnin et al. [2011] of protonaurorae with large latitudinal widths (up to ~10°MLAT) and their inference, based on an empirical modelof plasmapause positions for 25 suboval proton aurora flashes, that at least the greater part of the protonaurora luminosity mapped outside the plasmasphere. A follow-up study by Yahnina and Yahnin [2014]of 582 proton precipitation events observed by NOAA satellites and triggered by magnetosphericcompressions found that the majority of the events occurred at magnetic latitudes 5 to 10° higher thanthe latitudes that were either observed or inferred to be associated with cold-plasma boundaries.
The rising-tone hydrogen band-triggered emissions shown in RBSP-A data (Figure 5) and RBSP-B data (notshown) were first recognized in data from Cluster by Pickett et al. [2010] but have now also been identifiedin data from THEMIS [Nakamura et al., 2014] and Polar [Gamayunov et al., 2015] as well. The mechanism oftheir generation, similar to that of triggered VLF emissions, was first explained theoretically by Omura et al.[2010], and their effectiveness in depleting radiation belt electrons was discussed by Omura and Zhao[2012, 2013]. Omura and Zhao [2012, 2013] showed that EMIC rising-tone-triggered emissions in thehydrogen band (e.g., as shown in Figure 5) could trap resonant relativistic electrons, leading to rapid andefficient nonlinear pitch angle scattering without a strong dependence on ambient plasma density.
6.2. Conditions Under Which EMIC Waves are Effective in Depleting the Radiation Belts
Most theoretical studies have focused on the effectiveness of storm time dusk sector EMICwaves in high-densityregions for pitch angle scattering relativistic electrons [e.g., Summers and Thorne, 2003; Summers et al., 2007a,2007b; Jordanova et al., 2008; Chen et al., 2011]. Although many of these studies have focused on heliumband EMIC waves, which have been reported to dominate in the dusk sector in the statistical studies of EMICwaves noted above, some theoretical estimates indicated the effectiveness of hydrogen band EMIC waves aswell [e.g., Summers et al., 2007b; Ukhorskiy et al., 2010]. These studies all assumed plasmaspheric or plume-likedensities, however.
In addition to the observations reported here of EMIC waves and relativistic electron depletions in a region welloutside the plasmapause, several recent observational studies have found EMIC wave-related scattering atother locations than dusk sector high-density regions, and at times not limited to storms. Sandanger et al.[2007] reported losses of relativistic electrons collocated with precipitating protons (interpreted as aconsequence of the presence of EMIC waves) at all four of the local times they considered (0300, 0700, 1400,and 1700MLT), and pointed out that precipitation of relativistic electrons due to weak pitch angle scatteringby EMIC waves took place throughout the whole region where the pitch angle distribution of the protons isunstable to the growth of the ion cyclotron waves; that is, both inside and outside the plasmapause.Sandanger et al. [2009] reported large EMIC wave-induced losses of relativistic electrons during the recoveryphase of geomagnetic storms (i.e., not during main phase). More recently, Carson et al. [2013] reported thatthe majority of the 2331 EMIC wave-driven relativistic electron precipitation (PPAREP) events they identifiedoccurred outside the plasmasphere, at L values ~1 RE greater than the plasmapause location determinedfrom two different statistical models. They also found no clear relationship between the expected typicallocation of plasmaspheric plumes and the locations of the PPAREP events detected. It is clear that severalobservational studies, including this one, have reported relativistic electron scattering events in locations andphysical regimes that are beyond the scope of most recent theoretical work.
Journal of Geophysical Research: Space Physics 10.1002/2015JA021227
ENGEBRETSON ET AL. EMIC WAVES AND THE RADIATION BELTS 5482
As discussed by Silin et al. [2011], ina warm plasma the ability of EMICwaves to resonantly scatter MeVenergy electrons is controlled bythe value of the wave number.In contrast to conclusions drawnfrom cold-plasma theory, proximityof the wave emission to thelocal ion gyrofrequencies doesnot necessarily indicate strongcoupling to the MeV electrons inwarm plasmas. It is interesting toexamine whether the EMIC wavesobserved on the Van Allen Probeson the dayside and on the groundat the Ministik Lake station inthe premidnight sector might berelated to the dynamics of thenarrowing of the pitch angledistributions seen by REPT. Interes-tingly, the warm plasma analysispresented by Silin et al. [2011] canalso be applied to the hydrogenband waves seen on the daysideby the Van Allen Probes. For exam-ple, cases 2, 4, and 6 in Table 1 ofSilin et al. [2011] represent low-density warm plasma cases with
increasing plasma beta at L=7. For case 4 (their Figure 5d) there are two regions of growing EMIC waves: oneclose to and above the local helium gyrofrequency and another distinct emission close to one half of thehydrogen gyrofrequency. These two distinct growing EMIC waves have frequencies which bear remarkablesimilarity to the emissions observed by the Van Allen Probes in Figure 3 such as around 6UT and later. Forcase 4 of Silin et al. [2011], the dispersion relation suggests both of these emissions could result in scatteringof MeV electrons with minimum energies >~2MeV, consistent with the REPT observations presented here.
If the waves observed at Ministik Lake were generated in a region within the duskside plasmasphere, cold-plasma theory predicts that they would be quite effective in scattering radiation belt electrons. However,assuming that the Van Allen Probes on the dayside provide a good estimate of the location of theplasmapause in the premidnight sector during this nonstorm interval, then the waves observed at MinistikLake and associated with the narrow regions of ion isotropy seen by NOAA 16 at L = 4.8 lie outsidethe plasmapause, in a region with number densities around 30–50 cm�3 (cf. Figure 3). Cases such as inFigure 5c in Silin et al. [2011] (case 3 from their Table 1) shows an example situation for warm plasma EMICwaves excited outside the plasmapause at L = 4. As shown in that figure, growing EMIC modes will beexcited around and below the Helium gyrofrequency, which for sufficiently high plasma beta mightresonate with ~ 1MeV electrons. Future analysis offers the possibility of a more detailed comparisonbetween the theoretical dispersion relation defined on the basis of the species-resolved HOPE warmion data and the EMIC waves observed on the Van Allen Probes, including their effect on the MeVenergy electrons.
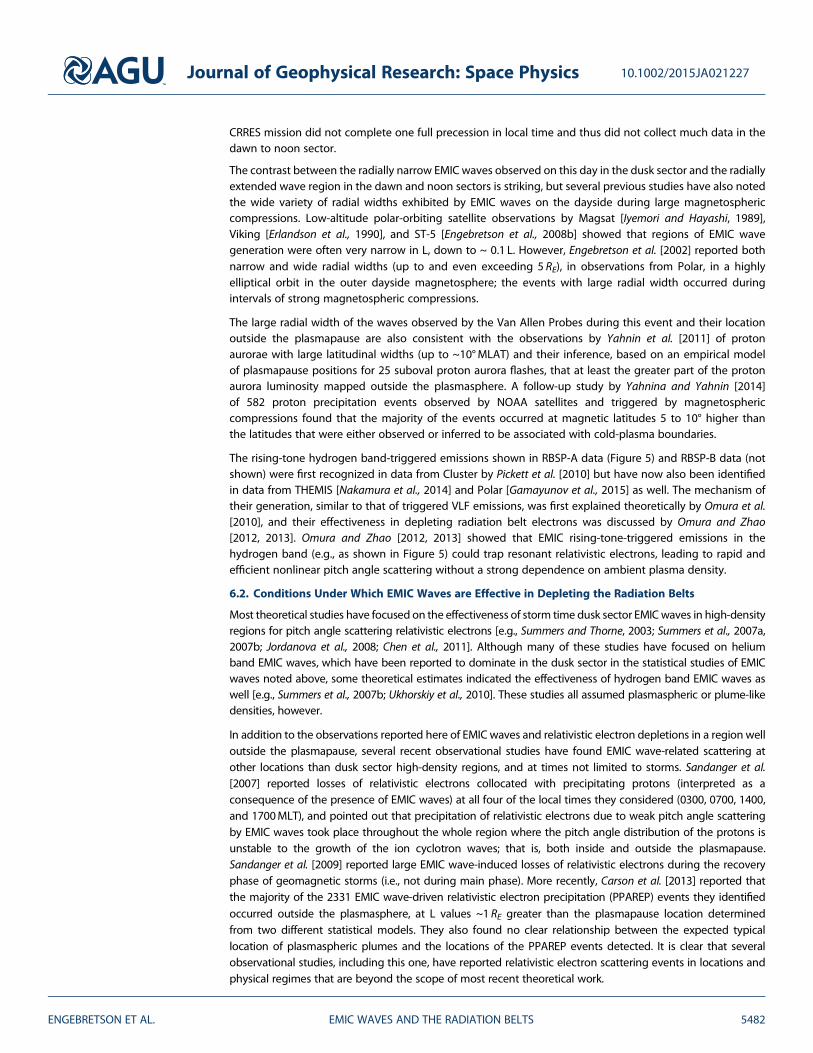
We now return to the studies of Omura and Zhao [2012, 2013], which analyzed the effectiveness of triggeredEMIC rising-tone emissions, which also occurred in the hydrogen band, for depleting radiation belt electrons.Figure 13 shows the energy thresholds, based on these studies and using a cold-plasma dispersion relation,for nonlinear trapping of resonant electrons with a range of energies, assuming a frequency sweep rate ofthe EMIC-triggered emissions of 1 Hz over 1min, for (a) a high-density region (for ωpe/ωce = 20) and (b) alow-density region (outside the plasmapause) corresponding to the 0700–0800UT interval (for ωpe/ωce = 4).
Figure 13. Threshold EMIC wave amplitudes for nonlinear trapping of relativisticelectrons: (a) for ωpe/ωce = 20, typical of higher-density plasmaspheric or plumeconditions, and (b) for ωpe/ωce = 4, consistent with the lower density locationwhere waves were observed during this event. Energies of electrons are colorcoded as follows: black = 0.5MeV, blue = 1MeV, green = 2MeV, red = 4MeV, andmagenta = 8MeV.
Journal of Geophysical Research: Space Physics 10.1002/2015JA021227
ENGEBRETSON ET AL. EMIC WAVES AND THE RADIATION BELTS 5483

Densities assumed for protons, helium ions, and oxygen ions in producing this figure are 0.9, 0.05, and 0.05 ofthe electron density, respectively. The equatorial magnetic field magnitude selected for this calculation,220 nT, was based on the following considerations: After the sudden pressure increase near 0705UT andan initial rebound, the total field at the spacecraft location of RBSP-A (near �16°MLAT) increased graduallyfrom 216nT at 0710UT to 220 nT at 0730UT, and then increased somewhat more rapidly to 240 nT at0800UT. We have no direct knowledge of the magnetic field magnitude at the magnetic equator, butbecause the magnetic field near local noon beyond L~ 5 is expected to be somewhat nondipolar (flattenednear the equator) under these highly compressed conditions, we chose Beq = 220 nT.
Figure 13a shows that hydrogen band EMIC-triggered emissions with amplitudes greater than 1 nT canprecipitate all electrons > 0.5MeV very efficiently in regions of high density. Outside the plasmasphere(Figure 13b), the parameter regime for which trapping and depletion can occur is considerably reduced,but it is still possible for highly relativistic electrons (>2MeV) and for somewhat higher wave frequencies.The (energy-dependent) minimum amplitude for trapping also is larger for regions outside theplasmapause, but the wave amplitudes observed during this event considerably exceed the 1–3 nTthresholds shown in Figure 13b. The energy dependence shown in this figure is also consistent with thetrend shown in Figure 11, in that the effectiveness of EMIC waves in depleting low pitch angle relativisticelectrons is successively greater at 4.5MeV and 5.6MeV than at 2.3MeV. This observed energy-dependenttrend is also qualitatively consistent with Figure 3 of Omura and Zhao [2013] in showing that anomalouscyclotron resonance is satisfied for increasing pitch angles (toward 90°) as energy increases, although thatfigure was calculated assuming ωpe/ωce = 18.
7. Summary and Conclusions
The EMIC wave event of 23 February 2014 is the longest-duration and most intense event we have yetobserved with the Van Allen Probes. EMIC waves across a range of local times from midnight to nearly18MLT were stimulated by a gradual 4 h rise in solar wind pressure and subsequent sharp increases, whilewaves in the dusk-to-midnight sector appeared to be unrelated to compression effects.
The Van Allen Probes observed intense EMIC waves in the hydrogen band in the dawn and noon local timesectors, over a range of L shells outside the plasmapause, from ~4.5 to 6.4. NOAA POES and METOP datashowed that the radial extent of 30–80 keV proton precipitation was broad, from 2 to at least 4 L shellswide, consistent with the L shells observed by the Van Allen Probes, and temporally varying. Ourobservation that the bandwidth of EMIC waves observed at Halley, Mondy, and Magadan was wider thanthat observed at RBSP also suggests the generation of EMIC waves across a range of L shells occurredacross a broad range of local times. Only in the postdusk sector were waves observed with a narrow Lrange, and these were not temporally associated with the strongest compressions.
We have also pointed out that this event is only the most recent example of EMIC waves stimulatedby large solar wind compressions that appeared over wide ranges of both local times and L shells.However, because this event was observed by a constellation of spacecraft and ground-basedmagnetometers, and because the Van Allen Probes spacecraft are well-instrumented to characterize thefull range of highly energetic particles in the magnetosphere, it is possible to assess the effects that thiswave event had on electrons in the outer radiation belt. Clear signatures of EMIC wave depletions ofultrarelativistic electrons were evident at both RBSP-A and -B, with timing consistent with a first dusksector helium band wave event localized at L = 4.8 causing a depletion of relativistic electrons in anarrow L range (observed by only by RBSP-A) and a subsequent intense hydrogen band-triggeredemission wave event causing depletions over a much wider range of L, consistent with the relativelywide range of L values of the observed EMIC waves observed by both Van Allen Probes. Also, as withother recent studies of the effects of EMIC waves on relativistic electrons, their effects on low pitchangle electrons were more pronounced as energies increased from 2.3MeV to 5.6MeV. Finally, althoughthe effectiveness of EMIC waves in low-density regions in depleting relativistic electrons is not consistentwith theoretical studies based on quasi-linear theory, we have demonstrated their consistency with thewarm plasma theory presented by Silin et al. [2011] and with the nonlinear trapping mechanism presentedby Omura and Zhao [2012, 2013].
Journal of Geophysical Research: Space Physics 10.1002/2015JA021227
ENGEBRETSON ET AL. EMIC WAVES AND THE RADIATION BELTS 5484

The observations reported here suggest that studies of the effectiveness of EMIC waves for depleting theouter radiation belt should not focus exclusively on helium band EMIC waves, waves during storms, orthose waves that occur in the afternoon local time sector in regions with greatly increased densities (in anextended plasmasphere or plume). Although the hydrogen band waves reported here are of very largeamplitude, such amplitudes have been associated with other non-storm time solar wind compressionevents as well. It is hoped that these observations will stimulate renewed theoretical efforts to assess theeffectiveness of compression-related, hydrogen band outer magnetospheric EMIC waves, as well as effortsto incorporate the warm plasma and nonlinear effects of EMIC wave generation and its impact onultrarelativistic electrons in future simulations.
Appendix A
In this section we provide a detailed description of two of the Northern Hemisphere high-latitudedayside POES/METOP passes that detected precipitating ring current protons. Figures A1a, A1b, A2a,and A2b show electron observations, and Figures A1c, A1d, A2c, and A2d show proton observations.In Figures A1b, A1d, A2b, and A2d the dash-dotted lines designate trapped particles, and the solidlines precipitating particles.
Figure A1 shows a pass of the METOP 02 spacecraft, which between 0746 and 0756UT passed equatorward~ 1 h MLT west of the magnetic foot points of RBSP-A and -B. The auroral zones (characterized by isotropicparticle fluxes), encountered in both the northbound and the southbound legs of this pass (~0740 to~0743 and ~0747 to ~0748UT) show equal fluxes of 30–80 keV protons along and normal to the magneticfield, whereas most of the intervals equatorward of this region show anisotropic distributions, with a veryreduced flux along the magnetic field. However, three intervals of precipitating 30–80 keV proton fluxesare evident in the southbound leg between 0749:22 and 0752:50 (between 70° and 60°MLAT), allequatorward of the isotropic zone and also equatorward of the > 30 keV electron isotropic zone. No suchintervals of precipitating 30–80 keV protons are seen equatorward of the >30 keV electron isotropic zoneduring the northbound leg (left-hand side of the figure). The gray shading in Figure A1 shows theapproximate magnetic latitude of RBSP-A and -B, very near the most equatorward of the three intervals ofprecipitating protons observed by METOP 02.
Figure A2 shows an earlier pass of the NOAA 19 spacecraft, which passed very near the magnetic foot pointsof RBSP-A and -B at 0717UT on its northbound leg, and observed precipitating 30–80 keV protons in one
Figure A1. Energetic electron and proton data observed by METOP 02 between 0732 and 0757 UT 23 February 2014. (a and b) Electron observations and (c and d)proton observations. In Figures A1b and A1d the dash-dotted lines designate trapped particles and the solid lines precipitating particles. The gray shading shows themagnetic latitude of RBSP-A and -B.
Journal of Geophysical Research: Space Physics 10.1002/2015JA021227
ENGEBRETSON ET AL. EMIC WAVES AND THE RADIATION BELTS 5485

narrow band at 61° MLAT, near the gray shaded area indicating the magnetic latitude of RBSP-A and -B, aswell as a broad band from 64° to 72°MLAT (~0718 to ~0721UT). Although this higher-latitude bandoverlaps somewhat with the equatorward edge of the isotropic electron zone, its presence is consistentwith the third category of proton precipitation regions described by Yahnina and Yahnin [2014], which wasobserved near local noon during intervals of magnetospheric compression. Again, no such intervals ofprecipitating 30–80 keV protons were seen equatorward of the >30 keV electron isotropic zone during theother leg of this pass.
ReferencesAnderson, B. J., and D. C. Hamilton (1993), Electromagnetic ion cyclotron waves stimulated by modest magnetospheric compressions,
J. Geophys. Res., 98, 11,369–11,382, doi:10.1029/93JA00605.Anderson, B. J., R. E. Erlandson, and L. J. Zanetti (1992a), A statistical study of Pc 1–2 magnetic pulsations in the equatorial
magnetosphere: 1. Equatorial occurrence distributions, J. Geophys. Res., 97, 3075–3088, doi:10.1029/91JA02706.Anderson, B. J., R. E. Erlandson, and L. J. Zanetti (1992b), A statistical study of Pc 1–2 magnetic pulsations in the equatorial
magnetosphere: 2. Wave properties, J. Geophys. Res., 97, 3089–3101, doi:10.1029/91JA02697.Baker, D. N., et al. (2013), The Relativistic Electron-Proton Telescope (REPT) instrument on board the Radiation Belt Storm Probes (RBSP)
spacecraft: Characterization of Earth’s radiation belt high-energy particle populations, Space Sci. Rev., 179, 337–381, doi:10.1007/s11214-012-9950-9.
Carson, B. R., C. J. Rodger, and M. A. Clilverd (2013), POES satellite observations of EMIC-wave driven relativistic electron precipitation during1998–2010, J. Geophys. Res. Space Physics, 118, 232–243, doi:10.1029/2012JA017998.
Chen, L., R. M. Thorne, and J. Bortnik (2011), The controlling effect of ion temperature on EMIC wave excitation and scattering, Geophys. Res.Lett., 38, L16109, doi:10.1029/2011GL048653.
Clausen, L. B. N., J. B. H. Baker, J. M. Ruohoniemi, and H. J. Singer (2011), EMIC waves observed at geosynchronous orbit during solarminimum, statistics and excitation, J. Geophys. Res., 116, A10205, doi:10.1029/2011JA016823.
Cornwall, J. M. (1965), Cyclotron instabilities and electromagnetic emission in the ultra low frequency and very low frequency ranges,J. Geophys. Res., 70, 61–69, doi:10.1029/JZ070i001p00061.
Denton, R. E., V. K. Jordanova, and B. J. Fraser (2014), Effect of spatial density variation and O+concentration on the growth and evolution of
electromagnetic ion cyclotron waves, J. Geophys. Res. Space Physics, 119, 8372–8395, doi:10.1002/2014JA020384.Engebretson, M. J., W. K. Peterson, J. L. Posch, M. R. Klatt, B. J. Anderson, C. T. Russell, H. J. Singer, R. L. Arnoldy, and H. Fukunishi (2002), Observations
of two types of Pc 1–2 pulsations in the outer dayside magnetosphere, J. Geophys. Res., 107(A12), 1451, doi:10.1029/2001JA000198.Engebretson, M. J., et al. (2008a), Pc1-Pc2 waves and energetic particle precipitation during and after magnetic storms: Superposed epoch
analysis and case studies, J. Geophys. Res., 113, A01211, doi:10.1029/2007JA012362.Engebretson, M. J., J. L. Posch, A. M. Westerman, N. J. Otto, J. A. Slavin, G. Le, R. J. Strangeway, and M. R. Lessard (2008b), Temporal and spatial
characteristics of Pc 1 waves observed by ST5, J. Geophys. Res., 113, A07206, doi:10.1029/2008JA013145.Erlandson, R. E., L. J. Zanetti, T. A. Potemra, L. P. Block, and G. Holmgren (1990), Viking magnetic and electric field observations of Pc 1 waves
at high latitudes, J. Geophys. Res., 95, 5941–5955, doi:10.1029/JA095iA05p05941.Evans, D. E., and M. S. Greer (2000), Polar orbiting environmental satellite space environment monitor: 2. Instrument descriptions and archive
data documentation, Tech. Rep., Natl. Oceanic and Atmos. Admin., Boulder, Colo.Francia, P., S. Lepidi, U. Villante, P. Di Giuseppe, and A. J. Lazarus (1999), Geomagnetic response at low latitude to continuous solar wind
pressure variations during northward interplanetary magnetic field, J. Geophys. Res., 104, 19,923–19,930, doi:10.1029/1999JA900229.
Figure A2. Energetic electron and proton data observed by NOAA 19 between 0712 and 0741 UT 23 February 2014, as in Figure A2. The gray shading shows theapproximate MLAT of RBSP-A and -B.
AcknowledgmentsThis research was supported by NSFgrants ANT-1142045 and PLR-1341493to Augsburg College and NSF grantsANT-1141987 and PLR-1341677 to theUniversity of New Hampshire. Workperformed by M.J.E. at NASA/GSFC wassupported by the Van Allen Probesmission. Van Allen Probes research atthe University of Minnesota, Universityof Iowa, University of New Hampshire,and Los Alamos National Laboratorywas supported by NASA prime contractNAS5-01072 to The Johns HopkinsUniversity Applied Physics Laboratory.Work performed by K.O. at theUniversity of Bergen was supported bythe Research Council of Norway undercontracts 223252 and 212014. We thankDavid Sibeck, Brian Anderson, ShrikanthKanekal, Sasha Ukhorskiy, Yuri Shprits,Viacheslav Pilipenko, Finn Søraas, andBarry Mauk for helpful comments TheHalley research station in Antarctica isoperated by the British Antarctic Survey.We thank R.A. Rakhmatulin for provid-ing Mondy induction magnetometerdata, we thank the referees for theirhelpful comments, and we gratefullyacknowledge use of NASA/GSFC’s SpacePhysics Data Facility’s OMNIWeb,SSCweb, and CDAWeb data.
M. Balikhin thanks Jacob Bortnik andone anonymous reviewer for theirassistance in evaluating this paper.
Journal of Geophysical Research: Space Physics 10.1002/2015JA021227
ENGEBRETSON ET AL. EMIC WAVES AND THE RADIATION BELTS 5486
Fraser, B. J., and T. S. Nguyen (2001), Is the plasmapause a preferred source region of electromagnetic ion cyclotron waves in themagnetosphere?, J. Atmos. Sol. Terr. Phys., 63, 1225–1247.
Funsten, H. O., et al. (2013), Helium, Oxygen, Proton, and Electron (HOPE) mass spectrometer for the Radiation Belt Storm Probes mission,Space Sci. Rev., 179, 423–484, doi:10.1007/s11214-013-9968-7.
Fuselier, S. A., S. P. Gary, M. F. Thomsen, E. S. Claflin, B. Hubert, B. R. Sandel, and T. Immel (2004), Generation of transient dayside subauroralproton precipitation, J. Geophys. Res., 109, A12227, doi:10.1029/2004JA010393.
Gamayunov, K. V., M. J. Engebretson, M. Zhang, and H. K. Rassoul (2015), Source of seed fluctuations for electromagnetic ion cyclotron wavesin Earth’s magnetosphere, Adv. Space Res., 55, 2573–2583, doi:10.1016/j.asr.2015.02.024.
Grison, B., O. Santolik, N. Conrillleau-Wehrlin, A. Masson, M. J. Engebretson, J. S. Pickett, Y. Omura, P. Robert, and R. Nomura (2013), EMICtriggered chorus emissions in Cluster data, J. Geophys. Res. Space Physics, 118, 1159–1169, doi:10.1002/jgra.50178.
Halford, A. J., B. J. Fraser, and S. K. Morley (2010), EMIC wave activity during geomagnetic storm and nonstorm periods: CRRES results,J. Geophys. Res., 115, A12248, doi:10.1029/2010JA015716.
Horne, R. B., and R. M. Thorne (1998), Potential waves for relativistic electron scattering and stochastic acceleration during magnetic storms,Geophys. Res. Lett., 25, 3011–3014, doi:10.1029/98GL01002.
Horne, R. B., M. M. Lam, and J. C. Green (2009), Energetic electron precipitation from the outer radiation belt during geomagnetic storms,Geophys. Res. Lett., 36, L19104, doi:10.1029/2009GL040236.
Iyemori, T., and K. Hayashi (1989), PC 1 micropulsations observed by Magsat in the ionospheric F region, J. Geophys. Res., 94, 93–100,doi:10.1029/JA094iA01p00093.
Jordanova, V. K., J. Albert, and Y. Miyoshi (2008), Relativistic electron precipitation by EMIC waves from self-consistent global simulations,J. Geophys. Res., 113, A00A10, doi:10.1029/2008JA013239.
Keika, K., K. Takahashi, A. Y. Ukhorskiy, and Y. Miyoshi (2013), Global characteristics of electromagnetic ion cyclotron waves: Occurrence rateand its storm dependence, J. Geophys. Res. Space Physics, 118, 4135–4150, doi:10.1002/jgra.50385.
Kersten, T., R. B. Horne, S. A. Glauert, N. P. Meredith, B. J. Fraser, and R. S. Grew (2014), Electron losses from the radiation belts caused by EMICwaves, J. Geophys. Res. Space Physics, 119, 8820–8837, doi:10.1002/2014JA020366.
Kletzing, C. A., et al. (2013), The Electric and Magnetic Field Instrument Suite and Integrated Science (EMFISIS) on RBSP, Space Sci. Rev., 179,127–181, doi:10.1007/s11214-013-9993-6.
Lee, D.-Y., L. R. Lyons, and G. D. Reeves (2005), Comparison of geosynchronous energetic particle flux responses to solar wind dynamicpressure enhancements and substorms, J. Geophys. Res., 110, A09213, doi:10.1029/2005JA011091.
Lee, D.-Y., S. Ohtani, P. C. Brandt, and L. R. Lyons (2007), Energetic neutral atom response to solar wind dynamic pressure enhancements,J. Geophys. Res., 112, A09210, doi:10.1029/2007JA012399.
Liemohn, H. B. (1967), Cyclotron-resonance amplification of VLF and ULF whistlers, J. Geophys. Res., 72, 39–55, doi:10.1029/JZ072i001p00039.Liu, S., et al. (2015), Van Allen Probes observations linking radiation belt electrons to chorus waves during 2014 multiple storms, J. Geophys.
Res. Space Physics, 120, 938–948, doi:10.1002/2014JA020781.Lyons, L. R., and R. M. Thorne (1972), Parasitic pitch angle diffusion of radiation belt particles by ion cyclotron waves, J. Geophys. Res., 77,
5608–5616, doi:10.1029/JA077i028p05608.Lyons, L. R., D.-Y. Lee, C.-P. Wang, and S. B. Mende (2005), Global auroral responses to abrupt solar wind changes: Dynamic pressure,
substorm, and null events, J. Geophys. Res., 110, A08208, doi:10.1029/2005JA011089.Mann, I. R., et al. (2008), The upgraded CARISMA magnetometer array in the THEMIS era, Space Sci. Rev., 141, 413–451, doi:10.1007/s11214-
008-9457-6.Mauk, B. H., et al. (2013), Science objectives and rationale for the Radiation Belt Storm Probes Mission, Space Sci. Rev., 179, 3–27, doi:10.1007/
s11214-012-9908-y.Meurant, M., J.-C. Gérard, B. Hubert, V. Coumans, C. Blockx, N. Østgaard, and S. B. Mende (2003), Dynamics of global scale electron and proton
precipitation induced by a solar wind pressure pulse, Geophys. Res. Lett., 30(20), 2032, doi:10.1029/2003GL018017.Millan, R. M., and R. M. Thorne (2007), Review of radiation belt relativistic electron losses, J. Atmos. Sol. Terr. Phys., 69, 362–377, doi:10.1016/
j.jastp.2006.06.019.Min, K., J. Lee, K. Keika, and W. Li (2012), Global distribution of EMIC waves derived from THEMIS observations, J. Geophys. Res., 117, A05219,
doi:10.1029/2012JA017515.Musko, S. B., C. R. Clauer, A. J. Ridley, and K. L. Arnett (2009), Autonomous low-power magnetic data collection platform to enable remote
high latitude array deployment, Rev. Sci. Instrum., 80, 044501, doi:10.1063/1.3108527.Nakamura, S., Y. Omura, S. Machida, M. Shoji, M. Nosé, and V. Angelopoulos (2014), Electromagnetic ion cyclotron rising tone emissions
observed by THEMIS probes outside the plasmapause, J. Geophys. Res. Space Physics, 119, 1874–1886, doi:10.1002/2013JA019146.Olson, J. V., and L. C. Lee (1983), Pc1 wave generation by sudden impulses, Planet. Space Sci., 31, 295–302.Olson, W. P., and K. A. Pfitzer (1982), A dynamic model of the magnetospheric magnetic and electric fields for July 29, 1977, J. Geophys. Res.,
87, 5943–5948, doi:10.1029/JA087iA08p05943.Omura, Y., and Q. Zhao (2012), Nonlinear pitch angle scattering of relativistic electrons by EMIC waves in the inner magnetosphere,
J. Geophys. Res., 117, A08227, doi:10.1029/2012JA017943.Omura, Y., and Q. Zhao (2013), Relativistic electron microbursts due to nonlinear pitch angle scattering by EMIC triggered emissions,
J. Geophys. Res. Space Physics, 118, 5008–5020, doi:10.1002/jgra.50477.Omura, Y., J. Pickett, B. Grison, O. Santolík, I. Dandouras, M. Engebretson, P. M. E. Décréau, and A. Masson (2010), Theory and observation of
electromagnetic ion cyclotron triggered emissions in the magnetosphere, J. Geophys. Res., 115, A07234, doi:10.1029/2010JA015300.Pickett, J. S., et al. (2010), Cluster observations of EMIC triggered emissions in association with Pc1 waves near Earth’s plasmapause, Geophys.
Res. Lett., 37, L09104, doi:10.1029/010GL042648.Posch, J. L., M. J. Engebretson, M. T. Murphy, M. H. Denton, M. R. Lessard, and R. B. Horne (2010), Probing the relationship between EMIC
waves and plasmaspheric plumes near geosynchronous orbit, J. Geophys. Res., 115, A11205, doi:10.1029/2010JA015446.Roederer, J. G. (1970), Dynamics of Geomagnetically Trapped Radiation, Springer, New York.Sakaguchi, K., K. Shiokawa, A. Ieda, Y. Miyoshi, Y. Otsuka, T. Ogawa, M. Connors, E. F. Donovan, and F. J. Rich (2007), Simultaneous ground and
satellite observations of an isolated proton arc at subauroral latitudes, J. Geophys. Res., 112, A04202, doi:10.1029/2006JA012135.Sandanger, M., F. Søraas, K. Aarsnes, K. Oksavik, and D. S. Evans (2007), Loss of relativistic electrons: Evidence for pitch angle scattering
by electromagnetic ion cyclotron waves excited by unstable ring current protons, J. Geophys. Res., 112, A12213, doi:10.1029/2006JA012138.
Sandanger, M. I., F. Søraas, M. Sørbø, K. Aarsnes, K. Oksavik, and D. S. Evans (2009), Relativistic electron losses related to EMIC waves duringCIR and CME storms, J. Atmos. Sol. Terr. Phys., 71, 1126–1144, doi:10.1016/j.jastp.2008.07.006.
Journal of Geophysical Research: Space Physics 10.1002/2015JA021227
ENGEBRETSON ET AL. EMIC WAVES AND THE RADIATION BELTS 5487
Shiokawa, K., et al. (2010), The STEL induction magnetometer network for observation of high-frequency geomagnetic pulsations, EarthPlanets Space, 62, 517–524, doi:10.5047/eps.2010.05.003.
Shprits, Y. Y., D. Subbotin, A. Drozdov, M. E. Usanova, A. Kellerman, K. Orlova, D. N. Baker, D. L. Turner, and K.-C. Kim (2013), Unusual stabletrapping of the ultrarelativistic electrons in the Van Allen radiation belts, Nat. Phys., 9(11), 699–703, doi:10.1038/nphys2760.
Silin, I., I. R. Mann, R. D. Sydora, D. Summers, and R. L. Mace (2011), Warm plasma effects on electromagnetic ion cyclotron wave MeV electroninteractions in the magnetosphere, J. Geophys. Res., 116, A05215, doi:10.1029/2010JA016398.
Singer, H. J., L. Matheson, R. Grubb, A. Newman, and S. D. Bouwer (1996), Monitoring space weather with the GOES magnetometers, in SPIEConference Proceedings, vol. 2812, edited by E. R. Washwell, pp. 299–308, GOES-8 and Beyond SPIE, Bellingham, Wash.
Søraas, F., K.,. M. Laundal, and M. Usanova (2013), Coincident particle and optical observations of nightside subauroral proton precipitation,J. Geophys. Res. Space Physics, 118, 1112–1122, doi:10.1002/jgra.50172.
Spence, H. E., et al. (2013), Science goals and overview of the Radiation Belt Storm Probes (RBSP) Energetic Particle, Composition, andThermal Plasma (ECT) suite on NASA’s Van Allen Probes mission, Space Sci. Rev., 179, 311–336, doi:10.1007/s11214-013-0007-5.
Summers, D., and R. M. Thorne (2003), Relativistic electron pitch-angle scattering by electromagnetic ion cyclotron waves duringgeomagnetic storms, J. Geophys. Res., 108(A4), 1143, doi:10.1029/2002JA009489.
Summers, D., B. Ni, and N. P. Meredith (2007a), Timescales for radiation belt electron acceleration and loss due to resonant wave-particleinteractions: 1. Theory, J. Geophys. Res., 112, A04206, doi:10.1029/2006JA011801.
Summers, D., B. Ni, and N. P. Meredith (2007b), Timescales for radiation belt electron acceleration and loss due to resonant wave-particleinteractions: 2. Evaluation for VLF chorus, ELF hiss, and EMIC waves, J. Geophys. Res., 112, A04207, doi:10.1029/2006JA011993.
Takahashi, K., B. J. Anderson, and R. J. Strangeway (1990), AMPTE CCE observations of Pc 3–4 pulsations at L = 2–6, J. Geophys. Res., 95,17,179–17,186, doi:10.1029/JA095iA10p17179.
Thorne, R. M., and C. F. Kennel (1971), Relativistic electron precipitation during magnetic storm main phase, J. Geophys. Res., 76, 4446–4453,doi:10.1029/JA076i019p04446.
Tsyganenko, N. A., and M. I. Sitnov (2005), Modeling the dynamics of the inner magnetosphere during strong geomagnetic storms,J. Geophys. Res., 110, A03208, doi:10.1029/2004JA010798.
Ukhorskiy, A. Y., Y. Y. Shprits, B. J. Anderson, K. Takahashi, and R. M. Thorne (2010), Rapid scattering of radiation belt electrons by storm timeEMIC waves, Geophys. Res. Lett., 37, L09101, doi:10.1029/2010GL042906.
Usanova, M. E., et al. (2010), Conjugate ground and multisatellite observations of compression-related EMIC Pc1 waves and associatedproton precipitation, J. Geophys. Res., 115, A07208, doi:10.1029/2009JA014935.
Usanova, M. E., I. R. Mann, J. Bortnik, L. Shao, and V. Angelopoulos (2012), THEMIS observations of electromagnetic ion cyclotron waveoccurrence: Dependence on AE, SYMH, and solar wind dynamic pressure, J. Geophys. Res., 117, A10218, doi:10.1029/2012JA018049.
Usanova, M. E., et al. (2014), Effect of EMIC waves on relativistic and ultrarelativistic electron populations: Ground-based and Van AllenProbes observations, Geophys. Res. Lett., 41, 1375–1381, doi:10.1002/2013GL059024.
Weaver, C., M. R. Lessard, M. J. Engebretson, R. Millan, A. J. Halford, R. B. Horne, and H. J. Singer (2013), Ground and satellite EMIC wavesobservations in conjunction with BARREL electron precipitation, Abstract SM23C-07 presented at 2013 Fall Meeting, AGU, San Francisco,Calif., 10 Dec.
Wygant, J. R., et al. (2013), The electric field and waves instruments on the Radiation Belt Storm Probes mission, Space Sci. Rev., 179, 183–220,doi:10.1007/s11214-013-0013-7.
Yahnin, A., T. Yahnina, H. Frey, V. Pierrard, and T. Popova (2011), Location of the ion-cyclotron instability region relatively to plasmapauseduring magnetospheric compressions, in Physics of Auroral Phenomena, Proc. XXXIV Annual Seminar, Apatity, pp. 57–60, Kola ScienceCentre, Russian Academy of Science, Apatity, Murmansk Region, Russia.
Yahnin, A. G., T. A. Yahnina, H. U. Frey, T. Bösinger, and J. Manninen (2009), Proton aurora related to intervals of pulsations of diminishingperiods, J. Geophys. Res., 114, A12215, doi:10.1029/2009JA014670.
Yahnina, T. A., and A. G. Yahnin (2014), Proton precipitation to the equator of the isotropic boundary during the geomagnetic storm onNovember 20–29, 2003, Cosmic Res., 52, 79–85.
Yahnina, T. A., H. U. Frey, T. Bösinger, and A. G. Yahnin (2008), Evidence for subauroral proton flashes on the dayside as the result of the ioncyclotron interaction, J. Geophys. Res., 113, A07209, doi:10.1029/2008JA013099.
Zhang, Y., L. Paxton, D. Morrison, B. Wolven, H. Kil, and S. Wing (2005), Nightside detached auroras due to precipitating protons/ions duringintense magnetic storms, J. Geophys. Res., 110, A02206, doi:10.1029/2004JA010498.
Zhang, Y., L. J. Paxton, and Y. Zheng (2008), Interplanetary shock induced ring current auroras, J. Geophys. Res., 113, A01212, doi:10.1029/2007JA012554.
Journal of Geophysical Research: Space Physics 10.1002/2015JA021227
ENGEBRETSON ET AL. EMIC WAVES AND THE RADIATION BELTS 5488