ValueofWater ResearchReportSeriesNowaterfootprint.org/media/downloads/Report51-WaterFootprint... ·...
36
Value of Water Research Report Series No. 51 The water footprint of electricity from hydropower Value of Water M.M. Mekonnen A.Y. Hoekstra June 2011
Transcript of ValueofWater ResearchReportSeriesNowaterfootprint.org/media/downloads/Report51-WaterFootprint... ·...

Value of Water Research Report Series No. 51
The water footprint of
electricity from hydropower
Value of Water
M.M. Mekonnen
A.Y. Hoekstra
June 2011


THE WATER FOOTPRINT OF ELECTRICITY FROM HYDROPOWER
M.M. MEKONNEN1
A.Y. HOEKSTRA1,2
JUNE 2011
VALUE OF WATER RESEARCH REPORT SERIES NO. 51
1 Twente Water Centre, University of Twente, Enschede, The Netherlands
2 Contact author: Arjen Y. Hoekstra, [email protected]

© 2011 M.M. Mekonnen and A.Y. Hoekstra.
Published by:
UNESCO-IHE Institute for Water Education
P.O. Box 3015
2601 DA Delft
The Netherlands
The Value of Water Research Report Series is published by UNESCO-IHE Institute for Water Education, in
collaboration with University of Twente, Enschede, and Delft University of Technology, Delft.
All rights reserved. No part of this publication may be reproduced, stored in a retrieval system, or transmitted, in
any form or by any means, electronic, mechanical, photocopying, recording or otherwise, without the prior
permission of the authors. Printing the electronic version for personal use is allowed.
Please cite this publication as follows:
Mekonnen, M.M. and Hoekstra, A.Y. (2011) The water footprint of electricity from hydropower, Value of
Water Research Report Series No. 51, UNESCO-IHE, Delft, the Netherlands.

Contents Summary................................................................................................................................................................. 5 1. Introduction ....................................................................................................................................................... 7 2. Method and data ................................................................................................................................................ 9
2.1 Method ..................................................................................................................................................... 9 2.2 Data ........................................................................................................................................................ 15
3. Results: the water footprint of hydroelectricity ............................................................................................... 17 4. Discussion ....................................................................................................................................................... 21 5. Conclusion ...................................................................................................................................................... 23 References ............................................................................................................................................................ 25
Appendix I: Data on the location, reservoir capacity and area, installed capacity and hydroelectric generation of
selected hydropower plants................................................................................................................................... 27 Appendix II: Water footprint of selected hydropower plants in the world ........................................................... 29


Summary
Hydropower accounts for about 16% of the world’s electricity supply. Although dams often have big
environmental and social impacts, proponents of hydropower regard it as a comparatively clean, low-cost and
renewable form of energy. It has been debated whether hydroelectric generation is merely an in-stream water
user or whether it also consumes water, in the sense of effectively taking away water from the river. In this
report we provide scientific support for the argument that hydroelectric generation is in most cases a significant
water consumer.
The study assesses the blue water footprint of hydroelectricity – the water evaporated from manmade reservoirs
to produce electric energy – for 35 selected sites. The aggregated blue water footprint of the selected
hydropower plants is 90 Gm3/yr, which is equivalent to 10% of the blue water footprint of global crop
production in the year 2000. The total blue water footprint of hydroelectric generation in the world must be
considerably larger if one considers the fact that this study covers only 8% of the global installed hydroelectric
capacity. Hydroelectric generation is thus a significant water consumer.
The average water footprint of the selected hydropower plants is 68 m3/GJ. Great differences in water footprint
among hydropower plants exist, due to differences in climate in the places where the plants are situated, but
more importantly as a result of large differences in the area flooded per unit of installed hydroelectric capacity.
We recommend that water footprint assessment is added as a component in evaluations of newly proposed
hydropower plants as well as in the evaluation of existing hydroelectric dams, so that the consequences of the
water footprint of hydroelectric generation on downstream environmental flows and other water users can be
evaluated. Sustainable development of hydropower requires the accounting and internalization of all external
costs including water consumption. Internalization means that the economic and environmental costs of the
water consumed are charged to the operator of a hydropower plant and included in the price of hydroelectricity.
It should thereby be acknowledged that water consumption costs vary within the year and across river basins,
since the degree of water scarcity and competition over water depend on the period within the year and local
circumstances.


1. Introduction
The need to supply a growing population with sufficient fresh water in the context of increasing water scarcity
and declining water quality has brought sustainable water resources management to the forefront of the global
development agenda. For centuries, dams have played a key role in human development, bringing about
significant social and economic improvements. About 30-40% of irrigated land worldwide relies on water stored
behind dams (World Commission on Dams, 2000) and hydropower accounted for 16% of world electricity in
2008 (IEA, 2010).
Large hydropower dams have both positive and negative effects (Sternberg, 2008, 2010). Dams have been built
to regulate river flows, store water to guarantee adequate supply of water in dry periods, control floods, irrigate
agricultural lands, provide for navigation and to generate electricity. Negative impacts associated with the
building of large dams include displacement of people, loss of land and alteration of river flows and water
quality affecting downstream people and ecosystems (Gleick, 1993; Rosenberg et al., 1995; Poff et al., 1997;
Scudder, 1997; Lerer and Scudder, 1999; Tilt et al., 2009). Worldwide, many countries are likely to continue
depending on hydroelectric dams as their source of electricity. But such development should be in a manner
which addresses environmental concerns and the question how water resources can best be allocated.
It has been debated whether hydroelectric generation is merely an in-stream water user or whether it also
consumes water, in the sense of effectively taking away water from the river. In the upcoming World Congress
organised by the International Hydropower Association, 14-17 June in Brazil, a special session is even devoted
to the question: Does hydropower consume water? The session aims to explore different interpretations of water
‘consumption’ in an attempt to recognise the energy impacts on water. In this report we provide scientific
support for the argument that the production of hydroelectricity is in most cases a significant water consumer.
As an indicator of water consumption of hydroelectricity we use the concept of the water footprint, which
measures the volume of freshwater consumed and polluted to produce the product along its supply chain. The
water footprint of a product is equal to the sum of freshwater consumed or polluted divided by the quantity of
production of the product (Hoekstra and Chapagain, 2008; Hoekstra et al., 2011). The water footprint consists of
three components: the green water footprint (consumptive use of rainwater), the blue water footprint
(consumptive use of ground or surface water) and the grey water footprint (the volume of water polluted). The
analysis in this report is restricted to the quantification of the blue water footprint of hydroelectricity and focuses
on the consumptive use of water that relates to the evaporation from the artificial reservoirs that are created
behind hydroelectric dams.
Storage of water behind large hydropower dams leads to consumptive water use through evaporation from the
open water surface of the artificial lake. Gleick (1993) has shown that on average 1.5 m3 of water per GJ of
electricity produced is evaporated from hydroelectric facilities in California. By combining the estimate of
global evaporation from artificial water reservoirs in the world from Shiklomanov (2000) with data on global
8 / The water footprint of electricity from hydropower
hydroelectric generation from Gleick (1993), Gerbens-Leenes et al. (2009a) estimated that the global average
blue water footprint of electricity from hydropower is 22 m3/GJ.
The objective of the current study is to estimate the blue water footprint of hydroelectricity for 35 selected
reservoirs. First we estimate the evaporation throughout the year for the selected reservoirs. Next, we calculate
the water footprint of hydropower based on the annual evaporation rate and energy generated. We have
considered both the theoretical maximum and the actual hydroelectric generation of the plant. The theoretical
maximum hydroelectric generation refers to the energy that could be generated with 100% hydropower
availability. Since this theoretical maximum is not realistically attainable, comparisons among the hydropower
plants and further discussion of the water footprint will be based on the actual energy generation.
The selection of the hydropower plants has been largely arbitrary and mostly based on the availability of data.
All plants selected have been primarily built for the purpose of hydroelectric generation, although some serve
other purposes as well. With the exception of the largest hydropower plants such as Itaipu, Tucurui, Sayano
Shushenskaya, Robert-Bourossa, Yacyreta and Cahora Bassa all hydropower plants selected are the ones
included in World Bank (1996). The 35 hydropower plants have a total capacity of about 73 GW and represent
8% of the global installed hydroelectric capacity of 924 GW in 2007 (IEA, 2010).

2. Method and data
2.1 Method
The water footprint of electricity (WF, m3/GJ) generated from hydropower is calculated by dividing the amount
of water evaporated from the reservoir annually (WE, m3/yr) by the amount of energy generated (EG, GJ/yr):
EGWEWF = (1)
The total volume of evaporated water (WE, m3/yr) from the hydropower reservoir over the year is:
AEWEt
×
×= ∑
=
365
1
10
(2)
where E is the daily evaporation (mm/day) and A the area of the reservoir (ha).
There are a number of methods for the measurement or estimation of evaporation. These methods can be
grouped into several categories including (Singh and Xu, 1997): (i) empirical, (ii) water budget, (iii) energy
budget, (iv) mass transfer and (v) a combination of the previous methods.
Empirical methods relate pan evaporation, actual lake evaporation or lysimeter measurements to meteorological
factors using regression analyses. The weakness of these empirical methods is that they have a limited range of
applicability. The water budget methods are simple and can potentially provide a more reliable estimate of
evaporation, as long as each water budget component is accurately measured. However, owing to difficulties in
measuring some of the variables such as the seepage rate in a water system the water budget methods rarely
produce reliable results in practice (Lenters et al., 2005, Singh and Xu, 1997). In the energy budget method, the
evaporation from a water body is estimated as the difference between energy inputs and outputs measured at a
site. Energy budget methods are considered to be the most reliable in theory (Lenters et al., 2005, Singh and Xu,
1997), but require costly instrumentation and a large commitment of personnel for field work and data
processing (Winter et al., 1995). The mass-transfer (aerodynamic) based methods utilize the concept of eddy
motion transfer of water vapour from an evaporating surface to the atmosphere. The mass-transfer methods
normally use easily measurable variables and give satisfactory results in many cases. However, measurement of
wind speed and air temperature at inconsistent heights, have resulted in a large number of equations with similar
or identical structure (Singh and Xu, 1997). The combination methods combine the mass transfer and energy
budget principles in a single equation. Two of the most commonly known combination methods are the Penman
equation and the Penman-Monteith equation.
Owing to its limited empirical basis, the Penman-Monteith equation is more readily applicable to a variety of
water bodies. In addition, the model takes into account heat storage within water bodies. Therefore, for the

10 / The water footprint of electricity from hydropower
purpose of the current study the Penman-Monteith equation with heat storage is considered suitable for the
estimation of evaporation from the selected hydropower reservoirs.
The evaporation from the water surface (E, mm/day) is estimated using the Penman-Monteith equation with an
inclusion of water body heat storage. This equation is written as (McJannet et al., 2008):
+∆
−××+−×∆×=
γγ
λ w
awnw eeufGRE )()()(1 (3)
where E is open water evaporation (mm/day); λ the latent heat of vaporization (MJ/kg); Δw the slope of the
temperature saturation water vapour curve at water temperature (kPa/oC); Rn net radiation (MJ m-2day-1); G the
change in heat storage in the water body (MJ/m2/day); f(u) the wind function (MJ/m2/day/kPa); ew the saturated
vapour pressure at water temperature (kPa); ea the vapour pressure at air temperature (kPa); and γ the
psychometric constant (kPa/oC).
The latent heat of vaporisation (λ, MJ/kg) at air temperature (Ta, oC) is calculated as (McJannet et al., 2008):
a3T10361.2501.2λ −×−= (4)
The psychometric constant (γ, kPa/oC) is calculated from (Allen et al., 1998):
λλεγ PPc p
31063.1 −×=
×
×= (5)
in which P is the atmospheric pressure (kPa); cp the specific heat of air at constant pressure (which is equal to
1.013x10⁻³ MJ/kg/oC) and ε the ratio of molecular weight of water vapour to dry air and is equal to 0.622
(dimensionless).
The atmospheric pressure (P, kPa) varies with elevation above sea level (ψ, m) and is expressed as (Allen et al.,
1998):
26.5
2930065.02933.101
−
×=ψP (6)
The wind function f(u) (MJ/m2/day/kPa) is calculated from wind speed at 10 m (u10, m/s) and the so-called
equivalent area (Ae, km2) (Sweers, 1976):
)57.180.3(5)( 10
05.0
uA
ufe
+×
= (7)

The water footprint of electricity from hydropower / 11
The equivalent area (Ae, km2) is equal to the total surface area for regularly shaped reservoirs, but for irregularly
shaped reservoirs, it can be taken equal to the square of the mean width.
Saturated vapour pressure at air temperature (ea, kPa) is calculated from:
( )
+
×=3.237
27.17exp6108.0a
aa T
Te (8)
Net radiation (Rn, MJ m-2 d-1) is the difference between the net incoming short-wave radiation (Rns, MJ m-2 d-1)
and the net outgoing long-wave radiation (Rnl, MJ/m2/day) (Allen et al., 1998):
nlnsn RRR −= (9)
The net incoming short-wave radiation (Rns, MJ/m2/day) resulting from the balance between incoming and
reflected solar radiation is given by (Allen et al., 1998):
sns RR ×−= )1( α (10)
where α is the albedo coefficient for open water (dimensionless), which has a value of 0.07 (Lenters et al.,
2005), and Rs the incoming solar radiation (MJ/m2/day).
Solar radiation (Rs, MJ m-2 day-1) can be calculated with the Angstrom formula, which relates solar radiation to
extraterrestrial radiation and relative sunshine duration:
asss RNnbaR ××+= )( (11)
where n is the actual duration of sunshine (hours); N the maximum possible duration of sunshine or daylight
hours (hours); n/N the relative sunshine duration (which is equal to one minus the cloud cover fraction,
dimensionless); Ra extraterrestrial radiation (MJ/m2 /day); as a regression constant, expressing the fraction of
extraterrestrial radiation reaching the earth on overcast days (n = 0) and as+bs the fraction of extraterrestrial
radiation reaching the earth on clear days (when n = N).
Depending on atmospheric conditions (humidity, dust) and solar declination (latitude and month), the Angstrom
values as and bs will vary. Where no actual solar radiation data are available and no calibration has been carried
out for improved as and bs parameters, the values as = 0.25 and bs = 0.50 are taken as recommended by Allen et
al. (1998).

12 / The water footprint of electricity from hydropower
The extraterrestrial radiation, Ra, for each day of the year and for different latitudes, can be estimated from the
solar constant, the solar declination and the time of the year.
( ) ( ) ( ) ( ) ( )24 60 sin sin cos cos sina sc r s sR G d ω ϕ δ ϕ δ ωπ×
= × × × + × × (12)
where Gsc is the solar constant (which is equal to 0.0820 MJ/m2/day); dr the inverse relative distance Earth-Sun;
ω s the sunset hour angle (rad); ϕ the latitude (rad) and δ the solar decimation (rad).
The inverse relative distance Earth-Sun, dr, and the solar declination, δ, are given by:
×+= Jdr 365
2cos033.01 π (13)
−×= 39.1
3652sin409.0 Jπδ (14)
where J is the number of the day in the year between 1 (1 January) and 365 or 366 (31 December). The latitude
ϕ, expressed in radians, is positive for the northern hemisphere and negative for the southern hemisphere.
The sunset hour angle, ωs, is given by:
)]δtan()φtan(arccos[ωs ×−= (15)
The net outgoing long-wave radiation (Rnl, MJ/m2/day) is the difference between the outgoing long-wave
radiation (Rl↑, MJ/m2/day) and the incoming long-wave radiation (Rl↓, MJ m-2 d-1):
nl l lR R R= ↑ − ↓ (16)
The incoming long-wave radiation (Rl↓, MJ/m2/day) is calculated from (Fischer et al., 1979; Henderson-Sellers,
1986):
( ) ( )( )lwfaal rCTR −++××↓= 117.0115.273 24σε (17)
where εa is the emissivity of air (dimensionless); σ the Stefan-Boltzmann constant (4.903x10⁻⁹ MJ/K4/m2/day);
Cf the fractional cloud cover (dimensionless); and rlw the total reflectivity of the water surface for long wave
radiation, taken as a constant with a value of 0.03 (Henderson-Sellers, 1986).
The emissivity of air is calculated as (Swinbank, 1963):

The water footprint of electricity from hydropower / 13
( )215.273+×= aa TCεε (18)
where Cε = 9.37×10⁻⁶ K-2.
The outgoing long-wave radiation at water temperature (Rl↑, MJ/m2/day) is calculated as (Henderson-Sellers,
1986):
( )415.273+××↑= wwl TR σε (19)
where σ is the Stefan-Boltzmann constant (MJ/m2/K4/day); Tw the water surface temperature (oC); and εw the
emissivity of water, equal to 0.97.
The water temperature at day i (Twi, oC) is calculated from the following equation (De Bruin, 1982):
( )τ1exp)TT(TT e1i,wei,w −×−+= − (20)
where Tw,i-1 is the water temperature at day i-1 (oC); Te the equilibrium temperature (oC); and τ the time constant
(day).
The equilibrium temperature (Te, oC) is calculated as follows (De Bruin, 1982):
( ) ( ) ( )γuf15.273Tσ4RTT
n3
n
*n
ne+∆×++×
+= (21)
Wet-bulb temperature (Tn, oC) is calculated using vapour pressure (ea, kPa) and dew point temperature (Td, oC)
as follows (McJannet et al., 2008):
( )( )( )( )
2
2
0.00066 100 4098 / 237.3
0.00066 100 4098 / 237.3
a a d dn
a d
T e T TT
e T
× + + ×=
× + + (22)
The slope of the temperature saturation water vapour curve at wet bulb temperature (Δn, kPa/K) is:
( )( )2n
n
n
n 3.237T
3.237TT27.17exp6108.04098
+
+
××
=∆ (23)
Net radiation at wet-bulb temperature ( *nR , MJ/m2/day) is calculated using albedo (α) as follows:

14 / The water footprint of electricity from hydropower
( ) ( )nllsn RRRR ↑−↓+×−= α1* (24)
Outgoing long-wave radiation at wet-bulb temperature (Rl↑n, MJ/m2/day) is calculated, based on Finch and Gash
(2002):
( ) ( ) ( )( )anaafnl TTTTCR −×+×++××=↑ 34 15.273415.273 σσ (25)
where Cf is fractional cloud cover.
The time constant (τ, day) is given as (De Bruin, 1982):
( ) ( ) ( )γσρτ
+∆×++×
××=
nn
ww
ufThc
315.2734 (26)
where ρw is the density of water (= 1000 kg/m3); cw the specific heat of water (= 0.0042 MJ/kg/K); and h the
depth of water (m), estimated from reservoir volume capacity and area.
Change in the heat storage in the water body (G, MJ/m2/day) is calculated from Finch (2001):
( )1i,wi,www TThcρG −−×××= (27)
Saturated vapour pressure at water temperature (ew, kPa) is calculated from:
( )17.27
0.6108 exp237.3
ww
w
Te
T
= × + (28)
Finally, the slope of the temperature saturation water vapour curve at water temperature (Δw, kPa oC-1) is:
( )( )23.237
3.23727.17exp6108.04098
+
+
××
=∆w
w
w
w T
TT
(29)
The water footprint of electricity from hydropower is compared with the water footprint of electricity from
combustion of primary crops. The latter has been calculated per type of crop by first multiplying the water
footprint of the primary crop in m3/ton from Mekonnen and Hoekstra (2011) by the harvest index for that crop
to get the water footprint in m3 per ton of total biomass harvested. Harvest indices were taken from Gerbens-

The water footprint of electricity from hydropower / 15
Leenes et al. (2009a,b). Next, the water footprint of total biomass was divided by the bio-electricity output per
unit of crop (GJ/ton) as reported by Gerbens-Leenes et al. (2008).
2.2 Data
Data on installed hydroelectric capacity, actual hydroelectric generation and reservoir area were obtained from
the World Bank (1996). For some hydropower plants data were obtained from Dorcey et al. (1997) and other
sources. Data on reservoir water holding capacity were obtained mainly from Chao et al. (2008). Appendix I
provides data on installed capacity, hydroelectric generation, reservoir capacity and reservoir area for the
selected hydropower plants.
Daily values of mean air temperature, dew point temperature and wind speed for the selected meteorological
stations were obtained from NCDC (2009). The daily data for the years 1996-2005 were averaged in order to fill
missing values and smooth out some inconsistencies in the data. Monthly values of cloud cover and percentage
of maximum possible sunshine with a spatial resolution of 10 arc minute were obtained from the CRU CL-2.0
database (New et al., 2002). The cloud cover and sunshine duration were available only as monthly averages for
the period 1961-1990. Therefore the monthly average values were used as daily values for each month of the
year.


3. Results: the water footprint of hydroelectricity
The aggregated blue water footprint of the 35 selected hydropower plants is 90 Gm3/yr, which is equivalent to
10% of the blue water footprint of global crop production in the year 2000 (Mekonnen and Hoekstra, 2011;
Fader et al., 2011). The total blue water footprint of hydroelectric generation in the world must be considerably
larger if one considers the fact that this study covers only 8% of the global installed hydroelectric capacity.
Appendix II provides a map of the locations of the hydropower sites included in this study and the total water
footprint associated per plant. The annual evaporation from hydropower reservoirs depends on both climate
(which determines the evaporation from the water surface in mm/yr) and reservoir area.
The water footprint of electricity from hydropower for the 35 selected hydropower plants is presented in Table
1. The average water footprint of electricity from hydropower for the selected plants is 68 m3/GJ. There is a
large variation in water footprint among the different power plants, ranging from 0.3 m3/GJ for San Carlos in
Colombia to 846 m3/GJ for Akosombo-Kpong in Ghana.
Most of the reservoirs show an evaporation rate between 2000 and 3000 mm/yr. Reservoirs in the tropics have
generally a higher evaporation rate than reservoirs in temperate and sub-tropic climatic regions. The surface
water evaporation varies from no more than 486 mm/yr from the Sayano Shushenskaya reservoir in Russia to
3059 mm/yr from the Cahora Bassa reservoir in the Zambezi River in Mozambique (Table 1). Minimum and
maximum evaporation rates thus differ by a factor of six, which partially explains the differences between the
water footprints of different hydropower reservoirs. The size of the reservoir surface in relation to the installed
hydroelectric capacity, however, has a much bigger impact on the ultimate water footprint of hydroelectricity.
While the average reservoir area per unit of installed capacity in the reservoirs studied is 83 ha/MW, the
minimum is 0.26 ha/MW (San Carlos reservoir, Colombia) and the maximum 720 ha/MW (Akosombo-Kpong
in the Volta River, Ghana). The total evaporation from a hydropower reservoir thus depends more on its size
than on climate. This is illustrated in Figure 1, which shows a more or less linear relationship between the water
footprint of the power plants and ha/MW. Hydropower plants that inundate a large area per unit of installed
capacity have in general a larger water footprint per unit of electricity generated than those that flood a small
area per unit of installed capacity.
The largest hydropower plant in terms of installed hydroelectric capacity in this study, the Itaipu dam in the
Paraná River at the border of Brazil and Paraguay, has a water footprint of 7.6 m3/GJ. The second-largest
studied hydropower plant in terms of MW, the Guri reservoir in Venezuela, has a water footprint that is close to
the global average of 68 m3/GJ found in this study. The largest plant in terms of MW that has a water footprint
far beyond the average found in this study is the Cahora Bassa dam in the Zambezi River in Mozambique, with
a water footprint of 186 m3/GJ.

18 / The water footprint of electricity from hydropower
Table 1. Water footprint of electricity for selected hydropower plants.
Power plant Reservoir
area [ha]
Installed capacity
[MW]
Evaporation Water footprint [m3/GJ]
[mm/yr] [Gm3/yr]
for theoretical maximum
energy production
for actual energy
production
Akosombo-Kpong* 850200 1180 2185 18.58 499 846
Bayano 35000 150 2156 0.75 160 381
Cahora Bassa 266000 2075 3059 8.14 124 186
Cerron Grande (Silencio) 13500 135 2267 0.31 71.9 152
Chivor (La Esmerelda) 1200 1008 1607 0.02 0.6 1.7
Chixoy 1300 300 2393 0.03 3.3 6.4
Cirata 6100 500 2626 0.16 10.2 31.1
El Chocon 81600 1200 2089 1.70 45.0 131
Estreito 45600 1050 2285 1.04 31.5 70.6
Fortuna 1000 300 2251 0.02 2.4 4.3
Guri 426000 10300 2787 11.87 36.6 71.7
Itaipu 135000 14000 1808 2.44 5.5 7.6
Itezhi Tezhi 37000 600 2572 0.95 50.3 94.4
Itumbiara 76000 2082 2239 1.70 26 52.5
Jaguari 7001 460 1782 0.12 8.6 14.4
Karakaya 29800 1800 1920 0.57 10.1 21.8
Kariba 510000 1320 2860 14.59 350 633
Kiambere 2500 150 2356 0.06 12.5 18.0
Kulekhani 2000 60 1574 0.03 16.6 47.0
Lubuge 400 600 1040 0.00 0.2 0.5
Marimbondo 43800 1400 2330 1.02 23.1 38.3
Morazan (El Cajo) 9400 300 2622 0.25 26.1 52.2
Nam Ngum 37000 150 2411 0.89 189 252
Pehuenche 200 500 1884 0.00 0.2 0.4
Playas 1100 204 1663 0.02 2.8 3.6
Robert-Bourossa-La Grande-2A** 281500 7722 586 1.65 6.8 8.3
Saguling 5600 700 2422 0.14 6.1 17.5
San Carlos 300 1145 1726 0.01 0.1 0.3
Sao Simao 67400 1635 2229 1.50 29.1 40.8
Sayano Shushenskaya 62100 6400 486 0.30 1.5 3.6
Sir 4100 315 1973 0.08 8.1 31.0
Sobradinho 421400 1050 2841 11.97 362 399
Tucurui (Raul G. Lhano) 243000 8400 2378 5.78 21.8 49.5
Yacyreta 172000 2700 1907 3.28 47.8 79.6
Yantan 10800 1210 1646 0.18 4.7 7.7
Average 2320 90 39 68
* The data are for the combined Akosombo-Kpong system. Kpong is a runoff power plant using Akosombo dam. Akosombo
and Kpong generate 1020 MW and 160 MW respectively.
** Robert-Bourossa together with La Grande-2A use the Robert-Bourossa reservoir and generate 5616 MW and 2106 MW
respectively. Energy generation of La Grand-2-A is assumed to be half of that of Robert-Bourossa

The water footprint of electricity from hydropower / 19
0
40
80
120
0 20 40 60 80
Wat
er fo
otpr
int [
m3 /G
J]
Flooded area per unit of installed capacity [ha/MW]
R² = 0.9559
0
200
400
600
800
1000
0 100 200 300 400 500 600 700 800
Wat
er f
ootp
rint [
m3 /
GJ]
Flooded area per unit of installedcapacity [ha/MW]
Akosombo
Kariba
Sobradinho
Nam Ngum
Bayano
Yacyreta
Itezhi Tezhi
Sao Simao
Robert-Bourossa
San Carlos
Figure 1. Relation between the water footprint of hydroelectricity and the flooded area per unit of installed hydroelectric capacity.
When we compare the water footprint of electricity from hydropower with the water footprint of electricity from
other renewable sources, it appears that hydroelectricity has a relatively large water footprint per GJ. The blue
water footprint of electricity from wind and solar energy is estimated to be well below 1 m3/GJ (Gerbens-Leenes
et al., 2009a). The blue water footprint of bio-electricity – when derived from combustion of the full biomass of
primary crops – ranges from zero to 40 m3/GJ, depending on which crop is used for comparison and to which
extent it is irrigated. The 40 m3/GJ refers to bio-electricity from combustion of cotton, which is a rather
theoretical example, because cotton is in practice not used for the purpose of electricity generation. Also other
crops are rarely used for that purpose. More common feedstock for the generation of bio-electricity are crop
residues, animal manure, wood wastes from forestry and industry, residues from food and paper industries,
municipal green wastes and sewage sludge. In all those cases, the water footprint of bio-electricity will be much
lower than the water footprint of bio-electricity from combustion of primary crops, because the water footprint
of biomass is largely attributed to the primary product and not to the residues and waste (Hoekstra et al., 2011).

20 / The water footprint of electricity from hydropower
Figure 2 compares the blue water footprint of electricity from hydropower with the total (green+blue+grey)
water footprint of electricity from combustion of primary crops. For a fair comparison one should compare the
blue water footprints. But even when comparing the total water footprints, bioelectricity from a number of crops
– including sugar beet, sugar cane and maize – will have a smaller water footprint than hydroelectricity. In other
words, one drop of blue water allocated for consumption for hydroelectric generation generally yields much less
energy than one drop of blue water allocated for consumption in crop production for generating feedstock for
bioelectricity. This is not to suggest that in general it is advisable to allocate water to grow crops for producing
bioelectricity rather than to generate a much lower amount of hydroelectricity at the cost of the same volume of
water. In many cases this alternative allocation is not a reasonable choice, or even impossible (e.g. due to the
unavailability of suitable land). Besides, for such broad decisions as investing in different sectors, one needs to
take into account all relevant economic, social and environmental factors, not the factor of water productivity
alone. Also one should account for the fact that many hydroelectric dams are designed to serve other purposes as
well. What we do want to argue, however, is that hydroelectric generation is generally a large water consumer
and that in allocating water to hydroelectric generation it is advisable to explore the foregone costs by not
allocating the water to alternative uses, either upstream or downstream of the location of a planned hydropower
reservoir. Alternative uses include crop growing for bioelectricity, but more common alternatives are to allocate
the blue water to grow crops for food, feed, fibres or biofuel or to let the blue water in the river to maintain
environmental flows.
0
50
100
150
200
Wat
er fo
otpr
int [
m3 /G
J]
Grey Blue Green
Figure 2. Global average water footprint of electricity from hydropower compared to the water footprint of electricity from combustion of primary crops.

4. Discussion
The water footprints of the artificial reservoirs analysed in this study were fully attributed to hydroelectric
generation, even though some of the reservoirs serve other purposes as well, such as flood control and irrigation.
We justify this choice by the fact that all selected hydropower dams and associated reservoirs were primarily
created for hydroelectric generation. Future research could be directed towards the analysis of the water
footprint of reservoirs created for storing water for irrigation or other purposes and on tackling the water
footprint attribution issue when reservoirs are used for multiple purposes.
The model output is sensitive to a number of input parameters such as air temperature, wind speed and water
body depth. Since climatic data at the dam site are available only for a few plants, data from the most nearby
climatic stations have been used, some of which are a bit far from the reservoir (see Appendix I). Due to the
uncertainties in the input data, the data presented should be seen as indicative. The order of magnitude of the
results, however, will not change with better data, so that the results are good enough to compare the water
footprint of hydroelectricity with the water footprint of other forms of electricity and to make rough
comparisons between the water footprints of different hydropower sites.
Most reservoirs have a varying water surface area over time, as a result of changes in water volume during the
year and between years. The difference between minimum and maximum area relative to the maximum area
over a multi-year period differs greatly across reservoirs. In this study we have used a fixed reservoir area as
provided by World Bank (1997) and Dorcey et al. (1997). Since reported areas generally refer to the maximum,
this can lead to some overestimation of evaporation over the year. It is very difficult to find good data of area
changes over the year; future studies devoted to particular sites could improve this.
We have estimated the water footprint per reservoir by considering the total evaporation from the reservoir,
whereas one could argue that before the reservoir was created there was evaporation from the area as well,
probably not so much from the original flowing river (since in most cases the reservoir area is much larger than
the original river water area) but possibly significant from the inundated land. However, here it is relevant to
recall the definition and meaning of the water footprint. The water footprint is not meant to refer to additional
evaporation (compared to some reference situation), but for quantifying the volume of water consumption that
can be associated with a specific human purpose (Hoekstra et al., 2011). From this perspective, the full reservoir
evaporation can be attributed to the purpose of the reservoir.
The study has been limited to the estimation of the evaporation from reservoirs, i.e. the so-called operational
water footprint of hydroelectric generation. The study does not include an assessment of the supply-chain water
footprint of hydroelectric generation, which is expected to be much smaller than the operational water footprint.
The supply-chain water footprint refers to the water footprint of producing the materials used in the construction
and the operation and maintenance of the site.

22 / The water footprint of electricity from hydropower
The current study does not claim to be exhaustive in terms of showing both the beneficial and negative effects of
hydropower. The study has been restricted to the estimation of the water footprint of different hydropower
plants. Environmental issues surrounding hydropower dams relate to, for example: physical, chemical,
biological and geomorphological aspects of blocking a river; flooding of natural habitats and related loss of
plants and animals; alteration of water flow regimes; and water quality problems due to the decay of submerged
vegetations. On the other hand, hydropower is often perceived as a clean and cost-effective source of renewable
energy. Many countries rely upon hydropower for a substantial portion of their electricity supply. Between 1973
and 2008, hydroelectric generation grew from 1295 TWh to 3288 TWh, which is a growth by a factor 2.5 (IEA,
2010). Further development of hydropower should take into account all the associated environmental and social
costs. In this respect, the water footprint of hydroelectricity, i.e. the consumptive use of water, should be
considered as one item in environmental impact assessment studies for newly proposed hydroelectric dams.

5. Conclusion
Hydroelectric generation has historically been considered as a non-consumptive water user; however, through
the estimation of the blue water footprint of hydroelectricity at 35 sites, this study finds that hydropower is a
large consumptive user of water. The amount of water lost through evaporation annually from the selected
reservoirs is equivalent to 10% of the global blue water footprint related to crop production. The 35 sites
represent only 8% of the global installed hydroelectric capacity. The study shows that the range of water
footprint values for the different hydropower plants is very wide. Although local climate has an influence, the
water footprint of hydroelectricity is largely influenced by the area flooded per unit of installed capacity. The
water footprint linearly increases with the area flooded per unit of installed capacity.
The water evaporated from the reservoir is seldom taken into account in assessing the pros and cons of
constructing dams for hydroelectric generation. This study demonstrates that accounting for water loss through
evaporation is an additional consideration when evaluating the environmental, social and economic
sustainability of a proposed dam or in the evaluation of hydropower as an energy source. We recommend that
water footprint assessment is added as a component in evaluations of newly proposed hydropower plants as well
as in the evaluation of existing hydroelectric dams, so that the consequences of the water footprint of
hydroelectric generation on downstream environmental flows and other water users can be evaluated.
The water footprint of hydroelectric dams should be considered in the context of the river basin in which this
water footprint occurs, because competition over water and possible alternative uses of water differ per basin.
This study contributes new information that can be used in river basin planning and water allocation decisions.
Sustainable development of hydropower requires the accounting and internalization of all external costs
including water consumption. Internalization means that the economic and environmental costs of the water
consumed are charged to the operator of a hydropower plant and included in the price of hydroelectricity. It
should thereby be acknowledged that water consumption costs vary within the year and across river basins,
since the degree of water scarcity and competition over water depend on the period within the year and local
circumstances.


References Allen, R.G., Pereira, L.S., Raes, D. and Smith, M. (1998) Crop evapotranspiration: guidelines for computing
crop water requirements, FAO Drainage and Irrigation Paper 56, Food and Agriculture Organization, Rome.
Chao, B. F., Wu, Y. H. and Li, Y. S. (2008) Impact of artificial reservoir water impoundment on global sea
level, Science 320(5873): 212-214.
De Bruin, H.A.R. (1982) Temperature and energy balance of a water reservoir determined from standard
weather data of a land station, Journal of Hydrology 59(3-4): 261-274.
Dorcey, T., Steiner, A., Acreman, M., and Orlando, B. (Eds.) (1997) Large dams: Learning from the past,
looking at the future, Workshop Proceedings, IUCN, Gland, Switzerland and Cambridge, UK and the
World Bank Group, Washington, D.C., US.
Fader, M., Gerten, D., Thammer, M., Heinke, J., Lotze-Campen, H., Lucht, W. and Cramer, W. (2011) Internal
and external green-blue agricultural water footprints of nations, and related water and land savings through
trade, Hydrology and Earth System Sciences, 15(5): 1641-1660.
Finch, J. W. and Gash, J. H. C. (2002) Application of a simple finite difference model for estimating
evaporation from open water, Journal of Hydrology 255(1-4): 253-259.
Finch, J. W. (2001) A comparison between measured and modelled open water evaporation from a reservoir in
south-east England, Hydrological Processes 15(14): 2771-2778.
Fischer, H.B., List, E.J., Koh, R.C.Y., Imberger, J. and Brooks, N.H. (1979) Mixing in inland and coastal
waters, Academic Press, San Diego.
Gerbens-Leenes, P.W., Hoekstra, A.Y. and Van der Meer, Th.H. (2008) Water footprint of bio-energy and other
primary energy carriers, Value of Water Research Report Series No. 29, UNESCO-IHE, Delft, the
Netherlands.
Gerbens-Leenes, P.W. Hoekstra, A.Y. and Van der Meer. Th. (2009a) The water footprint of energy from
biomass: A quantitative assessment and consequences of an increasing share of bio-energy in energy
supply, Ecological Economics 68(4): 1052-1060.
Gerbens-Leenes, W., Hoekstra, A.Y. and Van der Meer, T.H. (2009b) The water footprint of bioenergy,
Proceedings of the National Academy of Sciences 106 (25): 10219-10223.
Gleick, P.H. (1993) Water and energy, In: Gleick, P.H. (ed.) Water in crisis, A guide to the world's freshwater
resources, Oxford University Press, New York, pp. 67–79.
Henderson-Sellers, B. (1986) Calculating the surface energy balance for lake and reservoir modelling: A review.
Reviews of Geophysics 24(3): 625-649.
Hoekstra, A.Y. and Chapagain, A.K. (2008) Globalization of water: Sharing the planet’s freshwater resources,
Blackwell Publishing, Oxford, UK.
Hoekstra, A.Y., Chapagain, A.K., Aldaya, M.M. and Mekonnen, M.M. (2011) The water footprint assessment
manual: Setting the global standard, Earthscan, London, UK.
IEA (2010) Key world energy statistics 2010, International Energy Agency, Paris, France.
Lenters, J. D., Kratz, T. K. and Bowser, C. J. (2005) Effects of climate variability on lake evaporation: Results
from a long-term energy budget study of sparkling lake, northern Wisconsin (USA), Journal of Hydrology
308(1-4): 168-195.

26 / The water footprint of electricity from hydropower
Lerer, L. B. and Scudder, T. (1999) Health impacts of large dams, Environmental Impact Assessment Review
19(2), 113-123.
McJannet, D.L., Webster, I.T., Stenson, M.P. and Sherman, B.S. (2008) Estimating open water evaporation for
the Murray Darling basin, Report for CSIRO, Australia.
Mekonnen, M.M. and Hoekstra, A.Y. (2011) The green, blue and grey water footprint of crops and derived crop
products, Hydrology and Earth System Sciences, 15(5): 1577-1600.
NCDC (2009) Global surface summary of the day, National Climatic Data Center,
http://www.ncdc.noaa.gov/cgi-bin/res40.pl?page=gsod.html and ftp://ftp.ncdc.noaa.gov/pub/data/gsod
(last access: Feb 5, 2009).
New, M., Lister, D., Hulme, M. and Makin, I. (2002) A high-resolution data set of surface climate over global
land areas, Climate Research, 21(1): 1-25.
Poff, N.L., Allan, J.D., Bain, M.B., Karr, J.R., Prestegaard, K.L., Richter, B.D., Sparks, R.E., and Stromberg, J.C.
(1997) The natural flow regime: a paradigm for river conservation and restoration, BioScience 47:769-784.
Rosenberg, D.M., Bodaly, R.A. and Usher, P.J. (1995) Environmental and social impacts of large scale
hydroelectric development: who is listening? Global Environmental Change 5 (2): 127-148.
Scudder, T. (1997) Social impacts of large dam projects, In: Dorcey, T., Steiner, A., Acreman, M., and Orlando,
B. (eds.) Large dams: Learning from the past, looking at the future, Workshop Proceedings, IUCN, Gland,
Switzerland and Cambridge, UK and the World Bank Group, Washington, D.C., US.
Sellers, W. D. (1965) Physical climatology, University of Chicago Press, Chicago, Illinois.
Shiklomanov, I.A. (2000) Appraisal and assessment of world water resources, Water International 25(1): 11-32.
Singh, V.P. and Xu, C.-Y. (1997) Evaluation and generalization of 13 mass-transfer equations for determining
free water evaporation, Hydrological Processes 11(3): 311-323.
Sternberg, R. (2008) Hydropower: dimensions of social and environmental coexistence, Renewable and
Sustainable Energy Reviews 12(6): 1588-1621.
Sternberg, R. (2010) Hydropower's future, the environment, and global electricity systems, Renewable and
Sustainable Energy Reviews 14(2): 713-723.
Sweers, H. E. (1976) A monogram to estimate the heat-exchange coefficient at the air-water interface as a
function of wind speed and temperature; a critical survey of some literature, Journal of Hydrology 30(4):
375-401.
Swinbank, W. C. (1963) Long-wave radiation from clear skies, Quarterly Journal of the Royal Meteorological
Society 89 (381): 339-348.
Tilt, B., Braun, Y. and He, D. (2009) Social impacts of large dam projects: A comparison of international case
studies and implications for best practice, Journal of Environmental Management 90 (Supplement 3),
S249-S257.
Winter, T. C., Rosenberry, D. O. and Sturrock, A. M. (1995) Evaluation of 11 equations for determining
evaporation for a small lake in the north central united states, Water Resource Research 31(4): 983-993.
World Bank (1996) The World Bank’s experience with large dams: a preliminary review of impacts, Operations
Evaluation Department, World Bank, Washington, D.C., US.
World Commission on Dams (2000) Dams and development: a new framework for decision-making, Earthscan,
London, UK.

Appendix I: Data on the location, reservoir capacity and area, installed capacity and hydroelectric generation of selected hydropower plants
Reservoir Country
Coordinate system at dam site
Dam height
Reservoir capacity*
Reservoir area**
Installed capacity**
Hydroelectric generation [GWh/yr]** Nearest climatic
station***
Coordinate system of station***
LAT LON [m] [106 m3] [ha] [MW] theoretical maximum
actual production LAT LON
Itaipu Brazil-Paraguay -25.409 -54.589 196 29000 135000 14000 122640 88964 Foz Do Iguacu (Aero) -25.517 -54.583
Guri Venezuela 7.767 -63.000 162 135000 426000 10300 90228 46000 Ciudad Bolivar 8.150 -63.550 Tucurui Brazil -3.867 -49.733 93 36375 243000 8400 73584 32412 Tucurui -3.717 -49.717 Sayano Shushenskaya Russia 52.826 91.371 245 31300 62100 6400 56064 23500 Beja 53.050 90.917
Robert-Bourossa Canada 53.795 -77.441 170 61700 281500 7722 67645 55346 La Grande Riviere 53.633 -77.700
Yacyreta Argentina/ Paraguay -27.567 -56.733 43 21000 172000 2700 19080 11448 Posadas Aero. -27.367 -55.967 Cahora Bassa Mozambique -15.567 32.700 171 55800 266000 2075 18177 12133 Kanyemba -15.633 30.417 Karakaya Turkey 38.833 38.750 173 9580 29800 1800 15768 7300 Elazig 38.600 39.283 Sao Simao Brazil -18.933 -50.517 120 12540 67400 1635 14323 10223 Uberlandia -18.883 -48.217 Marimbondo Brazil -20.303 -49.198 90 6150 43800 1400 12264 7400 Uberaba -19.783 -47.967 Kariba Zambia-Zimbabwe -16.750 28.750 128 180600 510000 1320 11563 6400 Kariba -16.517 28.883 Yantan China 23.854 108.132 110 2430 10800 1210 10600 6420 Da-Wan 23.850 109.417 El Chocon Argentina -39.283 -68.767 86 20200 81600 1200 10512 3621 Neuquen Aero -38.950 -68.133
San Carlos Colombia 6.207 -74.839 77 72 300 1145 10030 5400 Rionegro/J.M. Cordov 6.133 -75.433
Estreito Brazil -20.155 -47.281 92 1418 45600 1050 9198 4100 Uberaba -19.783 -47.967
Sobradinho Brazil -9.467 -40.834 33 34100 421400 1050 9198 8326 Petrolina (Aeroport) -9.350 -40.550
Akosombo-Kpong Ghana 6.300 0.059 134 150000 850200 1180 9461 6100 Atakpame 7.583 1.117 Chivor (La Esmerelda) Colombia 5.033 -73.417 237 760 1200 1008 8830 3100
Bogota/Eldorado 4.700 -74.133
Itumbiara Brazil -18.417 -49.250 106 17000 76000 2082 18238 9000 Uberlandia -18.883 -48.217 Saguling Indonesia -6.913 107.367 99 875 5600 700 6132 2156 Bandung -6.883 107.600
Itezhi Tezhi Zambia -15.765 26.018 65 5600 37000 600 5256 2800 Lusaka City Airport -15.417 28.467
Lubuge China 25.712 104.794 100 1110 400 600 5256 2400 Xingren 25.433 105.183 Cirata Indonesia -6.701 107.367 125 3165 6100 500 4380 1430 Bandung -6.883 107.600
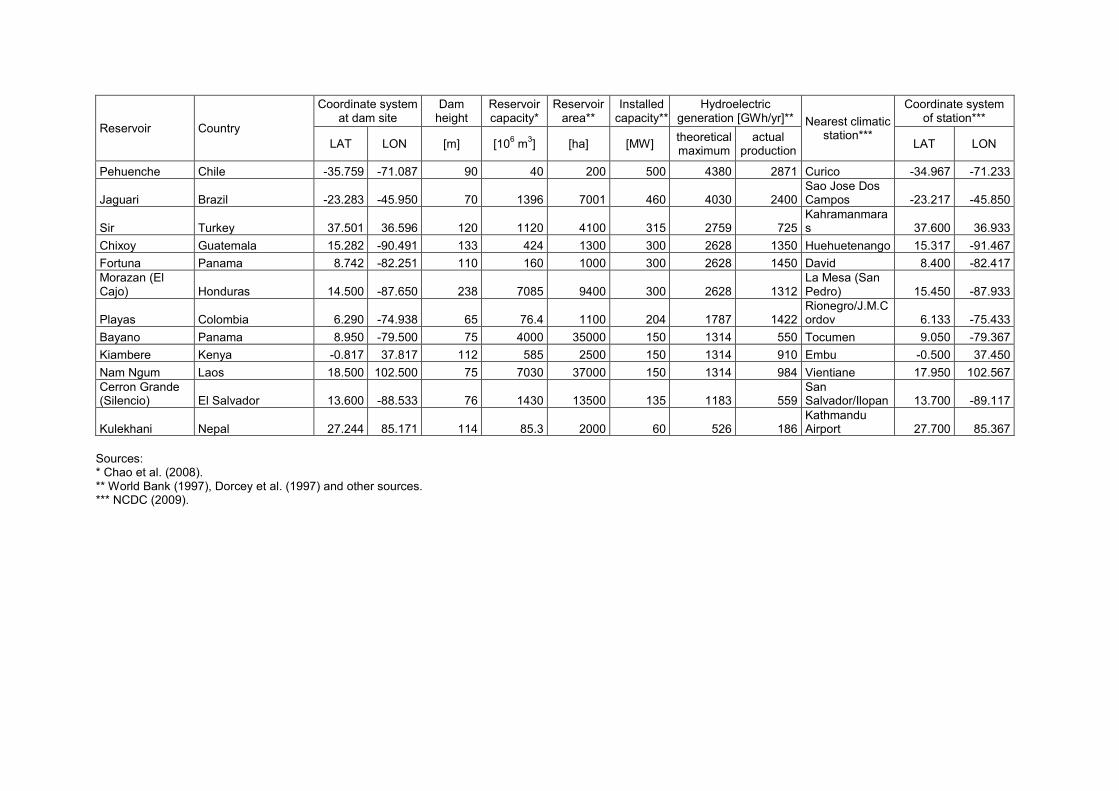
Reservoir Country
Coordinate system at dam site
Dam height
Reservoir capacity*
Reservoir area**
Installed capacity**
Hydroelectric generation [GWh/yr]** Nearest climatic
station***
Coordinate system of station***
LAT LON [m] [106 m3] [ha] [MW] theoretical maximum
actual production LAT LON
Pehuenche Chile -35.759 -71.087 90 40 200 500 4380 2871 Curico -34.967 -71.233
Jaguari Brazil -23.283 -45.950 70 1396 7001 460 4030 2400 Sao Jose Dos Campos -23.217 -45.850
Sir Turkey 37.501 36.596 120 1120 4100 315 2759 725 Kahramanmaras 37.600 36.933
Chixoy Guatemala 15.282 -90.491 133 424 1300 300 2628 1350 Huehuetenango 15.317 -91.467 Fortuna Panama 8.742 -82.251 110 160 1000 300 2628 1450 David 8.400 -82.417 Morazan (El Cajo) Honduras 14.500 -87.650 238 7085 9400 300 2628 1312
La Mesa (San Pedro) 15.450 -87.933
Playas Colombia 6.290 -74.938 65 76.4 1100 204 1787 1422 Rionegro/J.M.Cordov 6.133 -75.433
Bayano Panama 8.950 -79.500 75 4000 35000 150 1314 550 Tocumen 9.050 -79.367 Kiambere Kenya -0.817 37.817 112 585 2500 150 1314 910 Embu -0.500 37.450 Nam Ngum Laos 18.500 102.500 75 7030 37000 150 1314 984 Vientiane 17.950 102.567 Cerron Grande (Silencio) El Salvador 13.600 -88.533 76 1430 13500 135 1183 559
San Salvador/Ilopan 13.700 -89.117
Kulekhani Nepal 27.244 85.171 114 85.3 2000 60 526 186 Kathmandu Airport 27.700 85.367
Sources: * Chao et al. (2008). ** World Bank (1997), Dorcey et al. (1997) and other sources. *** NCDC (2009).

Appendix II: Water footprint of selected hydropower plants in the world
The map shows the location of the selected hydropower plants and the total water footprint for plants with total water footprint above 1Gm3/yr.


Value of Water Research Report Series Editorial board: A.Y. Hoekstra, University of Twente; H.H.G. Savenije, Delft University of Technology; P. van der Zaag, UNESCO-IHE. 1. Exploring methods to assess the value of water: A case study on the Zambezi basin. A.K. Chapagain − February 2000 2. Water value flows: A case study on the Zambezi basin. A.Y. Hoekstra, H.H.G. Savenije and A.K. Chapagain − March 2000 3. The water value-flow concept. I.M. Seyam and A.Y. Hoekstra − December 2000 4. The value of irrigation water in Nyanyadzi smallholder irrigation scheme, Zimbabwe. G.T. Pazvakawambwa and P. van der Zaag – January 2001 5. The economic valuation of water: Principles and methods J.I. Agudelo – August 2001 6. The economic valuation of water for agriculture: A simple method applied to the eight Zambezi basin countries J.I. Agudelo and A.Y. Hoekstra – August 2001 7. The value of freshwater wetlands in the Zambezi basin I.M. Seyam, A.Y. Hoekstra, G.S. Ngabirano and H.H.G. Savenije – August 2001 8. ‘Demand management’ and ‘Water as an economic good’: Paradigms with pitfalls H.H.G. Savenije and P. van der Zaag – October 2001 9. Why water is not an ordinary economic good H.H.G. Savenije – October 2001 10. Calculation methods to assess the value of upstream water flows and storage as a function of downstream benefits I.M. Seyam, A.Y. Hoekstra and H.H.G. Savenije – October 2001 11. Virtual water trade: A quantification of virtual water flows between nations in relation to international crop trade A.Y. Hoekstra and P.Q. Hung – September 2002 12. Virtual water trade: Proceedings of the international expert meeting on virtual water trade
A.Y. Hoekstra (ed.) – February 2003 13. Virtual water flows between nations in relation to trade in livestock and livestock products A.K. Chapagain and A.Y. Hoekstra – July 2003 14. The water needed to have the Dutch drink coffee A.K. Chapagain and A.Y. Hoekstra – August 2003 15. The water needed to have the Dutch drink tea A.K. Chapagain and A.Y. Hoekstra – August 2003 16. Water footprints of nations, Volume 1: Main Report, Volume 2: Appendices A.K. Chapagain and A.Y. Hoekstra – November 2004 17. Saving water through global trade A.K. Chapagain, A.Y. Hoekstra and H.H.G. Savenije – September 2005 18. The water footprint of cotton consumption A.K. Chapagain, A.Y. Hoekstra, H.H.G. Savenije and R. Gautam – September 2005 19. Water as an economic good: the value of pricing and the failure of markets P. van der Zaag and H.H.G. Savenije – July 2006 20. The global dimension of water governance: Nine reasons for global arrangements in order to cope with local water problems A.Y. Hoekstra – July 2006 21. The water footprints of Morocco and the Netherlands A.Y. Hoekstra and A.K. Chapagain – July 2006 22. Water’s vulnerable value in Africa P. van der Zaag – July 2006 23. Human appropriation of natural capital: Comparing ecological footprint and water footprint analysis A.Y. Hoekstra – July 2007 24. A river basin as a common-pool resource: A case study for the Jaguaribe basin in Brazil P.R. van Oel, M.S. Krol and A.Y. Hoekstra – July 2007 25. Strategic importance of green water in international crop trade M.M. Aldaya, A.Y. Hoekstra and J.A. Allan – March 2008 26. Global water governance: Conceptual design of global institutional arrangements M.P. Verkerk, A.Y. Hoekstra and P.W. Gerbens-Leenes – March 2008 27. Business water footprint accounting: A tool to assess how production of goods and services impact on freshwater resources worldwide P.W. Gerbens-Leenes and A.Y. Hoekstra – March 2008 28. Water neutral: reducing and offsetting the impacts of water footprints A.Y. Hoekstra – March 2008 29. Water footprint of bio-energy and other primary energy carriers P.W. Gerbens-Leenes, A.Y. Hoekstra and Th.H. van der Meer – March 2008 30. Food consumption patterns and their effect on water requirement in China J. Liu and H.H.G. Savenije – March 2008 31. Going against the flow: A critical analysis of virtual water trade in the context of India’s National River Linking Programme S. Verma, D.A. Kampman, P. van der Zaag and A.Y. Hoekstra – March 2008 32. The water footprint of India D.A. Kampman, A.Y. Hoekstra and M.S. Krol – May 2008

33. The external water footprint of the Netherlands: Quantification and impact assessment P.R. van Oel, M.M. Mekonnen and A.Y. Hoekstra – May 2008 34. The water footprint of bio-energy: Global water use for bio-ethanol, bio-diesel, heat and electricity P.W. Gerbens-Leenes, A.Y. Hoekstra and Th.H. van der Meer – August 2008 35. Water footprint analysis for the Guadiana river basin M.M. Aldaya and M.R. Llamas – November 2008 36. The water needed to have Italians eat pasta and pizza M.M. Aldaya and A.Y. Hoekstra – May 2009 37. The water footprint of Indonesian provinces related to the consumption of crop products F. Bulsink, A.Y. Hoekstra and M.J. Booij – May 2009 38. The water footprint of sweeteners and bio-ethanol from sugar cane, sugar beet and maize P.W. Gerbens-Leenes and A.Y. Hoekstra – November 2009 39. A pilot in corporate water footprint accounting and impact assessment: The water footprint of a sugar-containing carbonated beverage A.E. Ercin, M.M. Aldaya and A.Y. Hoekstra – November 2009 40. The blue, green and grey water footprint of rice from both a production and consumption perspective A.K. Chapagain and A.Y. Hoekstra – March 2010 41. Water footprint of cotton, wheat and rice production in Central Asia M.M. Aldaya, G. Muñoz and A.Y. Hoekstra – March 2010 42. A global and high-resolution assessment of the green, blue and grey water footprint of wheat M.M. Mekonnen and A.Y. Hoekstra – April 2010 43. Biofuel scenarios in a water perspective: The global blue and green water footprint of road transport in 2030 A.R. van Lienden, P.W. Gerbens-Leenes, A.Y. Hoekstra and Th.H. van der Meer – April 2010 44. Burning water: The water footprint of biofuel-based transport P.W. Gerbens-Leenes and A.Y. Hoekstra – June 2010 45. Mitigating the water footprint of export cut flowers from the Lake Naivasha Basin, Kenya M.M. Mekonnen and A.Y. Hoekstra – June 2010 46. The green and blue water footprint of paper products: methodological considerations and quantification P.R. van Oel and A.Y. Hoekstra – July 2010 47. The green, blue and grey water footprint of crops and derived crop products M.M. Mekonnen and A.Y. Hoekstra – December 2010 48. The green, blue and grey water footprint of animals and derived animal products M.M. Mekonnen and A.Y. Hoekstra – December 2010 49. The water footprint of soy milk and soy burger and equivalent animal products A.E. Ercin, M.M. Aldaya and A.Y. Hoekstra – February 2011 50. National water footprint accounts: The green, blue and grey water footprint of production and consumption M.M. Mekonnen and A.Y. Hoekstra – May 2011 51. The water footprint of electricity from hydropower M.M. Mekonnen and A.Y. Hoekstra – June 2011 Reports can be downloaded from: www.waterfootprint.org www.unesco-ihe.org/value-of-water-research-report-series


UNESCO-IHEP.O. Box 30152601 DA DelftThe Netherlands
Website www.unesco-ihe.orgPhone +31 15 2151715
University of Twente
Delft University of Technology