Value Flow ScoreCards - British Computer Society · Value Flow ScoreCards ... • Goldratt’s...
24
1 © 18 Sep 2008 Neil Thompson & Mike Smith BCS SIGiST Value Flow ScoreCards for better strategies, coverage and processes British Computer Society Specialist Interest Group in Software Testing 18 Sep 2008 “Testers of Tomorrow” v1.3 23 Oast House Crescent Farnham, Surrey England, UK GU9 0NP www.TiSCL.com St Mary’s Court 20 St Mary at Hill London England, UK EC3R 8EE www.testing-solutions.com Neil Thompson Thompson information Systems Consulting Ltd & Mike Smith Testing Solutions Group Ltd 2 © 18 Sep 2008 Neil Thompson & Mike Smith BCS SIGiST What is a Value Flow ScoreCard? Objectives Measures Targets Initiatives Financial Supplier Customer Improvement & Infrastructure Process Product WHY we do things WHAT (will constitute success) HOW to do things well SIX VIEWPOINTS of what stakeholders want It’s a simple table which we can use to help control our work: • do things “well enough” for an appropriate balance of stakeholders • in this presentation, test strategy, test coverage, process improvement and process definition • (but arguably can apply it to anything!)
Transcript of Value Flow ScoreCards - British Computer Society · Value Flow ScoreCards ... • Goldratt’s...

1
©
18 Sep 2008 Neil Thompson
& Mike Smith
BCS SIGiST
Value Flow ScoreCardsfor better strategies, coverage and processes
British Computer SocietySpecialist Interest Group in Software Testing18 Sep 2008 “Testers of Tomorrow” v1.3
23 Oast House CrescentFarnham, SurreyEngland, UKGU9 0NPwww.TiSCL.com
St Mary’s Court20 St Mary at HillLondonEngland, UKEC3R 8EEwww.testing-solutions.com
Neil Thompson Thompson information Systems Consulting Ltd
& Mike Smith Testing Solutions Group Ltd
2©
18 Sep 2008 Neil Thompson
& Mike Smith
BCS SIGiST
What is a Value Flow ScoreCard?
Objectives
Measures
Targets
Initiatives
FinancialSupplier Customer Improvement &Infrastructure
Process Product
WHY wedo things
WHAT(will constitute success)
HOW todo thingswell
SIX VIEWPOINTS of what stakeholders want
It’s a simple table which we can use to help control our work:• do things “well enough” for an appropriate balance of stakeholders• in this presentation, test strategy, test coverage,
process improvement and process definition• (but arguably can apply it to anything!)
2
3©
18 Sep 2008 Neil Thompson
& Mike Smith
BCS SIGiST
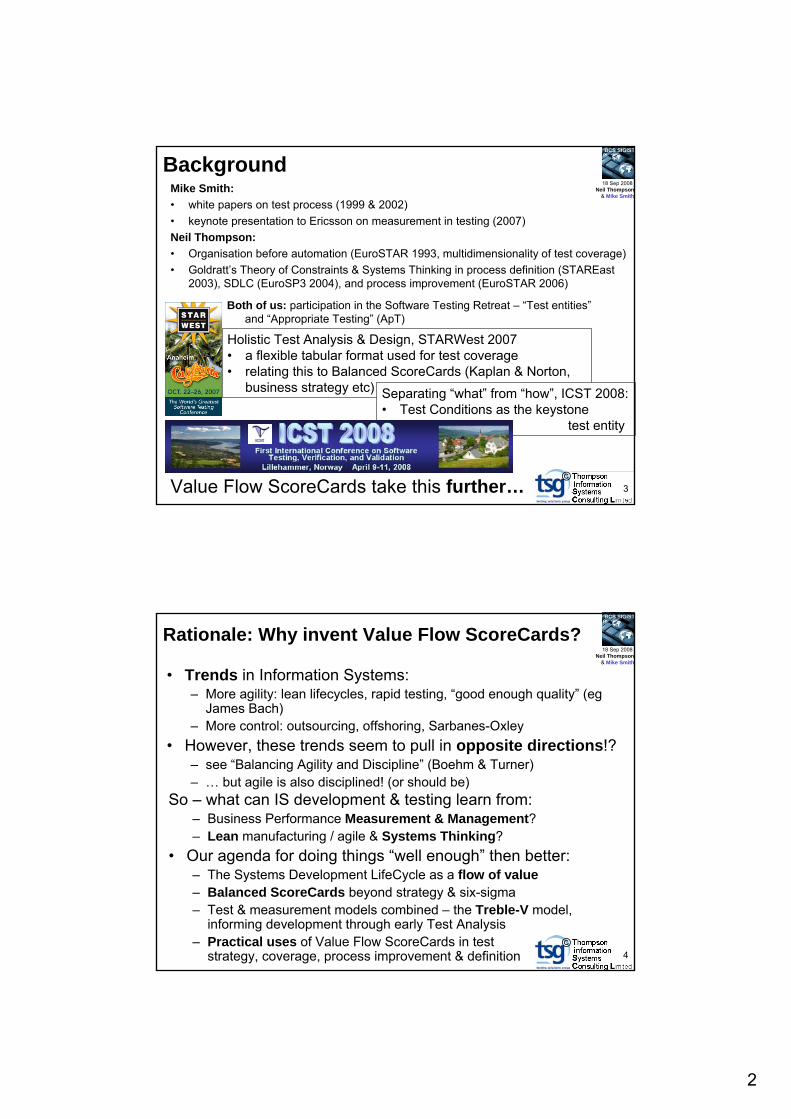
BackgroundMike Smith:• white papers on test process (1999 & 2002)• keynote presentation to Ericsson on measurement in testing (2007)Neil Thompson:• Organisation before automation (EuroSTAR 1993, multidimensionality of test coverage)• Goldratt’s Theory of Constraints & Systems Thinking in process definition (STAREast
2003), SDLC (EuroSP3 2004), and process improvement (EuroSTAR 2006)
Value Flow ScoreCards take this further…
Holistic Test Analysis & Design, STARWest 2007• a flexible tabular format used for test coverage• relating this to Balanced ScoreCards (Kaplan & Norton,
business strategy etc) Separating “what” from “how”, ICST 2008:• Test Conditions as the keystone
test entity
Both of us: participation in the Software Testing Retreat – “Test entities” and “Appropriate Testing” (ApT)
4©
18 Sep 2008 Neil Thompson
& Mike Smith
BCS SIGiST
Rationale: Why invent Value Flow ScoreCards?
• Trends in Information Systems:– More agility: lean lifecycles, rapid testing, “good enough quality” (eg
James Bach)– More control: outsourcing, offshoring, Sarbanes-Oxley
• However, these trends seem to pull in opposite directions!?– see “Balancing Agility and Discipline” (Boehm & Turner)– … but agile is also disciplined! (or should be)
So – what can IS development & testing learn from:– Business Performance Measurement & Management?– Lean manufacturing / agile & Systems Thinking?
• Our agenda for doing things “well enough” then better:– The Systems Development LifeCycle as a flow of value– Balanced ScoreCards beyond strategy & six-sigma– Test & measurement models combined – the Treble-V model,
informing development through early Test Analysis– Practical uses of Value Flow ScoreCards in test
strategy, coverage, process improvement & definition

3
5©
18 Sep 2008 Neil Thompson
& Mike Smith
BCS SIGiST
The SDLC as a flow of value
• Working systems have value; documents in themselves do not; so this is thequickestroute!
Programming
a b c Demonstrations &acceptance tests
Statedrequirements
RAW MATERIALS FINISHEDPRODUCT
• SDLCs are necessary, but introduce impediments to value flow: misunderstandings, disagreements…documents are like inventory/stock, or “waste”
Programming
a ab b’c d
Documentedrequirements
Implicitrequirements
Meeting / escalation to agree
I I Acceptance tests
?
?
Intermediate documentation!
6©
18 Sep 2008 Neil Thompson
& Mike Smith
BCS SIGiST
Lean manufacturing, Goldratt’s Theory of Constraints… agile IS methods…customers should pull “good enough” value
LEVELS OF DOCUMENTATION,pushed by specifiers
WORKINGSOFTWARE
Accepted
System-tested
Integrated
Unit / Component-tested
FLOW OF FULLY-WORKING SOFTWARE, pulled by
customer demand
Requirements
+ FuncSpec
+ TechnicalDesign
+ Unit / Componentspecifications
+ Test Specifications
4
7©
18 Sep 2008 Neil Thompson
& Mike Smith
BCS SIGiST
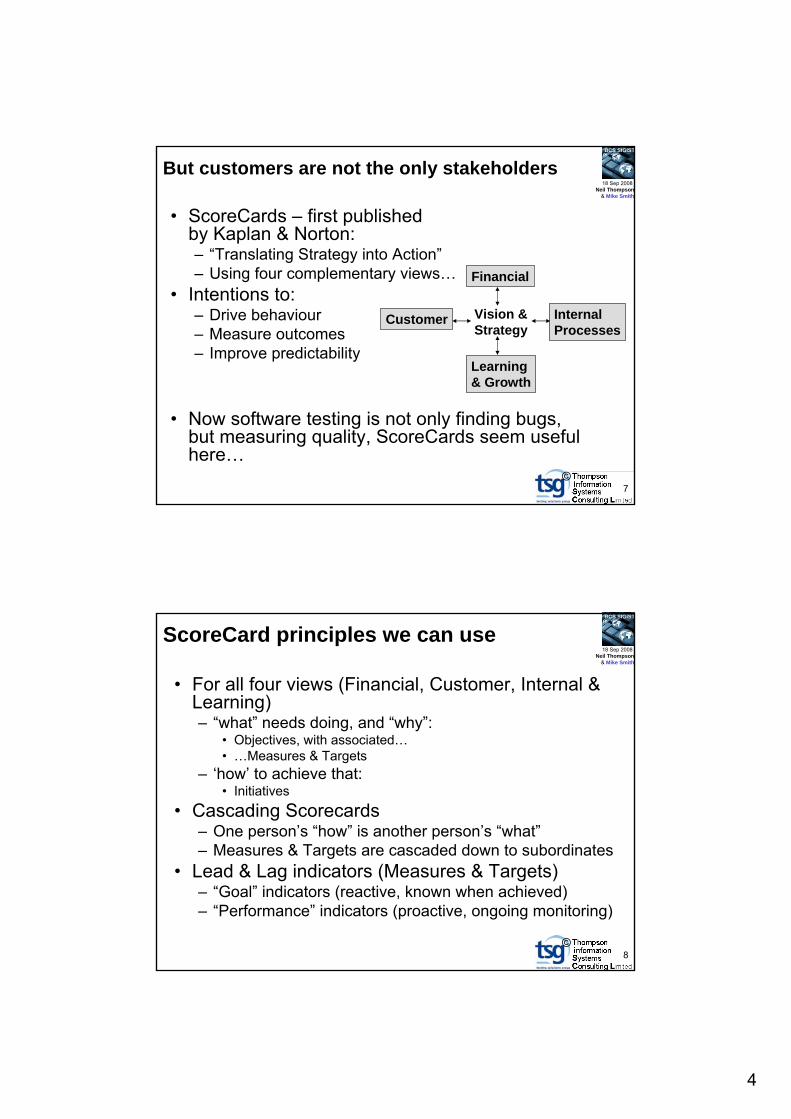
But customers are not the only stakeholders
• ScoreCards – first publishedby Kaplan & Norton:– “Translating Strategy into Action”– Using four complementary views…
• Intentions to:– Drive behaviour– Measure outcomes– Improve predictability
• Now software testing is not only finding bugs, but measuring quality, ScoreCards seem useful here…
Financial
Customer Vision &Strategy
InternalProcesses
Learning& Growth
8©
18 Sep 2008 Neil Thompson
& Mike Smith
BCS SIGiST
ScoreCard principles we can use
• For all four views (Financial, Customer, Internal & Learning)– “what” needs doing, and “why”:
• Objectives, with associated… • …Measures & Targets
– ‘how’ to achieve that:• Initiatives
• Cascading Scorecards– One person’s “how” is another person’s “what”– Measures & Targets are cascaded down to subordinates
• Lead & Lag indicators (Measures & Targets)– “Goal” indicators (reactive, known when achieved)– “Performance” indicators (proactive, ongoing monitoring)
5
9©
18 Sep 2008 Neil Thompson
& Mike Smith
BCS SIGiST
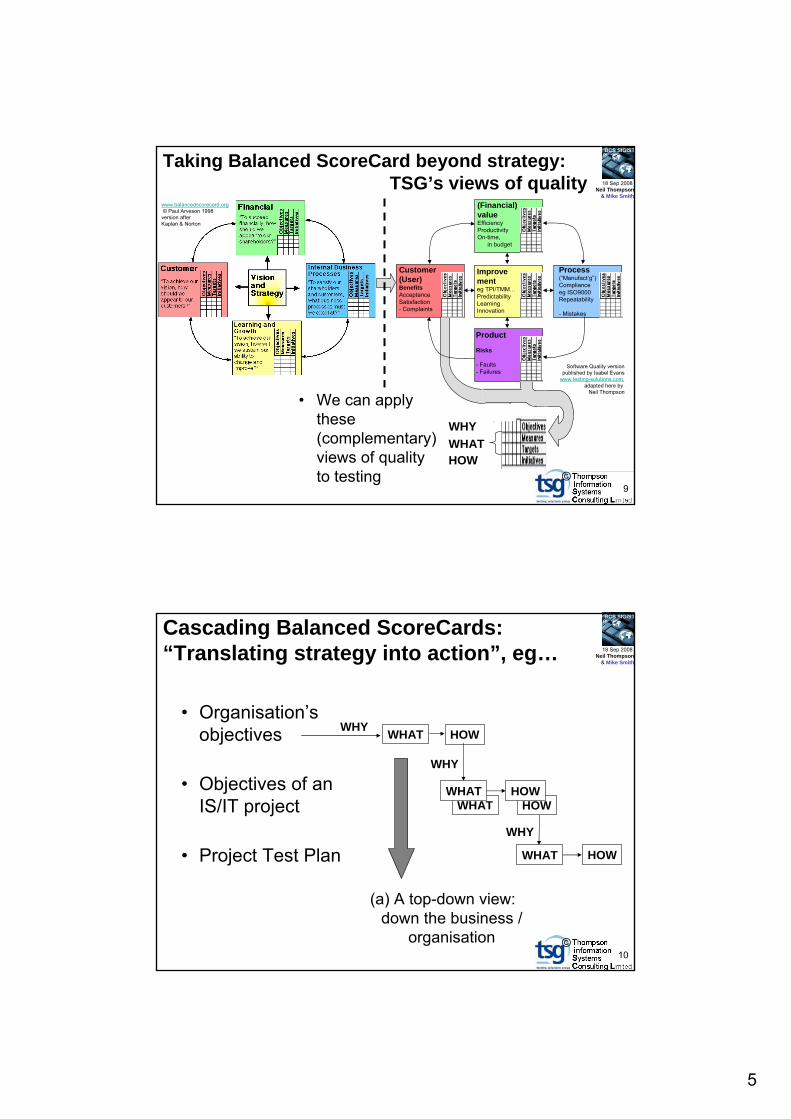
Taking Balanced ScoreCard beyond strategy:TSG’s views of quality
www.balancedscorecard.org© Paul Arveson 1998
version afterKaplan & Norton
Product
Risks
- Faults- Failures
(Financial)valueEfficiencyProductivityOn-time,
in budget
Customer(User)BenefitsAcceptanceSatisfaction- Complaints
Improvementeg TPI/TMM…PredictabilityLearningInnovation
Process(“Manufact’g”)Complianceeg ISO9000Repeatability
- Mistakes
Software Quality versionpublished by Isabel Evans
www.testing-solutions.com,adapted here by
Neil Thompson
WHYWHATHOW
• We can apply these(complementary)views of qualityto testing
10©
18 Sep 2008 Neil Thompson
& Mike Smith
BCS SIGiST
Cascading Balanced ScoreCards:“Translating strategy into action”, eg…
• Organisation’s objectives
• Objectives of anIS/IT project
• Project Test Plan HOW
HOWWHAT
HOWWHAT
HOWWHAT
WHAT
(a) A top-down view:down the business /
organisation
WHY
WHY
WHY

6
11©
18 Sep 2008 Neil Thompson
& Mike Smith
BCS SIGiST
But then also: the test process as a scorecard
(b) This is a left-to-right view (complementary to the top-down view which isaligned with the project and business / organisation’s, objectives)
WHY HOWWHAT
HOWWHAT
TEST BASIS (EGSYSTEM SPEC)
TESTDESIGN
TESTEXECUTION
TESTANALYSIS
WHY
System development starts withthe logical (“what”) before specifyingthe physical (“how”), solet’s do this for testing also!
12©
18 Sep 2008 Neil Thompson
& Mike Smith
BCS SIGiSTAnd then: if we add distinct Test Analysis to the W-model… the Treble-V model!
PROJECTREQ’TS SPEC
LOGICALDESIGN
PHYSICALDESIGN
COMPONENTDESIGN
BUILD
STATICTESTING
DYNAMIC TESTDESIGN
DYNAMIC TESTEXECUTION
DYNAMIC TESTANALYSIS
STATICTESTING
STATICTESTING
STATICTESTING
DYNAMIC TESTANALYSIS
DYNAMIC TESTANALYSIS
DYNAMIC TESTANALYSIS
DYNAMIC TESTDESIGN
DYNAMIC TESTDESIGN
DYNAMIC TESTDESIGN
DYNAMIC TESTEXECUTION
DYNAMIC TESTEXECUTION
DYNAMIC TESTEXECUTION
(c) This is a third “cascade” view – down then up, through:• Layers of stakeholders• Levels of integration
(It’s not only for waterfall SDLCs, eg iterative… )
7
13©
18 Sep 2008 Neil Thompson
& Mike Smith
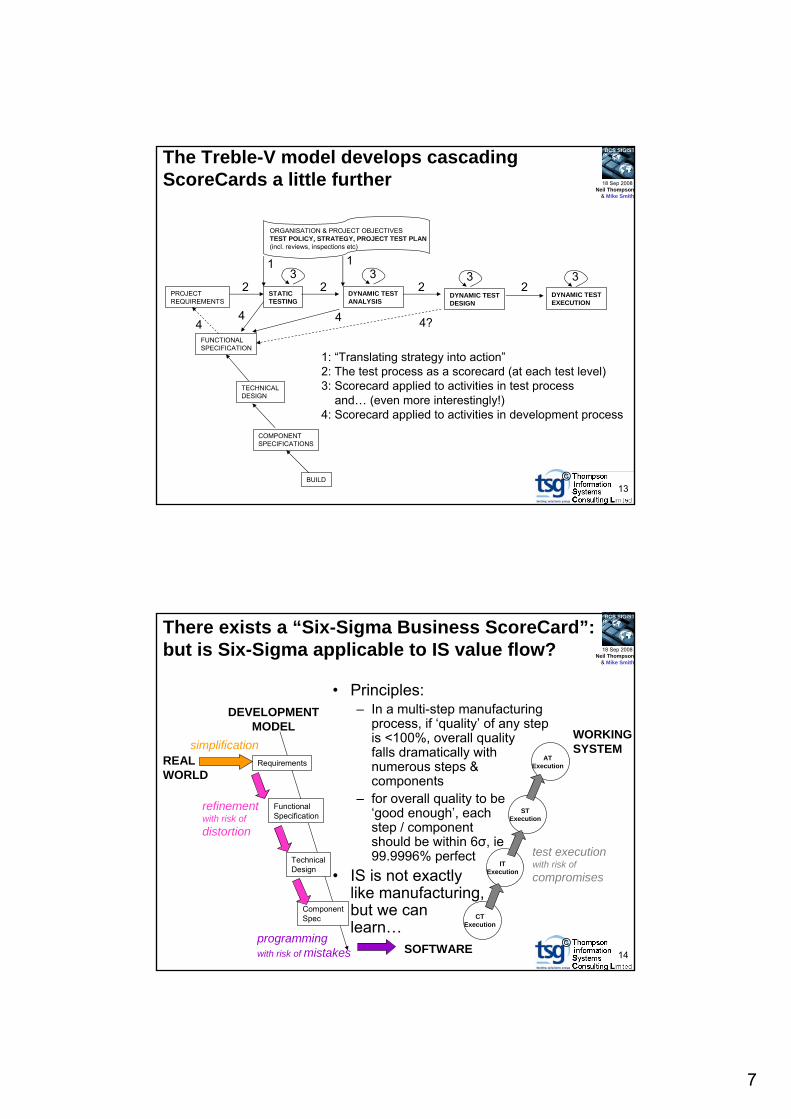
BCS SIGiSTThe Treble-V model develops cascading ScoreCards a little further
PROJECTREQUIREMENTS
FUNCTIONALSPECIFICATION
TECHNICALDESIGN
COMPONENTSPECIFICATIONS
BUILD
STATICTESTING
DYNAMIC TESTDESIGN
DYNAMIC TESTEXECUTION
DYNAMIC TESTANALYSIS
1
44 4?
3 3 3 3
1: “Translating strategy into action”2: The test process as a scorecard (at each test level)3: Scorecard applied to activities in test process
and… (even more interestingly!)4: Scorecard applied to activities in development process
ORGANISATION & PROJECT OBJECTIVESTEST POLICY, STRATEGY, PROJECT TEST PLAN(incl. reviews, inspections etc)
2
1
2 2 2
4
14©
18 Sep 2008 Neil Thompson
& Mike Smith
BCS SIGiST
There exists a “Six-Sigma Business ScoreCard”: but is Six-Sigma applicable to IS value flow?
• Principles:– In a multi-step manufacturing
process, if ‘quality’ of any step is <100%, overall quality falls dramatically with numerous steps & components
– for overall quality to be ‘good enough’, each step / component should be within 6σ, ie99.9996% perfect
• IS is not exactlylike manufacturing,but we canlearn…
programmingwith risk of mistakes
Requirements
FunctionalSpecification
TechnicalDesign
ComponentSpec
DEVELOPMENTMODEL
REALWORLD
simplification
refinementwith risk ofdistortion
ATExecution
STExecution
ITExecution
CTExecution
SOFTWARE
test executionwith risk of compromises
WORKINGSYSTEM

8
15©
18 Sep 2008 Neil Thompson
& Mike Smith
BCS SIGiST
We learn two things from Six-Sigma: (i) confirms we need Validation in addition to Verification
programmingwith risk of mistakes
Requirements
FunctionalSpecification
TechnicalDesign
ComponentSpec
Acceptance TestAnalysis & Design
System TestAnalysis & Design
Integration TestAnalysis & Design
Component TestAnalysis & Design
TESTMODEL
DEVELOPMENTMODEL
REALWORLD
simplification
refinementwith risk ofdistortion
ATExecution
STExecution
ITExecution
validation testing
verification testing
CTExecution
SOFTWARE
Based on flipchart drawn byNeil Thompson,Software Testing Retreat ,Llangadog, Wales
test executionwith risk of compromises
WORKINGSYSTEM
Customer
Product
16©
18 Sep 2008 Neil Thompson
& Mike Smith
BCS SIGiST
(ii) the Six-Sigma ScoreCard includes Suppliers
FinancialEfficiencyProductivityOn-time,
in budget
- Cost of qualitySupplierUpwardmanagement
Informationgathering
• Value chain ≈ Supply chain!– in the IS SDLC, each
participant should try to ‘manage their supplier’
– this is an instance of (test) scorecard applied to activities in development process
– we add this to the other 5, giving a 6th view of quality
• Now each step in the value chain can manage its inputs, outputs and other stakeholders
CustomerVALIDATIONRisksBenefitsAcceptanceSatisfaction- Complaints
Improvementeg TPI/TMM…PredictabilityLearningInnovation
ProcessComplianceeg ISO9000Repeatability
- Mistakes
ProductVERIFICATIONRisksTest coverage
- Faults- Failures
Six-Sigma Business ScoreCard published by Praveen Gupta (2nd ed. McGraw Hill 2007), butthis slide shows Neil Thompson’s version

9
17©
18 Sep 2008 Neil Thompson
& Mike Smith
BCS SIGiSTThe Treble-V model is a cascade of Value Flow ScoreCards
Financial
CustomerSupplier Improv’t
Process Product
STATICTESTING
12
Organisation & Project Objectivesfrom TEST POLICY, STRATEGY, PROJECT TEST PLAN
Coverage Objectivesfrom REQUIREMENTS,FUNCTIONAL SPEC, TECHNICAL DESIGN,MODULE SPECS
3Static Testers’own Objectives
4Feedback objectivesfor Business Analysts,Architects & Developers
Financial
CustomerSupplier Improv’t
Process Product
DYNAMICTESTANALYSIS
3Test Analysts’own Objectives
Initiativesfor nextstage oftest process
Initiativesfor nextlevel down theTreble-V model
(etc)
(etc)
18©
18 Sep 2008 Neil Thompson
& Mike Smith
BCS SIGiST
Potential number of ScoreCards depends on how your SDLC is handled by different roles
Pieces of a jig-saw!
This example is a “full-ish” set:• higher-level tests are
scripted – other staffmay then execute
Business Analysts Requirements Reviewers
Architects
Acceptance Test Analysts
Func Spec Reviewers
Designers
Acceptance Testers
Sys TestersSys Test Analysts
Tech Design Reviewers
Developers
Int Test Analysts
via pair programming?
Component Test Analysts, Designers & Executers?
AT Designers & Scripters
ST Designers & Scripters
IT Designers, Scripters & Executers

10
19©
18 Sep 2008 Neil Thompson
& Mike Smith
BCS SIGiST
The Value Flow ScoreCard in action
Financial
CustomerSupplier Improv’t
Process Product
FinancialCustomerSupplier Improv’tProcess Product
• Yes – it’s just a table! …Into which we can put
useful things…• We start with repositionable
paper notes, then canput in spreadsheet(s)
20©
18 Sep 2008 Neil Thompson
& Mike Smith
BCS SIGiST
Value Flow ScoreCard contents
Objectives
Measures
Targets
Initiatives
FinancialEfficiencyProductivityOn-time,
in budget
- Cost of quality
SupplierUpwardmanagement
Info from other levels of Treble-V model
CustomerVALIDATIONRisksBenefitsAcceptanceSatisfaction- Complaints
Improvement &Infrastructureeg TPI/TMM…PredictabilityLearningInnovation
ProcessComplianceeg ISO9000Repeatability
- Mistakes
ProductVERIFICATIONRisksTest coverage
- Faults- Failures
WHY
WHAT(“Indicators”)
HOW
• Give input to upstreamreviews
• Staff-days invested
• 1 Staff-day per Test Policy
• Send Denis every time
• What kind of useful things?• Here’s a simple example
11
21©
18 Sep 2008 Neil Thompson
& Mike Smith
BCS SIGiST
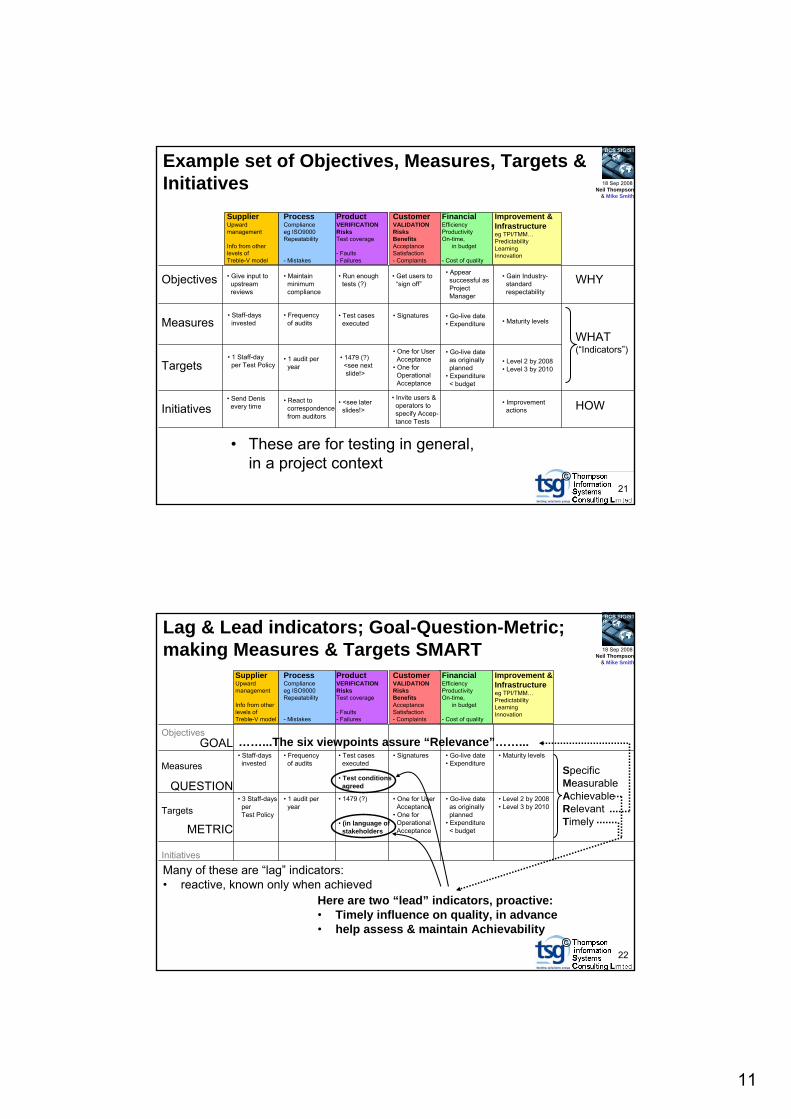
Example set of Objectives, Measures, Targets & Initiatives
Objectives
Measures
Targets
Initiatives
FinancialEfficiencyProductivityOn-time,
in budget
- Cost of quality
SupplierUpwardmanagement
Info from other levels of Treble-V model
CustomerVALIDATIONRisksBenefitsAcceptanceSatisfaction- Complaints
Improvement &Infrastructureeg TPI/TMM…PredictabilityLearningInnovation
ProcessComplianceeg ISO9000Repeatability
- Mistakes
ProductVERIFICATIONRisksTest coverage
- Faults- Failures
WHY
WHAT(“Indicators”)
HOW
• Gain Industry-standardrespectability
• Maturity levels
• Level 2 by 2008• Level 3 by 2010
• Improvementactions
• Test casesexecuted
• 1479 (?)<see nextslide!>
• Give input to upstreamreviews
• Staff-days invested
• These are for testing in general, in a project context
• 1 Staff-day per Test Policy
• Send Denis every time
• Maintain minimumcompliance
• Frequency of audits
• 1 audit per year
• React to correspondencefrom auditors
• Run enoughtests (?)
• <see laterslides!>
• Get users to“sign off”
• Signatures
• One for UserAcceptance
• One for OperationalAcceptance
• Invite users &operators tospecify Accep-tance Tests
• Appearsuccessful asProjectManager
• Go-live date• Expenditure
• Go-live dateas originallyplanned
• Expenditure< budget
22©
18 Sep 2008 Neil Thompson
& Mike Smith
BCS SIGiST
Lag & Lead indicators; Goal-Question-Metric;making Measures & Targets SMART
Objectives
Measures
Targets
Initiatives
FinancialEfficiencyProductivityOn-time,
in budget
- Cost of quality
SupplierUpwardmanagement
Info from otherlevels ofTreble-V model
CustomerVALIDATIONRisksBenefitsAcceptanceSatisfaction- Complaints
Improvement &Infrastructureeg TPI/TMM…PredictabilityLearningInnovation
ProcessComplianceeg ISO9000Repeatability
- Mistakes
ProductVERIFICATIONRisksTest coverage
- Faults- Failures
• Maturity levels
• Level 2 by 2008• Level 3 by 2010
• Test casesexecuted
• 1479 (?)
• Staff-days invested
Many of these are “lag” indicators:• reactive, known only when achieved
• 3 Staff-days per Test Policy
• Frequency of audits
• 1 audit per year
• Signatures
• One for UserAcceptance
• One for OperationalAcceptance
• Go-live date• Expenditure
• Go-live dateas originallyplanned
• Expenditure< budget
SpecificMeasurableAchievableRelevantTimely
GOAL
QUESTION
METRIC
• Test conditionsagreed
• (in language ofstakeholders
Here are two “lead” indicators, proactive:• Timely influence on quality, in advance• help assess & maintain Achievability
……...The six viewpoints assure “Relevance”……...

12
23©
18 Sep 2008 Neil Thompson
& Mike Smith
BCS SIGiST
Four practical uses of Value Flow ScoreCardsA. Test coverage
– extend control to stakeholders– transcend the small ‘textbook’ repertoire of techniques– holistic Test Analysis & Design: integrates and clarifies test
items, features, bases and product risks– better information traceability
B. Test Policy, Strategy & Planning– ensure alignment with organisational objectives– help completeness, no subjects forgotten– Goal–Question–Metric traceability
C. Process Improvement– not just test, but whole lifecycle– prioritised treatment of symptoms– transcend limitations of TMMTM or TPI®
D. Process definition– “Appropriate Testing” (ApT) in
different project/product circumstances
24©
18 Sep 2008 Neil Thompson
& Mike Smith
BCS SIGiST
A. Test coverage: Do you control your testing, or does your testing control you?
• Test Cases thought of• Scripts / Procedures written• Expectation that “those are the tests”
THE REMAINDER OF YOUR LIFE(ON THAT PROJECT)
FLEXIBLE, RISK-MANAGED
TEST EXECUTION
• What you really want to cover• Governance / management needs• Product risksor…
(IMAGE OF TAIL WAGGING DOG) (IMAGE OF DOG WAGGING TAIL
– AS IS MORE NORMAL)

13
25©
18 Sep 2008 Neil Thompson
& Mike Smith
BCS SIGiST
Test coverage: other common problems
• Have you seen any of these?– important tests omitted– large numbers of low-value tests– higher levels of testing merely repeating
Component Testing– insufficient attention to non-functional tests– unstructured piles of detailed scripts– difficult-to-maintain testware…
26©
18 Sep 2008 Neil Thompson
& Mike Smith
BCS SIGiST
Numerous test cases & scripts are almost meaningless to stakeholders, without a “map”
Now, let’sstart with a
classificationtree
1479 test cases, so
it must be good,right?
Testspecificationprocess
Documentationto agreecoverage
(IMAGESREMOVED)
(IMAGESREMOVED)

14
27©
18 Sep 2008 Neil Thompson
& Mike Smith
BCS SIGiST
Testware: not a rigid hierarchyWHY WHAT HOW
Does this work?
No, because of these hierarchies
Test Conditions
System’s specifications
Test Cases
Test Scripts / Procedures
Test Execution Schedule
Test Conditions
System’sspecifications
Test Cases
Test Scripts / Procedures
So, we need many-to-manyentity relationships
Test Execution Schedule
28©
18 Sep 2008 Neil Thompson
& Mike Smith
BCS SIGiST
An easy way for many-to-many relationships: a flexible table
Test Conditions
System’sspecifications
Test Cases
Test Scripts / Procedures
Test Execution Schedule
““ “
““
• But merely decomposing the system’s specification is not a recipe for very good tests
• We want a Validation (customer) view of quality in addition tothe traditional Verification (product) view…
What about:TEST ITEMS?
FEATURES TO BE TESTED?
PRODUCT RISKS?
“
““

15
29©
18 Sep 2008 Neil Thompson
& Mike Smith
BCS SIGiST
So – Value Flow ScoreCards can measure test coverage: for Test Analysts…
Test Items(level ofintegration)
Features to betested
Test BasisReferences
ProductRisks
Test Conditions (wecould cover)
Objectives
Measures
Targets
Initiatives
FinancialEfficiencyProductivityOn-time,
in budget
- Cost of quality
SupplierUpwardmanagementInfo from otherlevels of Treble-V model
CustomerVALIDATIONRisksBenefitsAcceptanceSatisfaction- Complaints
Improvement &Infrastructureeg TPI/TMM…PredictabilityLearningInnovation
ProcessComplianceeg ISO9000Repeatability
- Mistakes
ProductVERIFICATIONRisksTest coverage
- Faults- Failures
(from LEVEL TEST PLAN
andTEST BASES)
(to test design & execution)
Test Conditionswe intend to cover
Productbenefits
Features to betested
ProductRisks
Constraints
ProductRisks
ProductRisks
ProductRisks
Objectives forTest Cases
NB this is the “manual” Holistic Test Analysis & Design xls perspective. Formal relational database implementations, eg T-Plan,may require a more rigorous treatment.
30©
18 Sep 2008 Neil Thompson
& Mike Smith
BCS SIGiST
… then for Test Designers, (+Scripters if used),and Executers
Objectives
Measures
Targets
Initiatives
FinancialEfficiencyProductivityOn-time,
in budget
- Cost of quality
SupplierUpwardmanagement
Info from otherlevels of Treble-V model
CustomerVALIDATIONRisksBenefitsAcceptanceSatisfaction- Complaints
Improvement &Infrastructureeg TPI/TMM…PredictabilityLearningInnovation
ProcessComplianceeg ISO9000Repeatability
- Mistakes
ProductVERIFICATIONRisksTest coverage
- Faults- Failures
(to next level of Treble-V model)
S-curves projectedto target dates
Objectives forTest Cases
(fromTestAnalysis)
S-curves of:• Test Cases executed,passed, failed
• Incidents fixed,retested, closed
Objectives forTestExecutionSchedule
Objectives forincident-fixers
(to Developers)
Coverage ofTest Conditionsexecuted
16
31©
18 Sep 2008 Neil Thompson
& Mike Smith
BCS SIGiST
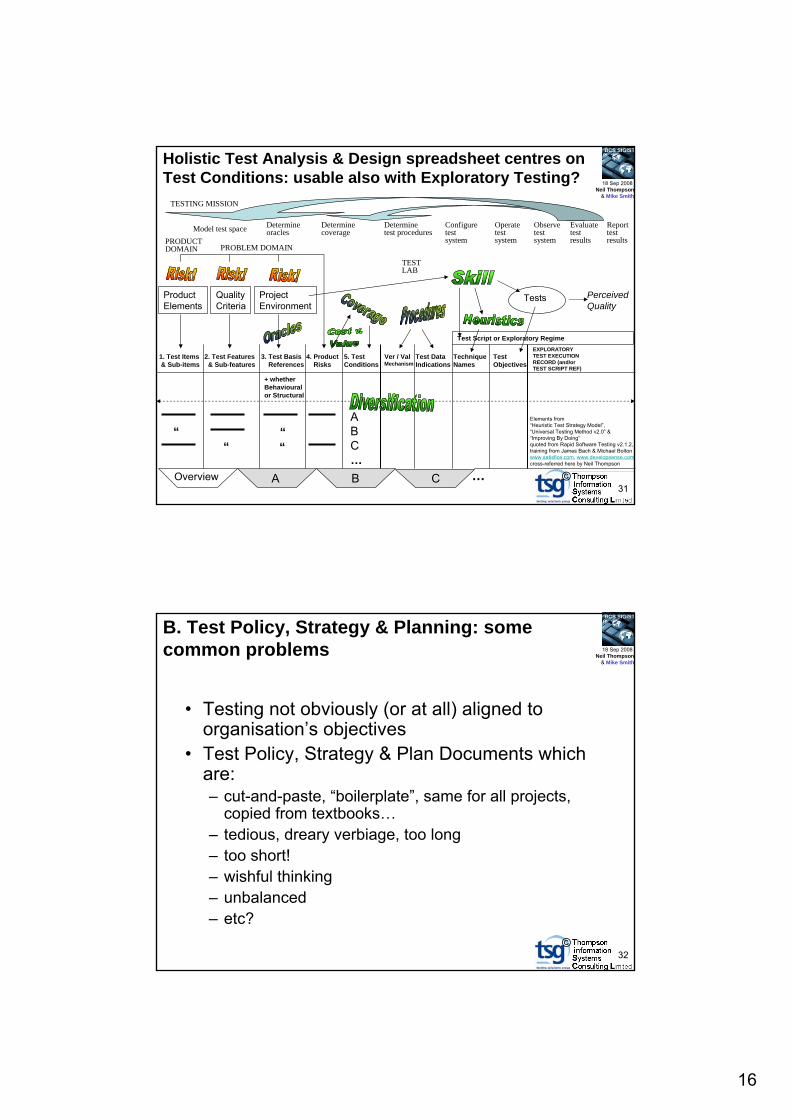
Holistic Test Analysis & Design spreadsheet centres on Test Conditions: usable also with Exploratory Testing?
1. Test Items& Sub-items
2. Test Features& Sub-features
EXPLORATORYTEST EXECUTIONRECORD (and/orTEST SCRIPT REF)
3. Test BasisReferences
4. ProductRisks
5. TestConditions
Ver / ValMechanism
Test DataIndications
TechniqueNames
TestObjectives
Overview A …
ABC…
““ “
“
+ whetherBehaviouralor Structural
B C
DeterminecoverageModel test space Determine
oraclesDeterminetest procedures
Configuretestsystem
Observetestsystem
Evaluatetestresults
Reporttestresults
Operatetestsystem
TESTING MISSION
ProjectEnvironment
QualityCriteria
ProductElements
Tests PerceivedQuality
Test Script or Exploratory Regime
Elements from“Heuristic Test Strategy Model”,“Universal Testing Method v2.0” &“Improving By Doing”quoted from Rapid Software Testing v2.1.2,training from James Bach & Michael Boltonwww.satisfice.com, www.developsense.comcross-referred here by Neil Thompson
TESTLAB
PRODUCTDOMAIN PROBLEM DOMAIN
32©
18 Sep 2008 Neil Thompson
& Mike Smith
BCS SIGiST
B. Test Policy, Strategy & Planning: some common problems
• Testing not obviously (or at all) aligned to organisation’s objectives
• Test Policy, Strategy & Plan Documents which are:– cut-and-paste, “boilerplate”, same for all projects,
copied from textbooks…– tedious, dreary verbiage, too long– too short!– wishful thinking– unbalanced– etc?
17
33©
18 Sep 2008 Neil Thompson
& Mike Smith
BCS SIGiST
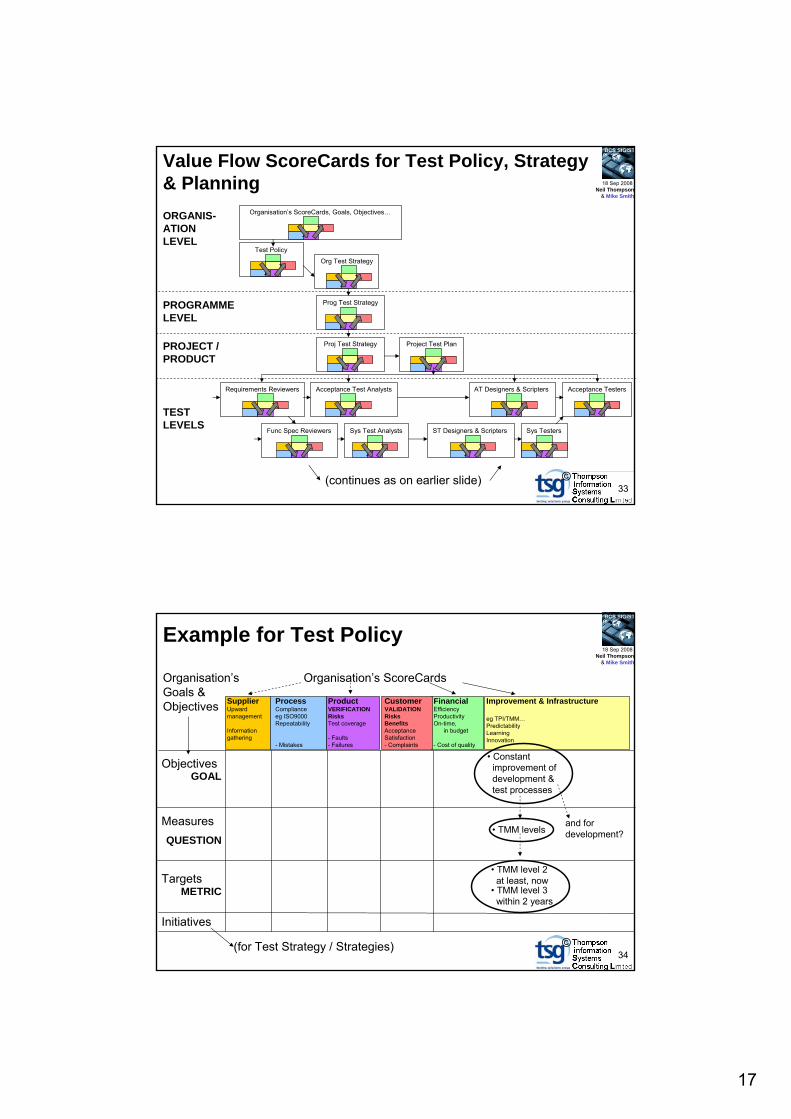
Value Flow ScoreCards for Test Policy, Strategy & Planning
Test Policy
Organisation’s ScoreCards, Goals, Objectives…ORGANIS-ATIONLEVEL
PROGRAMMELEVEL
PROJECT /PRODUCT
TESTLEVELS
Requirements Reviewers Acceptance Test Analysts AT Designers & Scripters Acceptance Testers
Sys Test AnalystsFunc Spec Reviewers ST Designers & Scripters Sys Testers
Project Test Plan
Org Test Strategy
Prog Test Strategy
(continues as on earlier slide)
Proj Test Strategy
34©
18 Sep 2008 Neil Thompson
& Mike Smith
BCS SIGiST
Example for Test Policy
FinancialEfficiencyProductivityOn-time,
in budget
- Cost of quality
SupplierUpwardmanagement
Informationgathering
CustomerVALIDATIONRisksBenefitsAcceptanceSatisfaction- Complaints
Improvement & Infrastructure
eg TPI/TMM…PredictabilityLearningInnovation
ProcessComplianceeg ISO9000Repeatability
- Mistakes
ProductVERIFICATIONRisksTest coverage
- Faults- Failures
Organisation’sGoals & Objectives
Objectives
Measures
Targets
Initiatives
Organisation’s ScoreCards
• TMM levels
• TMM level 2at least, now
• TMM level 3within 2 years
• Constantimprovement ofdevelopment & test processes
GOAL
QUESTION
METRIC
(for Test Strategy / Strategies)
and fordevelopment?
18
35©
18 Sep 2008 Neil Thompson
& Mike Smith
BCS SIGiST
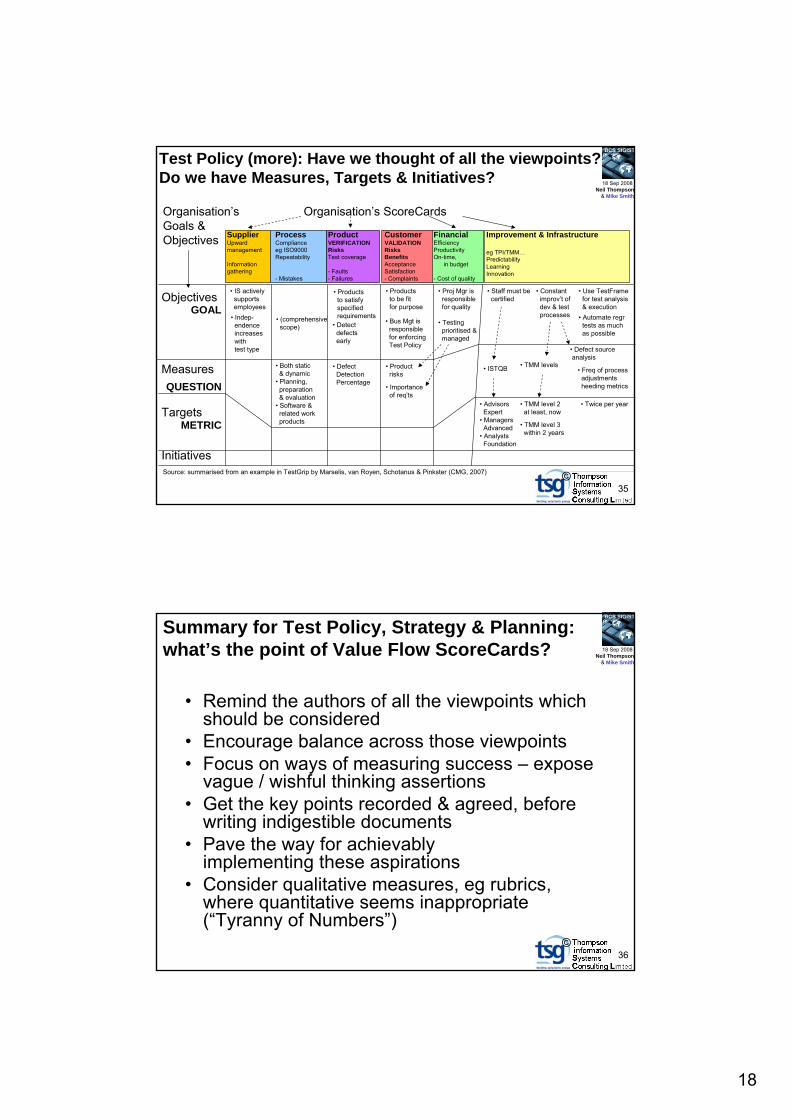
Test Policy (more): Have we thought of all the viewpoints? Do we have Measures, Targets & Initiatives?
FinancialEfficiencyProductivityOn-time,
in budget
- Cost of quality
SupplierUpwardmanagement
Informationgathering
CustomerVALIDATIONRisksBenefitsAcceptanceSatisfaction- Complaints
Improvement & Infrastructure
eg TPI/TMM…PredictabilityLearningInnovation
ProcessComplianceeg ISO9000Repeatability
- Mistakes
ProductVERIFICATIONRisksTest coverage
- Faults- Failures
Organisation’sGoals & Objectives
Objectives
Measures
Targets
Initiatives
Organisation’s ScoreCards
• IS actively supports employees
• TMM levels
• TMM level 2at least, now
• Both static& dynamic
• Planning,preparation& evaluation
• Software & related work products
• Products to satisfy specifiedrequirements
• Products to be fit for purpose
• Detect defects early
• Indep-endenceincreaseswith test type
• Testing prioritised &managed
• Product risks
• Importance of req’ts
• Automate regrtests as muchas possible
Source: summarised from an example in TestGrip by Marselis, van Royen, Schotanus & Pinkster (CMG, 2007)
• Use TestFramefor test analysis& execution
• DefectDetectionPercentage
• Freq of process adjustmentsheeding metrics
• Twice per year
• Proj Mgr isresponsiblefor quality
• Bus Mgt isresponsiblefor enforcing Test Policy
• TMM level 3within 2 years
• Staff must becertified
• Defect sourceanalysis
• (comprehensivescope)
• ISTQB
• AdvisorsExpert
• ManagersAdvanced
• AnalystsFoundation
• Constantimprov’t ofdev & testprocesses GOAL
QUESTION
METRIC
36©
18 Sep 2008 Neil Thompson
& Mike Smith
BCS SIGiST
Summary for Test Policy, Strategy & Planning: what’s the point of Value Flow ScoreCards?
• Remind the authors of all the viewpoints which should be considered
• Encourage balance across those viewpoints• Focus on ways of measuring success – expose
vague / wishful thinking assertions• Get the key points recorded & agreed, before
writing indigestible documents• Pave the way for achievably
implementing these aspirations• Consider qualitative measures, eg rubrics,
where quantitative seems inappropriate (“Tyranny of Numbers”)

19
37©
18 Sep 2008 Neil Thompson
& Mike Smith
BCS SIGiST
C. Process improvement
• In software testing, the popular process improvement methods have fixed subject areas(“Moment of involvement” etc)
• TMMTM and TPI® ascend through maturity levels– “these things are good for you, in this sequence”
• TOMTM is symptom-driven but still has a fixed structure, and suggested causes (a “built-in improvement model”)
• But some other fields (eg manufacturing, supply chains) use Goldratt-Dettmer (or Toyota-style equivalent) on symptoms, giving flexible focus
• Driving principle: the “constraint” is the weakest link, address that first before attacking everything
• Look for causes not just symptoms…
38©
18 Sep 2008 Neil Thompson
& Mike Smith
BCS SIGiSTProcess improvement with Goldratt-Dettmerthinking tools
CURRENTILLS
Symptom x
Symptom y
Symptom z
Intermediatecause n
Intermediatecause o
Root cause a
Root cause b
CONFLICTRESOLUTION
For use where:• Different stakeholders
want different things• Evidence seems
contradictory• Are rival theories for
for remedies
“It seems here that…”
Distilled“truth”
Revelation(s)
“On the otherhand…”
FUTUREREMEDIES
Alleviationof symptoms
Fix forroot cause a
(can’t fix root cause b)
Fix forintermediatecause n
Fix forintermediatecause o

20
39©
18 Sep 2008 Neil Thompson
& Mike Smith
BCS SIGiST
SDLC method does notencourage diagrams
An easy route into Goldratt-Dettmer: Strengths, Weaknesses, Opportunities & Threats
STRENGTHS
WEAKNESSES THREATS
OPPORTUNITIES
CURRENT ILLSFUTURE REMEDIES
PRE-REQUISITES
TRANS-ITION
Anticipating &overcomingobstacles
Action planning
CONFLICTRESOLUTION
System specs are heavy textdocuments
Culture of our testers is toprefer large text documentsto diagrams
Test specs are large & “texty”
Test coverage omissions & overlaps
Can still improve coverageat macro level with
informal techniques (80/20)
Too many failures in Live
Some managers are consideringagile methods
Business analysts may bemotivated by UML training
STRATEGIC: Improve SDLC method
TACTICAL: Address culture byworked examples of diagrams
TACTICAL: Include tables &diagrams in test specifications
(Use Threats to helpidentify obstacles)
(Use Strengths to helpamplify opportunities)
ONGOING: Techniques
training & coaching
(actually, as shown here Goldratt-Dettmer has five diagram sets in its full version, to cater for “making change stick”)
Testers not trainedin techniques
40©
18 Sep 2008 Neil Thompson
& Mike Smith
BCS SIGiST
Value Chain ScoreCards allow us to “swimlane” symptoms & causes (and proposed remedies)
Note: this is similar to Kaplan & Norton’s “Strategy Maps” (Harvard Business School Press 2004)
FinancialEfficiencyProductivityOn-time,
in budget
- Cost of quality
SupplierUpwardmanagement
Informationgethring
CustomerVALIDATIONRisksBenefitsAcceptanceSatisfaction- Complaints
Improvement &Infrastructureeg TPI/TMM…PredictabilityLearningInnovation
ProcessComplianceeg ISO9000Repeatability
- Mistakes
ProductVERIFICATIONRisksTest coverage
- Faults- Failures
Objectives
Measures
Targets
Initiatives
LIFECYCLE…………………………………………ORGANISATION …...………………………………….INFRASTRUCTURE
TECHNIQUES………… & TOOLS
(TMap/TPIapproximation)
PRE-REQUISITES
TRANSITION
CONFLICTRESOLUTION
CURRENT ILLS
FUTURE REMEDIES

21
41©
18 Sep 2008 Neil Thompson
& Mike Smith
BCS SIGiST
Systems Thinking: some cause-effect trees “re-root” to form vicious / virtuous feedback loops
CURRENTILLS
Symptom x
Symptom y
Symptom z
Intermediatecause n
Intermediatecause o
Root cause a
Root cause b
Example (vicious)
SDLC method does notencouragediagrams
System specs are heavy textdocuments
Culture of our testersis to prefer large text documentsto diagrams
Test specs are large & “texty”
Test coverage overlaps
Too many failures in Live
Testers not trainedin techniques
Regression testsnot automated
Redundant regression teststake too longto run
Test suites growever larger
Testers too busyto “weed” tests
omissions
More tests added
Systems Thinkingnotation
REINFORCINGLOOP
Impactof live
failures
Size oftest suites
A loop is balancing if it contains an odd number of opposing links ;else it is reinforcing
Ignoranceof test
coverage
Each author seems to vary; this is Neil Thompson’s,
incorporating elements ofJerry Weinberg’s &Dennis Sherwood’s
BALANCINGLOOP
Reluctance to remove tests
from suites
Timespent
“firefighting”
42©
18 Sep 2008 Neil Thompson
& Mike Smith
BCS SIGiST
Value Flow ScoreCards give two nested sets of feedback loops: do things well enough now, then improve
FinancialSupplier Customer Improvement & InfrastructureProcess Product
Role 1
Via cascade ofValue Flow
Role 2
Role n
Find vicious loops… Balance them, and/or… maybe evenreverse them
(“Tipping Point!) … but tailor quality tobalance of stakeholders.
TIME, COST
SCOPE……………………………………………………………………..RISK & QUALITY……………………………………………………
Then iterate process improvements, but focussed on “constraints” iewhere they will have most payback.
Can still use structure of TMMTM, TPI®, TOMTM… if desired,they may be mapped on to these value flow columns
It’s a Test Policy, Jim, but…
Is it a good Test Policy?

22
43©
18 Sep 2008 Neil Thompson
& Mike Smith
BCS SIGiST
D. Process definition: where we want to be in the range formal-informal for these circumstances, and how
Objectives
Measures
Targets
Initiatives
FinancialEfficiencyProductivityOn-time,
in budget
- Cost of quality
SupplierUpwardmanagement
Informationgathering
CustomerVALIDATIONRisksBenefitsAcceptanceSatisfaction- Complaints
Improvement &Infrastructureeg TPI/TMM…PredictabilityLearningInnovation
ProcessComplianceeg ISO9000Repeatability
- Mistakes
ProductVERIFICATIONRisksTest coverage
- Faults- Failures
Effectiveness
Efficiency
FromContext / Circumstances
Resources:• money ( skills, environments)• time
Application characteristics
Process constraints, eg:• quality mgmt• configuration mgmt
Technology
Technical risks
Business risks
Legal:• regulation• standards
• Methodologyunhappy with
• Unsure how best
to test
Insurance Assurance Efficiency
Note: comparable with Paul Gerrard’s “Axioms”,but in our version theseare the only two axioms
CURRENT SITUATION
Type of “V-model” Handover & acceptancecriteria
formal informal formal informal
Appropriate Testing in this context / circumstances
CONFLICTRESOLUTION
etc (about 30categories)
DESIRED SITUATION
Where in the range(specific aspects)
Where in the range(specific aspects)
Sector
Culture
Job type & size
Moral:• safety
44©
18 Sep 2008 Neil Thompson
& Mike Smith
BCS SIGiST
• ScoreCards:– Kaplan & Norton; Isabel Evans; Praveen Gupta
• Lean & agile:– Toyota; Poppendiecks; Alistair Cockburn;
David Anderson
• Goldratt: – Jens Pas; William Dettmer ; Greg Daich
• Systems Thinking: – Jerry Weinberg; Dennis Sherwood
• Appropriate Testing (ApT) & test entities:– the Software Testing Retreat
Colour-codedsources oftesting ideas:- Rob Sabourin
Good Enough Quality
(+BSC):- James Bach,
+ Kaner & Pettichord
References & acknowledgements

23
45©
18 Sep 2008 Neil Thompson
& Mike Smith
BCS SIGiST
References (additional details)
• Kaplan, RS & DP Norton: The Balanced Scorecard – Translating Strategy into Action (Harvard Business School Press 1996)
• Kaner, C, J Bach & B Pettichord: Lessons Learned in Software Testing – a Context-Driven Approach (Wiley 2002)
• Evans, I: Achieving Software Quality through Teamwork (ArtechHouse 2004)
• Gupta, P: Six Sigma Business Scorecard – Creating a Comprehensive Corporate Performance Measurement System (2nd
ed, McGraw Hill 2007)• Liker, JK: The Toyota Way – 14 Management Principles… from the
company that invented Lean Production (McGraw Hill 2004)• Poppendieck, M & T Poppendieck: Lean Software Development –
an Agile Toolkit (Addison Wesley 2003)• (also same authors, Implementing Lean Software Development –
from Concept to Cash (Addison Wesley 2007)• Cockburn, A: Agile Software Development (Addison Wesley 2002)• Anderson, DJ: Agile Management for Software Engineering –
Applying the Theory of Constraints for Business Results (Prentice Hall 2004)
44a
46©
18 Sep 2008 Neil Thompson
& Mike Smith
BCS SIGiST
References (additional details cont’d)
• Dettmer, HW: Goldratt’s Theory of Constraints – a Systems Approach to Continuous Improvement (ASQ 1997)
• Daich, G: Software Documentation Superstitions (STAREast 2002, http://www.stickyminds.com/s.asp?F=S5857_CP_2 )
• Weinberg, GM: Quality Software Management Vol 1 – Systems Thinking (Dorset House 1992)
• Sherwood, D: Seeing the Forest for the Trees – a Manager’s Guide to Applying Systems Thinking (Nicholas Brealey, 2002)
• Thompson, N & M Smith: Holistic Test Analysis and Design(STARWest 2007, http://www.stickyminds.com/s.asp?F=S13265_CP_2 )
• Smith, M & N Thompson: The Keystone to Support a Generic Test Process – Separating the “What” from the “How” (ICST 2008, http://www2.computer.org/portal/web/csdl/doi/10.1109/ICSTW.2008.46 )
• Sabourin, R: Just in Time Testing (course, eg via http://www.testing-solutions.com/library/downloads/e/Enabling%20Test%20Maximisation%20-%20Rob%20Sabourin.pdf )
44b

24
47©
18 Sep 2008 Neil Thompson
& Mike Smith
BCS SIGiST
Take-away messages
Financial
CustomerSupplier Improv’t
Process Product
FinancialCustomerSupplier Improv’tProcess Product
• Think of any SDLC as aflow of value, fromrequirements to workingand maintained software
• It should be a jig-saw ofcascading, value-addingpieces
• In the pieces in which you participate, consideryour inputs, outputs and other influences interms of different stakeholder views
• Balance those views for your situation• Look at your measures and targets for success
before deciding exactly how to do things• Write them in your Value Flow ScoreCard• Note: org / project does not necessarily
need a complete set; some selected ScoreCards are immediately useful! 45
©
18 Sep 2008 Neil Thompson
& Mike Smith
BCS SIGiST
Value Flow ScoreCardsThanks for listening!
For further information…
British Computer SocietySpecialist Interest Group in Software Testing18 Sep 2008 “Testers of Tomorrow”
23 Oast House CrescentFarnham, SurreyEngland, UKGU9 0NPwww.TiSCL.com
St Mary’s Court20 St Mary at HillLondonEngland, UKEC3R 8EEwww.testing-solutions.com
Neil Thompson Thompson information Systems Consulting Ltd
& Mike Smith Testing Solutions Group Ltd