Value Chain Improvement for Cocoa Industry in Indonesia … · global cocoa-chocolate value chain...
6
Abstract- Cocoa is one of the leading commodity in Indonesia. Indonesian cocoa industry is the third largest producer of cocoa beans in the world after Ivory Coast and Ghana. Nevertheless, the Indonesian cocoa industry has low competitiveness compared to both countries. Cocoa industry resources and industries related to the cocoa industry has not been optimized to support the development of the cocoa industry. This article uses the input-output analysis to determine the relationship cocoa industry and other industries as well as providing improvements to enhance the value chain through the sectors supporting the cocoa industry. Input-output analysis is a method to determine the amount of inter-industry flows in relation to the level of production in each sector. There are some industries that play a role in supporting the national cocoa industry, but there has not been a good value chain to increase cocoa production. Value chain improvement in this study aims to analyze the value added between entities to optimize the role of sectors supporting the cocoa industry in accordance with their contribution to the quadrant position input-output analysis. Index Terms—cocoa bean, cocoa industry, input-output analysis, value chain I. INTRODUCTION s one of the country in the world with abundant natural resources and opportunities, Indonesia certainly has the potential to create a good industrial system by developing a variety of existing industrial potentials and connecting the production chain from upstream to downstream industries. One of the industry that is potential to be developed in Indonesia is the cocoa processing industry. Indonesia is one of the world’s largest producers of cocoa beans and is currently the third largest cocoa beans producer in the world, after Ivory Coast and Ghana [1]. Production share of cocoa bean in 2010 of Ivory Coast and Ghana made up 74.9% of the world’s total cocoa bean production, while Indonesia made up 12.2% of the world’s total cocoa bean production. Most of the exported products are cocoa beans Arinda Soraya Putri is with the Laboratory of Business and Logistic System, Industrial Engineering Department, Faculty of Engineering, Sebelas Maret University, Indonesia (e-mail: [email protected]). Wahyudi Sutopo is with Industrial Engineering and Techno Economy Research Group, Industrial Engineering Department, Faculty of Engineering, Sebelas Maret University, Indonesia (corresponding author, email: [email protected]). Socia Prihawantara is with the Agency of Assessment and Application of Technology (BPPT), Indonesia (e-mail: [email protected]). Ryan Corinus Dato Matheos is with the Agency of Assessment and Application of Technology (BPPT), Indonesia (e-mail: [email protected]). and still a bit derivative products are exported in the form of cocoa butter, cocoa powder, cocoa cake and cocoa liquor [2]. Although Indonesia has become one of the world’s leading cocoa producer, the country’s competitiveness in the cocoa industry is considerably low. Though the cocoa tree has great potential to be processed into derived products that have high added value. A wide variety of derivative products with the addition of value added can be seen on the following of the cocoa industry diagram. Figure 1. Cocoa Industry Diagram Cocoa bean production in Indonesia is very abundant, but a few years fluctuated increase and decrease due to various factors, such as weather conditions, soil conditions, and the age old plants [3]. However cocoa industry in Indonesia has not been able to utilize the initial output of cocoa products to input cocoa processing industry which has high added value. Cocoa is one of the leading commodity owned by Indonesia. Nationally, cocoa produces the third largest foreign exchange earner after oil palm and rubber. Net of cocoa in 2009 reached USD 1.38 billion (derived from cocoa beans and processed). Processed cocoa beans produce Value Chain Improvement for Cocoa Industry in Indonesia by Input-Output Analysis Arinda Soraya Putri, Wahyudi Sutopo, Socia Prihawantara, Ryan Corinus Dato Matheos A Proceedings of the International MultiConference of Engineers and Computer Scientists 2015 Vol II, IMECS 2015, March 18 - 20, 2015, Hong Kong ISBN: 978-988-19253-9-8 ISSN: 2078-0958 (Print); ISSN: 2078-0966 (Online) IMECS 2015
Transcript of Value Chain Improvement for Cocoa Industry in Indonesia … · global cocoa-chocolate value chain...

Abstract- Cocoa is one of the leading commodity in
Indonesia. Indonesian cocoa industry is the third largest
producer of cocoa beans in the world after Ivory Coast and
Ghana. Nevertheless, the Indonesian cocoa industry has low
competitiveness compared to both countries. Cocoa industry
resources and industries related to the cocoa industry has not
been optimized to support the development of the cocoa
industry. This article uses the input-output analysis to
determine the relationship cocoa industry and other industries
as well as providing improvements to enhance the value chain
through the sectors supporting the cocoa industry. Input-output
analysis is a method to determine the amount of inter-industry
flows in relation to the level of production in each sector. There
are some industries that play a role in supporting the national
cocoa industry, but there has not been a good value chain to
increase cocoa production. Value chain improvement in this
study aims to analyze the value added between entities to
optimize the role of sectors supporting the cocoa industry in
accordance with their contribution to the quadrant position
input-output analysis.
Index Terms—cocoa bean, cocoa industry, input-output
analysis, value chain
I. INTRODUCTION
s one of the country in the world with abundant natural
resources and opportunities, Indonesia certainly has the
potential to create a good industrial system by developing a
variety of existing industrial potentials and connecting the
production chain from upstream to downstream industries.
One of the industry that is potential to be developed in
Indonesia is the cocoa processing industry.
Indonesia is one of the world’s largest producers of cocoa
beans and is currently the third largest cocoa beans producer
in the world, after Ivory Coast and Ghana [1]. Production
share of cocoa bean in 2010 of Ivory Coast and Ghana made
up 74.9% of the world’s total cocoa bean production, while
Indonesia made up 12.2% of the world’s total cocoa bean
production. Most of the exported products are cocoa beans
Arinda Soraya Putri is with the Laboratory of Business and Logistic
System, Industrial Engineering Department, Faculty of Engineering,
Sebelas Maret University, Indonesia (e-mail: [email protected]).
Wahyudi Sutopo is with Industrial Engineering and Techno Economy
Research Group, Industrial Engineering Department, Faculty of
Engineering, Sebelas Maret University, Indonesia (corresponding author,
email: [email protected]).
Socia Prihawantara is with the Agency of Assessment and Application
of Technology (BPPT), Indonesia (e-mail: [email protected]).
Ryan Corinus Dato Matheos is with the Agency of Assessment and
Application of Technology (BPPT), Indonesia (e-mail:
and still a bit derivative products are exported in the form of
cocoa butter, cocoa powder, cocoa cake and cocoa liquor
[2]. Although Indonesia has become one of the world’s
leading cocoa producer, the country’s competitiveness in the
cocoa industry is considerably low.
Though the cocoa tree has great potential to be processed
into derived products that have high added value. A wide
variety of derivative products with the addition of value
added can be seen on the following of the cocoa industry
diagram.
Figure 1. Cocoa Industry Diagram
Cocoa bean production in Indonesia is very abundant, but
a few years fluctuated increase and decrease due to various
factors, such as weather conditions, soil conditions, and the
age old plants [3]. However cocoa industry in Indonesia has
not been able to utilize the initial output of cocoa products to
input cocoa processing industry which has high added value.
Cocoa is one of the leading commodity owned by
Indonesia. Nationally, cocoa produces the third largest
foreign exchange earner after oil palm and rubber. Net of
cocoa in 2009 reached USD 1.38 billion (derived from
cocoa beans and processed). Processed cocoa beans produce
Value Chain Improvement for Cocoa Industry in
Indonesia by Input-Output Analysis
Arinda Soraya Putri, Wahyudi Sutopo, Socia Prihawantara, Ryan Corinus Dato Matheos
A
Proceedings of the International MultiConference of Engineers and Computer Scientists 2015 Vol II, IMECS 2015, March 18 - 20, 2015, Hong Kong
ISBN: 978-988-19253-9-8 ISSN: 2078-0958 (Print); ISSN: 2078-0966 (Online)
IMECS 2015
cocoa butter (cocoa butter) and cocoa powder (cocoa
powder) that is needed by the people of the world, especially
in America and Europe, where demand for cocoa reached
2.5 million tons per year. Indonesia targets in 2025 is
capable of producing 2.5 million tons of cocoa beans with an
export value of USD 6.25 billion [4].
According to data from ICCO (International Cocoa
Organization) world cocoa demand continues to grow
around 2-4 percent per year, even in the last 5 years to grow
5 percent per year (3.5 million tons/year). China and India
with a large population into the market potential of
Indonesian cocoa.
The hypothesis of the study is the relationship between the
entities in the Indonesian cocoa industry is still so low that
less relevant sectors to support the development of the
national cocoa industry. In addition, value added among
entities is still low. Indonesian cocoa products are exported
in the form of cocoa beans reached 80%, while the rest is
processed in the country. Indonesia also imported cocoa in
the form of cocoa beans, cocoa powder, cocoa liquor, cacao
cake, and cocoa butter [2]. There has been no research on
the cocoa industry with input-output analysis, whereas the
input-output analysis can be used to enhance the economic
competitiveness of a country or region. Therefore, the input-
output analysis (I/O analysis) is needed to identify the
competitiveness of Indonesian cocoa industry.
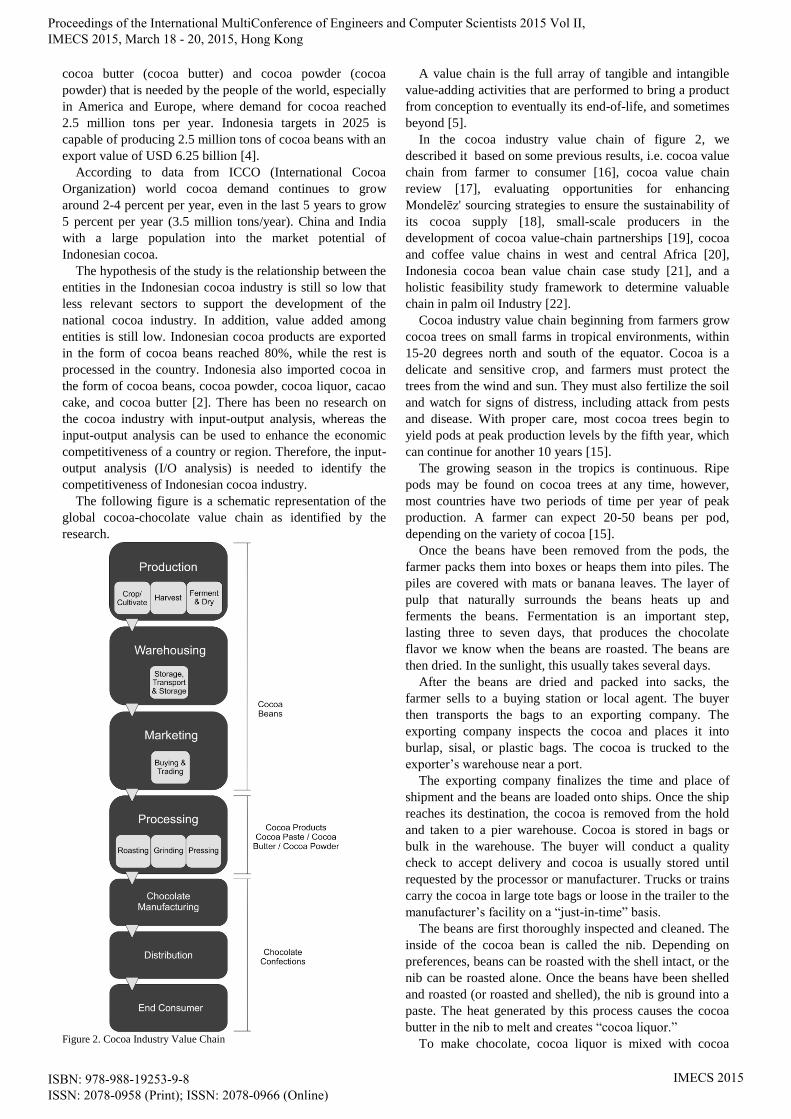
The following figure is a schematic representation of the
global cocoa-chocolate value chain as identified by the
research.
Figure 2. Cocoa Industry Value Chain
A value chain is the full array of tangible and intangible
value-adding activities that are performed to bring a product
from conception to eventually its end-of-life, and sometimes
beyond [5].
In the cocoa industry value chain of figure 2, we
described it based on some previous results, i.e. cocoa value
chain from farmer to consumer [16], cocoa value chain
review [17], evaluating opportunities for enhancing
Mondelēz' sourcing strategies to ensure the sustainability of
its cocoa supply [18], small-scale producers in the
development of cocoa value-chain partnerships [19], cocoa
and coffee value chains in west and central Africa [20],
Indonesia cocoa bean value chain case study [21], and a
holistic feasibility study framework to determine valuable
chain in palm oil Industry [22].
Cocoa industry value chain beginning from farmers grow
cocoa trees on small farms in tropical environments, within
15-20 degrees north and south of the equator. Cocoa is a
delicate and sensitive crop, and farmers must protect the
trees from the wind and sun. They must also fertilize the soil
and watch for signs of distress, including attack from pests
and disease. With proper care, most cocoa trees begin to
yield pods at peak production levels by the fifth year, which
can continue for another 10 years [15].
The growing season in the tropics is continuous. Ripe
pods may be found on cocoa trees at any time, however,
most countries have two periods of time per year of peak
production. A farmer can expect 20-50 beans per pod,
depending on the variety of cocoa [15].
Once the beans have been removed from the pods, the
farmer packs them into boxes or heaps them into piles. The
piles are covered with mats or banana leaves. The layer of
pulp that naturally surrounds the beans heats up and
ferments the beans. Fermentation is an important step,
lasting three to seven days, that produces the chocolate
flavor we know when the beans are roasted. The beans are
then dried. In the sunlight, this usually takes several days.
After the beans are dried and packed into sacks, the
farmer sells to a buying station or local agent. The buyer
then transports the bags to an exporting company. The
exporting company inspects the cocoa and places it into
burlap, sisal, or plastic bags. The cocoa is trucked to the
exporter’s warehouse near a port.
The exporting company finalizes the time and place of
shipment and the beans are loaded onto ships. Once the ship
reaches its destination, the cocoa is removed from the hold
and taken to a pier warehouse. Cocoa is stored in bags or
bulk in the warehouse. The buyer will conduct a quality
check to accept delivery and cocoa is usually stored until
requested by the processor or manufacturer. Trucks or trains
carry the cocoa in large tote bags or loose in the trailer to the
manufacturer’s facility on a “just-in-time” basis.
The beans are first thoroughly inspected and cleaned. The
inside of the cocoa bean is called the nib. Depending on
preferences, beans can be roasted with the shell intact, or the
nib can be roasted alone. Once the beans have been shelled
and roasted (or roasted and shelled), the nib is ground into a
paste. The heat generated by this process causes the cocoa
butter in the nib to melt and creates “cocoa liquor.”
To make chocolate, cocoa liquor is mixed with cocoa
Proceedings of the International MultiConference of Engineers and Computer Scientists 2015 Vol II, IMECS 2015, March 18 - 20, 2015, Hong Kong
ISBN: 978-988-19253-9-8 ISSN: 2078-0958 (Print); ISSN: 2078-0966 (Online)
IMECS 2015
butter, sugar and in some cases, milk. The mixture is then
placed into conches—large agitators that stir and smooth the
mixture under heat. As a rule, the longer chocolate is
conched, the smoother it will be. Conching may last for a
few hours to three full days, or even longer. After conching,
the liquid chocolate may be shipped in tanks or tempered
and poured into moulds for sale in blocks to confectioners,
dairies, or bakers.
The cocoa, chocolate, and confectionery industry employ
hundreds of thousands of people around the world and is a
key user of other agricultural commodities such as sugar,
dairy products, nuts, and fruits.
II. LITERATURE REVIEW
There are many studies related to cocoa production are
constantly being developed, for examples biodiversity
conservation in cocoa production landscapes [6], the major
constraints of cocoa production [7], improvement of cocoa
production on small farms [8], restructuring processes in the
cocoa sectors of the major producer countries [9], and
environmental impacts of cocoa production and processing
[10]. Research conducted in many countries in the world's
largest cocoa producer. Most aim to improve the
productivity of cocoa plantations.
However, few studies discussing the cocoa industry
competitiveness. There are supply chain to enhance the
competitiveness [11], the competitiveness of cocoa
production systems [12], and the impact of structural
adjustment and adoption of technology on competitiveness
[13]. Research on the competitiveness of Indonesian cocoa
industry is needed to boost the national economy.
Research with an input-output analysis tool is still lacking
in agriculture, especially cocoa.
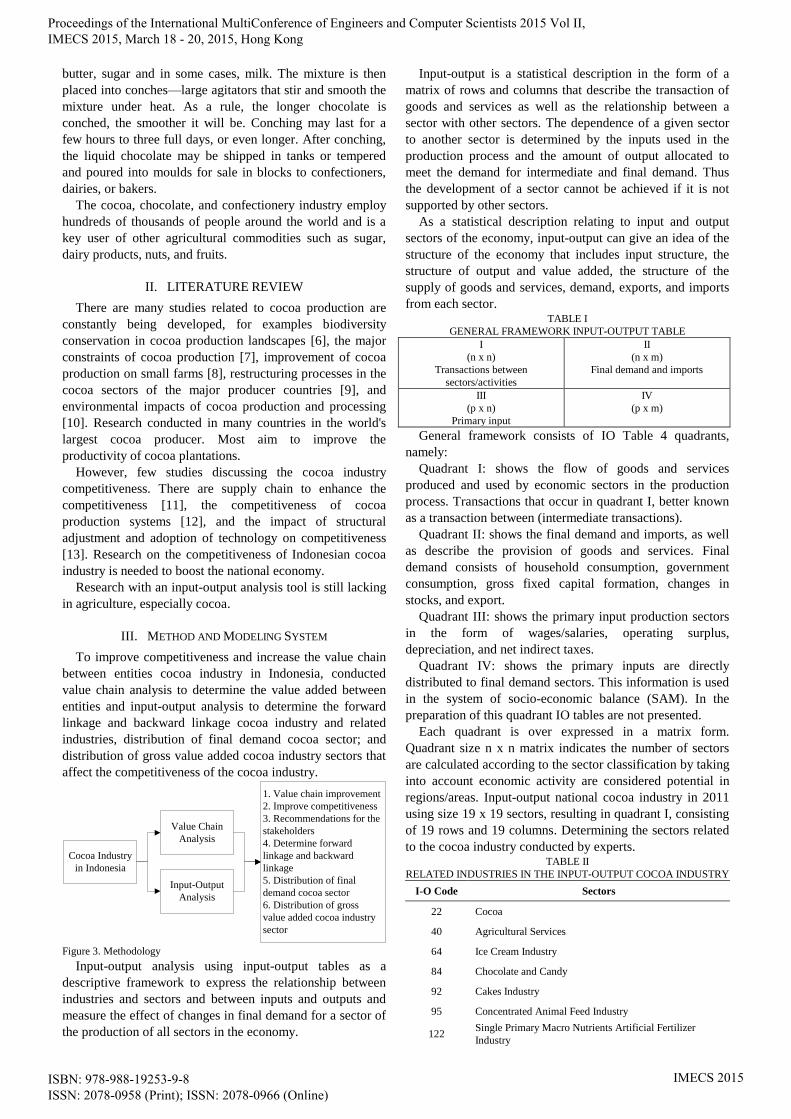
III. METHOD AND MODELING SYSTEM
To improve competitiveness and increase the value chain
between entities cocoa industry in Indonesia, conducted
value chain analysis to determine the value added between
entities and input-output analysis to determine the forward
linkage and backward linkage cocoa industry and related
industries, distribution of final demand cocoa sector; and
distribution of gross value added cocoa industry sectors that
affect the competitiveness of the cocoa industry.
Cocoa Industry
in Indonesia
Value Chain
Analysis
Input-Output
Analysis
1. Value chain improvement
2. Improve competitiveness
3. Recommendations for the
stakeholders
4. Determine forward
linkage and backward
linkage
5. Distribution of final
demand cocoa sector
6. Distribution of gross
value added cocoa industry
sector
Figure 3. Methodology
Input-output analysis using input-output tables as a
descriptive framework to express the relationship between
industries and sectors and between inputs and outputs and
measure the effect of changes in final demand for a sector of
the production of all sectors in the economy.
Input-output is a statistical description in the form of a
matrix of rows and columns that describe the transaction of
goods and services as well as the relationship between a
sector with other sectors. The dependence of a given sector
to another sector is determined by the inputs used in the
production process and the amount of output allocated to
meet the demand for intermediate and final demand. Thus
the development of a sector cannot be achieved if it is not
supported by other sectors.
As a statistical description relating to input and output
sectors of the economy, input-output can give an idea of the
structure of the economy that includes input structure, the
structure of output and value added, the structure of the
supply of goods and services, demand, exports, and imports
from each sector. TABLE I
GENERAL FRAMEWORK INPUT-OUTPUT TABLE
I
(n x n)
Transactions between
sectors/activities
II
(n x m)
Final demand and imports
III
(p x n)
Primary input
IV
(p x m)
General framework consists of IO Table 4 quadrants,
namely:
Quadrant I: shows the flow of goods and services
produced and used by economic sectors in the production
process. Transactions that occur in quadrant I, better known
as a transaction between (intermediate transactions).
Quadrant II: shows the final demand and imports, as well
as describe the provision of goods and services. Final
demand consists of household consumption, government
consumption, gross fixed capital formation, changes in
stocks, and export.
Quadrant III: shows the primary input production sectors
in the form of wages/salaries, operating surplus,
depreciation, and net indirect taxes.
Quadrant IV: shows the primary inputs are directly
distributed to final demand sectors. This information is used
in the system of socio-economic balance (SAM). In the
preparation of this quadrant IO tables are not presented.
Each quadrant is over expressed in a matrix form.
Quadrant size n x n matrix indicates the number of sectors
are calculated according to the sector classification by taking
into account economic activity are considered potential in
regions/areas. Input-output national cocoa industry in 2011
using size 19 x 19 sectors, resulting in quadrant I, consisting
of 19 rows and 19 columns. Determining the sectors related
to the cocoa industry conducted by experts. TABLE II
RELATED INDUSTRIES IN THE INPUT-OUTPUT COCOA INDUSTRY
I-O Code Sectors
22 Cocoa
40 Agricultural Services
64 Ice Cream Industry
84 Chocolate and Candy
92 Cakes Industry
95 Concentrated Animal Feed Industry
122 Single Primary Macro Nutrients Artificial Fertilizer
Industry
Proceedings of the International MultiConference of Engineers and Computer Scientists 2015 Vol II, IMECS 2015, March 18 - 20, 2015, Hong Kong
ISBN: 978-988-19253-9-8 ISSN: 2078-0958 (Print); ISSN: 2078-0966 (Online)
IMECS 2015
129 Pesticide
133 Pharmaceutical Industry
198 Agricultural Infrastructure
199 Roads, Bridges and Ports
229 Other Trade Services
230 Restaurant Services
231 Hospitality Services
233 Road Transport Services
257 Bank
258 Other Financial Institutions
271 Research and Development of Technology and
Engineering Science (Private)
278 Research and Development of Technology and
Engineering Science (Government)
IV. RESULT AND ANALYSIS
Based on figure 2 and table 2, can be related to the
industry classification to the cocoa industry in every stage of
the value chain cocoa industry. In the stage production that
includes crop/cultivate, harvest, ferment and dry, related
industries are cocoa, agricultural services, concentrated
animal feed industry, single primary macro nutrients
artificial fertilizer industry, pesticide, and agricultural
infrastructure. At stage of warehousing (which includes
storage, transport and storage), related industries are roads,
bridges and ports, and road transport services. At the stage
of marketing (which includes buying and trading) and
distribution, related industries are roads, bridges and ports
and other trade services, road transport services. Research
and development of technology and engineering science
(private and government) to act on the stage of production,
processing, and chocolate manufacturing. At the stage of
chocolate manufacturing and the customer, industry involved
is ice cream industry, chocolate and candy, cakes industry,
pharmaceutical industry, restaurant services, and hospitality
services. Banks and other financial institutions relating to all
stages of the value chain of cocoa industry.
Degree of sensitivity index is a quantity that describes the
impact that occurs on the output of a sector as a result of
changes in final demand in each sector of the economy that
performed the analysis. Because of this magnitude to explain
the formation of the output in a sector that is affected by the
final demand of each sector of the economy, then this
measure is useful to see how the forward (forward linkage)
between sectors of the economy [14]. TABLE III
DEGREE OF SENSITIVITY INDEX COCOA INDUSTRY AND
RELATED SECTORS OF COCOA
I-O
Code Sectors
Degree of
Sensitivity Index
22 Cocoa 0,283
40 Agricultural Services 2,042
64 Ice Cream Industry 0,282
84 Chocolate and Candy 0,290
92 Cakes Industry 0,115
95 Concentrated Animal Feed Industry 1,915
122 Single Primary Macro Nutrients
Artificial Fertilizer Industry 1,825
129 Pesticide 1,623
133 Pharmaceutical Industry 1,458
198 Agricultural Infrastructure 0,105
199 Roads, Bridges and Ports 0,132
229 Other Trade Services 1,010
230 Restaurant Services 0,498
231 Hospitality Services 0,753
233 Road Transport Services 1,054
257 Bank 1,403
258 Other Financial Institutions 1,873
271
Research and Development of
Technology and Engineering Science
(Private)
1,688
278
Research and Development of
Technology and Engineering Science
(Government)
0,100
If the calculated average value of the value of the degree
of sensitivity index in table III, then the value will be an
average of 0.98. From table III it can be seen that the value
of the degree of sensitivity index of the cocoa industry sector
is under the average of 0.98. In this case, it is known that
cocoa industry sector is not a domestic-oriented industries
because it has a degree of sensitivity index values below the
average. That is, the cocoa industry sector is more to sell its
output to meet the needs of final demand (e.g. cocoa beans
are available in the country directly exported abroad without
any further processing to obtain value-added). Thus it can be
said that the cocoa industry sector has a weak forward
linkages to other sectors in the national economy.
Power of dispersion index is a quantity that indicates the
impact that occurs on the output of a sector as a result of
changes in final demand of a sector of the economy of the
entire output of the economic sector in a region or country.
This index is a measure of the spread is to look backward
linkages economic sectors in a region or country [14]. TABLE IV
POWER OF DISPERSION INDEX COCOA INDUSTRY AND
RELATED SECTORS OF COCOA
I-O
Code Sectors
Power of
Dispersion Index
22 Cocoa 0,420
40 Agricultural Services 0,449
64 Ice Cream Industry 1,556
84 Chocolate and Candy 1,324
92 Cakes Industry 1,618
95 Concentrated Animal Feed Industry 1,603
122 Single Primary Macro Nutrients
Artificial Fertilizer Industry 0,893
129 Pesticide 1,271
133 Pharmaceutical Industry 1,423
198 Agricultural Infrastructure 1,293
199 Roads, Bridges and Ports 1,292
229 Other Trade Services 0,803
230 Restaurant Services 1,351
231 Hospitality Services 0,927
233 Road Transport Services 1,270
257 Bank 0,830
Proceedings of the International MultiConference of Engineers and Computer Scientists 2015 Vol II, IMECS 2015, March 18 - 20, 2015, Hong Kong
ISBN: 978-988-19253-9-8 ISSN: 2078-0958 (Print); ISSN: 2078-0966 (Online)
IMECS 2015
258 Other Financial Institutions 0,828
271
Research and Development of
Technology and Engineering Science
(Private)
0,948
278
Research and Development of
Technology and Engineering Science
(Government)
1,233
If the calculated average value of the power of dispersion
index in table IV, it will obtain an average value of 1.13.
From table IV it can be seen that the cocoa industry sector is
not a sector of the domestic industry based on the input side
because it has an power of dispersion index is less than one
or less than the average value of the scatter index. That is,
the cocoa industry sector is less use of intermediate inputs
from domestic production. In the other words, the cocoa
industry sector more use imported inputs (e.g. high-tech
machines for processing cocoa imported from abroad
because some processing machines are not fully produced in
the country). So, it can be said that the cocoa industry sector
has a weak backward linkage to other sectors in the national
economy.
In the case of forward linkage, it is known that the cocoa
industry sector is not a domestic-oriented industries because
more sells its output in the form of exports abroad. This is
indicated by the degree of sensitivity index value smaller
than the average value of the degree of sensitivity index.
Thus, it can be said that the cocoa industry sector has a weak
forward linkages to other sectors in the economy.
In the case of backward linkages, it is known that the
cocoa industry sector is not a domestic input-based industrial
sector because it has an average value of the power of
dispersion index is smaller than the average value of the
power of dispersion index. Thus, it can be said that the
cocoa industry sector has a value of weak backward linkages
to other sectors in the economy.
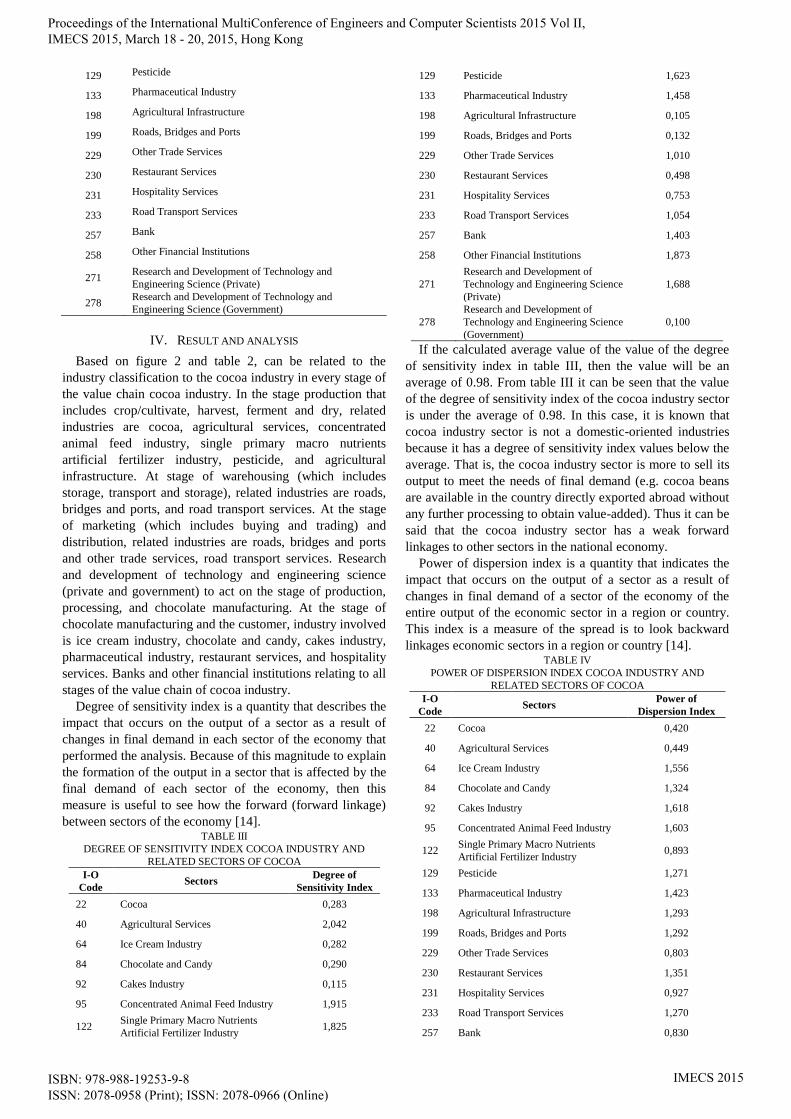
Figure 4. Inter-Sector Linkage Diagram and Related Cocoa Industry
Based on the data processing input-output table is
obtained distribution related industries cocoa. Chart linkages
between sectors of the economy showing the position of
each sector of the economy associated with the degree of
sensitivity index and the power of dispersion index. The
usefulness of this chart is to find a strong and/or weak
linkages between sectors of the economy so that it can be
done the preparation of an economic development strategy
for a region or country.
To see the position of the cocoa industry sector position in
relation to other industrial sectors, use the chart/diagram 4
quadrants linkages between sectors are processed from the
power of dispersion index and the degree of sensitivity index
[14]. Based on the picture can be seen that the cocoa
industry sector is in Quadrant IV. That is, the cocoa industry
sector is underdeveloped industrial sector in Indonesia
because it has power of dispersion index and degree of
sensitivity index indices are weak. In other words, the
Indonesian cocoa industry sector is underdeveloped
industrial sector, both in terms of the input and output side.
Agricultural services sector plays an important role for
human resources contained, it can act as a liaison/
intermediary between the upstream and downstream sides of
cocoa, i.e. between farmers and producers/manufacturers of
technology that can improve the quality of cocoa cultivation
required by the industry. For example, the use of agricultural
extension workers can make the delivery of information
about the use of fertilizer produced SRF national research
institutions to farmers will be able to increase the use of
fertilizers SRF and desired quality of the cocoa beans
processing industry. Sector banks and financial services
sector plays an important role because these sectors can
create schemes/financing mechanisms and financing legal
and appropriate, in accordance with the needs of farmers and
the industry in the development process and the cultivation
of the national cocoa industry.
Sector research and development of science and
engineering technology (both private and government) also
plays an important role in the creation of innovative
products needed cocoa sector. To be able to produce
innovative products needed interaction/cooperation between
actors in the field of continuous research and development
of science and engineering technology, namely academia,
government research institutes and private research
institutions in an innovation system framework. Thus, it is
expected to occur and continuous cooperation is able to
improve the competitiveness of the national cocoa industry
through the creation of innovative products needed national
cocoa industry.
In terms of output, it is known that the output of the cocoa
sector more distributed to meet the needs of final demand.
Things that need to be explored further is wherever the
cocoa output distributed to meet final demand and on what
components of the cocoa sector more distributed. For it is
worth exploring further IO table used in the distribution of
final demand cocoa sector. The following table shows the
value distribution of the final demand cocoa sector. TABLE V
DISTRIBUTION OF FINAL DEMAND COCOA SECTOR
Distribution of Final Demand Cocoa Sector Value Distribution
Consumption 0.027
Government Spending 0
Gross Fixed Capital Formation 0.003
Change in Stock 0.0116
Export 0.819
The small size of the output distribution for the cocoa
industry sector gross fixed capital formation that is the one
of the causes of the weakness of the cocoa industry sectors
to improve competitiveness.
In conjunction with the output distribution, the next
question is where the primary input distribution or
Proceedings of the International MultiConference of Engineers and Computer Scientists 2015 Vol II, IMECS 2015, March 18 - 20, 2015, Hong Kong
ISBN: 978-988-19253-9-8 ISSN: 2078-0958 (Print); ISSN: 2078-0966 (Online)
IMECS 2015
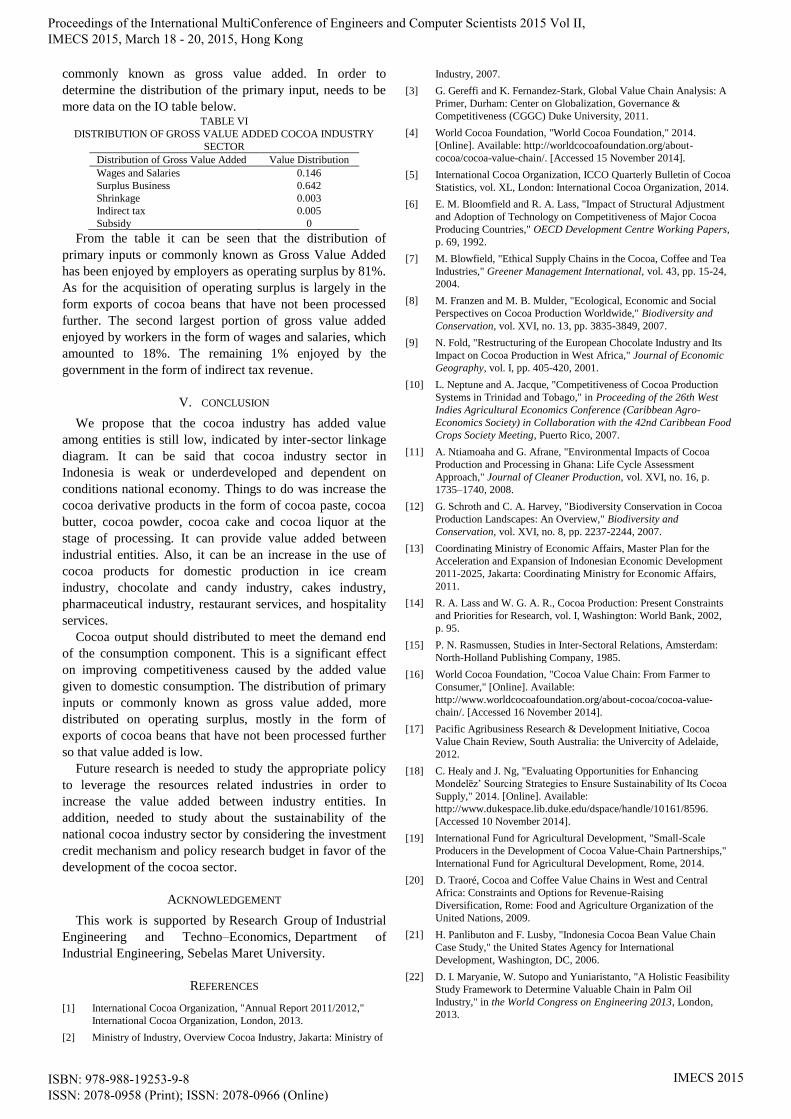
commonly known as gross value added. In order to
determine the distribution of the primary input, needs to be
more data on the IO table below. TABLE VI
DISTRIBUTION OF GROSS VALUE ADDED COCOA INDUSTRY
SECTOR
Distribution of Gross Value Added Value Distribution
Wages and Salaries 0.146
Surplus Business 0.642
Shrinkage 0.003
Indirect tax 0.005
Subsidy 0
From the table it can be seen that the distribution of
primary inputs or commonly known as Gross Value Added
has been enjoyed by employers as operating surplus by 81%.
As for the acquisition of operating surplus is largely in the
form exports of cocoa beans that have not been processed
further. The second largest portion of gross value added
enjoyed by workers in the form of wages and salaries, which
amounted to 18%. The remaining 1% enjoyed by the
government in the form of indirect tax revenue.
V. CONCLUSION
We propose that the cocoa industry has added value
among entities is still low, indicated by inter-sector linkage
diagram. It can be said that cocoa industry sector in
Indonesia is weak or underdeveloped and dependent on
conditions national economy. Things to do was increase the
cocoa derivative products in the form of cocoa paste, cocoa
butter, cocoa powder, cocoa cake and cocoa liquor at the
stage of processing. It can provide value added between
industrial entities. Also, it can be an increase in the use of
cocoa products for domestic production in ice cream
industry, chocolate and candy industry, cakes industry,
pharmaceutical industry, restaurant services, and hospitality
services.
Cocoa output should distributed to meet the demand end
of the consumption component. This is a significant effect
on improving competitiveness caused by the added value
given to domestic consumption. The distribution of primary
inputs or commonly known as gross value added, more
distributed on operating surplus, mostly in the form of
exports of cocoa beans that have not been processed further
so that value added is low.
Future research is needed to study the appropriate policy
to leverage the resources related industries in order to
increase the value added between industry entities. In
addition, needed to study about the sustainability of the
national cocoa industry sector by considering the investment
credit mechanism and policy research budget in favor of the
development of the cocoa sector.
ACKNOWLEDGEMENT
This work is supported by Research Group of Industrial
Engineering and Techno–Economics, Department of
Industrial Engineering, Sebelas Maret University.
REFERENCES
[1] International Cocoa Organization, "Annual Report 2011/2012,"
International Cocoa Organization, London, 2013.
[2] Ministry of Industry, Overview Cocoa Industry, Jakarta: Ministry of
Industry, 2007.
[3] G. Gereffi and K. Fernandez-Stark, Global Value Chain Analysis: A
Primer, Durham: Center on Globalization, Governance &
Competitiveness (CGGC) Duke University, 2011.
[4] World Cocoa Foundation, "World Cocoa Foundation," 2014.
[Online]. Available: http://worldcocoafoundation.org/about-
cocoa/cocoa-value-chain/. [Accessed 15 November 2014].
[5] International Cocoa Organization, ICCO Quarterly Bulletin of Cocoa
Statistics, vol. XL, London: International Cocoa Organization, 2014.
[6] E. M. Bloomfield and R. A. Lass, "Impact of Structural Adjustment
and Adoption of Technology on Competitiveness of Major Cocoa
Producing Countries," OECD Development Centre Working Papers,
p. 69, 1992.
[7] M. Blowfield, "Ethical Supply Chains in the Cocoa, Coffee and Tea
Industries," Greener Management International, vol. 43, pp. 15-24,
2004.
[8] M. Franzen and M. B. Mulder, "Ecological, Economic and Social
Perspectives on Cocoa Production Worldwide," Biodiversity and
Conservation, vol. XVI, no. 13, pp. 3835-3849, 2007.
[9] N. Fold, "Restructuring of the European Chocolate Industry and Its
Impact on Cocoa Production in West Africa," Journal of Economic
Geography, vol. I, pp. 405-420, 2001.
[10] L. Neptune and A. Jacque, "Competitiveness of Cocoa Production
Systems in Trinidad and Tobago," in Proceeding of the 26th West
Indies Agricultural Economics Conference (Caribbean Agro-
Economics Society) in Collaboration with the 42nd Caribbean Food
Crops Society Meeting, Puerto Rico, 2007.
[11] A. Ntiamoaha and G. Afrane, "Environmental Impacts of Cocoa
Production and Processing in Ghana: Life Cycle Assessment
Approach," Journal of Cleaner Production, vol. XVI, no. 16, p.
1735–1740, 2008.
[12] G. Schroth and C. A. Harvey, "Biodiversity Conservation in Cocoa
Production Landscapes: An Overview," Biodiversity and
Conservation, vol. XVI, no. 8, pp. 2237-2244, 2007.
[13] Coordinating Ministry of Economic Affairs, Master Plan for the
Acceleration and Expansion of Indonesian Economic Development
2011-2025, Jakarta: Coordinating Ministry for Economic Affairs,
2011.
[14] R. A. Lass and W. G. A. R., Cocoa Production: Present Constraints
and Priorities for Research, vol. I, Washington: World Bank, 2002,
p. 95.
[15] P. N. Rasmussen, Studies in Inter-Sectoral Relations, Amsterdam:
North-Holland Publishing Company, 1985.
[16] World Cocoa Foundation, "Cocoa Value Chain: From Farmer to
Consumer," [Online]. Available:
http://www.worldcocoafoundation.org/about-cocoa/cocoa-value-
chain/. [Accessed 16 November 2014].
[17] Pacific Agribusiness Research & Development Initiative, Cocoa
Value Chain Review, South Australia: the Univercity of Adelaide,
2012.
[18] C. Healy and J. Ng, "Evaluating Opportunities for Enhancing
Mondelēz’ Sourcing Strategies to Ensure Sustainability of Its Cocoa
Supply," 2014. [Online]. Available:
http://www.dukespace.lib.duke.edu/dspace/handle/10161/8596.
[Accessed 10 November 2014].
[19] International Fund for Agricultural Development, "Small-Scale
Producers in the Development of Cocoa Value-Chain Partnerships,"
International Fund for Agricultural Development, Rome, 2014.
[20] D. Traoré, Cocoa and Coffee Value Chains in West and Central
Africa: Constraints and Options for Revenue-Raising
Diversification, Rome: Food and Agriculture Organization of the
United Nations, 2009.
[21] H. Panlibuton and F. Lusby, "Indonesia Cocoa Bean Value Chain
Case Study," the United States Agency for International
Development, Washington, DC, 2006.
[22] D. I. Maryanie, W. Sutopo and Yuniaristanto, "A Holistic Feasibility
Study Framework to Determine Valuable Chain in Palm Oil
Industry," in the World Congress on Engineering 2013, London,
2013.
Proceedings of the International MultiConference of Engineers and Computer Scientists 2015 Vol II, IMECS 2015, March 18 - 20, 2015, Hong Kong
ISBN: 978-988-19253-9-8 ISSN: 2078-0958 (Print); ISSN: 2078-0966 (Online)
IMECS 2015


![A Value Chain Assessment of the Coca Sector in Indonesia2007... · Coca Sector in Indonesia January 2007 ... [Pusat Penelitian Kopi dan Kakao Indonesia ] ICVC Indonesian Cocoa Value](https://static.fdocuments.us/doc/165x107/5caa600488c993e6068b6db8/a-value-chain-assessment-of-the-coca-sector-in-indonesia-2007-coca-sector.jpg)