Value Analysis and Waste Identification Welcome to the session! Learn more about Value Analysis and...
36
Value Analysis and Waste Identification • Welcome to the session! Learn more about Value Analysis and Waste Identification at: www.freeleansite.com
-
Upload
robert-lamb -
Category
Documents
-
view
215 -
download
1
Transcript of Value Analysis and Waste Identification Welcome to the session! Learn more about Value Analysis and...

Value Analysis and Waste Identification
• Welcome to the session!
Learn more about Value Analysis and Waste Identification at: www.freeleansite.com

2
Let’s take a minute for
SAFETY:
Who has a safety
concern/ contact or tip?
Let’s band together forSafety, Quality, Speed of Execution

Objectives
• Review the concepts of value-added and non value-added work
• Learn to recognize non value-added work and complete a Time Value Analysis (TVA) Chart
• Understand the 8 common types of process waste• Learn the steps of a waste walk using memory jogger
‘DOWNTIME’
3
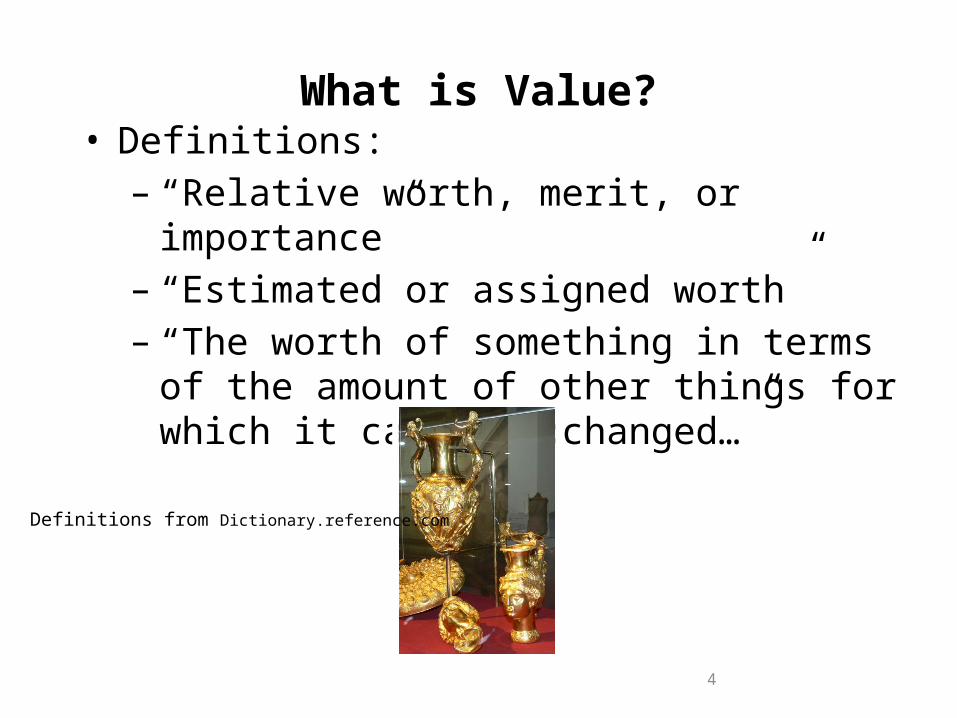
What is Value?• Definitions:
– “Relative worth, merit, or importance” – “Estimated or assigned worth”– “The worth of something in terms of the amount
of other things for which it can be exchanged…”
Definitions from Dictionary.reference.com
4

5
What is Value Add?• Two types:
– Customer Value Add• Physical transformation of product or service• Customer is willing to pay for the transformation• Done right the first time
– Business Value Add• Anything that the business benefits from:
– Required by law, regulation, agency policy– Reduces risk, etc

Basic Definition of Work Activities• Value Added
– Physical transformation of product or service• Adds a form or feature, moves it closer to final form
– Customer willing to pay• Source/ enabler of “competitive advantage” (better,
faster, cheaper)– Done right first time
6

7
Basic Definition of Work Activities• Business Value Added
– Required by Federal, State, or Local Law or Regulation– Reduces risk (product, operational, financial, safety, etc)– Critical to avoiding process breakdown– Required by agency policy or specific contract requirement
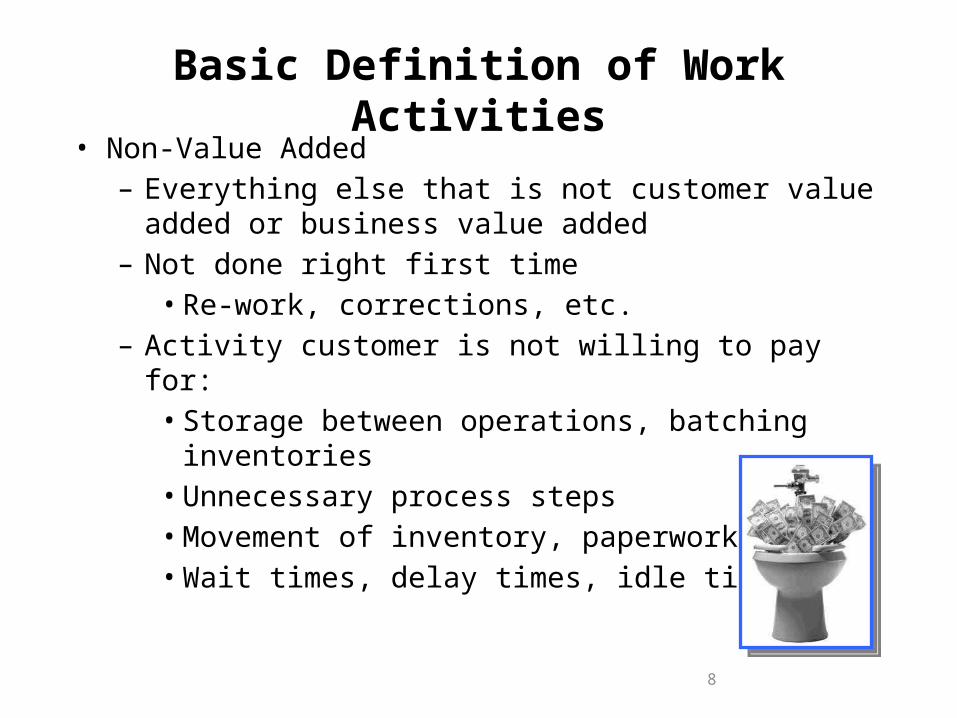
Basic Definition of Work Activities• Non-Value Added
– Everything else that is not customer value added or business value added
– Not done right first time• Re-work, corrections, etc.
– Activity customer is not willing to pay for:• Storage between operations, batching inventories• Unnecessary process steps• Movement of inventory, paperwork, etc.• Wait times, delay times, idle times
8

Evaluating Work Content
“VALUE”: Customer knows it when they see it• Adding a component to a
product• Testing a product• Inspecting a part
• Pulling parts from a warehouse
• Sweeping a production area
• Welding
• Greeting a customer • Taking an order• Doing a credit check• Filing a customer order• Filling a customer order• Vacuuming a reception
area• Watering plants
Value Added or Non-Value Added?
9

Non-Value Added
Unnecessary
ContinueDoing
Challenge Assumptions
EliminateImmediately
Work to ReduceChallenge Need
Value Added
Necessary
Necessary or Unnecessary?
10

11
Our Goal and Focus• Customer Value Added
– Improve the efficiency and effectiveness of the task– Improve the flow of value to the customer– Monitor to assure we are meeting customers’ evolving
requirements• Business Value Added
– Verification that it is truly required– Reduction/ elimination of requirements– Redesign tasks to meet requirements more efficiently
• Non-value Added– Total and complete elimination, forever

• Is the work to make this design Value Added??
In the Eyes of the Customer
• If you are sitting down in a resort locale for a casual cup of coffee?
• If you are four deep in a line waiting for a “cup of Joe” on your way to work?
12

Provide Wi-Fi
Pour in cup
Sell CD’s
Take order
Pre-heat vat
(Set-Up equip)
Grind coffee
Write name on
cup
Brewcoffee
Add cream /
sugar
Are there NVA steps here?
VA Work May Have NVA
Waste likes to disguise itself as value-added work
13
Time Value Analysis Chart (TVA)

The Good News:• If you can save it in the
behind the scenes processes, you get to keep it!
The Bad News:• You don’t get credit for a
good process• A customer pays based on
the finished product or service
Customers Do Not Care About Your Process
14

15
Value Analysis Steps
1. Using your process map, identify Lead times for process steps– Work Time– Wait Time– Transportation Time
2. Classify each step as Customer VA, Business VA (non value added, but necessary), or pure NVA
3. Calculate the VA to NVA Ratio– Total Customer and Business Value Added Steps– Divide by Total Time and Get % Value Add– Communicate using a Time Value Analysis (TVA) Chart

16
Priority• After analyzing root
causes, the next step is to consider improvement
• We will work to identify and remove waste and wasteful practices:1. Eliminate Non Value
Add work content2. Reduce Business Value
Add work content3. Improve Customer
Value Add
(“TCE” = Total Customer Experience)
17
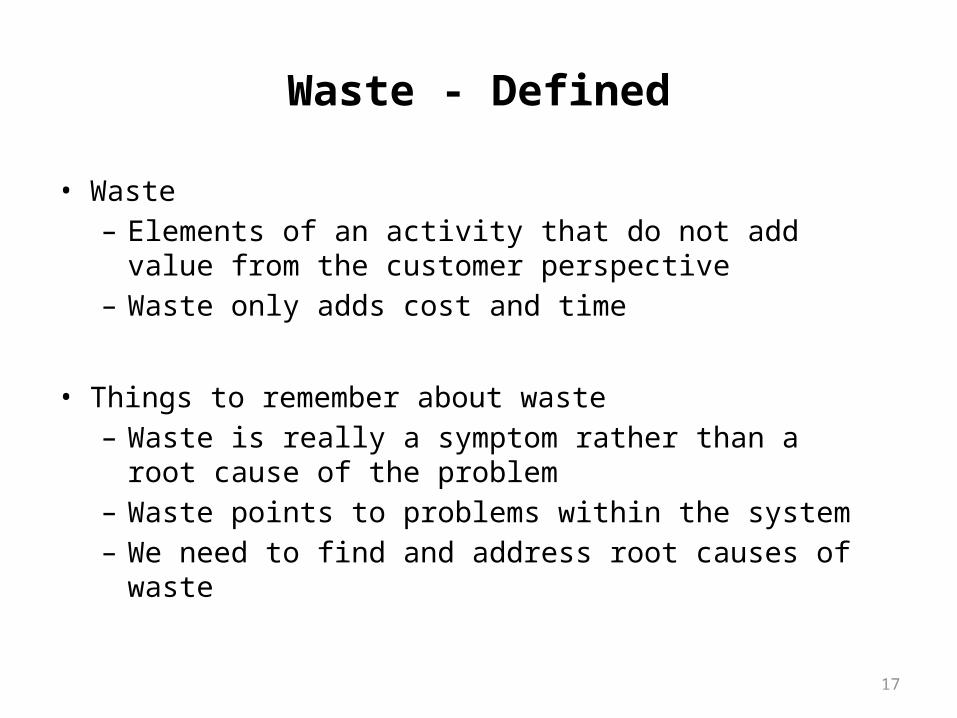
Waste - Defined
• Waste– Elements of an activity that do not add value from the
customer perspective– Waste only adds cost and time
• Things to remember about waste– Waste is really a symptom rather than a root cause of
the problem– Waste points to problems within the system– We need to find and address root causes of waste

Types of Waste in Many Processes
Non-Value Added Work Content (most common)Use this Memory jogger: ‘DOWNTIME’
• Defects• Over-production• Waiting• Non-utilized resources
• Transportation• Inventory• Motion• Excess processing
18

Defects
• Information, products, parts, or services that require rework, correction or are scrapped
• Correcting an error or repairing a defect in materials or parts adds unnecessary costs because of additional equipment and labor expenses
19

Overproduction
• Make more earlier or faster than the next operation needs it
• Doing this requires more raw product inventory than necessary, over uses machines and people and requires more storage area
20

Waiting
• Waiting for machines, materials, information, or people, sign-off’s etc.
• Idle time between operations or events
21

Non-utilized Resources
• Not utilizing people’s experience, skills, knowledge, creativity, or ideas
• Excess equipment or technology
• Unused contribution• Underutilized ambition and drive
22

Transportation
• Moving material, information, or equipment around
• Transportation is a required action that does not directly contribute value to the product
• It’s vital to avoid unless it is supplying items when and where they are needed (i.e. just-in-time delivery)
23

Inventory
• Any supply in excess of one-piece flow
• Excess inventory masks unacceptable change-over times, excessive downtime, operator inefficiency and a lack of organizational sense of urgency to produce
24

Motion
• Any movement of people that does not contribute added value to the product
• Excessive walking, twisting, bending, reaching, or motion to complete a task
25

Excess Processing
• Effort that adds no value to the product or service from the customer standpoint
• Processing work that has no connection to advancing the line or improving the quality of the product or service
26

Causes of Waste
Motion
Waiting time
Overproduction
Excess Processing
Defects
Inspection
Transportation
Problems / Causes / ExamplesIncorrect layouts causing excessive walkingTime chasing information and dataLacking ergonomic workspace designLack of proximity of machines, off-line resources
Equipment downtimeWaiting workers, machines, materials, approvalsLong set-ups and lead times
Large batches, raw material stocksHigh WIP, finished goods stocksMaking for the sake of it/ Ignoring customerExcessive paperwork trails, checklistsLong cycle times- process, itselfUnnecessary steps/ handoffsRe-entering data, making extra copiesMissing or incomplete informationLost paperwork or documentsWork not meeting standards
Approvals of approvalsHigh number of verification stepsReliance- Mass inspection techniques
Unnecessary material movementExtra handling / Moving data between computer systems
Types
Peop
lePr
oces
sPr
oduc
t
27
(NOTE: Non-utilized resources can touch each of these)

Examples of Waste in Many Processes
• Layout (distance)• Insufficient maintenance• Poor work methods• Ineffective scheduling• Incorrect final point of rest• Counting inventory
• Multiple Signoffs• No back-up/cross-training• Excessive Mobile Equipment• Lack of workplace organization• Too many outside trucks in the yard
The longer waste occurs, the more accepting you become!
28

29
Waste in the Form of Rework
• Each defect must be detected, repaired, and placed back into the process (costs time and money)
Waste Causes A ‘Hidden Factory’Increased Cost & Lost Capacity
20 Mins
Record data necessary for billing
30 Mins
Enter data into systems
10 Mins
30 Mins4223 Mins
Validate Documentation
Send Documentation to Biller
Create Invoice
5 Mins
Validate Invoice
2 Mins
Submit to customer
Yield After Inspection or Test
Waste
ReworkHidden Factory
NOTOK
OperationInputs Inspect First Time Yield
OK
Time, cost, people
90% Customer
Satisfaction
30
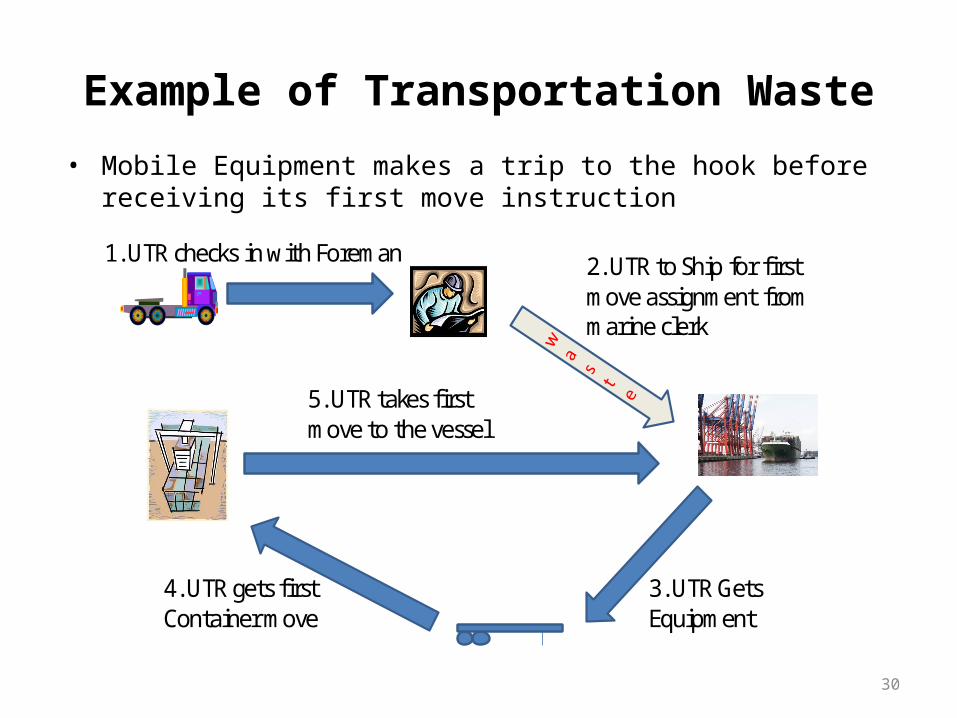
Example of Transportation Waste
• Mobile Equipment makes a trip to the hook before receiving its first move instruction
2. UTR to Ship for first move assignment from marine clerk
3. UTR Gets Equipment
4. UTR gets firstContainer move
5. UTR takes first move to the vessel
1. UTR checks in with Foreman

31
The Challenge: Find and Eliminate Waste
• Objective Ask each team to take one of the typical wastes and findat least one example in their site and eliminate it
• Conduct Waste Walk– A planned visit to where the work is being performed
to observe what’s happening and to note the waste– Include waste elimination execution in status reports– Require waste elimination every month / every day– Reinforce / reward for found and eliminated waste

32
Waste Walk Steps
1) Huddle with your team members– Describe the purpose– Describe the various forms of wastes and examples– Pass out copies of the Waste I.D. and Recording Form
current-state map and identified problems– Assign areas to walk within your team
• Usually better to have a pair of people for each assignment
2) As a group, walk the whole flow (value stream) depicted on your map to confirm the areas of the individual/pair assignments

33
Steps (continued)
3) Explain to the people in the area of observation what you are doing
4) Share the map and waste examples and describe the objectives of the observation activity
5) Move to areas for individual assignments, and study the areas for 30 - 45 minutes
6) As you see work that appears to be waste, jot down the example you see on the form
7) Return to the team and discuss what you have seen

34
8) As a team, match the wastes you see to problems previously identified in the current-state map
9) Put the results of the waste walk next to the current-state map being shared in the area and use the examples to continue to socialize the current state and the system-level problems that frustrate the people and process
NOTE: If other significant problems are identified during the walk, place them on the map also
Steps (continued)
35
Review
• Explore definition of value added and non-value added work and Time Value Analysis (TVA) chart
• Recall the 8 common wastes within processes– Understand the concept, step(s), and form for a Waste
Walk– Utilize the memory jogger: ‘DOWNTIME’
• Watch the DVD - “An Introduction to Continuous Improvement & Lean Principles” by GBMP

Value Analysis and Waste Identification
• Thank you for attending the session!
Learn more about Value Analysis and Waste Identification at: www.freeleansite.com